 May Sann Aung1,2† Hiroshi Masuda2† Takanori Kobayashi2 Hiromi Nakanishi1 Takashi Yamakawa1 Naoko K. Nishizawa1,2*
- 1Laboratory of Plant Biotechnology, Department of Global Agricultural Sciences, Graduate School of Agricultural and Life Sciences, The University of Tokyo, Bunkyo-ku, Tokyo, Japan
- 2Laboratory of Plant Cell Technology, Research Institute for Bioresources and Biotechnology, Ishikawa Prefectural University, Nonoichi, Ishikawa, Japan
Iron (Fe) deficiency elevates human mortality rates, especially in developing countries. In Myanmar, the prevalence of Fe-deficient anemia in children and pregnant women are 75 and 71%, respectively. Myanmar people have one of the highest per capita rice consumption rates globally. Consequently, production of Fe-biofortified rice would likely contribute to solving the Fe-deficiency problem in this human population. To produce Fe-biofortified Myanmar rice by transgenic methods, we first analyzed callus induction and regeneration efficiencies in 15 varieties that are presently popular because of their high-yields or high-qualities. Callus formation and regeneration efficiency in each variety was strongly influenced by types of culture media containing a range of 2,4-dichlorophenoxyacetic acid concentrations. The Paw San Yin variety, which has a high-Fe content in polished seeds, performed well in callus induction and regeneration trials. Thus, we transformed this variety using a gene expression cassette that enhanced Fe transport within rice plants through overexpression of the nicotianamine synthase gene HvNAS1, Fe flow to the endosperm through the Fe(II)-nicotianamine transporter gene OsYSL2, and Fe accumulation in endosperm by the Fe storage protein gene SoyferH2. A line with a transgene insertion was successfully obtained. Enhanced expressions of the introduced genes OsYSL2, HvNAS1, and SoyferH2 occurred in immature T2 seeds. The transformants accumulated 3.4-fold higher Fe concentrations, and also 1.3-fold higher zinc concentrations in T2 polished seeds compared to levels in non-transgenic rice. This Fe-biofortified rice has the potential to reduce Fe-deficiency anemia in millions of Myanmar people without changing food habits and without introducing additional costs.
Introduction
Iron (Fe) deficiency is one of the most prevalent micronutrient deficiency problems in humans. According to a World Health Organization (WHO) report (WHO, 2002), Fe deficiency affects an estimated two billion people, causing almost one million deaths annually worldwide. Among risk factors for human health, Fe deficiency ranks sixth in developing countries, where it contributes to high rates of mortality (WHO, 2002). Myanmar is one of the countries with critical levels of Fe-deficiency anemia (IDA) (WHO, 2008). The prevalence of IDA is ∼75% in Myanmar children under 5 years of age, ∼26% in adolescent schoolgirls, ∼45% in non-pregnant women, and ∼71% in pregnant women (MOH, 2003). It shows many population groups are strongly impacted by IDA. Young children and women in pregnancy or breast feeding are most frequently and severely affected (WHO, 2002). IDA causes disruptions in brain development in young children and deaths of women in pregnancy and childbirth. It threatens national productivities and lowers the intellectual capacity of human populations (UNICEF and The Micronutrient Initiative, 2004a) in addition to causing coma and death in severe cases of anemia (WHO, 2002). Mineral deficiency lowers the annual productivity of the Myanmar adult work force by an estimated 0.7% of GDP (UNICEF and The Micronutrient Initiative, 2004b).
The main cause of anemia is inadequate dietary Fe intake. Applications exist that address Fe deficiency, including Fe supplementation, Fe fortification, and dietary diversification. Because of financial, cultural, regional, or religious restrictions, these applications are not always successful (Graham et al., 2001; Bouis et al., 2003; Lyons et al., 2003; Timmer, 2003), but a complementary approach to mineral malnutrition termed “biofortification” is proving to be an efficient solution for developing countries (Graham et al., 2001; Bouis, 2003). Biofortification is a process that increases bioavailable concentrations of essential elements in edible portions of crop plants through agronomic intervention or genetic selection (White and Broadley, 2005). Arguments exist to indicate that once mineral-dense lines have been developed, little additional cost will be incurred in incorporating them into ongoing breeding programs. Therefore, biofortification is sustainable and cost-effective, and reaches remote rural populations (Bouis et al., 2003; Timmer, 2003; Welch and Graham, 2005).
Rice is the main staple food crop in Myanmar. The country was the sixth largest rice producer in the world in 2010 (IRRI, 2013). The national rice growing area occupies 8 million ha, representing 63% of the total cultivated landscape (MOAI, 2010); annual rice production is ∼32 million t year−1 (MOAI, 2010). Myanmar people are among the highest rice-consumers globally. Average per capita rice consumption is ∼578 g day−1 (Kennedy et al., 2002; Maclean et al., 2002), and represents 75% of the caloric intake. Thus, Fe biofortification of Myanmar rice varieties would provide an effective solution to Fe deficiency in the country.
Among available processes that might be used for Fe biofortification, transgenic methodology has potential to be the fastest and most efficient. There were some reports about improved Fe content in rice grain through transgenic procedures. In a first approach, Goto et al. (1999) generated a japonica cv. Kitaake transgenic rice with twofold increase in Fe concentration in endosperm (edible part of the rice grain that includes the polished seed) by expressing the soybean ferritin gene (SoyferH1) in the endosperm under the control of the rice glutelin gene (OsGluB1) promoter. Furthermore, through this endosperm-specific expression of ferritin, twofold increase in Fe in a transgenic japonica cv. Taipei 309 (Lucca et al., 2001), 3.7-fold increase in indica cv. IR68144 (Vasconcelos et al., 2003) and 2.1-fold increase in indica cv. Pusa Sugandhi II (Paul et al., 2012) were reported. In a second approach, overexpression of the nicotianamine synthase gene (NAS) increased Fe concentration in polished rice seeds threefold under greenhouse conditions using japonica cv. Tsukinohikari (TK) (Masuda et al., 2009a), japonica cv. Dongjin (Lee et al., 2009), and japonica cv. Nipponbare (Johnson et al., 2011). In a third approach, Fe concentration in polished rice seeds of TK was increased up to threefold through enhancement of Fe(II)-nicotianamine transporter gene (OsYSL2) expression under the control of the rice sucrose transporter gene (OsSUT1) promoter, leading to elevated expression in the panicle and immature seeds during seed maturation (Ishimaru et al., 2010). Moreover, by combining these three approaches, Masuda et al. (2012) generated “Fer-NAS-YSL2” rice, in which the Fe content was elevated sixfold in greenhouse-grown T2 polished seeds and fourfold in paddy field-grown T3 polished seeds of TK. Accordingly, we applied this combined approach to the currently cultivated and consumed Myanmar rice variety.
Hiei et al. (1994) reported the first efficient Agrobacterium-mediated transformation of japonica rice. Using this published procedure, an Agrobacterium-mediated transformation methodology with minor modifications has been developed for many rice varieties other than japonica, indica, and tropical japonica, including indica cv. Kasalath (model indica rice; Saika and Toki, 2010), indica cv. RD6 (Thai commercial rice cultivar; Pipatpanukul et al., 2004), indica cv. IR64 (IRRI, a well-known high-yield rice cultivar; Rajesh et al., 2008), and indica cv. MR219 (Malaysian rice; Sivakumar et al., 2010). Many studies have also demonstrated that transformation efficiencies depend on culture responses of individual varieties (Pipatpanukul et al., 2004; Nishimura et al., 2007; Summart et al., 2008). Therefore, optimization of tissue culture conditions is essential for varieties that regenerate with difficulty (Hiei et al., 1994, 1997). Relevant reports have been published on callus induction and regeneration in indica cv. BR-8 (Bangladesh indica rice; Amin et al., 2004) and indica cv. KDML 105 (Thai aromatic rice; Summart et al., 2008). Nevertheless, no current reports have described transformations of Myanmar rice varieties, and thus no relevant information exists to aid in the selection of Myanmar varieties that would be suitable for this procedure. Similarly, no information exists to guide selection of callus induction and regeneration media that are efficient for regeneration. Accordingly, production of high-Fe Myanmar rice through Fe-biofortification methodology requires analyses of callus induction and regeneration ability in each variety before performing actual rice transformation.
In the present study, we first tested callus induction and regeneration efficiency in 15 popular Myanmar rice varieties. The Paw San Yin variety produced calli readily and had moderate regeneration efficiency when we used the modified methods of Hiei et al. (1994). The main purpose of our research is to produce Fe biofortified Myanmar rice using the currently cultivated and consumed rice variety and come closer to practical application for the needs. Therefore, we used Paw San Yin variety, which is a famous high-quality variety, and presently cultivated and consumed rice variety in Myanmar. We produced high-Fe Myanmar rice through introduction of the Fer-NAS-YSL2 vector, which includes multiple genes for enhancing Fe transportation and accumulation in rice plants (Masuda et al., 2012). The procedures produced elevated gene expression in T2 immature seeds, and the Fe concentration in T2 polished seeds increased 3.4-fold in comparison with the non-transgenic line.
Materials and Methods
Plant Materials
We used seeds of 15 Myanmar high-yield or high-quality rice cultivars, which were provided by the Myanmar Rice Research Center (MRRC), Hmawbi, Myanmar, for the regeneration trials. These were Kyaw Zay Ya (V1), Ayar Min (V2), Paw San Yin (V3), Shwe War Htun (V4), Sin Thwe Lat (V5), Yezin Lone Thwe (V6), Thu Kha Yin (V7), Thee Htet Yin (V8), Sin Nwe Yin (V9), Yadana Toe (V10), Hmawbi 2 (V11), Hmawbi 3 (V12), Hmawbi 4 (V13), Hmawbi 5 (V14), and Hmawbi Kauk Nyin Hmwe (V15) (Table 1). Japonica rice cv. TK, a well-known variety for efficient rice transformation, was used as the control for callus induction and regeneration trails.
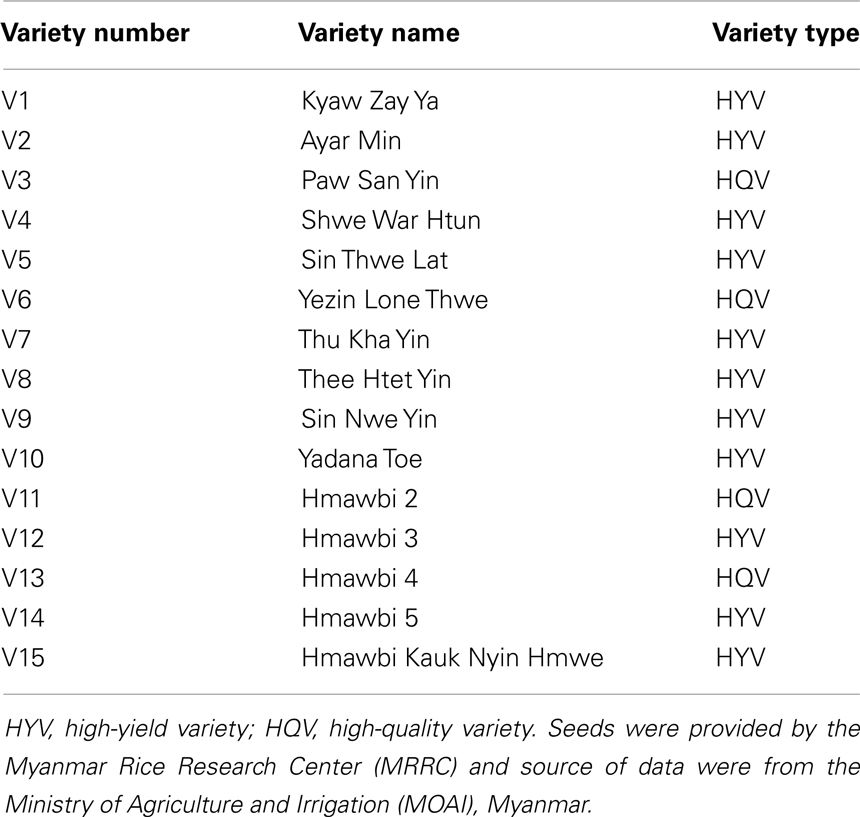
Table 1. Myanmar rice varieties used in callus induction and regeneration trials.
We used Myanmar rice tropical Japonica cv. Paw San Yin (V3) (Table 1; Figure S1 in Supplementary Material) for rice transformation and as the non-transgenic control. Seeds from MRRC were sown in a greenhouse and grown to maturity to provide fresh seeds for transgenic procedures.
Sterilization of Rice Seeds
Husks were removed from the seeds manually. The brown seeds were first surface-sterilized in 70% ethanol for 5 min and then rinsed thoroughly with distilled water (DW). Then, the seeds were washed in a 2.5% solution of sodium hypochlorite (NaClO; The Clorox Co., Oakland, CA, USA) containing 0.2% Tween 20 (Sigma-Aldrich, St. Louis, MO, USA) as a wetting agent for 30 min in a rotator. After surface sterilization, seeds were rinsed five times with sterile water and used for induction of calli.
Media Used for Callus Induction and Regeneration Test
We used N6D, N6D4, N6D6, 2N6, MSre, and MS media for callus induction and regeneration trials. Components of 2N6 and MS media were from Hiei et al. (1994). Components of N6D media were from Ishizaki and Kumashiro (2008). MSre (MS regeneration) media was modified from Toki (1997), and 2 mg l−1 of α-naphthaleneacetic acid and 1 mg l−1 of kinetin were applied as hormones for regeneration of plants in all regeneration trials and rice transformation. Components of N6D4 and N6D6 medium matched those in N6D except that 2,4-dichlorophenoxyacetic acid (2,4-D) concentrations were 4 and 6 mg l−1 instead of 2 mg l−1, respectively. Five media combinations tested through the developmental steps from callus induction to plant regeneration were coded as follows: N6D-N6D-MSre-MS, N6D-2N6-MSre-MS, 2N6-2N6-MSre-MS, N6D4-N6D4-MSre-MS, and N6D6-N6D6-MSre-MS. Thus, the code N6D-N6D-MSre-MS indicates the following sequence of media: (i) N6D medium used for callus induction; (ii) induced calli transferred to N6D medium for subsequent callus growth; (iii) calli transferred to MSre medium for regeneration; (iv) final transfer to MS medium for root and shoot growth.
Callus Induction Test
After surface sterilization, 15 seeds of each variety were transferred to various media, such as N6D, N6D4, N6D6, or 2N6, for callus induction and kept in darkness in a growth chamber at 28°C. After 28–36 days, about 30–40 calli that were growing well were transferred to new N6D, N6D4, N6D6, or 2N6 medium and cultured for 10–19 days for subsequent callus growth. During both callus induction and growth stages, we observed callus condition daily and photographed the specimens twice a week. We then assessed callus quantity (the amount of callus induction) and quality (callus yellowness, size, and hardness) for each variety on N6D, N6D4, N6D6, and 2N6 media to determine the best medium combination.
Plant Regeneration Test
After callus induction, we transferred all calli except those that were brownish onto MSre medium and cultured them for 11–32 days under constant light at 28°C in a growth chamber until green spots appeared; green spots indicated the germination of somatic embryos. Subsequently, all calli were transferred to MS medium and kept for 5–22 days under constant light conditions at 28°C in a growth chamber until plant length exceeded 3–5 cm. We then opened the culture dishes and added water, after which plants were acclimated for about 3 days in a growth chamber at 28°C with illumination. We counted the numbers of regenerated plants and also recorded the duration of time from callus induction to the appearance of green spots. The condition of each callus and regenerated plant was observed daily and photographed twice a week. Once the plant development stage had been reached, we calculated regeneration efficiency for each variety as follows: regeneration efficiency = total number of regenerated plants/number of callus-induced seeds
Transformation of the Paw San Yin Rice Variety
We used the Fer-NAS-YSL2 vector (Masuda et al., 2012) for rice transformation (Figure S2 in Supplementary Material). Agrobacterium tumefaciens (strain C58) was used to introduce the construct into Oryza sativa L. cv. Paw San Yin (V3) following the modified method outlined in Hiei et al. (1994) and Akiyama et al. (1997).
For Paw San Yin-Fer-NAS-YSL2 transformation, calli were induced for 29 days and preincubated for 8 days in N6D medium. We performed Agrobacterium-infection on 2N6-AS medium for 3 days following Hiei et al. (1994) with Agrobacterium optical density (OD) concentrations of 0.1 or 0.01. Calli were then treated with first, second, and third media selected by the hygromycin check test: N6D-CH10 (N6D medium containing 500 mg l−1 claforan; Sanofi K. K., Tokyo, Japan and 10 mg l−1 hygromycin B; Wako, Osaka, Japan) medium for 14 days, N6D-CH30 (N6D medium containing 500 mg l−1 claforan and 30 mg l−1 hygromycin B) medium for 14 days, and N6D-CH50 (N6D medium containing 500 mg l−1 claforan and 50 mg l−1 hygromycin) medium for 7 days at 28°C in darkness. High-quality calli were selected and transferred to MSre-CH50 (MSre medium containing 500 mg l−1 Claforan and 50 mg l−1 hygromycin B) medium and incubated for 48 days at 28°C under illumination. High-quality calli were transferred to MS-C medium (MS medium containing 500 mg l−1 claforan and no hygromycin B) and maintained until green spots and regenerated plants appeared after 15 days. Four regenerated plants were obtained and one independent Fer-NAS-YSL2 line of T0 transgenic specimens with all inserted genes was selected.
Detection of the Gene Insertion in Transgenic Lines
Leaves of T0 transgenic and non-transgenic lines were cut off with scissors and crushed in a Multi-beads Shocker (Yasui Kikai, Osaka, Japan). Subsequently, we prepared total DNA following Ikeda et al. (2001). We performed genomic PCR analysis to check for the inserted gene. Rice endogenous OsActin1 was detected as a positive control using OsActin1 forward primer (5′-ACA CCG GTG TCA TGG TCG G-3′) and OsActin1 reverse primer (5′-ACA CGG AGC TCG TTG TAG AA-3′). The OsGlb promoter–SoyferH2 cassette was detected using the OsGlb1 promoter forward primer (5′-CCG ATC GCC ATC ATC TCA TCA TCA G-3′) and SoyferH2 reverse primer (5′-GCT TCC ACC AAC ACC CTT AGA AAG-3′). The OsActin1 promoter–HvNAS1 cassette was detected using the OsActin1 promoter forward primer (5′-GGG TAG AAT TTG AAT CCC TCA GCA-3′) and HvNAS1 reverse primer (5′-CGA TCT TCT CGA TCA GAG CAG CGA-3′). HPT was detected using the HPT forward primer (5′-CGG CAT CTA CTC TAT TCC TTT GC-3′) and HPT reverse primer (5′-GTC TCC GAC CTG ATG CAG CTC-3′). NPTII was detected using the NPTII forward primer (5′-GAT GGA TTG CAC GCA GGT TCT C-3′) and NPTII reverse primer (5′-GCC AAC GCT ATG TCC TGA TAG C-3′). iGUS was detected using the iGUS forward primer (5′-CTG TGG AAT TGA TCA GCG TTG G-3′) and iGUS reverse primer (5′-CGC AAG TCC GCA TCT TCA TGA C-3′).
Greenhouse Cultivation
Paw San Yin T0 transgenic and T1 plants were cultivated in a mixture of 3 kg/pot of commercially supplied soil used in Japanese rice nurseries (Bonsolichigou; Sumitomo Chemicals, Tokyo, Japan) and 210 g/pot of vermiculite (Buiesu-Kakou Co., Ltd., Tokyo, Japan). The nutrient content of the bonsol soil were 1.8 g/pot of nitrogen (N), 4.8 g/pot of phosphate (P), and 2.6 g/pot of potassium (K). Slow-release fertilizer (LongTotal-70 and -140; JCAM AGRI. Co., Ltd., Tokyo, Japan) was applied at planting time and panicle initiation time. The nutrients included in the slow released fertilizers per one application time were as follows: N: 0.91 g/pot, P: 0.77 g/pot, K: 0.91 g/pot, Mn: 7 mg/pot, boron (B): 4.2 mg/pot, Fe: 14 mg/pot, Cu: 3.5 mg/pot, Zn: 1.05 mg/pot, magnesium (Mg): 140 mg/pot and molybdenum (Mo): 1.4 mg/pot. Plants were grown in a greenhouse at 30°C with 14 h day−1 of natural light, and at 25°C with 10 h day−1 of natural light. Specimens were grown in plant cultivation pots (size: 1/5000; Fujiwara-Seisakusho, Tokyo, Japan). One plant was transferred to each pot.
Quantitative Real-Time RT-PCR Analysis
Total RNA was extracted from immature T2 seeds (seeds at an early milky stage, 10 days after fertilization) harvested from each subline and NT line grown in a greenhouse. Seeds were crushed in a Multi-beads Shocker®. We subsequently extracted RNA using an RNeasy Plant Mini Kit (Qiagen KK, Tokyo, Japan). First-strand cDNA was synthesized using a ReverTra Ace kit (Toyobo, Osaka, Japan) with oligo-d(T)30. Real-time RT-PCR was performed using a StepOnePlusTM Real-Time PCR System (Applied Biosystems, Tokyo, Japan) with SYBR Premix Ex Taq II reagent (Takara, Shiga, Japan). The primers used were as follows: OsYSL2 forward (5′-GAG GGA CAA CGG TGT CAT TGC TGG T-3′) and OsYSL2 reverse (5′-TGC AGA AAA GCC CTC GAC GCC AAG A-3′) for OsYSL2 expression, HvNAS1 forward (5′-GGA CGT CGC CGA CCT CAC CCA G-3′) and HvNAS1 reverse (5′-CAG GGA CGC CCC CTC CAC C-3′) for HvNAS1 expression, and SoyferH2 forward (5′-GCT TTT ATC TCT CGC CCG TTG-3′) and SoyferH2 reverse (5′-CAT TGT GTG CAA TCG GAA CAG C-3′) for SoyferH2 expression. Transcript levels were normalized to the expression levels of alpha-Tubulin determined using the primers alpha-Tubulin forward (5′-TCT TCC ACC CTG AGC AGC TC-3′) and alpha-Tubulin reverse (5′-AAC CTT GGA GAC CAG TGC AG-3′). The sizes of the amplified fragments were confirmed by agarose gel electrophoresis.
Metal Concentration Analysis of Seeds
We harvested T1 and T2 seeds from the greenhouse and measured metal concentrations in brown seeds, polished seeds, and husks. We converted brown seeds to polished seeds using a Multi-Beads Shocker, as previously described by Masuda et al. (2009a) with modification for indica rice polishing. We transferred 20 seeds to a 2-ml plastic tube (Yasui Kikai, Osaka, Japan) and machine-shook them vigorously through four cycles of 2500 rpm for 300 s. We used three replicates of 10 well-polished seeds each for subsequent analyses. Each 10-seed replicate was dried overnight and weighed before digestion. Subsequently, we added 1 ml of 13 M HNO3 (Wako) and 1 ml of 8.8 M H2O2 (Wako) to each liner to digest the seeds inside. We set all the liners in a MARSS XPRESS digester (CEM Japan, Tokyo, Japan) and digested seeds at 220°C for 20 min. After digestion, samples were collected and made up to 5 ml volume with 0.1 mM HCl and filtered as previously described by Masuda et al. (2009a). Subsequently, we measured metal concentrations in digested seed samples using an inductively coupled plasma atomic emission spectrometer (ICPS-8100; Shimadzu, Kyoto, Japan) and calculated seed metal concentrations.
Results
Callus Induction and Growth at Standard 2,4-D Concentrations
Fifteen Myanmar rice varieties were included in the callus induction and regeneration trials. Calli were induced on both N6D and 2N6 media. Callus induction capacity differed greatly among the varieties (Figure S3 in Supplementary Material). Within varieties, culture conditions also influenced callus formation. In most varieties, callus induction and callus growth were better on N6D media than on 2N6 media (Figures S3 and S4 in Supplementary Material). Callus induction and formation of Paw San Yin (V3) (especially on N6D-N6D medium) was among the best in Myanmar varieties tested, with performance matching that of the japonica cultivar TK (Figure 1, Figures S3 and S4 in Supplementary Material). Callus initiation in the Paw San Yin variety began 8 days after germination (DAG) on all media, and callus proliferation increased after transfer to new medium, especially on N6D (Figures 1A,B).
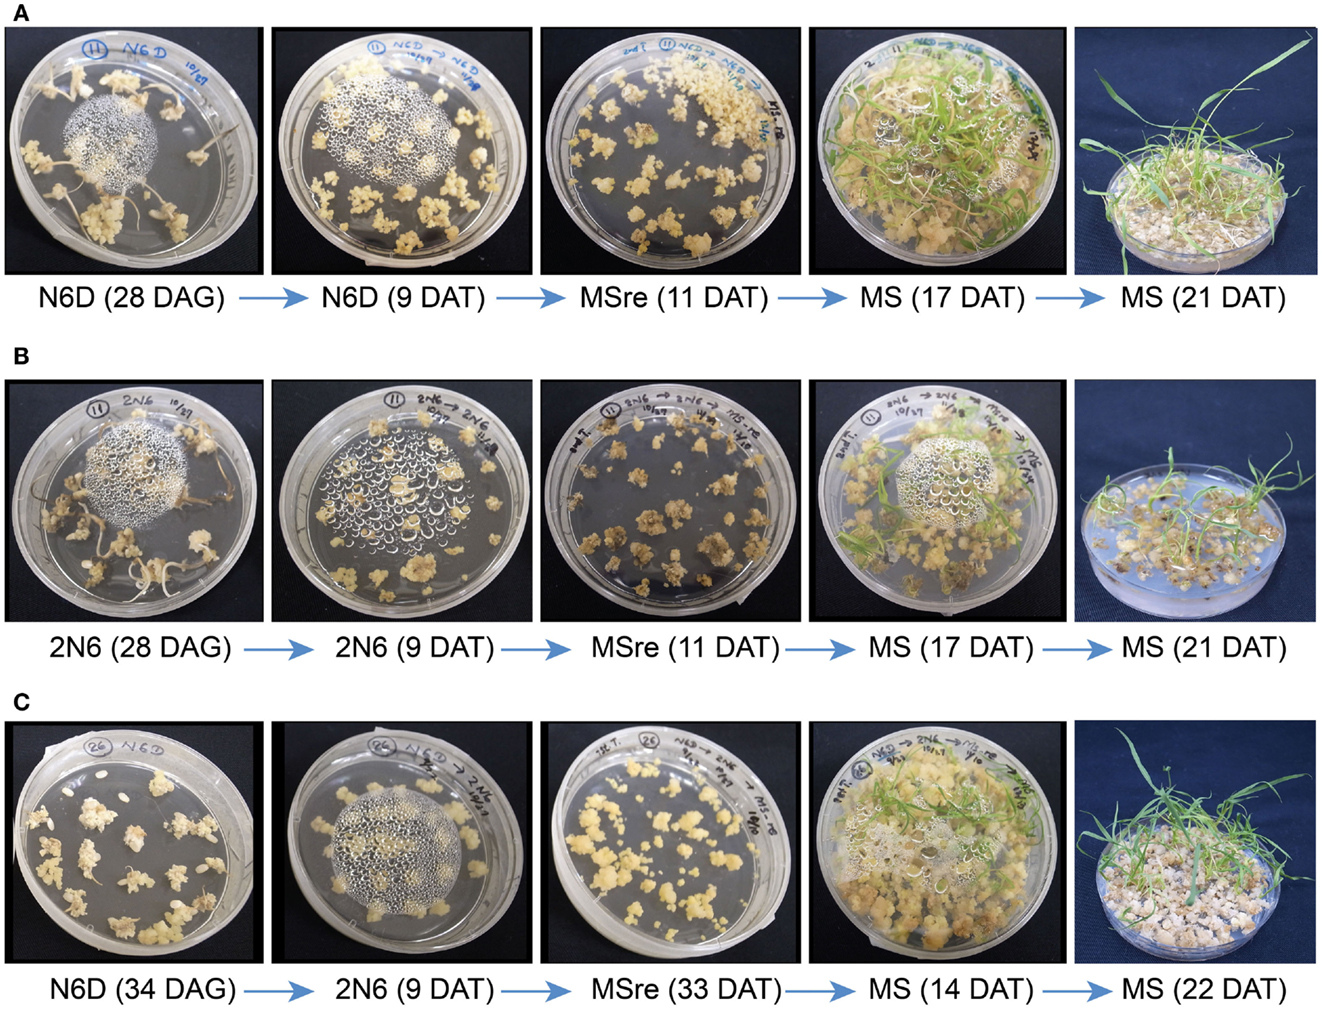
Figure 1. Callus induction and regeneration efficiency in rice varieties Paw San Yin (V3) and Tsukinohikari in different medium combinations. (A) Tissue culture of Paw San Yin (V3) in the N6D-N6D-MSre-MS medium combination. (B) Tissue culture of Paw San Yin (V3) in the 2N6-2N6-MSre-MS medium combination. (C) Tissue culture of Tsukinohikari in the N6D-2N6-MSre-MS medium combination. See “Media Used for Callus Induction and Regeneration Test” in the Section “Materials and Methods” for medium combination. DAG, days after germination; DAT, days after transferring. The numerals shown inside parentheses mean DAG or DAT when photograph was taken on each medium.
Regeneration Testing after Callus Induction at Standard 2,4-D Concentrations
We observed the regeneration efficiency of 15 Myanmar rice varieties in various medium combinations. For many varieties, including V2, V4, V6, V9, and V13, calli obtained by 2N6-2N6 treatment turned brown and died on MSre media 15–31 days after transferring (DAT), and no regenerated plants were obtained (Figures S5–S9 in Supplementary Material). Plants regenerated only on the N6D-N6D-MSre-MS medium combination. Regenerated plants of varieties V3 and V14 were obtained on both N6D-N6D-MSre-MS and 2N6-2N6-MSre-MS medium combinations (Figure 1, Figure S10 in Supplementary Material). Callus quantity and quality of the Paw San Yin high-quality variety (V3) were similar to those of the TK cultivar in both the callus induction and growth stages, though were somewhat inferior after transfer to MSre regeneration media (Figure 1). However, green spots appeared afterward, and callus proliferation increased considerably after transfer to MS medium. Like several other varieties, many more regenerated plants of V3 developed 21 DAT under the N6D-N6D-MSre-MS medium combination than under the 2N6-2N6-MSre-MS combination (Figure 1).
Effects of 2,4-D Concentrations on Callus Induction and Regeneration on N6D and 2N6 Media
Callus inductions of Myanmar rice varieties V1, V8, V10, and V11 were not adequate on either 2N6 or N6D medium (Figures S11A,B–S14A,B in Supplementary Material). 2,4-D concentration is an important callus induction factor in all rice varieties (Bajaj, 1991). Accordingly, we tested the effects of 2,4-D concentrations on callus induction and growth of selected varieties, aiming to improve callus induction and regeneration efficiency. We tested various 2,4-D concentrations, e.g., 4 and 6 mg l−1 in addition to the standard concentration of 2 mg l−1.
Some elevated 2,4-D concentrations in N6D media enhanced callus induction and growth, and raised the regeneration efficiency in V1 (N6D6-N6D6-MSre-MS), V8 (N6D4-N6D4-MSre-MS), V10 (N6D4-N6D4-MSre-MS), and V11 (N6D6-N6D6-MSre-MS) (Figures S11–S14 in Supplementary Material). V5 and V7 were also tested at 2,4-D concentrations of 4 and 6 mg l−1, but callus production was poor and no regenerated plants were produced (data not shown).
Identification of THE Best Medium Combination and Regeneration Efficiency
Best culture types in which regenerated plants were obtained for each variety, period kept in each medium from callus induction to acclimation, and numbers of regenerated plants are presented in Table S1 in Supplementary Material. During both callus induction and growth stages, we assessed callus quantity (degree of callus induction) and quality (callus yellowness, size, and hardness). Scores for diverse culture media within and among varieties were used to identify the best culture conditions. Among the 15 Myanmar rice varieties tested, Paw San Yin produced best calli and scored best in these assessments. Relationships between callus condition and the number of regenerated plants in the best medium for each variety are presented in Figure S15 in Supplementary Material.
After examining performance in five types of medium combination, we identified the best medium combination for each variety (Figure 2). Among the 15 Myanmar rice varieties tested, 13 varieties were able to regenerate (Figure 2; Table S1 in Supplementary Material). We calculated regeneration efficiency for each variety in the best medium among those tested (see Plant Regeneration Test in the Materials and Methods; Figure 3). Regeneration efficiency was very different among varieties. Most regenerated well and some exceeded rates of the cultivar TK. Yezin Lone Thwe (V6), Yadana Toe (V10), Hmawbi 4 (V13), and Hmawbi 5 (V14) regenerated poorly; Ayar Min (V2), Hmawbi 3 (V12), and Hmawbi Kauk Nyin Hmwe (V15) regenerated well. Paw San Yin (V3) had intermediate regeneration efficiency that was higher than TK.
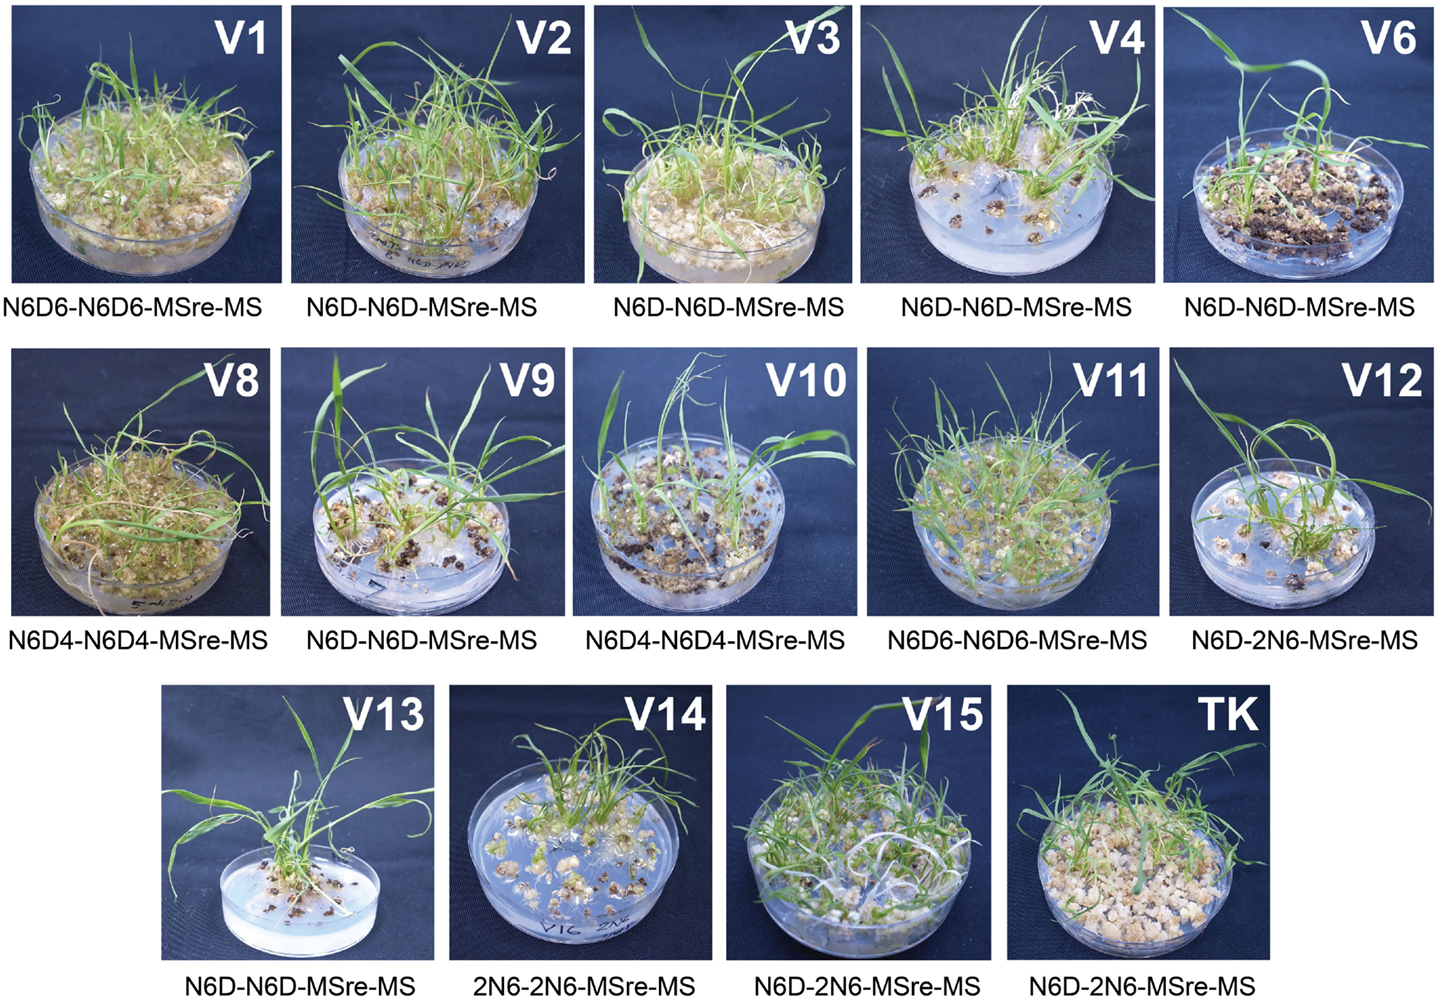
Figure 2. Identification of the best medium combination for each variety. V1–V15 shown on upper right part of each picture represent the variety numbers described in Table 1 and TK means Tsukinohikari. The media combination described under each picture showed the best media combination for each variety. Pictures of regenerated plants were taken at 3 days after acclimation. Pictures of V5 and V7 were not shown as regenerated plants were not obtained from these two varieties.
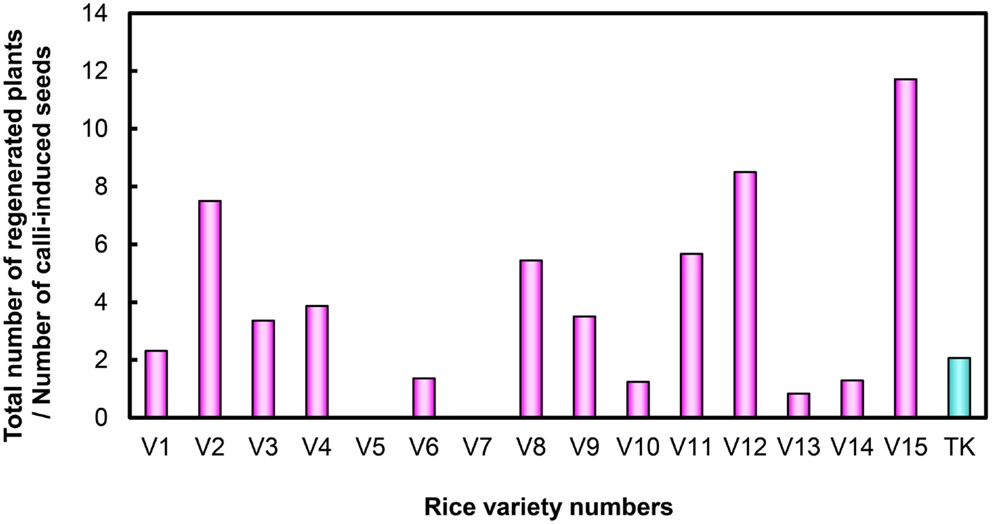
Figure 3. Regeneration efficiency of Myanmar rice varieties and the Tsukinohikari variety. V1–V15 under horizontal bar represent the rice variety numbers described in Table 1 and TK means Tsukinohikari. Numbers on vertical bars are quotients of total numbers of regenerated plants divided by numbers of callus-induced seeds, which represent regeneration efficiency.
We also recorded time to green spot appearance on regeneration media (MSre). All 13 regenerating Myanmar rice varieties produced green spots on calli sooner than cultivar TK (Figure 4). Green spots developed most quickly in Ayar Min (V2).
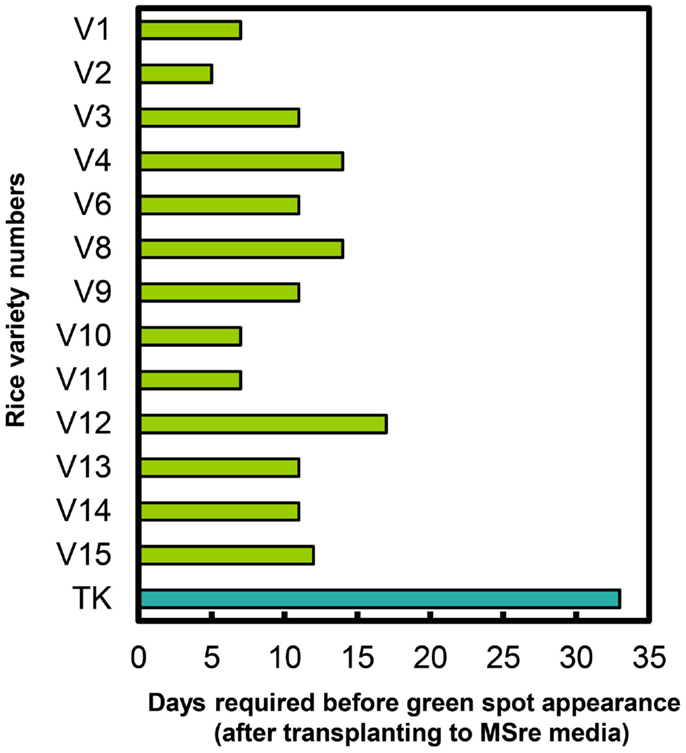
Figure 4. Durations of time required for green spot appearance in Myanmar rice varieties and in the variety Tsukinohikari. V1–V15 on vertical bar represent the variety numbers described in Table 1 and TK means Tsukinohikari. Durations of time from transfer to MSre media to green spot appearance are indicated. Regenerated plants were obtained from these green spots.
Transformation of Paw San Yin-Fer-NAS-YSL2
We selected the high-quality variety Paw San Yin (V3) for transformation based on its superior callus induction capacity and moderate regeneration efficiency. In addition, Fe content in its polished seeds was also the third highest (2.2 μg g−1) among 15 high-yield and high-quality Myanmar varieties tested (data not shown). Callus induction of Paw San Yin on N6D media took 29 days (Figure 5A). Callus condition of Paw San Yin was the best among the varieties tested. Paw San Yin calli were hard, yellow, and larger than those of most other Myanmar rice varieties (Figures 1A and 5A,B, Figures S3 and S4 in Supplementary Material). Paw San Yin calli were smaller than those of TK, but callus induction rates were similar in the two varieties (Figures 1 and 5A). Agrobacterium-infection was performed at OD concentrations of 0.1 and 0.01 because the effect of bacterial density on callus infection time is a key effect on transgenic efficiency, and excess proliferation of Agrobacterium decreases the transformation frequency during co-cultivation step (Ozawa, 2009). Callus appearance differed little between the two Agrobacterium concentrations (Figures 5C–F), except that calli were slightly browner at OD 0.1 during the first 2 weeks in the first selection media (Figure 5D). After selection steps, calli were transferred to MSre-CH50 (MS regeneration media supplemented with 500 mg l−1 claforan and 50 mg l−1 hygromycin) for ∼1.0 month (Figures 5G,H). However, no green spots appeared on calli from MSre-CH50 media 45 DAT. After transferring calli onto MS-C media, many green spots appeared and callus shooting occurred (Figure 5I). Four regenerated plants were obtained and subjected to acclimation for 10 days to produce hardier seedlings (Figure 5J). Subsequently, T0 plants were grown in a greenhouse to check for inserted genes and to obtain T1 seeds for further analyses (Figure 5K).
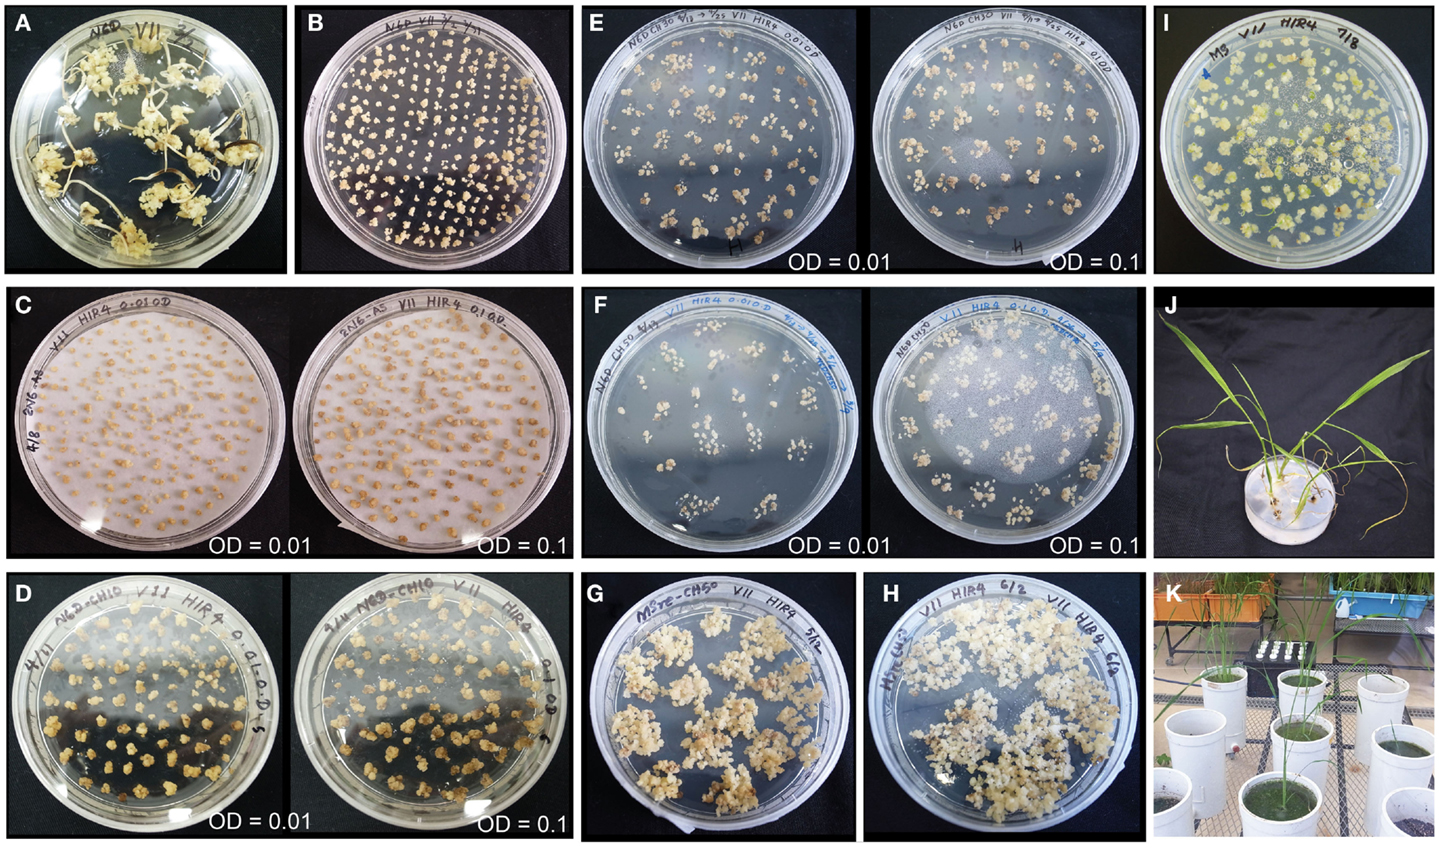
Figure 5. Transformation of Paw San Yin-Fer-NAS-YSL2. (A) Callus induction (at 29 DAG). (B) Pre-incubation (at 8 DAT). (C) Three days following Agrobacterium-infection. (D) Calli on 1st selection medium of N6D-CH10 (at 7 DAT). (E) Calli on 2nd selection medium of N6D-CH30 (at 14 DAT). (F) Calli on 3rd selection medium of N6D-CH50 (at 7 DAT). (G) Calli on MS regeneration medium (MSre-CH50) (at 20 DAT). (H) Calli on MSre-CH50 (at 32 DAT). (I) Green spots appearance of calli and shoots emergence on MS medium (at 4 DAT). (J) Regenerated plants on MS medium. (K) Greenhouse-grown T0 plants. Left panels of (C–F) show transformation with Agrobacterium at a concentration of OD = 0.01; right panels of (C–F) shows transformation at a concentration of OD = 0.1. The numerals shown with DAG or DAT mean DAG or DAT when photograph was taken on each medium.
Inserted Gene Check by Genomic PCR
We checked four regenerated plants for selected gene insertions using genomic PCR. Paw San Yin-Fer-NAS-YSL2 line 1 (L1) contained insertions, including OsGlb promoter-SoyferH2, OsAct promoter-HvNAS1, HPT, NPTII, and iGUS, which was also the case in the Fer-NAS-YSL2 vector itself (Figure 6). The inserted genes were lacking in non-transgenic Paw San Yin (NT). We detected the endogenous sequence for the rice OsActin1 gene in L1 and NT.
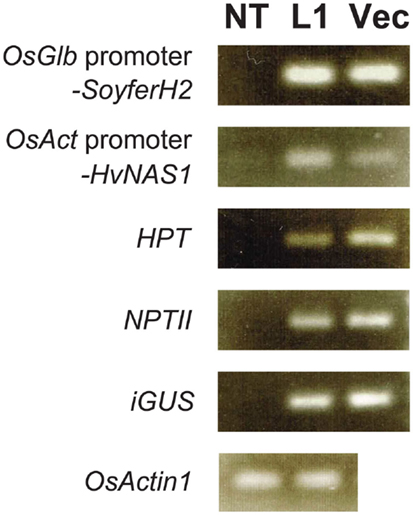
Figure 6. Confirmation of gene insertion in transgenic Paw San Yin-Fer-NAS-YSL2 line 1. NT, non-transgenic Paw San Yin line; L1, Paw San Yin-Fer-NAS-YSL2 line 1; Vec, Fer-NAS-YSL2 vector (positive control). OsGlb promoter-SoyferH2, soybean Ferritin gene SoyferH2 with promoter region of the 26 kDa OsGlb1 gene; OsAct promoter-HvNAS1, barley nicotianamine synthase 1 gene with promoter region of the rice OsActin1 gene; HPT, hygromycin phosphotransferase gene; NPTII, neomycin phosphotransferase II gene; iGUS, β-glucuronidase gene with an intron; OsActin1, endogenous rice actin gene.
Metal Concentrations in T1 Polished Seeds
The mean Fe concentration in T1 polished seeds of L1 was 6.3 μg g−1, a value double that in NT (3.2 μg g−1) (Figure 7A). The mean Zn concentration in L1 seeds was ∼34.2 μg g−1, slightly higher than in NT seeds (32.4 μg g−1) (Figure 7B). L1 had a higher manganese (Mn) concentration than NT, its copper (Cu) concentration was similar to that of NT, and its calcium (Ca) concentration in polished seeds was lower than in NT (Figures S16A–C in Supplementary Material). In T1 brown seeds, L1 had higher Fe and Mn concentrations and lower Cu concentration than NT (Figures S17A,D,E in Supplementary Material). Zn and Ca concentrations in brown seeds were not different between L1 and NT (Figures S17B,C in Supplementary Material). In T1 husk, L1 had lower Zn concentration and higher Ca and Cu concentrations than NT (Figures S18B–D in Supplementary Material). The cadmium (Cd) concentration was lower in polished seeds, brown seeds and husk of L1 than in those of NT (Figures S16D, S17F, and S18E in Supplementary Material).
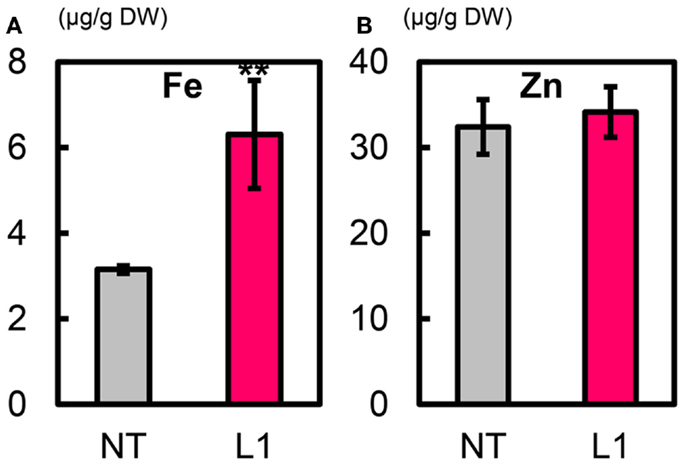
Figure 7. Metal concentrations in T1 polished seeds of Paw San Yin-Fer-NAS-YSL2. (A) Fe concentration. (B) Zn concentration. NT, non-transgenic Paw San Yin. L1, Paw San Yin-Fer-NAS-YSL2 transgenic line 1. Bars represent means ± SE, n = 3. Asterisks (**) above the bars indicate significant differences at P < 0.01 between NT and L1 (determined byt-test).
Gene Expression in Immature T2 Seeds
T1 seeds of L1 were germinated on MS-CH50 media. Subsequently, we cultivated T1 plants (sublines) in a greenhouse. No significant differences were observed in plant growth and morphology between L1 sublines and NT under these cultivation conditions (Figure 8). We confirmed the expressions of HvNAS1, OsYSL2, and SoyferH2 in immature T2 seeds of L1 sublines by real-time RT-PCR analysis (Figure 9). Enhanced expressions of HvNAS1, OsYSL2, and SoyferH2 genes were detected in L1 sublines compared with NT (Figure 9). HvNAS1 expression in NT was barely detectable because sequences of OsNAS1 and HvNAS1 were very similar, and OsNAS1 expression may be detectable in this line (Figure 9A). Expression of OsYSL2 was very low in NT (Figure 9B). SoyferH2 expression was undetectable in the NT line (Figure 9C). In contrast, HvNAS1, OsYSL2, and SoyferH2 were strongly expressed in the L1-1, L1-2, and L1-3 sublines.
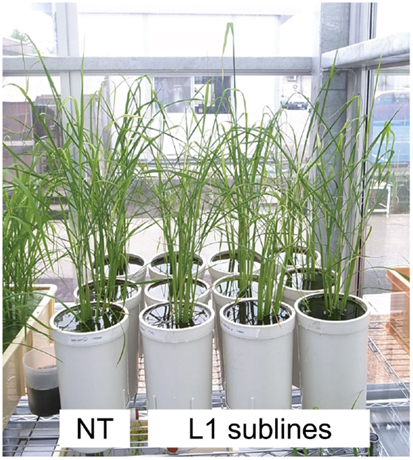
Figure 8. Greenhouse-grown T1 plants. Photograph was taken during tillering stage at 30 days after transplanting. NT, non-transgenic Paw San Yin. L1 sublines, Paw San Yin-Fer-NAS-YSL2 transgenic line 1 sublines.

Figure 9. Quantitative real-time RT-PCR analysis of HvNAS1, OsYSL2, and SoyferH2. (A) HvNAS1, (B) OsYSL2, and (C) SoyferH2 expression levels. T1 plants were cultivated in commercial soil (Bonsolichigou) in a greenhouse. Total RNA was extracted from immature T2 seeds (seeds at the early milky stage, 10 days after fertilization) of each line (n = 3). NT, non-transgenic Paw San Yin. L1-1, L1-2, and L1-3, Paw San Yin-Fer-NAS-YSL2 transgenic line 1 sublines. Bars represent means ± SE of three independent real-time RT-PCR reactions. Asterisks (*) and (**) above the bars indicate significant differences at P < 0.05 and P < 0.01, respectively, between NT and L1 sublines (determined by t-test). n.d., not detected.
Metal Concentrations in T2 Seeds
We measured metal concentrations in T2 polished seeds from the L1-1, L1-2, and L1-3 sublines and in NT (Figures 10A,B, Figure S19 in Supplementary Material). Mean Fe concentrations in polished seeds of L1-1, L1-2, and L1-3 sublines were 5.02, 4.31, and 3.96 μg g−1, respectively, values that were 3.0–3.4-fold higher than values in NT seeds (1.46 μg g−1) (Figure 10A). Mean Zn concentrations in polished seeds of L1-1, L1-2, and L1-3 sublines were 38.6, 39.2, and 36.1 μg g−1, respectively, values that were 22–33% higher than that in NT seeds (29.5 μg g−1) (Figure 10B). No clear differences were observed in polished seed concentrations of Ca, Mn, and Cu between the L1-1, L1-2, and L1-3 sublines and NT (Figures S19A–C in Supplementary Material). Polished seed Cd concentrations in the L1-1, L1-2, and L1-3 sublines were reduced by ∼20% compared to NT seeds (Figure S19D in Supplementary Material).
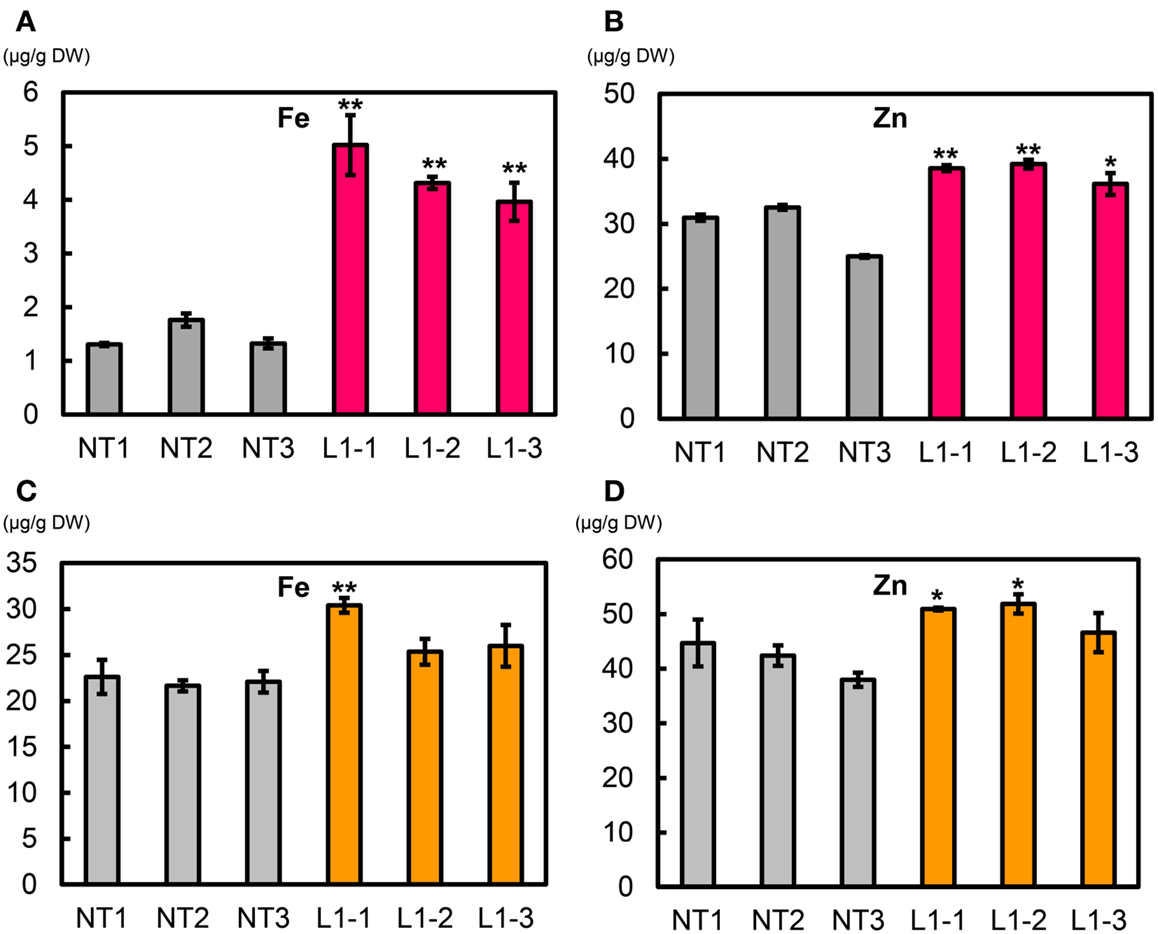
Figure 10. Metal concentrations in T2 polished and brown seeds of Paw San Yin-Fer-NAS-YSL2. (A) Fe concentration in T2 polished seeds. (B) Zn concentration in T2 polished seeds. (C) Fe concentration in T2 brown seeds. (D) Zn concentration in T2 brown seeds. NT, non-transgenic Paw San Yin. L1-1, L1-2, and L1-3, Paw San Yin-Fer-NAS-YSL2 transgenic line 1 sublines. Bars represent means ± SE, n = 3. Asterisks (*) and (**) above the bars indicate significant differences at P < 0.05 and P < 0.01, respectively, between NT and L1 sublines demonstrated by t-tests.
Mean T2 brown seed Fe concentrations in the L1-1, L1-2, and L1-3 sublines were 30.4, 25.4, and 26.0 μg g−1, respectively; these values were 15–37% higher than that in NT seeds (22.1 μg g−1) (Figure 10C). Mean T2 brown seed Zn concentrations in the L1-1, L1-2, and L1-3 sublines were 50.9, 51.9, and 46.6 μg g−1, respectively; these values were 12–24% higher than that in NT seeds (41.7 μg g−1) (Figure 10D). Ca, Mn, and Cu polished rice concentrations in the L1-1, L1-2, and L1-3 sublines were little different from that in NT (Figures S20A–C in Supplementary Material). Mean T2 brown seed Cd concentrations in the L1-1, L1-2, and L1-3 sublines were 0.07, 0.04, and 0.03 μg g−1, respectively; these values were two to fourfold lower than that in NT (0.1 μg g−1) (Figure S20D in Supplementary Material).
T2 husk Fe and Zn concentrations were similar between the L1 sublines and NT (Figures S21A,B in Supplementary Material). Ca, Mn, and Cu were higher in the sublines than in NT (Figures S21C–E in Supplementary Material).
Fe and Zn Contents Per Seed
We estimated the partitioning of Fe and Zn among components of the seed structure (Figure 11, Figure S22 in Supplementary Material). Within T2 seeds of the L1-1 and L1-2 sublines, the total mean Fe contents were 590 and 450 ng seed−1 (including endosperm, bran, and husk), respectively; the value for NT was 455 ng seed−1 (Figure 11A). Mean Fe contents in endosperm (polished seed) of the L1-1 and L1-2 sublines (93.4 and 72.2 ng seed−1, respectively) were three to fourfold higher than that of NT (23.9 ng seed−1). Thus, the new lines had higher Fe allocation to edible seed portions than to either bran or husk (Figure 11A).
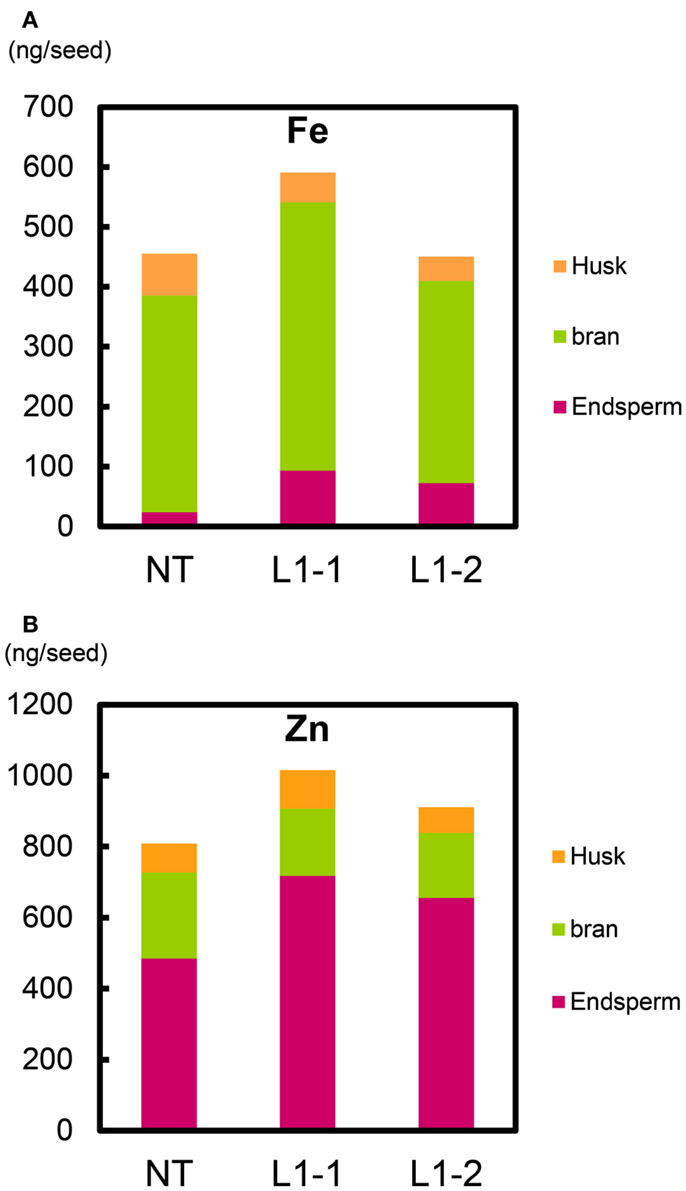
Figure 11. Fe and Zn content per T2 seed of Paw San Yin-Fer-NAS-YSL2. (A) Fe content in husk, bran, and endosperm per T2 seed. (B) Zn content in husk, bran, and endosperm per T2 seed. NT, non-transgenic Paw San Yin; L1-1 and L1-2, Paw San Yin-Fer-NAS-YSL2 transgenic line 1 sublines. Metal content of polished seed is shown as endosperm. Metal content of bran is calculated by subtracting metal content of polished seed from that of brown seed.
Total mean Zn contents per seed in the L1-1 and L1-2 sublines (1016 and 911 ng seed−1, respectively) were higher than in NT (808 ng seed−1) (Figure 11B). The endosperm Zn contents in the L1-1 and L1-2 sublines were 1.4–1.5-fold higher than in NT seeds. We observed similar trends in differences between the L1 line and NT in T1 seeds (Figure S22 in Supplementary Material).
Discussion
Paw San Yin was Selected for Rice Transformation
Calli of Myanmar rice varieties were smaller than those of cultivar TK. The small, soft calli had limited tolerance to Agrobacterium-infection during transformation in our transgenic trials. However, callus inductions were good in V3, V6, and V14, and proliferations were closely similar to that of TK (Figure S4 in Supplementary Material). Particularly, V3 had a good callus induction response, and induced calli of V3 were largest; they were clear yellow and had the highest hardness index, traits that were closely similar to those of TK calli (Figure 1). These callus attributes make V3 suitable for rice transformation. Agrobacterium-infection is an important step in practical transformation, and callus tolerance of this infection is required for a successful outcome. Importantly, V3 calli in the N6D-N6D-MSre-MS medium combination maintained good condition in MS rooting media and produced many regenerated plantlets in the regeneration test (Figure 1A).
Myanmar people have one of the highest rice consumption rates in the world (FAO, 2002). The estimated polished seed Fe concentration needed to increase for these people is ∼8.6 μg g−1 (Supplementary Material). Our premise was that by using a high-Fe rice variety, we would be able to produce lines with much higher levels of Fe biofortification through transgenic transformations using the Fer-NAS-YSL2 vector (Masuda et al., 2012). Myanmar people will probably readily accept a novel Fe-biofortified rice produced from a native variety, and it was for this reason that we screened diverse Myanmar varieties for genetic variation in micronutrient concentrations (Aung et al., unpublished data). This screening identified Paw San Yin (V3) as a variety with high-Fe concentration (∼2.2 μg g−1) in relation to other popular rice strains tested (Aung et al., unpublished data): V3 had more than double the Fe content of the variety with the lowest concentration (Ma Naw Htun) (Aung et al., unpublished data) and double the content of field-grown TK rice (Masuda et al., 2012). Moreover, harvested Paw San Yin seed converts readily to a high-quality, aromatic rice product for human consumption. Grusak and Cakmak (2005) demonstrated that aromatic rice genotypes contain consistently more Fe and Zn than non-aromatic genotypes, indicating that the aromatic germplasm has promise as a genetic resource for improving rice micronutrient levels. Therefore, we selected Paw San Yin (V3) for practical transformation to produce Fe-biofortified rice.
Transformation of Paw San Yin-Fer-NAS-YSL2
Our transformation procedure followed, except for a few modifications, an established protocol for japonica variety cv. TK developed by Hiei et al. (1994) and Akiyama et al. (1997). Hiei et al. (1994) reported that prior to infection, pre-cultivation of calli on fresh medium for 4 days is an important first step in japonica rice transformation. We demonstrated that a longer 8-day pre-incubation period was required for production of hard V3 calli for transformation. Callus condition was good during induction and Agrobacterium co-cultivation, though calli size were smaller than those of TK (Figures 5A–C).
Transformation efficiency was low in Paw San Yin-Fer-NAS-YSL2. Two possible explanations exist for this outcome. Although Paw San Yin calli were in adequate condition for transformation, they were negatively affected and damaged by Agrobacterium-infection to a greater extent than TK calli, where Agrobacterium presence was minimal in calli after the Agrobacterium wash (data not shown). Therefore, low regeneration rates from selected calli in this Paw San Yin variety may have resulted from adverse effects of Agrobacterium-infection when the bacterium further propagated on calli during the selection periods (Figures 5D–F). Hence, we applied a claforan concentration double that was used for TK transformation when selecting media that prevented Agrobacterium propagation. Green spots did not appear on MSre-CH50 through 1 month following transfer. The large size of the vector that we introduced may also have been responsible for the low rate of transformation we obtained (Masuda et al., 2012) (Figure S2 in Supplementary Material).
Gene Expression Analysis and Functions of Introduced Genes
Real-time RT-PCR analyses confirmed elevated expressions of HvNAS1, OsYSL2, and SoyferH2 transgenes in Paw San Yin-Fer-NAS-YSL2 L1-1, L1-2, and L1-3 T2 sublines (Figure 9). HvNAS1 encodes barley nicotianamine synthase, which biosynthesizes the divalent metal chelator nicotianamine (Higuchi et al., 1999), and this gene was overexpressed by the constitutive rice Actin1 promoter in Fer-NAS-YSL2 vector (Figure S2 in Supplementary Material) (Masuda et al., 2012). As is the case for TK transformants with introduced Fer-NAS-YSL2 (Masuda et al., 2012), HvNAS1 was strongly expressed in Paw San Yin-Fer-NAS-YSL2 T2 seeds during the seed milky stage 10 days after fertilization (early seed maturation stage) (Figure 9A). OsYSL2 encodes an Fe(II)-nicotianamine and Mn(II)-nicotianamine transporter, which are responsible for internal metal transport in rice (Koike et al., 2004; Ishimaru et al., 2010). The Fer-NAS-YSL2 vector contains two cassettes for OsYSL2 expression (Figure S2 in Supplementary Material), each driven by an OsSUT1 promoter that drives expression in the early seed maturation stage beginning 7 days after fertilization (Hirose et al., 2002) and by an endosperm-specific OsGlb1 promoter (Qu and Takaiwa, 2004). As a result, OsYSL2 was strongly expressed in Paw San Yin-Fer-NAS-YSL2 T2 seeds during the seed maturation stage 10 days after fertilization (Figure 9B). SoyferH2 encodes the soybean Fe storage protein ferritin, which was driven by endosperm-specific OsGlb1 and OsGluB1 promoters in the Fer-NAS-YSL2 vector (Figure S2 in Supplementary Material). Qu and Takaiwa (2004) demonstrated that the GUS reporter protein accumulates in the early maturation stage 7 days after fertilization in OsGlb1 promoter-GUS and 2.3-kb OsGluB1 promoter-GUS plants. Hence, it was assumed that ferritin expression under the control of the OsGlb1 and 2.3-kb OsGluB1 also initiates ferritin protein accumulation in the early seed maturation stage 7 days after fertilization. We clearly detected SoyferH2 expression in Paw San Yin-Fer-NAS-YSL2 10 days after fertilization (Figure 9C). Thus, we assumed that coordination occurred in the timing of enhancement in nicotianamine production through HvNAS1 overexpression, the enhancement of Fe(II)-nicotianamine transport by OsYSL2 expressed under the control of the OsSUT1 and OsGlb1 promoters, and the enhancement of Fe accumulation by the OsGlb1 promoter-ferritin and 2.3-kb OsGluB1 promoter-ferritin (Masuda et al., 2012).
Fe contents in polished seeds of Paw San Yin-Fer-NAS-YSL2 sublines were three to fourfold higher than those of NT (Figure 11A). We supposed that Fe transport into the plant body and into grain was enhanced by elevated production of nicotianamine by overexpression of HvNAS1 (Lee et al., 2009; Masuda et al., 2009a; Johnson et al., 2011) and improved expression of the OsSUT1 promoter-OsYSL2 (Koike et al., 2004; Ishimaru et al., 2010). Moreover, the Fe storage protein ferritin, which accumulated in the endosperm, may have worked cooperatively in Fe translocation to the endosperm component of grain. We demonstrated that genes involved in Fe transport and accumulation in the endosperm (HvNAS1, OsYSL2, and SoyferH2) work efficiently together to increase Fe content in the endosperm, the edible component of the rice grain.
Seed Fe Concentration Increased in Paw San Yin-Fer-NAS-YSL2
Fe concentration in Paw San Yin-Fer-NAS-YSL2 brown seed was 15–37% higher than that in NT brown seed (Figure 10C) and 3.4-fold higher in polished grain (Figure 10A), clearly demonstrating that Fe was effectively translocated into the endosperm. There were reports of other high-Fe-content rice, showing two to over three times increase in Fe concentration of various rice varieties (Goto et al., 1999; Lucca et al., 2001; Vasconcelos et al., 2003; Lee et al., 2009; Masuda et al., 2009a; Johnson et al., 2011; Paul et al., 2012). Using the transgenic approaches, most trials reported the rice varieties efficient for in vitro and molecular research, or the varieties which have already established transgenic procedures. There are still only a few trials working with popular rice varieties for Fe biofortification. In our present research, we generated the Fe biofortified Paw San Yin rice, which is a high-quality and currently cultivated and consumed rice variety in Myanmar, with 3.4-fold increase in Fe concentration in rice endosperm.
We found that the transgenic efficiency of Paw San Yin was low and difficult to obtain many transgenic lines. The main limiting factor to increase in Fe-density of the transgenic Paw San Yin is the difficulty in obtaining many transgenic lines which include all inserted genes. In our previous report by Masuda et al. (2012), the line with six times increase in Fe concentration of TK rice was selected among 45 lines. If many more lines of Paw San Yin were obtained, there is a possibility to obtain higher Fe lines.
In the present study, our objective was to increase the polished rice Fe concentration about 4.5-fold in the high Fe variety, Paw San Yin, based on a per capita rice consumption of 578 g day−1 in Myanmar (Supplementary Material). T2 seed analysis demonstrated that the polished seed Fe concentration was 3.4-fold higher than in NT line (Figure 10A). Thus, we closely approached the estimated target level. Therefore, it can be assumed that 3.4-fold increase in Fe concentration of Paw San Yin variety is remarkable.
Fer-NAS-YSL2 gene improved Fe accumulation and transport, but Fe uptake was not enhanced yet. Mugineic acid is known as a natural Fe(III) chelator used in Fe acquisition from the rhizosphere in barley and some other graminaceous plants. Masuda et al. (2008) analyzed the transgenic rice line carrying barley IDS3 gene, which is the mugineic acid synthase gene. The transformants showed 1.4-fold increase in Fe concentration in polished seeds of rice grown in field cultivation. If barley IDS3 is introduced to this Fer-NAS-YSL2 gene to enhance Fe uptake from soil, there is a possibility to increase more Fe accumulation in grain.
Zn Concentration Increased in Paw San Yin-Fer-NAS-YSL2
Zn deficiency is a serious problem in Myanmar (Hotz and Brown, 2004). In polished seeds produced from rice grown in the MRRC field, Paw San Yin had the highest Zn concentration (∼19.1 μg g−1), which was almost double those in a range of other popular rice varieties (Aung et al., unpublished data). The Zn concentration in polished seeds was elevated by 30% in Paw San Yin-Fer-NAS-YSL2 sublines (Figure 10B), which may meet the target concentration for Zn biofortification in the Myanmar diet.
Zn content in the endosperm of Paw San Yin-Fer-NAS-YSL2 was 1.4-fold higher than that in NT endosperm (Figure 11B). This outcome may have resulted from HvNAS1 overexpression and endosperm-specific expression of the ferritin gene. NAS overexpression increases both Fe and Zn concentrations in seeds (Lee et al., 2009; Masuda et al., 2009a; Johnson et al., 2011). Endosperm-specific expression of ferritin also increases Zn concentrations in seeds (Goto et al., 1999; Vasconcelos et al., 2003). In comparison with Fe, Zn levels changed little, likely because more Zn occurs naturally in endosperm than in bran; hence, polishing has less of an effect on Zn levels than on Fe levels (Figure 11).
Other Metal Concentrations in Seeds of Paw San Yin-Fer-NAS-YSL2
Concentrations of other metals in both polished and brown seeds, including Ca, Mn, and Cu, were little different between Paw San Yin-Fer-NAS-YSL2 sublines and NT, although levels were somewhat higher in husks of transformed sublines (Figures S19A–C, S20A–C, and S21C–E in Supplementary Material). This lack of an effect may be attributable to specific targeting of the Fer-NAS-YSL2 vector toward accumulation of an elevated Fe concentration in endosperm. Thus, the Fer-NAS-YSL2 construct increased Fe concentrations in grain without reducing concentrations of other required minerals.
Cadmium is a toxic metal present in soil. It was detected in seeds of both NT and the Fer-NAS-YSL2 line (Figures S16D, S17F, S18E, S19D, and S20D in Supplementary Material). Cd concentrations in our samples were low compared to the level at which the metal becomes toxic in polished rice (∼0.4 μg g−1) (CODEX, 2012). Notably, Cd concentrations in brown and polished seeds of Paw San Yin-Fer-NAS-YSL2 T1 and T2 generations were remarkably lower than levels in Paw San Yin-NT (Figures S16D, S17F, S18E, S19D, and S20D in Supplementary Material). The Cd concentration in T2 polished seeds was about 20% lower in Paw San Yin-Fer-NAS-YSL2 than in NT (Figure S19D in Supplementary Material). One may reasonably argue that when Fe transportation to seed was increased in this transgenic rice, the expression levels of Fe transporters that also transport Cd, such as OsIRT1 (Nakanishi et al., 2006), OsNRAMP5 (Ishimaru et al., 2012; Sasaki et al., 2012), or other unknown Fe and Cd transporters, may decrease. Thus, it was assumed that Cd concentration in Paw San Yin-Fer-NAS-YSL2 seeds was lowered in the transgenic sublines. The seed Cd concentration in the HvNAS1 overexpression line also decreased (Masuda et al., 2012). Hence, rice with an Fe content elevated through insertion of the Fer-NAS-YSL2 construct will likely be useful in reducing dietary Cd levels, especially in crops grown on Cd contaminated soil.
Conclusion
Our starting premise was that currently consumed rice varieties with high Fe and Zn contents would be suitable starting material for the production of Fe-fortified grain. We screened methods for regenerating diverse Myanmar rice varieties and identified those varieties with good callus induction and high regeneration efficiency, which might contribute to transgenic development.
Paw San Yin is a high-quality, popular rice variety. The first Myanmar transgenic rice was produced successfully from this variety. Through our program, we achieved Fe-biofortified Paw San Yin rice with an Fe concentration 3.4-fold higher than the concentration in control seeds. The degree of Fe increase closely approached the dietary target for Myanmar people. The Zn concentration in the new transgenic sublines may also fulfill Zn requirements for the Myanmar population.
Conflict of Interest Statement
The authors declare that the research was conducted in the absence of any commercial or financial relationships that could be construed as a potential conflict of interest.
Acknowledgments
We thank Dr. Ye Tint Tun of the Myanmar Rice Research Center (MRRC), Myanmar Agriculture Service (MAS), Hmawbi, Yangon, for providing seeds of high-yield, high-quality Myanmar rice varieties. We also thank Dr. Tatsuro Hamada (Ishikawa Prefectural University) for support in arranging the research environment and Dr. Takasei Kusube (Ishikawa Prefectural University) for technical support in metal concentration analysis. We thank Ms. May Linn Aung and Ms. Akane Konishi (Ishikawa Prefectural University) for their assistance in regeneration trials, rice transformation, and metal concentration analysis. This work was financially supported by The Mitani Foundation for Research and Development, Japan, and by a Grant-in-Aid for Scientific Research from the Japan Society for the Promotion of Sciences (JSPS).
Supplementary Material
The Supplementary Material for this article can be found online at: http://www.frontiersin.org/Plant_Physiology/10.3389/fpls.2013.00158/abstract
References
Akiyama, K., Nakamura, S., Suzuki, T., Wisniewska, I., Sasaki, N., and Kawasaki, S. (1997). Development of a system of rice transformation with long genome inserts for their functional analysis for positional cloning. Plant Cell Physiol. 38, 94.
Amin, M. A., Uddin, M. A., and Hossain, M. A. (2004). Regeneration study of some indica rice cultivars followed by Agrobacterium-mediated transformation of highly regenerable cultivar BR-8. J. Biol. Sci. 4, 207–211.
Bajaj, Y. P. S. (1991). “Biotechnology in rice improvement,” in Biotechnology in Agriculture and Forestry 14. Rice, ed. Y. P. S. Bajaj (Berlin: Springer Verlag), 1–:18.
Bouis, H. E. (2003). Micronutrient fortification of plants through plant breeding: can it improve nutrition in man at low cost? Proc. Nutr. Soc. 62, 403–411.
Bouis, H. E., Chassy, B. M., and Ochanda, O. (2003). Genetically modified food crops and their contribution to human nutrition and food quality. Trends Food Sci. Technol. 14, 191–209.
CODEX. (2012). General Standard for Contaminants and Toxins in Food and Feed. CODEX International Food Standards Alimentarius. Available at: http://www.codexalimentarius.org/input/download/standards/17/CXS_193e.pdf
FAO. (2002). The State of Food Insecurity in the World 2002. Rome: Food and Agriculture Organization of the United Nations (FAO).
Goto, F., Yoshihara, T., Shigemoto, N., Toki, S., and Takaiwa, F. (1999). Iron fortification of rice seed by the soybean ferritin gene. Nat. Biotechnol. 17, 282–286.
Graham, R. D., Welch, R. M., and Bouis, H. E. (2001). Addressing micronutrient malnutrition through enhancing the nutritional quality of staple foods: principles, perspectives and knowledge gaps. Adv. Agron. 70, 77–142.
Grusak, M. A., and Cakmak, I. (2005). “Methods to improve the crop-delivery of minerals to humans and livestock,” in Plant Nutritional Genomics, eds M. R. Broadley and P. J. White (Oxford: Blackwell), 265–286.
Hiei, Y., Komari, T., and Kubo, T. (1997). Transformation of rice mediated by Agrobacterium tumefaciens. Plant Mol. Biol. 35, 205–218.
Hiei, Y., Ohta, S., Komari, T., and Kumashiro, T. (1994). Efficient transformation of rice (Oryza sativa L.) mediated by Agrobacterium and sequence analysis of the boundaries of the T-DNA. Plant J. 6, 271–282.
Higuchi, K., Suzuki, K., Nakanishi, H., Yamaguchi, H., Nishizawa, N. K., and Mori, S. (1999). Cloning of nicotianamine synthase genes, novel genes involved in the biosynthesis of phytosiderophores. Plant Physiol. 119, 471–479.
Hirose, T., Takano, M., and Terao, T. (2002). Cell wall invertase in developing rice caryopsis: molecular cloning of OsCIN1 and analysis of its expression in relation to its grain filling. Plant Cell Pysiol 43, 452–459.
Hotz, C., and Brown, K. H. (2004). Assessment of the risk of zinc deficiency in populations and options for its control, 1st IZiNCG technical document. Food Nutr. Bull. 25(Suppl. 2), S91–S204.
Ikeda, N., Bautista, N. S., Yamada, T., Kamijima, O., and Ishii, T. (2001). Ultra-simple DNA extraction method for marker-assisted selection using microsatellite markers in rice. Plant Mol. Biol. Rep. 19, 27–32.
IRRI. (2013). Available at: http://www.irri.org/index.php?option=com_k2&view=item&id=12094&lang=en
Ishimaru, Y., Masuda, H., Bashir, K., Inoue, H., Tsukamoto, T., Takahashi, M., et al. (2010). Rice metal-nicotianamine transporter, OsYSL2, is required for the long-distance transport of iron and manganese. Plant J. 62, 379–390.
Ishimaru, Y., Takahashi, R., Bashir, K., Shimo, H., Senoura, T., Sugimoto, K., et al. (2012). Characterizing the role of rice NRAMP5 in Manganese, Iron and Cadmium Transport. Sci. Rep. 2, 286.
Ishizaki, T., and Kumashiro, T. (2008). Genetic transformation of NERICA, interspecific hybrid rice between Oryza glaberrima and O. sativa, mediated by Agrobacterium tumefaciens. Plant Cell. Rep 27, 319–327.
Johnson, A. A. T., Kyriacou, B., Callahan, D. L., Carruthers, L., Stangoulis, J., Lombi, E., et al. (2011). Constitutive overexpression of the OsNAS gene family reveals single gene strategies for effective iron- and zinc-biofortification of rice endosperm. PLoS ONE 6:e24476. doi:10.1371/journal.pone.0024476
Kennedy, G., Burlingame, B., and Nguyen, N. (2002). Nutrient impact assessment of rice in major rice consuming countries. Int. Rice Comm. Newsl. 51, 33–41.
Koike, S., Inoue, H., Mizuno, D., Takahashi, M., Nakanishi, H., Mori, S., et al. (2004). OsYSL2 is a rice metal-nicotianamine transporter that is regulated by iron and expressed in the phloem. Plant J. 39, 415–424.
Lee, S., Jeon, U. S., Lee, S. J., Kim, Y. K., Persson, D. P., Husted, S., et al. (2009). Iron fortification of rice seeds through activation of the nicotianamine synthase gene. Proc. Natl. Acad. Sci. U.S.A. 106, 22014–22019.
Lucca, P., Hurrell, R., and Potrykus, I. (2001). Genetic engineering approaches to improve the bioavailability and the level of iron in rice grains. Theor. Appl. Genet. 102, 392–397.
Lyons, G., Stangoulis, J., and Graham, R. (2003). High-selenium wheat: biofortification for better health. Nutr. Res. Rev. 16, 45–60.
Maclean, J. L., Dawe, D. C., Hardy, B., and Hettel, G. P. (2002). Rice Almanac, Third Edition, Source Book for the Most Important Economic Activity on Earth. Oxfordshire: CABI Publishing.
Masuda, H., Ishimaru, Y., Aung, M. S., Kobayashi, T., Kakei, Y., Takahashi, M., et al. (2012). Iron biofortification in rice by the introduction of multiple genes involved in iron nutrition. Sci. Rep. 2, 534.
Masuda, H., Suzuki, M., Morikawa, K. C., Kobayashi, T., Nakanishi, H., Takahashi, M., et al. (2008). Increase in iron and zinc concentrations in rice grains via the introduction of barley genes involved in phytosiderophore synthesis. Rice 1, 100–108.
Masuda, H., Usuda, K., Kobayashi, T., Ishimaru, Y., Kakei, Y., Takahashi, M., et al. (2009a). Overexpression of the barley nicotianamine synthase gene HvNAS1 increase iron and zinc concentrations in rice grains. Rice 2, 155–166.
MOAI. (2010). Myanmar Agriculture in Brief 2010. Yangon: Ministry of Agriculture and Irrigation (MOAI).
MOH. (2003). National Haemoglobin Survey. National Plan of Action for Food and Nutrition 2006–2010. Yangon: Nutrition Section, Department of Health, Ministry of Health (MOH).
Nakanishi, H., Ogawa, I., Ishimaru, Y., Mori, S., and Nishizawa, N. K. (2006). Iron deficiency enhances cadmium uptake and translocation mediated by the Fe2+ transporters OsIRT1 and OsIRT2 in rice. Soil Sci. Plant Nutr. 52, 464–469.
Nishimura, A., Aichi, I., and Matsuoka, M. (2007). A protocol for Agrobacterium-mediated transformation in rice. Nat. Prot. 1, 2796–2802.
Ozawa, K. (2009). Establishment of a high efficiency Agrobacterium-mediated transformation system of rice (Oryza sativa L.). Plant Sci. 176, 522–527.
Paul, S., Ali, N., Gayen, D., Datta, S. K., and Datta, K. (2012). Molecular breeding of Osfer2 gene to increase iron nutrition in rice grain. GM Crops Food 3, 310–316.
Pipatpanukul, T., Bunnag, S., Theerakulpisut, P., and Kosittrakul, M. (2004). Transformation of indica rice (Oryza sativa L.) cv. RD6 mediated by Agrobacterium tumefaciens. Songklanakarin J. Sci. Technol. 26, 1–13.
Qu, L. Q., and Takaiwa, F. E. (2004). Evaluation of tissue specificity and expression strength of rice seed component gene promoters in transgenic rice. Plant Biotechnol. J. 2, 113–125.
Rajesh, S., Krishnaveni, S., Sudhakar, D., Raveendran, M., Sivakumar, P., Gnanam, R., et al. (2008). Agrobacterium-mediated transformation of indica rice (Oryza sativa L.), IR64 with mung bean LEA protein gene for water-stress tolerance. Am. J. Plant Physiol. 3, 101–110.
Saika, H., and Toki, S. (2010). Mature seed-derived callus of the model indica rice variety Kasalath is highly competent in Agrobacterium-mediated transformation. Plant Cell Rep. 29, 1351–1364.
Sasaki, A., Yamaji, N., Yokosho, K., and Ma, J. F. (2012). Nramp5 is a major transporter responsible for manganese and cadmium uptake in rice. Plant Cell 24, 2155–2167.
Sivakumar, P., Law, Y. S., Ho, C. L., and Harikrishna, J. A. (2010). High frequency plant regeneration from mature seed of elite recalcitrant Malaysian indica rice (Oryza sativa L.) cv. MR219. Acta Biol. Hung. 61, 313–321.
Summart, J., Panichajakul, S., Prathepha, P., and Thanonkeo, P. (2008). Callus induction and influence of culture condition and culture medium on growth of Thai Aromatic rice, Khao Dawk Mali 105, cell culture. World Appl. Sci. J. 5, 246–251.
Timmer, C. P. (2003). Biotechnology and food systems in developing countries. J. Nutr. 133, 3319–3322.
Toki, S. (1997). Rapid and efficient Agrobacterium-mediated transformation in rice. Plant Mol. Biol. Rep. 15, 16–21.
UNICEF and The Micronutrient Initiative. (2004a). Vitamin and Mineral Deficiency: A Global Progress Report. Ottawa: The Micronutrient Initiative; New York: UNICEF.
UNICEF and The Micronutrient Initiative. (2004b). Vitamin and Mineral Deficiency: A Damage Assessment Report for MYANMAR. Ottawa: The Micronutrient Initiative; New York: UNICEF.
Vasconcelos, M., Datta, K., Oliva, N., Khalekuzzaman, M., Torrizo, L., Krishnan, S., et al. (2003). Enhanced iron and zinc accumulation in transgenic rice with the ferritin gene. Plant Sci. 164, 371–378.
Welch, R. M., and Graham, R. D. (2005). Agriculture: the real nexus for enhancing bioavailable micronutrients in food crops. J. Trace Elem. Med. Biol. 18, 299–307.
White, P. J., and Broadley, M. R. (2005). Biofortifying crops with essential mineral elements. Trends Plant Sci. 10, 586–593.
Keywords: iron, anemia, biofortification, nicotianamine, ferritin, OsYSL2, Myanmar rice, rice transformation
Citation: Aung MS, Masuda H, Kobayashi T, Nakanishi H, Yamakawa T and Nishizawa NK (2013) Iron biofortification of Myanmar rice. Front. Plant Sci. 4:158. doi: 10.3389/fpls.2013.00158
Received: 22 February 2013; Accepted: 07 May 2013;
Published online: 27 May 2013.
Edited by:
Michael A. Grusak, USDA-ARS Children’s Nutrition Research Center, USAReviewed by:
Suleyman I. Allakhverdiev, Russian Academy of Sciences, RussiaApichart Vanavichit, Kasetsart University, Thailand
Copyright: © 2013 Aung, Masuda, Kobayashi, Nakanishi, Yamakawa and Nishizawa. This is an open-access article distributed under the terms of the Creative Commons Attribution License, which permits use, distribution and reproduction in other forums, provided the original authors and source are credited and subject to any copyright notices concerning any third-party graphics etc.
*Correspondence: Naoko K. Nishizawa, Laboratory of Plant Cell Technology, Research Institute for Bioresources and Biotechnology, Ishikawa Prefectural University, 1-308 Suematsu, Nonoichi, Ishikawa 921-8836, Japan. e-mail: annaoko@mail.ecc.u-tokyo.ac.jp
†May Sann Aung and Hiroshi Masuda have contributed equally to this work.