 Pasi Kolari
 Tommy Chan
 Albert Porcar-Castell
 Jaana Bäck
 Eero Nikinmaa
 Eija Juurola
- 1Department of Physics, University of Helsinki, Helsinki, Finland
- 2Department of Forest Sciences, University of Helsinki, Helsinki, Finland
Understanding the seasonality of photosynthesis in boreal evergreen trees and its control by the environment requires separation of the instantaneous and slow responses, as well as the dynamics of light reactions, carbon reactions, and respiration. We determined the seasonality of photosynthetic light response and respiration parameters of Scots pine (Pinus sylvestris L.) in the field in southern Finland and in controlled laboratory conditions. CO2 exchange and chlorophyll fluorescence were measured in the field using a continuously operated automated chamber setup and fluorescence monitoring systems. We also carried out monthly measurements of photosynthetic light, CO2 and temperature responses in standard conditions with a portable IRGA and fluorometer instrument. The field and response measurements indicated strong seasonal variability in the state of the photosynthetic machinery with a deep downregulation during winter. Despite the downregulation, the photosynthetic machinery retained a significant capacity during winter, which was not visible in the field measurements. Light-saturated photosynthesis (Psat) and the initial slope of the photosynthetic light response (α) obtained in standard conditions were up to 20% of their respective summertime values. Respiration also showed seasonal acclimation with peak values of respiration in standard temperature in spring and decline in autumn. Spring recovery of all photosynthetic parameters could be predicted with temperature history. On the other hand, the operating quantum yield of photosystem II and the initial slope of photosynthetic light response stayed almost at the summertime level until late autumn while at the same time Psat decreased following the prevailing temperature. Comparison of photosynthetic parameters with the environmental drivers suggests that light and minimum temperature are also decisive factors in the seasonal acclimation of photosynthesis in boreal evergreen trees.
Introduction
The boreal zone is characterized by the large amplitude and dynamic annual pattern of light and temperature. These dynamics are known to control the strong seasonal variation in photosynthetic capacity of boreal evergreen foliage. Yet, the understanding on these controls is limited due to the lack of reliable and informative long-term measurements and meaningful analysis of empirical data.
Photosynthesis is controlled by light and temperature at two different time scales and subprocesses. Instantaneous changes in radiation affect the rate of photon capture by the light reactions of photosynthesis, and contribute also to the activation/deactivation of CO2-binding enzyme Rubisco, and stomatal control (e.g., Pearcy, 1990). Instantaneous changes in temperature modulate all enzymatic steps of photosynthesis. Seasonal changes in light and temperature also control the dynamics of photosynthetic capacity, i.e., the potential CO2 uptake under optimal conditions, where the capacity of both light and carbon reactions of photosynthesis is up- or downregulated by environmental and plant-level physiological cues via different signaling pathways (Öquist and Hüner, 2003; Pfannschmidt, 2003; Ensminger et al., 2006). The instantaneous responses of photosynthesis and leaf respiration to the environmental drivers change seasonally within the range determined by the current state of the photosynthetic light and carbon reactions and the whole leaf physiology. Accordingly, understanding the seasonality of photosynthesis and its control by the environment requires separation of the instantaneous and slow responses, as well as the dynamics of light reactions, carbon reactions, and respiration.
The complete picture how the state of the photosynthetic machinery varies seasonally is somewhat unclear due to different approaches to how the state is defined as well as different measurement setups and conditions in the various empirical studies. The state can be defined as the capacity or maximum process rate (such as light-saturated photosynthesis), process rate in standard conditions (respiration in standard temperature), or as the efficiency (the slope of photosynthetic rate as a function of light or CO2) of a physiological process. The state is sometimes described with one lumped parameter (e.g., maximum photosynthetic rate Pmax) without explicitly addressing the capacity of photosynthetic light and carbon reactions. Often the other state parameters are considered constant, e.g., constant Jmax/Vcmax ratio or fixed temperature response of respiration.
The seasonality of photosynthetic capacity has been linked to temperature (Pelkonen and Hari, 1980; Mäkelä et al., 2004). There is also evidence of the effect of photoperiod on downregulation of photosynthetic light reactions in autumn (Busch et al., 2007), and light intensity and temperature on the recovery during spring (Ensminger et al., 2004; Porcar-Castell et al., 2008a). Mäkelä et al. (2004) introduced a theoretical variable, state of acclimation (S), which describes the state of acclimation of the photosynthetic apparatus in temperature units. The seasonality of photosynthetic capacity in boreal Scots pine (Pinus sylvestris L.) was successfully predicted as slow response toward prevailing temperature (Mäkelä et al., 2004; Kolari et al., 2009; Gea-Izquierdo et al., 2010). However, in those studies the instantaneous response to temperature was largely omitted and the modeling approach reflected parameters estimated at prevailing temperature rather than the full capacity.
Several other recent studies on the seasonality of photosynthesis and respiration were also based on data collected in prevailing conditions in the field (Kolari et al., 2007; Ow et al., 2010; Linkosalo et al., 2014). Continuous measurements in the field give limited or biased information on the potential photosynthetic capacity that the plant would have in optimal conditions, which would indicate better the current physiological state. Furthermore, determining the instantaneous photosynthetic responses to different environmental drivers, i.e., light, temperature, air humidity or VPD, from continuous field measurements is uncertain. The drivers are mutually correlated and the range of short-term variability can be narrow, for instance, low light and small diurnal variation of temperature in boreal autumn. Determination of the underlying state of the leaf requires measurements under a wide range of conditions and breaking the correlations of the drivers, something that becomes difficult in the field especially during boreal winters. Accordingly, disentangling the instantaneous responses to light or temperature from the changes in the state in the observed seasonal pattern in photosynthesis remains a challenge. Studying the responses to the environment is further complicated by the tree-level effects on instantaneous photosynthetic rate (e.g., water supply, availability of nutrients, sink control) that are embedded in the responses of photosynthetic rate to the environment (Nikinmaa et al., 2013).
Permanent shoot chamber enclosure systems coupled to infra-red gas analyzers (IRGA) can be used for monitoring net CO2 exchange over long periods of time in the field and, to some extent, for determining physiological parameters (Kolari et al., 2007, 2009). Photosynthesis and respiration can be derived from these measurements at time resolution of a few minutes. Alternatively, chlorophyll fluorescence measurements can be also used for long-term monitoring of photosynthesis, in terms of electron transport, at a similar temporal resolution (Porcar-Castell et al., 2008b; Porcar-Castell, 2011). Portable systems capable of measuring simultaneously gas exchange and chlorophyll fluorescence are currently widely used in point measurements of leaf-level photosynthetic parameters. These systems are very versatile and allow adjustment of the incoming light, temperature, air humidity and CO2 concentration in the measuring chamber. Combining continuous measurements on intact shoots in the field and intermittent measurements of excised shoots in controlled conditions can give more information about the dynamics and responses of photosynthesis and respiration to different drivers, and thus about the state of the photosynthetic machinery. Tree-scale factors such as varying water status and photosynthate transport capacity can also be partly eliminated when studying excised shoots.
In this study we assess how photosynthetic and respiration parameters observed in the field and in standard near-optimal conditions are related to each other in Scots pine growing in the boreal zone. This entails determining the seasonality of CO2 exchange and chlorophyll fluorescence in the field using continuous measurements with automated chambers and fluorescence monitoring systems and in controlled conditions with periodically repeated measurements of photosynthetic light, CO2 and temperature responses with a portable IRGA system coupled with a fluorometer. We separately determine the seasonality of photosynthetic light and carbon reaction parameters and respiration in standard conditions and quantify to what extent the observed dynamics in photosynthesis and respiration in the field are instantaneous responses and to what extent they reflect slow changes in the state of the leaf physiology. Finally, we discuss how accurate information about the state can be obtained from field measurements and evaluate how the model of slow temperature acclimation (Mäkelä et al., 2004), previously tested against field monitoring data, can explain the observed seasonal patterns in the photosynthetic light and carbon reaction parameters determined in standard conditions.
Materials and Methods
Study Site
Dynamics of photosynthesis in Scots pine (Pinus sylvestris L.) was studied at Helsinki University SMEAR II (Station for Measuring Forest Ecosystem-Atmosphere Relations) field station in Hyytiälä, southern Finland (61°51′N, 24°17′E, 180 m a.s.l.). The station is situated in a lightly managed Scots pine stand established in 1962. The mean annual precipitation and temperature at the site were 711 mm and 3.5°C, respectively, for 1980–2010 (Pirinen et al., 2012). The mean daily, mean daily maximum, and mean daily minimum temperatures were −7.2, −4.4, and −10.8°C in January, and 16.0, 21.6, and 10.8°C in July, respectively.
Measurements of Photosynthesis, Leaf Respiration and Fluorescence
Continuous monitoring
Continuous gas exchange measurements on pine shoots during years 2010–2011 were analyzed in this study. The instrumentation consisted of chambers, sample tubing, gas analyzers and a control unit operating the system automatically. The chambers were made of acrylic plastic with 1 dm3 volume. The chambers were open most of the time exposing the chamber interior to the ambient conditions. For measuring fluxes, the chambers were closed intermittently for 1 min. Measurements of CO2 and water vapor fluxes and concentrations, air temperature inside the chambers and photosynthetically active radiation (PAR) outside of the chambers were done 50–80 times a day. During the chamber closure, gas concentrations and environmental variables were recorded every 5 s. The flux calculation was based on the detection of the gas concentration change in the chambers during the closure (Hari et al., 1999). Altimir et al. (2002) described the instrumentation in more detail.
The studied shoots were located at the top of the canopy in two trees. The chambers were installed on the shoots so that they accommodated one age class of needles. The terminal buds were removed prior to chamber installation to prevent new growth inside the chambers. Three chambers were in use simultaneously from 2 March 2010 until 10 January 2011, in other times there were two chambers. After completing the measurements on the shoots, the dimensions of the needles in each shoot were measured and their surface area was calculated using the equation from Tiren (1927) and divided by 3 to obtain projected area.
Continuous measurements of chlorophyll fluorescence were conducted using a Monitoring PAM fluorometer system (Heinz Walz, GmbH, Germany) consisting of several independent measuring heads (Porcar-Castell et al., 2008b; Porcar-Castell, 2011). The number of parallel needle samples was most of the time three or four. Three to four pairs of needles were clipped in each measuring head and the prevailing (F′) and maximal fluorescence (F′m) were measured every 15, 30, or 60 min using the saturating pulse technique (Schreiber et al., 1986). Measuring frequency was adjusted during the season to minimize pulse-induced long-term photoinhibition, using lower frequencies during winter and nights. The duration of the saturating light pulse was 0.8 s and the intensity at the leaf-surface was >4000 μmol m−2 s−1. The data was used to estimate the operating quantum yield of photochemistry in photosystem II (PSII) (Genty et al., 1989), as
In this study we present the daily maximum ΦPSII. This yield was obtained during nighttime and it is equivalent to the parameter Fv/Fm in dark acclimated samples (Kitajima and Butler, 1975; Maxwell and Johnson, 2000). We denote the parameter Fv/Fm to distinguish it from the yield determined in controlled conditions.
Response measurements
Six overstory trees (height about 15 m) were randomly selected for the response measurements. The measurements were started in February 2010 and continued approximately once a month through the following winter until December 2011, in total 22 times. At each measuring point a branch was cut from the upper canopy of each tree, placed under water and brought to the laboratory. Branches were subsequently re-cut under water. Time from the transfer to laboratory conditions to starting the measurements varied from 30 min to 5 h. Each monthly measurement was collectively sampled over a period of 3–4 days.
The CO2 exchange rates and operating quantum yields of photosystem II were measured with a portable IRGA equipped with an integrated fluorometer (Walz GFS-3000, Heinz Walz, Germany). For each branch, four fascicles, totaling eight needles were placed in the measuring cuvette. Cohorts from 2009 to 2010 were used during 2010 and 2011 measurements, respectively.
Three different response measurement sequences were performed: (i) light response at ambient temperature and ambient CO2 concentration, (ii) light response at standard temperature of 18°C and ambient CO2 concentration, and (iii) CO2 response at standard temperature of 18°C and saturating light (1300 μmol m−2 s−1). Before the start of the full measurement sequence the needles were treated with an initial 15–20 min stabilization period in conditions close to ambient field temperature (but not below −1°C) and 600 μmol m−2 s−1 PAR. After the first light response sequence the needles were allowed to acclimate for 30–45 min when temperature was changed from ambient to standard conditions. The increase in temperature was performed in two steps, if the temperature difference was large. Similarly, the CO2 sequence had an initial stabilization period of 15–20 min.
A comprehensive response of leaf photosynthesis to light was produced by stepwise changes in light from the initial 600 μmol m−2 s−1 sequentially to 400, 100, 50, 25, 0, 600, 900, 1200, and 1700 μmol m−2 s−1, with a stabilization period of 150 s between each step plus seven successive measurements at 5-s intervals at each light level. The CO2 response (A-Ci), was measured at 18°C at constant 1300 μmol m−2 s−1 PAR with stepwise changes in CO2 concentrations, starting from 380 μmol mol−1 and followed by 200, 100, 50, 25, 380, 600, 800, and 1200 μmol mol−1. Operating quantum yield of photosystem II (ΦPSII) was determined at the end of each light and CO2 step using a saturating pulse of 0.8 s duration and >4000 μmol intensity, following the same method as in the Monitoring PAM system described above.
Temperature responses at 800 μmol m−2 s−1 PAR were measured three times in 2011. The sequence was started with stabilization at 16°C, temperature was then decreased to 8°C in 4°C steps and finally increased to 24°C in 4°C steps. Time between each step was 10 min. Net CO2 exchange and photosynthesis in the temperature response measurements are denoted A800 and P800, respectively.
During the measurements the flow rate through the cuvette was 650 μmol s−1, relative humidity was kept between 55 and 70%, and CO2 concentration during the light and temperature response sequences was stabilized to 380 μmol mol−1. The conditions were controlled with the GFS-3000.
Leakage from or into the cuvette may occur when the difference in CO2 concentration between the cuvette and outside air is large. The effect of leakage on the observed CO2 exchange was quantified by recording the standard gas exchange measurement sequence with an empty cuvette and estimating CO2 exchange as linear function of concentration difference between the cuvette and outside air. All the CO2 exchange data were corrected by this method.
After the measurements, the needles were photographed and their projected area calculated with image analysis software (ImageAnalyzer, Dr. Martti Perämäki). The needles were then collected to measure their fresh weight, length, thickness and width, and dried at 105°C for 24 h to get the dry weight.
Models of Photosynthesis and Respiration
Simple light response of photosynthesis
Net CO2 exchange of leaves (A) consists of photosynthetic CO2 uptake (P) and CO2 efflux from dark respiration (Rd). It can be expressed as a saturating function of light:
We estimated daily light-saturated photosynthesis Psat, the initial slope of the light response αf and dark respiration Rd from the field CO2 exchange measurements. From the response measurements we determined the initial slope αs, Rd and photosynthetic rate measured in 1200 μmol m−2 s−1 PAR (P1200) that represented Psat. This light intensity was chosen, because the response measurements were performed throughout the year and during winter higher light intensities resulted in photoinhibition and decreased photosynthesis. We fixed θ to 1 (Blackman curve) to obtain more robust estimates for the other parameters. Respiration in the light was assumed to be the same as in the darkness.
Biochemical model of photosynthesis
The maximum electron transport rate (Jmax), maximum carboxylation rate (Vcmax) and apparent dark respiration during the day (Rd) were determined from the A-I and A-Ci response data set by fitting the biochemical photosynthesis Farquhar et al. (1980) model:
where Wj is light-limited photosynthesis
J is electron transport rate
and Wc is carbon-limited photosynthesis
Vcmax and Jmax were estimated from the low (Ci < 350 μmol mol−1) and high (Ci > 350 μmol mol−1) Ci regions of the A-Ci responses, respectively (Wullschleger, 1993). The values of Kc, Ko, and Γ* were taken from literature (Farquhar et al., 1980). In addition to the widely used parameters Vcmax and Jmax we also estimated the initial slope of the A-Ci curve which requires less assumptions than Vcmax on the limitations and the values of the other model parameters.
Temperature responses of photosynthesis and respiration
The instantaneous temperature responses of photosynthetic model parameters were analyzed with a function that addresses the low-temperature inhibition of photosynthesis (Collatz et al., 1992). The rate of photosynthesis P at leaf temperature T is
where P(Tref) is the photosynthetic rate at reference temperature Tref, s determines the slope of the response function at intermediate temperatures, s1 and T1 determine the high-temperature inhibition and s2 and T2 the low-temperature inhibition. In this study Tref was 18°C, the standard temperature in the response measurements.
Seasonality of photosynthetic capacity was previously described as slow acclimation to prevailing temperature (Mäkelä et al., 2004). The state of acclimation S is defined as a function of leaf temperature T and time constant τ
S can be thought as the temperature that the photosynthetic machinery is acclimated to and it is expressed in temperature units. We use as reference to the seasonal patterns of the photosynthetic parameters the sigmoid relationship between photosynthetic capacity β and S estimated by Kolari et al. (2007):
where βmax is the maximum summertime photosynthetic capacity and b and TS are empirically determined parameters. Originally the capacity parameter β determined the rate of light-saturated photosynthesis per unit Ci in the model of optimal stomatal control (Hari et al., 1986). In other words, β = Psat/Ci. We also test this model formulation for other photosynthetic parameters.
Respiration was analyzed with the commonly used Q10 Equation
where Q10 is the temperature sensitivity and R0 respiration in 0°C.
Results
Seasonal Patterns of Environmental Drivers and CO2 Fluxes
The study period was characterized by the cold winter and hot and dry midsummer of 2010, more typical winter 2010–2011 and summer of 2011 and the warm end of year 2011. The seasonal patterns of environmental conditions during the study are shown in Figure 1. Figure 1D shows the seasonal courses of noon and midnight CO2 fluxes in the field.
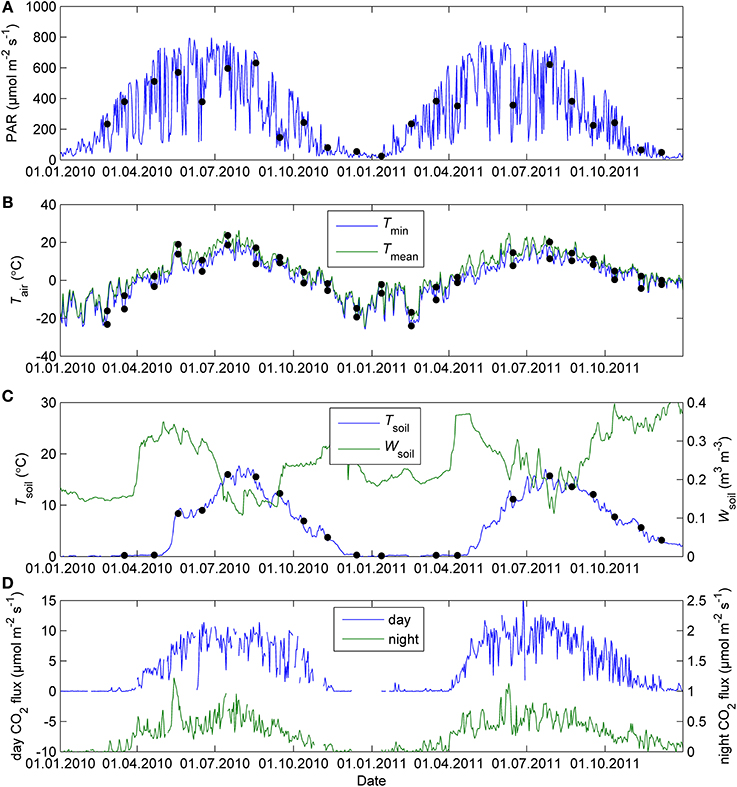
Figure 1. Daily mean PAR (A), minimum and mean air temperature (B), soil volumetric water content and soil temperature (C), and midday and midnight CO2 exchange of Scots pine shoots in the field (D) in Hyytiälä in 2010–2011. The dots indicate 5-day mean PAR, mean and minimum ambient temperature and soil temperature for the response measurement campaigns. The CO2 fluxes were averaged daily between 11:00 and 14:00 (day) and 23:00 and 02:00 (night) local normal time.
Seasonality of Photosynthetic and Respiration Parameters
The initial slope of photosynthetic light response (αf) and light-saturated photosynthesis (Psat) followed similar seasonal courses over the time when both parameters could be estimated from the continuous gas exchange data taken in the field (Figure 2A). The field observations show that αf stayed nearly as high as in the summer until early November. The data collected on the occasional sunny days in September and early October also reveal that the saturation of photosynthetic rate is shifted toward lower light in autumn when available radiation is low even on clear days. Clear-sky PPFD incident on a horizontal plane at noon drops below 500 μmol m−2 s−1 in October, after which the rate of light-saturated photosynthesis cannot be estimated from field data any more. However, the stronger saturation of the light response could be distinguished from field data until early November.
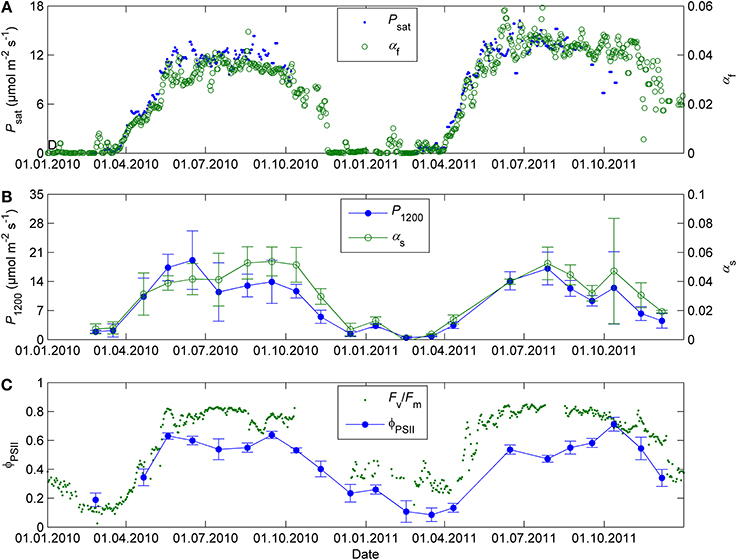
Figure 2. Daily initial slope of photosynthetic light response αf and light-saturated photosynthesis Psat in 2010–2011 estimated from the continuous gas exchange data in the field (A), corresponding parameters αs and P1200 determined using response mesurements in controlled conditions at 18°C and 380 ppm (B), and fluorescence yield in the field conditions (Fv/Fm) and in controlled conditions of 50 μmol m−2 s−1 PAR, 18°C and 380 ppm (ΦPSII) (C). The field gas exchange parameters αf and Psat are means of 2 (2011) or 3 (2010) shoots. The field fluorescence data corresponds to the average maximum nighttime quantum yield of PSII over 3–4 Monitoring PAM heads. The error bars denote standard deviation.
The monthly light response measurements in standard conditions confirmed the change in the light saturation of photosynthesis (results not shown). The initial slope αs remained at summertime level until October and was relatively higher than the capacity of CO2 fixation (P1200) throughout the autumn (Figure 2B). The values of the light response parameters were at their lowest in December 2010 after a very cold spell and in February-March of 2010 and 2011. The end of year 2011 was mild (temperature did not drop below −6°C) and photosynthetic parameters in December were higher than in the end of the previous year, about one fourth of their mean summertime values. There was some potential for photosynthetic production in winter, which was not visible in the field measurements. P1200 in winter was typically in the order of 10% of its average value in June-August. At low light the relative potential (as indicated by the initial slope αs) could be even higher, up to 20% of summertime level (Figure 2B).
The operating quantum yield of fluorescence at 50 μmol m−2 s−1 PAR (ΦPSII, Figure 2C) and the initial slope of photosynthetic light response (αs, Figure 2B) showed similar seasonal patterns and were consistent with the seasonal pattern in the maximum quantum yield of PSII (Fv/Fm) estimated from the field monitoring data (Figure 2C). On the other hand, the high ΦPSII or Fv/Fm in autumn did not correspond to high photosynthetic capacity (P1200 or Psat, Figure 2A).
Biochemical model parameter related to the capacity of light reactions (Jmax) and the capacity of CO2 fixation (Vcmax) showed little differentiation in their seasonal courses compared to the simple light response parameters (Figure 3). The seasonal course of A-Ci slope was slightly different from Vcmax but still inconsistent with P1200 and αs.
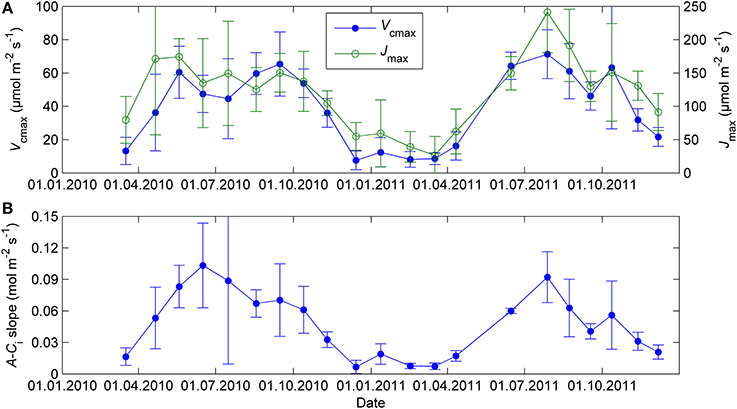
Figure 3. Biochemical model parameters Vcmax and Jmax (A) and the initial slope of A-Ci curve (B) from CO2 response measurements at 18°C and saturating light (1300 μmol m−2 s−1). The error bars denote standard deviation.
The continuous field measurements indicated that the base level of respiration R0, that is, respiration at 0°C, was higher in spring than in summer (Figure 4). The monthly response measurements largely agreed with the continuous data; in both study years R0 peaked in early spring, remained stable from June until September and declined again from late September on. Respiration as well as all photosynthetic parameters at 18°C were near zero in the February 2011 campaign after period of very low temperatures (Tmin = −21°C, Tmin of preceding 5 days = −24°C, Figures 2–4).
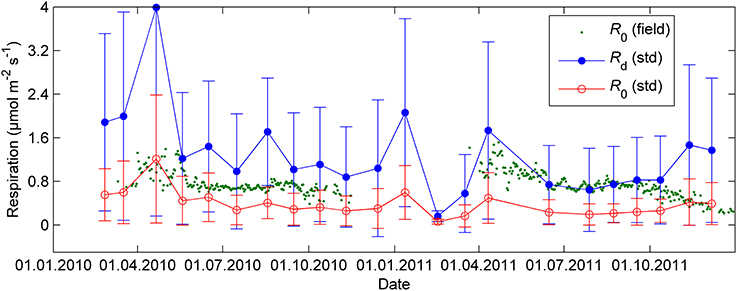
Figure 4. Respiration in 18°C (Rd), exponential relationship (Equation 10 with Q10 = 2) normalized to 0°C (R0, std) and R0 estimated from the automated cuvettes in the field (R0,field) during nights when air temperature was above 0°C. The error bars denote standard deviation.
Relationship Between Temperature and Photosynthetic Parameters
The temperature responses of net CO2 exchange at 800 μmol m−2 s−1 PAR (A800) determined during three response campaigns in 2011 were relatively flat but the optimum was at a lower temperature (12°C) in April than in July and November (16–20°C). When gross photosynthesis (P800) was estimated by adding the measured Rd to the net CO2 exchange, the temperature responses became similar in shape (Figure 5). When photosynthetic capacity is downregulated, estimation of the temperature response of photosynthesis is very sensitive to respiration.
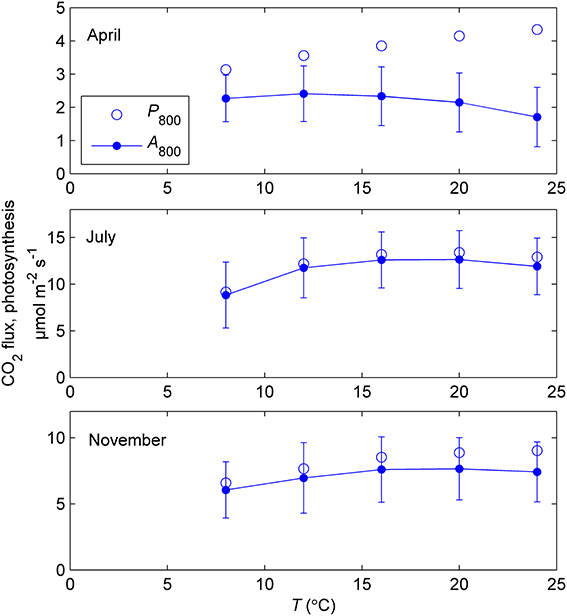
Figure 5. Mean temperature responses of measured net CO2 exchange at 800 μmol m−2 s−1 (A800) and estimated photosynthesis (P800) of 5–6 sample shoots during response measurements in controlled conditions in spring (9–12 April), summer (18–26 July) and late autumn (11–14 November) of year 2011. Photosynthesis was estimated from the net CO2 exchange by adding respiration measured in the dark. The error bars indicate standard deviation of net CO2 exchange. Note the different scales of vertical axes.
The initial slope of the light response (αs) and P1200 in the monthly response measurements showed similar relationships between the prevailing ambient temperature and reference temperature (Figure 6). Relative P1200 had slightly steeper slope of the temperature response than αs. Temperatures below zero were not used in the response measurements but the automatic chamber data indicates steep drop in photosynthetic rate below 0°C and the CO2 exchange signal, including respiration, diminishes at about −5°C (data not shown, see model approximation in Figure 6).
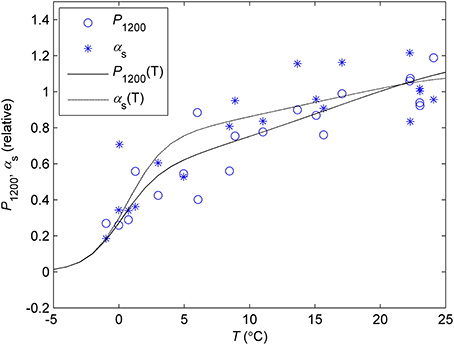
Figure 6. Temperature response of P1200 and αs determined from the light response measurements in controlled conditions. Each symbol corresponds to the monthly value of P1200 or αs determined in prevailing ambient temperature vs. corresponding parameter in the standard temperature (18°C). The lines denote the photosynthetic temperature response model (Equation 7) fitted to P1200 (P(T), solid line) and αs (α(T), dash line). The parameters defining the the response at sub-zero temperatures were fixed to values that make the curve reach zero at −5°C based on the continuous chamber data from several years.
The previously reported sigmoid relationship between photosynthetic capacity parameter β in the optimal stomatal control model (Hari et al., 1986) and state of acclimation S (Kolari et al., 2007) agreed well with the field and the standard temperature parameters in spring (Figures 7, 8). On the other hand, light reaction parameters αs and ΦPSII in standard conditions were lagging the temperature-based prediction in autumn (Figure 8). In both study years the light response parameter values were higher in November than in March although prevailing temperatures were comparable. Furthermore, Fv/Fm in the field was at the same level in December 2010-January 2011 and December 2011 although the latter period was warmer (Figure 1B) and preceded by mild weather. The lowest temperature of autumn 2011 was −6°C whereas in 2010 temperatures near −20°C were experienced already in late November. Fv/Fm and ΦPSII also continued slow decline until March 2011 and showed only weak signs of recovery in April despite the increasing trend in temperature. The difference between normalized αs, αf, ΦPSII and Fv/Fm and the S model prediction was negatively correlated with mean PAR during previous mornings (Figure 9) which suggests that the downregulation during winter is related to light environment rather than driven by temperature alone. The difference between spring and autumn could also be related to minimum temperatures. P1200 and αs at 18°C were always <20% of their respective mean summertime levels when the minimum temperature of previous 24 h was −5°C and >20% when the minimum temperature was >−5°C (not shown).
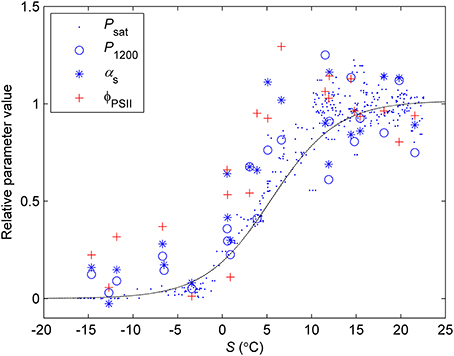
Figure 7. Normalized values of light response parameters vs. state of acclimation S (Equation 8, time constant = 7 days). Psat was estimated in ambient temperature from continuous chamber measurements, P1200 and αs from light response measurements in controlled conditions and standard temperature (18°C). Dash line denotes the sigmoid relationship between Psat/Ci and S from Kolari et al. (2007). The parameter values are relative to the mean value of the respective parameter when 5-day mean temperature >15°C.
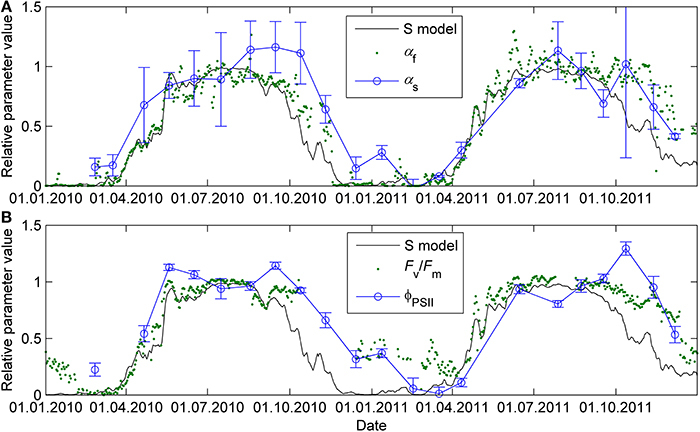
Figure 8. Seasonal courses of relative photosynthetic parameters αf and αs (A) and Fv/Fm and ΦPSII (B) prediction with sigmoid response to the state of acclimation S (Equation 8 and 9, time constant τ = 7 days). The S prediction and parameter values were normalized to interval 0–1 where 0 represents the minimum value of the parameter and 1 the maximum. For parameters determined in standard conditions (αs, ΦPSII), the maximum is the mean parameter value of the respective parameter when 5-day mean air temperature was >15°C.
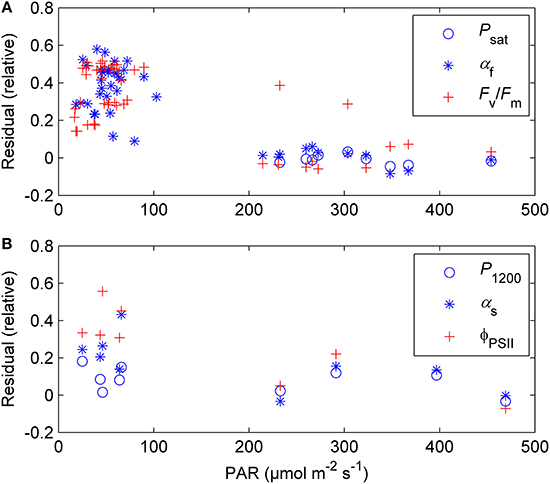
Figure 9. The difference between normalized Psat, αf, and Fv/Fm (A) and P1200, αs, and ΦPSII (B) and the sigmoid S model prediction (Equation 9) as a function of prevailing light conditions (average PAR from sunrise to 12:00 during the day in question and two previous days). The plot comprises days from December through March when daytime (8:00–17:00 local normal time) air temperature was >0°C.
Discussion
Seasonality of Photosynthesis and Respiration
The response measurements in standard conditions indicated a strong downregulation in the photosynthetic machinery toward winter and a recovery in spring. The seasonal patterns of the light response parameters and fluorescence were qualitatively similar to those determined from the continuous field measurements and in line with previous studies at the site (Kolari et al., 2007; Porcar-Castell et al., 2008a; Porcar-Castell, 2011). However, there were some notable differences. First, the response measurements revealed considerable potential for photosynthetic production most of the time in winter, which was not visible in the field measurements. Second, parameters related to light reactions (αs, ΦPSII) remained at nearly summertime level in autumn while carbon reaction-related parameter P1200 declined steadily from August to December.
Photosynthetic parameters obtained in standard conditions in winter were not as close to zero as apparent from the field data, but remained as high as 20% of the respective summertime values. This implies that about 80% of the reduction in momentary photosynthetic rates from summer to winter is attributed to slow changes in the capacity of light and carbon reactions. The rest is due to instantaneous responses that determine how much of the capacity is realized. This finding suggests that boreal evergreen forests would be able to rapidly capitalize from early warm spells. Indeed, wintertime photosynthesis has been observed in various studies on boreal winter-acclimated trees when temperature has been high enough (e.g., Ensminger et al., 2004; Sevanto et al., 2006). Exceptionally, all photosynthetic parameters as well as respiration at 18°C were near zero in the February 2011 campaign which took place immediately after a period of very low temperatures (minimum temperature of previous 5 days was −24°C).
The quantum yield of fluorescence (ΦPSII, Fv/Fm) and the initial slope of photosynthetic light response (αs, αf) had similar seasonal patterns in standard conditions and in the field. Representativeness of fluorescence as indicator of light-saturated photosynthetic capacity was much poorer: the high ΦPSII in autumn did not correspond to high P1200. On the other hand, in spring the parameter values increased in concert in the field and in the standard conditions (Figure 2). Concluding the photosynthetic capacity from chlorophyll fluorescence overestimates the maximum capacity in autumn and early winter. Therefore, it is advisable to address light and carbon reactions separately in modeling and interpretation of empirical data, not only capacity (Jmax, Vcmax, Psat) but also efficiency (α).
The shape of the photosynthetic temperature response in saturating light was similar in spring, summer and autumn although the absolute level varied considerably (Figure 5). In some modeling approaches temperature acclimation shifts the maximum of the response function toward lower temperature (e.g., Kattge and Knorr, 2007). In this study, such approach was not applicable. The response of photosynthetic rate to subzero temperature also calls for improvement to frequently used exponential-like temperature response models to address low-temperature inhibition, for instance, by including an additional term (Collatz et al., 1992, Equation 7). The steep drop in photosynthetic rate below 0°C and the diminishing CO2 exchange signal, including respiration, at about −5°C could be linked with extracellular freezing in the shoots, which takes place few degrees below zero (Brown et al., 1974; Lintunen et al., 2014). Freezing results in the decrease in leaf water potential which inhibits cell metabolism and may cause embolism in water-conducting tissues.
Biochemical photosynthetic model parameters Jmax and Vcmax or A-Ci slope showed a strong seasonal variability in the response measurements. Unlike αs, ΦPSII, and P1200, the biochemical model parameters related to light and carbon reactions followed similar seasonal courses. However, one should be cautious when planning and interpreting A-Ci response measurements on winter-acclimated leaves; the usual assumptions of light and carboxylation limitations at different internal CO2 concentrations might not hold. Furthermore, light and carbon limitations are hard to separate from A-Ci data when the signal is small. A good practice would be to make also light response measurements and analyze them using simple light response models that are more robust with low signal and field data, as presented in this study.
Respiration also showed seasonal acclimation although not as conspicuous as photosynthesis. The field and response measurements were consistent in this parameter except in late autumn 2011 when respiration in the field declined whereas the response measurements showed relatively high rate of respiration. Peak values in the base level of respiration R0 were observed in April, too early to be directly linked with visible growth (Kolari et al., 2009), but they could reflect the biochemical processes related to recovery from winter dormancy and starting of growth. The autumn decline in R0 was consistent with the overall decrease in primary productivity: downregulated photosynthetic machinery requires little energy to maintain the low capacity. Considering the seasonality in the base level of respiration is also important when estimating photosynthetic parameters from field data. The level of respiration rate largely determines the observable CO2 assimilation rate and the shape of the apparent temperature response when the photosynthetic rate is low in winter and early spring.
Environmental Control of Seasonal Acclimation
The seasonality of photosynthetic capacity has been linked to prevailing temperature (Pelkonen and Hari, 1980; Mäkelä et al., 2004). The relationship between temperature and lumped photosynthetic capacity (β) via state of acclimation (S) was formulated by Mäkelä et al. (2004) and the concept further tested by, among others, Mäkelä et al. (2006) and Kolari et al. (2007). The sigmoid β-S relationship by Kolari et al. (2007) predicted well the photosynthetic parameters determined from continuous measurements in the field in spring (Figure 8). However, when the prevailing temperature was low, photosynthetic rate determined in the field underestimated the actual capacity in more favorable conditions. The temperature acclimation derived from the field measurements, thus, results from the instantaneous responses superimposed on the seasonal acclimation and overestimates the downregulation of the physiological state.
Temperature acclimation explained the recovery in spring better than the downregulation in autumn and winter (Figure 8). The parameters related to the efficiency of light reactions at low light (α, αs, ΦPSII, Fv/Fm) were considerably higher than the prediction based on temperature acclimation in autumn. Linkosalo et al. (2014) could explain the downregulation of fluorescence yield with temperature history using different model parameterizations for autumn and spring. However, the regulation mechanisms of light and carbon reactions are different, which creates a mismatch between e.g., ΦPSII and Psat during autumn. Light reactions are more sensitive to light but relatively insensitive to temperature. The difference in light-reaction parameter values between the field conditions and 18°C was small (Figures 2, 8) and the response measurements also indicated low instantaneous temperature sensitivity (Figure 6). Since boreal autumns are rather dark, there is little pressure to downregulate the light reactions (Ensminger et al., 2006; Busch et al., 2007) and the downregulation of the light harvesting machinery is not completed until late winter (Porcar-Castell et al., 2008a; Porcar-Castell, 2011). Carbon fixation is solely controlled by biochemical reactions, thus, it is more sensitive to temperature and the capacity also largely follows the prevailing temperature. Indirect regulation (sink limitation) may also contribute to the decline in photosynthetic rate and capacity in autumn. The different observed patterns in light and carbon limitation were consistent with the environmental conditions if we consider resource allocation in the photosynthetic machinery: low light in autumn is utilized efficiently whereas high maximum capacity is not needed and Psat appears to be low. The ability of photosynthesize during warm spells, efficient photosynthesis at low light, and downregulated respiration are important for the trees to avoid excessive carbon loss during winter (Baldocchi, 2008; Piao et al., 2008; Vesala et al., 2010). On the other hand, the contribution of photoperiod to the photosynthetic capacity can limit the carbon uptake potential in warm winters (Bauerle et al., 2012).
We found that photosynthetic capacity in Scots pine varies seasonally much more than the base level of respiration (Figures 2–4). The strong seasonality of photosynthetic parameters in the boreal zone was also reported in many earlier studies (e.g., Leverenz and Öquist, 1987; Mäkelä et al., 2004). However, Gea-Izquierdo et al. (2010) found a decreasing trend in the magnitude and increase in the rate (smaller time constant τ) of photosynthetic acclimation across climatic gradient from northern boreal to temperate zone. In other words, the instantaneous temperature response dominates over slow temperature acclimation in the south. Ow et al. (2010), in turn, reported stronger acclimation in respiration than in photosynthesis for Pinus radiata at a site where lowest temperatures of the year were barely below 0°C. The relationship between photosynthetic capacity and temperature evidently depends on the range of seasonal variability in temperature, especially on the low end of the range, as apparent physiological activity ceases at about −5°C. Freezing could explain why the temperature acclimation is so much stronger in the north than in the south. Recovery from freezing-induced embolism as well as cold or frozen soil can bring additional slowness to the spring recovery of photosynthesis (Bergh et al., 1998).
Conclusions
The seasonal patterns of photosynthesis and respiration result from instantaneous responses superimposed on seasonal acclimation. The measurements in controlled conditions revealed that notable residual photosynthetic capacity remained during winter especially in the light reactions of photosynthesis, which suggests that boreal trees are able to promptly utilize warm spells or milder winters in the changing climate. The base level of respiration also followed the decreasing trend in photosynthetic capacity in autumn.
The seasonal patterns of light and carbon reactions and respiration were different which implies that they should be considered separately. In addition to estimating capacity parameters (e.g., Jmax) it is important to consider the efficiency of light reactions (α). Chlorophyll fluorescence overestimated the level of light-saturated photosynthesis in autumn and early winter.
Slow temperature acclimation explained well the recovery of photosynthetic parameter values in spring whereas the decline of light reaction parameters in autumn and especially the final stages of the downregulation during winter could be linked with light rather than temperature. Minimum temperature might be another decisive factor in the seasonal acclimation of photosynthesis and it can explain the observed differences in the photosynthetic temperature acclimation between boreal and temperate trees. More attention should be paid to low-temperature responses in models. Furthermore, physiological responses in models describing soil-vegetation-atmosphere interactions are predominantly instantaneous responses (Smith and Dukes, 2013). Our results show that to be able to predict photosynthesis and respiration in more variable environmental conditions and more extreme seasonal dynamics, it is important to address both instantaneous responses and slow changes in the photosynthetic state. The importance is pronounced when considering climatic warming scenarios
Conflict of Interest Statement
The authors declare that the research was conducted in the absence of any commercial or financial relationships that could be construed as a potential conflict of interest.
Acknowledgments
This work was supported by the Academy of Finland Centre of Excellence program (project number 1118615, 272041) and Integrated Carbon Observation System (ICOS, project number 271878). Eija Juurola was partly funded by the HENVI unit of the University of Helsinki project. We also thank Annikki Mäkelä for giving comments on this study.
References
Altimir, N., Vesala, T., Keronen, P., Kulmala, M., and Hari, P. (2002). Methodology for direct field measurements of ozone flux to foliage with shoot chambers. Atmos. Environ. 36, 19–29. doi: 10.1016/S1352-2310(01)00478-2
Baldocchi, D. D. (2008). Breathing of the terrestrial biosphere: lessons learned from a global network of carbon dioxide flux measurement systems. Aust. J. Bot. 56, 1–26. doi: 10.1071/BT07151
Bauerle, W. L., Oren, R., Way, D. A., Qian, S. S., Stoy, P. C., et al. (2012). Photoperiodic regulation of the seasonal pattern of photosynthetic capacity and the implications for carbon cycling. Proc. Natl. Acad. Sci. U.S.A. 109, 8612–8617. doi: 10.1073/pnas.1119131109
Pubmed Abstract | Pubmed Full Text | CrossRef Full Text | Google Scholar
Bergh, J., McMurtrie, R. E., and Linder, S. (1998). Climatic factors controlling the productivity of Norway spruce: a-model-based analysis. Forest Ecol. Manag. 110, 127–139. doi: 10.1016/S0378-1127(98)00280-1
Brown, M. S., Pereira, E. S. B., and Finkle, B. (1974). Freezing of nonwoody plant tissues. Plant Physiol. 53, 709–711. doi: 10.1104/pp.53.5.709
Pubmed Abstract | Pubmed Full Text | CrossRef Full Text | Google Scholar
Busch, F., Hüner, N. P. A., and Ensminger, I. (2007). Increased air temperature during simulated autumn conditions does not increase photosynthetic carbon gain but affects the dissipation of excess energy in seedlings of the evergreen conifer Jack Pine. Plant Physiol. 143, 1242–1253. doi: 10.1104/pp.106.092312
Pubmed Abstract | Pubmed Full Text | CrossRef Full Text | Google Scholar
Collatz, G. J., Ribas-Carbo, M., and Berry, J. A. (1992). Coupled photosynthesis-stomatal conductance model for leaves of C4 plants. Aust. J. Plant Physiol. 19, 519–538. doi: 10.1071/PP9920519
Ensminger, I., Busch, F., and Hüner, N. P. A. (2006). Photostasis and cold acclimation: sensing low temperature through photosynthesis. Physiol. Plantarum 126, 28–44. doi: 10.1111/j.1399-3054.2006.00627.x
Pubmed Abstract | Pubmed Full Text | CrossRef Full Text | Google Scholar
Ensminger, I., Sveshnikov, D., Campbell, D. A., Funk, C., Jansson, S., Lloyd, J., et al. (2004). Intermittent low temperatures constrain spring recovery of photosynthesis in boreal Scots pine forests. Glob. Change Biol. 10, 995–1008. doi: 10.1111/j.1365-2486.2004.00781.x
Farquhar, G. D., von Caemmerer, S., and Berry, J. A. (1980). A biochemical model of photosynthetic CO2 assimilation in leaves of C3 species. Planta 149, 78. doi: 10.1007/BF00386231
Pubmed Abstract | Pubmed Full Text | CrossRef Full Text | Google Scholar
Gea-Izquierdo, G., Mäkelä, A., Margolis, H., Bergeron, Y., Black, T. A., Dunn, A., et al. (2010). Modeling acclimation of photosynthesis to temperature in evergreen conifer forests. New Phytol. 188, 175–186. doi: 10.1111/j.1469-8137.2010.03367.x
Pubmed Abstract | Pubmed Full Text | CrossRef Full Text | Google Scholar
Genty, B., Briantais, J.-M., and Baker, N. R. (1989). The relationship between the quantum yield of photosynthetic electron transport and quenching of chlorophyll fluorescence. Biochim. Biophys. Acta 990, 87–92. doi: 10.1016/S0304-4165(89)80016-9
Öquist, G., and Hüner, N. P. A. (2003). Photosynthesis of overwintering evergreen plants. Annu. Rev. Plant Biol. 54, 329–355. doi: 10.1146/annurev.arplant.54.072402.115741
Pubmed Abstract | Pubmed Full Text | CrossRef Full Text | Google Scholar
Hari, P., Keronen, P., Bäck, J., Altimir, N., Linkosalo, T., Pohja, T., et al. (1999). An improvement of the method for calibrating measurements of photosynthetic CO2 flux. Plant Cell Environ. 22, 1297–1301. doi: 10.1046/j.1365-3040.1999.00478.x
Hari, P., Mäkelä, A., Korpilahti, E., and Holmberg, M. (1986). Optimal control of gas exchange. Tree Physiol. 2, 169–175. doi: 10.1093/treephys/2.1-2-3.169
Pubmed Abstract | Pubmed Full Text | CrossRef Full Text | Google Scholar
Kattge, J., and Knorr, W. (2007). Temperature acclimation in a biochemical model of photosynthesis: a reanalysis of data from 36 species. Plant Cell Environ. 30, 1176–1190. doi: 10.1111/j.1365-3040.2007.01690.x
Pubmed Abstract | Pubmed Full Text | CrossRef Full Text | Google Scholar
Kitajima, M., and Butler, W. L. (1975). Quenching of chlorophyll fluorescence and primary photochemistry in chloroplasts by dibromothymoquinone. Biochim. Biophys. Acta 376, 105–115. doi: 10.1016/0005-2728(75)90209-1
Pubmed Abstract | Pubmed Full Text | CrossRef Full Text | Google Scholar
Kolari, P., Kulmala, L., Pumpanen, J., Launiainen, S., Ilvesniemi, H., Hari, P., et al. (2009). CO2 exchange and component CO2 fluxes of a boreal Scots pine forest. Boreal Environ Res. 14, 761–783.
Kolari, P., Lappalainen, H. K., Hänninen, H., and Hari, P. (2007). Relationship between temperature and the seasonal course of photosynthesis in Scots pine at northern timberline and in southern boreal zone. Tellus B 59, 542–552. doi: 10.1111/j.1600-0889.2007.00262.x
Leverenz, J. W., and Öquist, G. (1987). Quantum yields of photosynthesis at temperatures between –2°C and 35°C in cold-tolerant C3 plant (Pinus sylvestris) during the course of one year. Plant Cell Environ. 10, 287–295. doi: 10.1111/j.1365-3040.1987.tb01608.x
Linkosalo, T., Heikkinen, J., Pulkkinen, P., and Mäkipää, R. (2014). Fluorescence measurements show stronger cold inhibition of photosynthetic light reactions in Scots pine compared to Norway spruce as well as during spring compared to autumn. Front. Plant Sci. 5:264. doi: 10.3389/fpls.2014.00264
Pubmed Abstract | Pubmed Full Text | CrossRef Full Text | Google Scholar
Lintunen, A., Lindfors, L., Kolari, P., Juurola, E., Nikinmaa, E., and Hölttä, T. (2014). CO2 bursts during freezing offer a new perspective on avoidance of winter embolism in trees. Ann. Bot. 114, 1711–1718. doi: 10.1093/aob/mcu190
Pubmed Abstract | Pubmed Full Text | CrossRef Full Text | Google Scholar
Mäkelä, A., Hari, P., Berninger, F., Hänninen, H., and Nikinmaa, E. (2004). Acclimation of photosynthetic capacity in Scots pine to the annual cycle temperature. Tree Physiol. 24, 369–378. doi: 10.1093/treephys/24.4.369
Pubmed Abstract | Pubmed Full Text | CrossRef Full Text | Google Scholar
Mäkelä, A., Kolari, P., Karimäki, J., Nikinmaa, E., Perämäki, M., and Hari, P. (2006). Modelling five years of weather-driven variation of GPP in a boreal forest. Agric. For. Meterol. 139, 382–398. doi: 10.1016/j.agrformet.2006.08.017
Maxwell, K., and Johnson, G. N. (2000). Chlorophyll fluorescence—a practical guide. J. Exp. Bot. 51, 659–668. doi: 10.1093/jexbot/51.345.659
Pubmed Abstract | Pubmed Full Text | CrossRef Full Text | Google Scholar
Nikinmaa, E., Hölttä, T., Hari, P., Kolari, P., Mäkelä, A., Sevanto, S., et al. (2013). Assimilate transport in phloem sets conditions for leaf gas exchange. Plant Cell Environ. 36, 655–669. doi: 10.1111/pce.12004
Pubmed Abstract | Pubmed Full Text | CrossRef Full Text | Google Scholar
Ow, L. F., Whitehead, D., Walcroft, A. S., and Turnbull, M. H. (2010). Seasonal variation in foliar carbon exchange in Pinus radiata and Populus deltoides: respiration acclimates fully to changes in temperature but photosynthesis does not. Glob. Change Biol. 16, 288–302. doi: 10.1111/j.1365-2486.2009.01892.x
Pearcy, R. W. (1990). Sunflecks and photosynthesis in plant canopies. Annu. Rev. Plant Physiol. Plant Mol. Biol. 41, 421–453. doi: 10.1146/annurev.pp.41.060190.002225
Pelkonen, P., and Hari, P. (1980). The dependence of the springtime recovery of CO2 uptake in Scots pine on temperature and internal factors. Flora 169, 398–404.
Pfannschmidt, T. (2003). Chloroplast redox signals: how photosynthesis controls its own genes. Trends Plant Sci. 8, 33–41. doi: 10.1016/S1360-1385(02)00005-5
Pubmed Abstract | Pubmed Full Text | CrossRef Full Text | Google Scholar
Piao, S. L., Ciais, P., Friedlingstein, P., Peylin, P., Reichstein, M., Luyssaert, S., et al. (2008). Net carbon dioxide losses of northern ecosystems in response to autumn warming. Nature 451, 49–52. doi: 10.1038/nature06444
Pubmed Abstract | Pubmed Full Text | CrossRef Full Text | Google Scholar
Pirinen, P., Simola, H., Aalto, J., Kaukoranta, J.-P., Karlsson, P., and Ruuhela, R. (2012). Tilastoja Suomen ilmastosta 1981–2010 (Climatological statistics of Finland 1981–2010). Finn. Meteorol. Inst. Rep. 2012:1, 1–81.
Porcar-Castell, A. (2011). A high-resolution portrait of the annual dynamics of photochemical and non-photochemical quenching in needles of Pinus sylvestris. Physiol. Plantarum 143, 139–153. doi: 10.1111/j.1399-3054.2011.01488.x
Pubmed Abstract | Pubmed Full Text | CrossRef Full Text | Google Scholar
Porcar-Castell, A., Juurola, E., Ensminger, I., Berninger, F., Hari, P., and Nikinmaa, E. (2008a). Seasonal acclimation of photosystem II in Pinus sylvestris. II. Using the rate constants of sustained thermal energy dissipation and photochemistry to study the effect of the light environment. Tree Physiol. 28, 1483–1491. doi: 10.1093/treephys/28.10.1483
Pubmed Abstract | Pubmed Full Text | CrossRef Full Text | Google Scholar
Porcar-Castell, A., Pfündel, E., Korhonen, J. F. J., and Juurola, E. (2008b). A new monitoring PAM fluorometer (MONI-PAM) to study the short and long-term acclimation of photosystem II in field conditions. Photosyn. Res. 96, 173–179. doi: 10.1007/s11120-008-9292-3
Pubmed Abstract | Pubmed Full Text | CrossRef Full Text | Google Scholar
Schreiber, U., Schliwa, U., and Bilger, W. (1986). Continuous recording of photochemical and non-photochemical chlorophyll fluorescence quenching with a new type of modulation fluorometer. Photosyn. Res. 10, 51–62. doi: 10.1007/BF00024185
Pubmed Abstract | Pubmed Full Text | CrossRef Full Text | Google Scholar
Sevanto, S., Suni, T., Pumpanen, J., Grönholm, T., Kolari, P., Nikinmaa, E., et al. (2006). Wintertime photosynthesis and water uptake in a boreal forest. Tree Physiol. 26, 749–757. doi: 10.1093/treephys/26.6.749
Pubmed Abstract | Pubmed Full Text | CrossRef Full Text | Google Scholar
Smith, N. G., and Dukes, J. S. (2013). Plant respiration and photosynthesis in global-scale models: incorporating acclimation to temperature and CO2. Glob. Change Biol. 19, 45–63. doi: 10.1111/j.1365-2486.2012.02797.x
Pubmed Abstract | Pubmed Full Text | CrossRef Full Text | Google Scholar
Tiren, L. (1927). Om barrytans storlek hos tallbestånd. Meddelanden Från Statens Skogsförsöksanstalt 23, 295–336.
Vesala, T., Launiainen, S., Kolari, P., Pumpanen, J., Sevanto, S., Hari, P., et al. (2010). Autumn temperature and carbon balance of a boreal Scots pine forest in Southern Finland. Biogeosciences 7, 163–176. doi: 10.5194/bg-7-163-2010
Keywords: gas exchange, chlorophyll fluorescence, annual cycle, Pmax
Citation: Kolari P, Chan T, Porcar-Castell A, Bäck J, Nikinmaa E and Juurola E (2014) Field and controlled environment measurements show strong seasonal acclimation in photosynthesis and respiration potential in boreal Scots pine. Front. Plant Sci. 5:717. doi: 10.3389/fpls.2014.00717
Received: 31 August 2014; Accepted: 28 November 2014;
Published online: 12 December 2014.
Edited by:
Heikki Hänninen, University of Helsinki, FinlandReviewed by:
Kadmiel Maseyk, The Open University, UKRubén Retuerto, Universidad de Santiago de Compostela, Spain
Copyright © 2014 Kolari, Chan, Porcar-Castell, Bäck, Nikinmaa and Juurola. This is an open-access article distributed under the terms of the Creative Commons Attribution License (CC BY). The use, distribution or reproduction in other forums is permitted, provided the original author(s) or licensor are credited and that the original publication in this journal is cited, in accordance with accepted academic practice. No use, distribution or reproduction is permitted which does not comply with these terms.
*Correspondence: Pasi Kolari, Department of Physics, University of Helsinki, PO Box 48 (Erik Palménin aukio 1), 00014 Helsinki, Finland e-mail: pasi.kolari@helsinki.fi