 Eduardo Dias de Oliveira1,2†
 Jairo A. Palta1,2*
 Helen Bramley3,4†
 Katia Stefanova3
 Kadambot H. M. Siddique3
- 1CSIRO Agriculture Flagship, Wembley, WA, Australia
- 2School of Plant Biology, Faculty of Natural and Agricultural Sciences, The University of Western Australia, Crawley, WA, Australia
- 3The UWA Institute of Agriculture, The University of Western Australia, Crawley, WA, Australia
- 4Plant Breeding Institute, Faculty of Agriculture and Environment, The University of Sydney, Narrabri, NSW, Australia
Elevated CO2 often increases grain yield in wheat by enhancing grain number per ear, which can result from an increase in the potential number of florets or a reduction in the death of developed florets. The hypotheses that elevated CO2 reduces floret death rather than increases floret development, and that grain size in a genotype with more grains per unit area is limited by the rate of grain filling, were tested in a pair of sister lines contrasting in tillering capacity (restricted- vs. free-tillering). The hypotheses were tested under elevated CO2, combined with +3°C above ambient temperature and terminal drought, using specialized field tunnel houses. Elevated CO2 increased net leaf photosynthetic rates and likely the availability of carbon assimilates, which significantly reduced the rates of floret death and increased the potential number of grains at anthesis in both sister lines by an average of 42%. The restricted-tillering line had faster grain-filling rates than the free-tillering line because the free-tillering line had more grains to fill. Furthermore, grain-filling rates were faster under elevated CO2 and +3°C above ambient. Terminal drought reduced grain yield in both lines by 19%. Elevated CO2 alone increased the potential number of grains, but a trade-off in yield components limited grain yield in the free-tillering line. This emphasizes the need for breeding cultivars with a greater potential number of florets, since this was not affected by the predicted future climate variables.
Introduction
Atmospheric CO2, ambient temperature and rainfall are environmental variables predicted to change in Mediterranean-type environment in the in the 21st century with climate change (Ragab and Prudhomme, 2002; Asseng et al., 2004). Rainfall in particular, is predicted to decrease when wheat crops enter the reproductive growth (terminal drought), reducing grain yield (Ludwig and Asseng, 2006; Turner et al., 2011). In a previous study, grain yield in a free-tillering wheat line, with the potential to increase sink capacity, did not differ from its isogenic restricted-tillering line, with lower sink capacity. This was because the free-tillering line increased grain number per unit area due to elevated CO2, but had smaller grains (Dias de Oliveira et al., 2015), presumably due to the negative correlation between grain number per unit area and grain size (Grafius, 1972). Increasing grain number in wheat is considered critical for improving grain yield (Fischer and Aguilar, 1976; Fischer, 1985, 2011), but it is also likely that grain yield improvement may be limited by grain size (Grafius, 1972; Rajaram and Ginkel, 1996; Acreche and Slafer, 2006). Understanding the mechanisms determining grain number per unit area and grain size is, therefore, important in simultaneously increasing both yield components (Reynolds et al., 2009; Fischer, 2011; Ferrante et al., 2013b).
Grain number per unit area in wheat is determined by ear number per unit area and number of grains per ear. Final grain number per ear is highly affected by the availability of assimilates before anthesis, since modern cultivars set more than 90% of the potential grains at anthesis (Siddique et al., 1989). Reduction of assimilates before anthesis due to heat and water stress, and nitrogen deficiency reduces potential grain number at anthesis (Calderini et al., 2001; Ferrante et al., 2013a). In contrast, increased availability and distribution of carbon assimilates increases yield potential (Slafer, 2003; Reynolds et al., 2009). Elevated CO2 increases the assimilation of carbon in wheat (Habash et al., 1995) and presumably the availability of carbon assimilates for floret development (Marc and Gifford, 1984), potential grain number, and hence, more grains per unit area. Elevated CO2 often increases grain number per ear, possibly due to increased floret production and/or a reduction in floret death (Musgrave and Strain, 1988; Manderscheid and Weigel, 1997; Dias de Oliveira et al., 2013, 2015). However, in some cases no CO2 effect on grain number per ear have been reported (Högy et al., 2009, 2013), presumably reflecting genotypic variability to treatment. The amount of carbon assimilates needed to produce florets is almost insignificant compared with the amount needed to sustain their growth and development (Kirby, 1988; Ferrante et al., 2013a). This implies that increasing the availability of carbon assimilates should benefit floret survival rather than floret production.
This study aimed to determine the mechanisms by which grain number increased in the main stem of wheat when grown under elevated CO2, warmer average temperatures and terminal drought, which are the predicted conditions of future climates in the wheat-growing regions of Australia. It also aimed to understand the mechanism responsible for reducing grain weight (yield component compensation) in two sister lines of wheat contrasting in tillering capacity and hence, in grain number per unit area. Two hypotheses were tested: (i) elevated CO2 increases grain number per ear by reducing the rate of floret mortality due to the availability of more carbon assimilates to support competent florets, and not by increasing the maximum number of florets produced; (ii) the rate of grain filling in a free-tillering line is slower than in a restricted-tillering line, resulting in smaller grains in the line with more grain per unit area. To test these hypotheses, two sister lines of wheat contrasting in tillering were grown under elevated CO2 (700 μL L-1), +3°C above ambient temperature and terminal drought conditions in poly tunnels, and the dynamics of tillering, floret, and grain development was monitored.
Materials and Methods
Location
A field experiment was conducted between May and November 2012 at The University of Western Australia’s (UWA), field Research Station at Shenton Park (31° 57′S, 115° 45′E), Western Australia. The site is located in an area with a long-term average rainfall (80 years) of 710 mm for the May–November growing season. The soil is a free-draining infertile Spearwood clayey sand (McArthur and Bettenay, 1974) consisting of brown, fine sandy clay with less than 1% organic matter. The pH, measured in a 1:5 suspension of soil in 0.01 M CaCl2, was 5.1–6.8 in the surface 0–10 cm and 4.1–4.5 in lower layers of the soil profile.
Plant Material
A pair of sister lines of wheat (Triticum aestivum L.), representing contrasting genotypes for tillering capacity (free tillering and restricted tillering), were used in this study. The lines 7750N (free tillering) and 7750PF (restricted tillering), selected by Dr G Rebetzke at CSIRO Plant Industry, were F5-derived, sister lines for restricted tillering in a Lang genetic background (Wyalkatchem//3∗Silverstar/971/3/Lang). The pair of sister lines were grown in the field under four poly tunnels in a completely randomized design with elevated CO2, high temperature and terminal drought in all combinations in a split-plot design within each poly tunnel. One day before seeding, the 20 plots (1.0 m × 0.75 m) in each poly tunnel were cultivated by hand to a depth of 6 cm using a wide rake. Plants of each sister line (10 plots per line) were sown by hand to attain a density of 150 plants m-2 on 21 May 2012. The equivalent of 60 kg N ha-1 as urea, 75 kg P ha-1 as amended superphosphate (with Cu, Zn, Mo, S) and 55 kg K ha-1 as KCl was buried with the seed. A top-dressing application of 33 kg N, 38 kg P, and 28 kg K ha-1 was made when plants were at the 3–4 leaf stage (Z13–Z14; Zadoks scale of growth; Zadoks et al., 1974). An additional application of N as urea was made at the end of stem elongation (Z39) at a rate of 50 kg N ha-1.
Natural Light-Controlled Temperature, CO2 and Irrigation Field Facilities (NL-CTCI)
Details of the NL-CTCI facilities were described in Dias de Oliveira et al. (2013). Briefly, the NL-CTCI consist of four poly tunnels, each of 10 m long × 2.5 m wide × 2.75 m tall, supported by a steel frame covered with a double sheet of F-clean greenhouse film (200 mm; AGC Chemicals Americas, Inc. Exton, PA, USA). Air flow through each tunnel was provided by a CPD 0454 FHP multi-speed fan (Fantech, Melbourne, VIC, Australia), which moved the outside air through a cardboard radiator window mounted in the opposite wall of the tunnel. The fan speed was varied to maintain a set temperature inside the tunnel, monitored with a Techni-temp Resistant Thermometer Detector (Technitemp, Kewdale, WA, Australia; model TWA 27708) at the end of the tunnel. Certified CO2 gas was pulsed from a gas vessel (BOC Special Gasses, Chatswood, NSW, Australia) through a finely perforated plastic hose connected to a solenoid valve in the inlet stream of each tunnel. The rate of solenoid valve pulse was determined by measuring the CO2 level in the outlet stream of the tunnel, using a GAS-CO2-002-K infrared gas analyzer (Gas Alarm System, Sydney, NSW, Australia). CO2 concentration inside the tunnels was maintained at 700 μL L-1 with no discernible gradients of CO2 or temperature along the tunnels at any time. When a tunnel was set to ambient CO2 and temperature, the fan moved air though the tunnel with CO2 concentrations from outside of ∼390 mL L-1 and fan speed was determined by continuously monitoring air temperature outside the tunnel. A system of drippers disposed in rows irrigated the plots within each tunnel, with the capacity to release 2 L m-2 h-1.
Experimental Design and Treatment Structure
A randomized complete block design was used to address the objectives of the study and reflect the treatment structure.
Each poly tunnel served as a combination of CO2 and temperature regime, as follows:
(1) Ambient CO2 (390–400 μL L-1) + ambient temperature (ACO2 + AT)
(2) Ambient CO2 (390–400 μL L-1) + 3°C above ambient temperature (ACO2 + HT)
(3) Elevated CO2 (700 μL L-1) + ambient temperature (ECO2 + AT)
(4) Elevated CO2 (700 μL L-1) + 3°C above ambient temperature (ECO2 + HT).
The poly tunnel comprised of 20 plots arranged in a rectangular array of 2 columns by 10 rows. Each column within a tunnel was randomly allocated to a different water regime from anthesis (watered or water stressed). The 10 plots within each column were completely randomly assigned to one of the two sister lines, producing five replicates per sister line for each of the treatment combinations. Plots inside each tunnel were irrigated every 2–3 days by drip irrigation to maintain soil water content close to field capacity until 50% anthesis. At anthesis irrigation was withheld from half of the plots in each poly tunnel house (10 plots; 5 per sister line) to induce terminal drought. The other half of the plots (10 plots; 5 per sister line) was maintained under irrigation until physiological maturity (well-watered). Well-watered and droughted plots were separated by a vertical plastic barrier buried to 1.2 m in the soil profile to prevent lateral movement of water from the well-watered to the droughted plots. The well-watered plots received approximately 450 mm m-2 of water during the whole season (similar to the 1995–2014 rainfall average for this location).
Sampling and Measurements
The dates of the developmental stages (phenostages) for anthesis and physiological maturity (flag leaves had turned yellow; Hanft and Wych, 1982) were recorded for each plot in each poly tunnel. Daily observations were made and the phenostage noted when 50% of the plants in each plot had achieved the particular stage. Phenostages were defined using the Zadoks’ scale of cereal development (Zadoks et al., 1974). Comparisons between lines in each pair were made in days after sowing (DAS).
The measurements taken in time for each response variable allowed non-linear curve fitting modeling of the plant dynamics. The notation used in each of the curve formulae presented below denotes the response variable y as a function of thermal time after sowing or anthesis, the latter denoted as x. Thermal time is the accumulated temperature at which plant growth responds to the Zadoks’ phenostages.
Production of stems was recorded in five uniform plants per plot, averaged and treated as one replicate (n = 5). To identify order of emergence, the main stem and tillers were each labeled with a thin plastic ring (drinking straw) of differing color. Tillering dynamics for both lines were modeled by a quadratic-by-quadratic curve, which accounted for 90.6% of the variation.
The number of florets in spikelets 8 and 10, the mid-ear for most wheat genotypes (Bancal, 2009), were counted every 4 days from the beginning of stem elongation (Z3.1). This stage coincided with the beginning of floret development and terminal spikelet formation. On each occasion, ears from three main stems were sampled from each plot (averaged and treated as one replicate, n = 5) in each poly tunnel, dissected under a stereoscopic microscope and the number of florets counted. Ears were then oven-dried for 48 h at 70°C and weighed. The timing of floret primordia development was fitted using equation (1), which accounted for 75% of the variation from the beginning of stem elongation (Z3.1) until anthesis. The development of ears followed asymmetric asymptote growth curves, which accounted for 89.0% of the variation, were best fitted by Gompertz sigmoid function
Three main stems per plot (averaged and treated as one replicate, n = 5) in each poly tunnel were randomly selected and tagged at the booting stage (Z4.1) for measurements of flag leaf length and ear peduncle length. Measurements were made with calipers every 2 days to determine their growth rates. Flag leaves were measured after completely unfolding, and peduncles were measured after complete ear emergence. The best fit for flag leaf expansion and peduncle extension in both sister lines was obtained using Gompertz curve (2), which accounted for 98 and 99% of the variation, respectively.
Anthesis on the main stem was recorded by daily observation in each plot in each poly tunnel and the peduncles of ears with extruded anthers from their central spikelets were tagged for grain growth measurements. A section of plastic straw cut longitudinally was used to tag the peduncles. Different colors were used for different days so that the day of anthesis could be recognized for each ear. Measurements were made on ears with the same number of days after anthesis, but data were plotted versus thermal time (°C d). Ears from three main stems per plot (averaged and treated as one replicate, n = 5) were sampled first at anthesis and every 4 days after anthesis (DAA), until 36 DAA. Ears were dissected and grains from spikelets 8 and 10 were sampled and weighed after oven-drying for 48 h at 70°C. Asymmetric asymptotes of grain growth curves were best fitted using equation (2), which accounted for 93% of variation. Lag phase duration of grain growth was calculated as a percentage of total grain growth time as in Loss et al. (1989).
Leaf net photosynthesis and transpiration rates of four flag leaves per plot (averaged and treated as one replicate, n = 5) were measured using a portable CIRAS-II open gas exchange system (PP Systems, Amesbury, MA, USA). Measurements were made from 50% anthesis at 5–6 days intervals between 10:30 and 13:30 using natural light on cloud-free days, when PPFD was above 900 mmol m-2 s-1, the level at which photosynthesis is saturated in wheat (Austin, 1990; Henson et al., 1990). The temperature and CO2 concentration used in gas exchange measurements were set the same as the respective poly tunnel, with the CO2 concentration maintained by the CO2 cartridge. Air-flow in the CIRAS chamber was 200 mL min-1 and the vapor pressure deficit was between 0.7 and 1.2 kPa. Transpiration efficiency (TE; μmol CO2 mmol H2O-1) was calculated as the ratio of the rate of net leaf photosynthesis divided by leaf transpiration rate.
Grain yield and yield components were measured at final harvest by sampling 25 plants per plot in each poly tunnel. Plants in each plot were assigned randomly with plants from edge rows not sampled to avoid edge effects. Plants were harvested by cutting the shoots at the surface of the soil. Plant material was separated into stems and ears, oven-dried at 70°C for at least 48 h, and then weighed. Ears were counted and threshed by hand, and grain was re-dried and weighed. Grain number was counted, and the mean individual grain weight determined for each sample. Harvest index (HI) was calculated as total grain yield divided by total aboveground biomass.
Experimental Design and Statistical Analysis
The experimental design was a four-factorial complete randomized split-plot design, comprising two levels of CO2 (ambient and elevated) and two temperatures (ambient and ambient +3°C), with 10 replicates within each environment (poly tunnel) until anthesis and five replicates after anthesis. Each poly tunnel house had a split-plot combination of watering regimes (main plot; terminal drought; and well-watered) and contrasting lines (sub-plot; free–tillering and restricted-tillering lines). Grain yield and yield components were analyzed using linear mixed models techniques, accounting for the split-plot design. The results focus on the significant main and interaction effects of treatment factors and the presented tables show results only for these sources of variation (either, interactions or main effects). The repeated measures of net photosynthesis and leaf transpiration rate over thermal time (accumulation of daily temperature averages) were analyzed using generalized linear models in combination with additive linear models, where polynomial functions of time were added. In addition to the linear component of time, quadratic and, for some models, cubic components were fitted. The model with best fit was that which accounted for the biggest percentage of variance. Curve fitting was used for analysis of tillering dynamics, flag leaf, and peduncle extension, number of florets per spikelet, and ear and grain growth over thermal time. Thermal time (as the independent variable) along with a grouping factor was included in the model. The grouping factor had eight levels, combining three factors: CO2 concentration, temperature and watering regime. The curves were fitted separately for each genotype. Data were analyzed using GenStat 15 (VSN International Ltd, UK). Figures were made using GraphPad Prism 5.0 (GraphPad Software Inc., San Diego, CA, USA).
Results
Phenology
There was no difference between lines (P = 0.467) in time to anthesis, which averaged 83 DAS under ambient conditions. However, time to anthesis was affected by a CO2 × temperature interaction (P = 0.005), where elevated CO2 reduced the time to anthesis by 2 days under ambient temperature only. At physiological maturity there were no significant interactions (P = 0.152–0.911). Both lines reached physiological maturity by 111 DAS under ambient conditions (P = 0.823). The combination of elevated CO2 + high temperature reduced time to physiological maturity by 6 days, while terminal drought reduced time to physiological maturity by 10 days (P < 0.001 for all).
Tiller Dynamics
Although the number of tillers were greatly different, the free-tillering line had significantly more tillers than the restricted-tillering line under all conditions. The tillering dynamic of each sister line was affected by CO2 × temperature (P = 0.001; Figure 1). Furthermore, elevated CO2 affected tillering dynamics in the free-tillering line regardless of temperature, but had no effect in the restricted-tillering line. Elevated CO2 increased tiller growth rate (∼0.0042% more tillers per °C d) and maximum number of tillers (35% more tillers) in the free-tillering line, but did not affect the rate of tiller death (tillers formed, but did not survive). Therefore, the free-tillering plants grown under elevated CO2 maintained one more tiller than plants grown under ambient CO2 even after flowering (P = 0.008; Figure 1). Temperatures +3°C above ambient also increased the rate of tiller development in the free-tillering line, such that when tiller number reached its maximum (approximately 1000°C d), there were on average 0.25 more tillers than under ambient temperature.
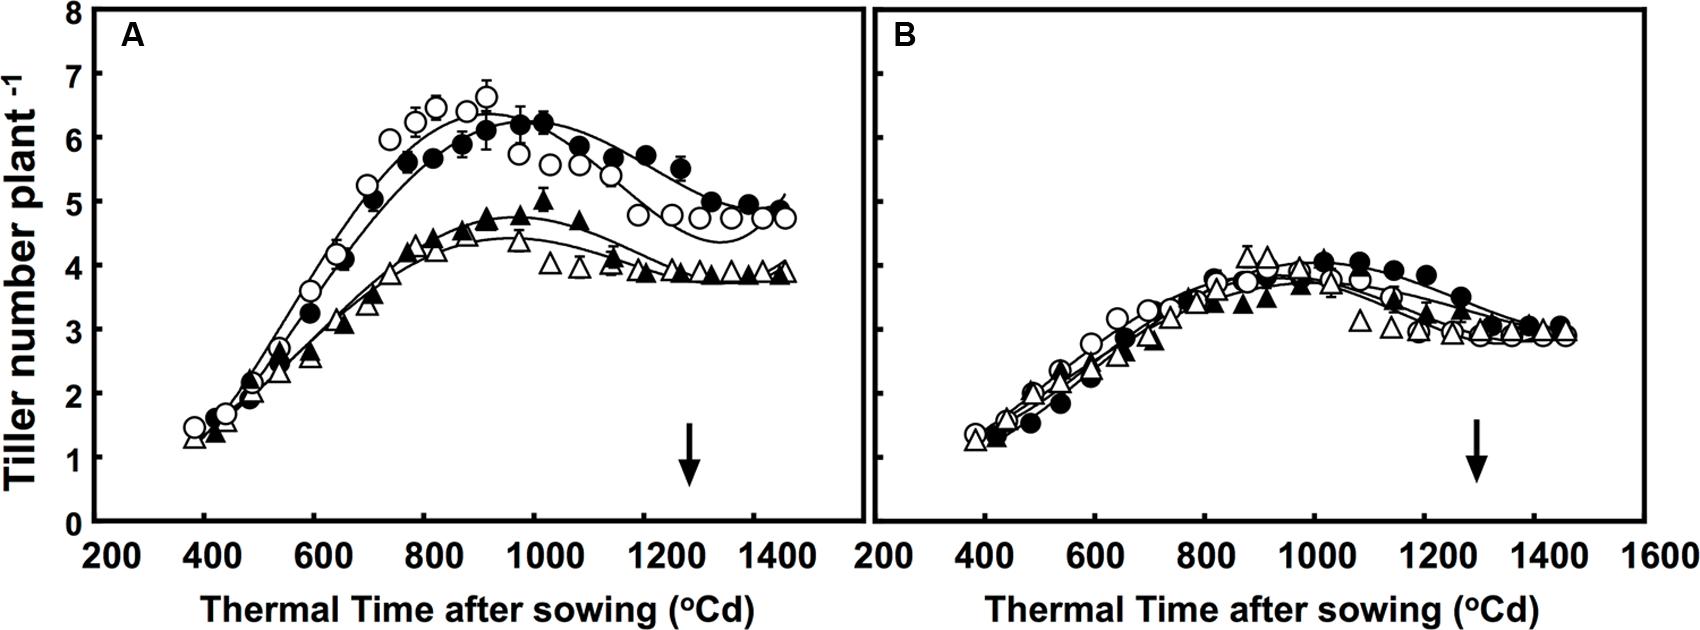
FIGURE 1. Dynamics of tillering in the (A) free-tillering (FT) and (B) restricted-tillering (RT) sister lines. Black triangles = ACO2 + HT; white triangles = ACO2 + AT; black circles = ECO2 + HT; and white circles = ECO2 + AT. Arrows indicate time of anthesis. Each point is mean ± SEM of 10 replicates.
Number of Florets
Elevated CO2 concentration reduced floret death, increasing the number of competent florets in both lines at anthesis by on average 42% (P < 0.001). Moreover, after reaching their maximum in all treatments at around 925°C d, different interactions affected death rates of the florets. These interactions were CO2 × temperature × thermal time (P = 0.004), and temperature × sister line (P = 0.015; Figures 2A,B). To simplify, the number of florets increased faster under +3°C above ambient in the restricted-tillering line only. In the first interaction, floret death rates under high temperature in the restricted-tillering line was higher than in the free-tillering line. In the second interaction, high temperature increased floret death under ambient CO2 more than under elevated CO2 in both lines.
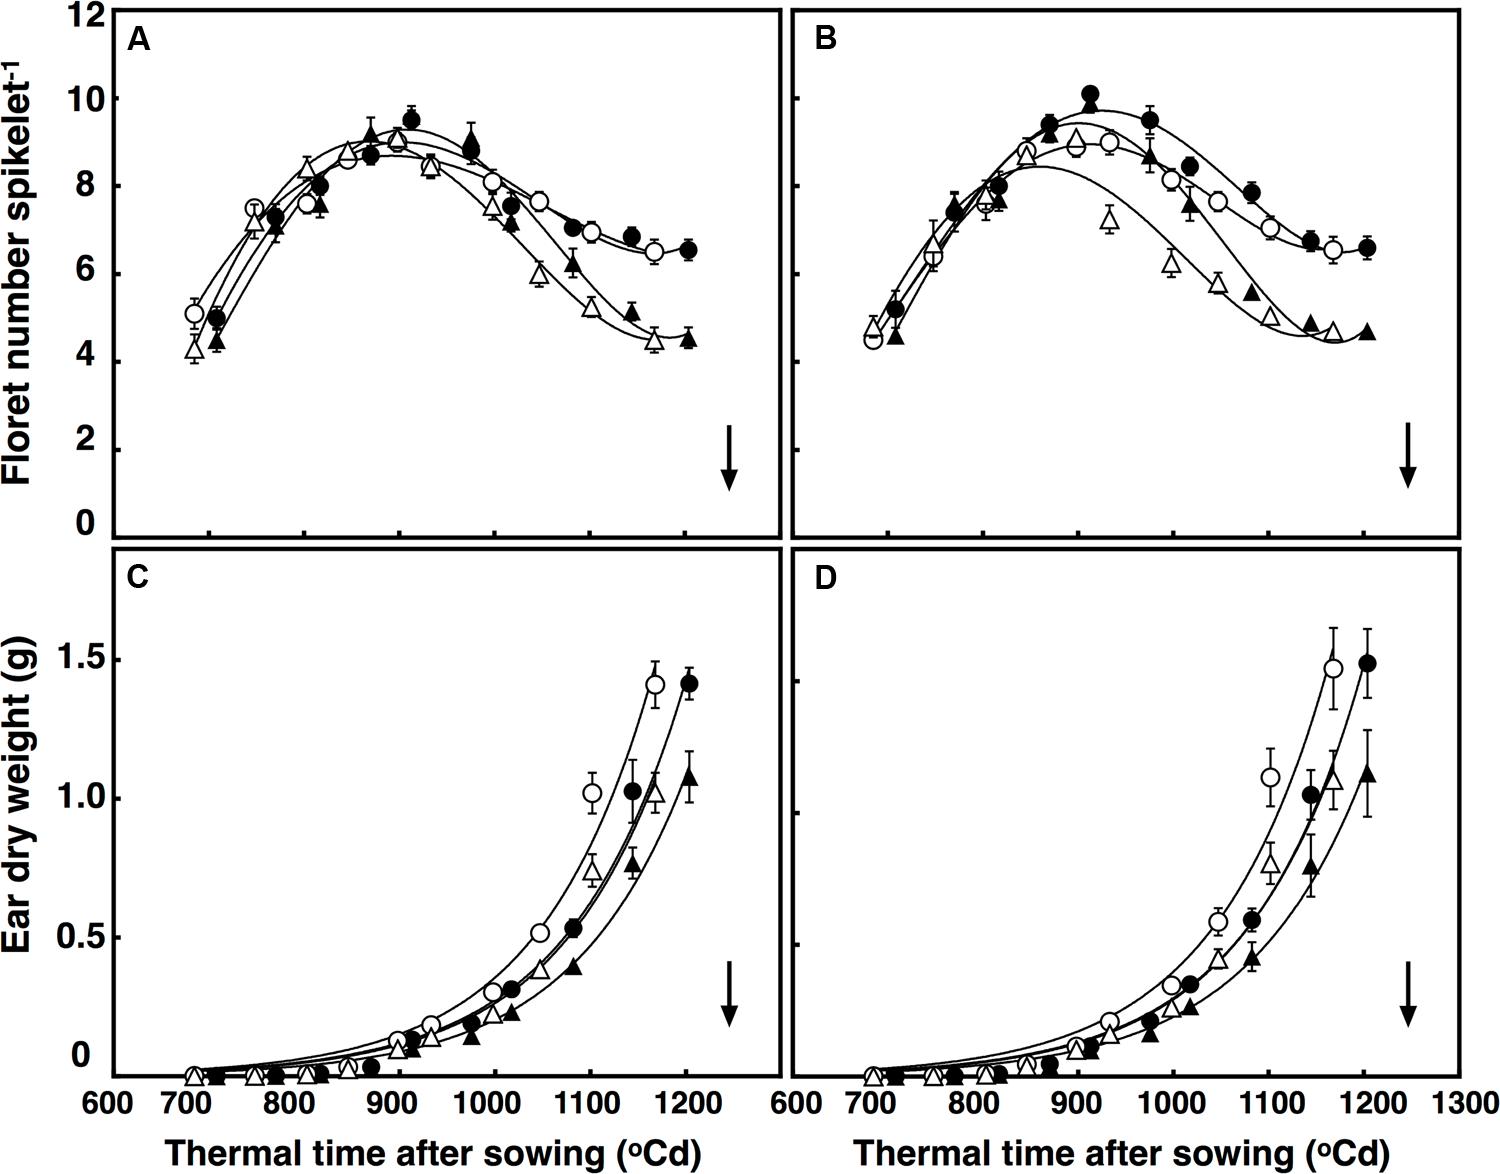
FIGURE 2. Development of florets per spikelet (A,B) and ear dry weight (C,D) in (A) free-tillering and (B) restricted-tillering lines. Black triangles = ACO2 + HT; white triangles = ACO2 + AT; black circles = ECO2 + HT; and white circles = ECO2 + AT. Arrows indicate time of anthesis. Each point is mean ± SEM of 10 replicates.
Ear Growth
Maximum growth rate of ears was synchronous with death of primordial florets in both sister lines (Figure 2). There was a significant interaction of thermal time × sister line on ear growth (P = 0.03). Ears at 800°C d (around 1 cm stage) did not differ in dry weight between the two sister lines, but the rate of ear growth was faster in the restricted- than in the free-tillering line. By anthesis, ear weight in the restricted-tillering line was 9.3% greater than in the free-tillering line (Figures 2C,D). A significant interaction of thermal time × CO2 also affected the growth of the ears (P < 0.001). Elevated CO2 increased ear weight at anthesis by 37.5% on average across both contrasting lines (Figures 2C,D).
Flag Leaf and Peduncle Extension
There was a three-factor interaction of thermal time × temperature × CO2 (P = 0.014) for flag leaf expansion. The rate of flag leaf extension (∼0.35 cm per °C d) in both lines was similar regardless of CO2 concentration and temperature, but flag leaves continued expanding for ∼25°C d under elevated CO2, resulting in leaves 4 cm longer (Figures 3A,B). Flag leaves under high temperature expanded at the same rate regardless of CO2 concentration, but duration of the expansion was longer under elevated CO2 than ambient CO2 (27°C d). Therefore, flag leaves under high temperature were on average 5 cm longer under elevated CO2 than under ambient CO2.
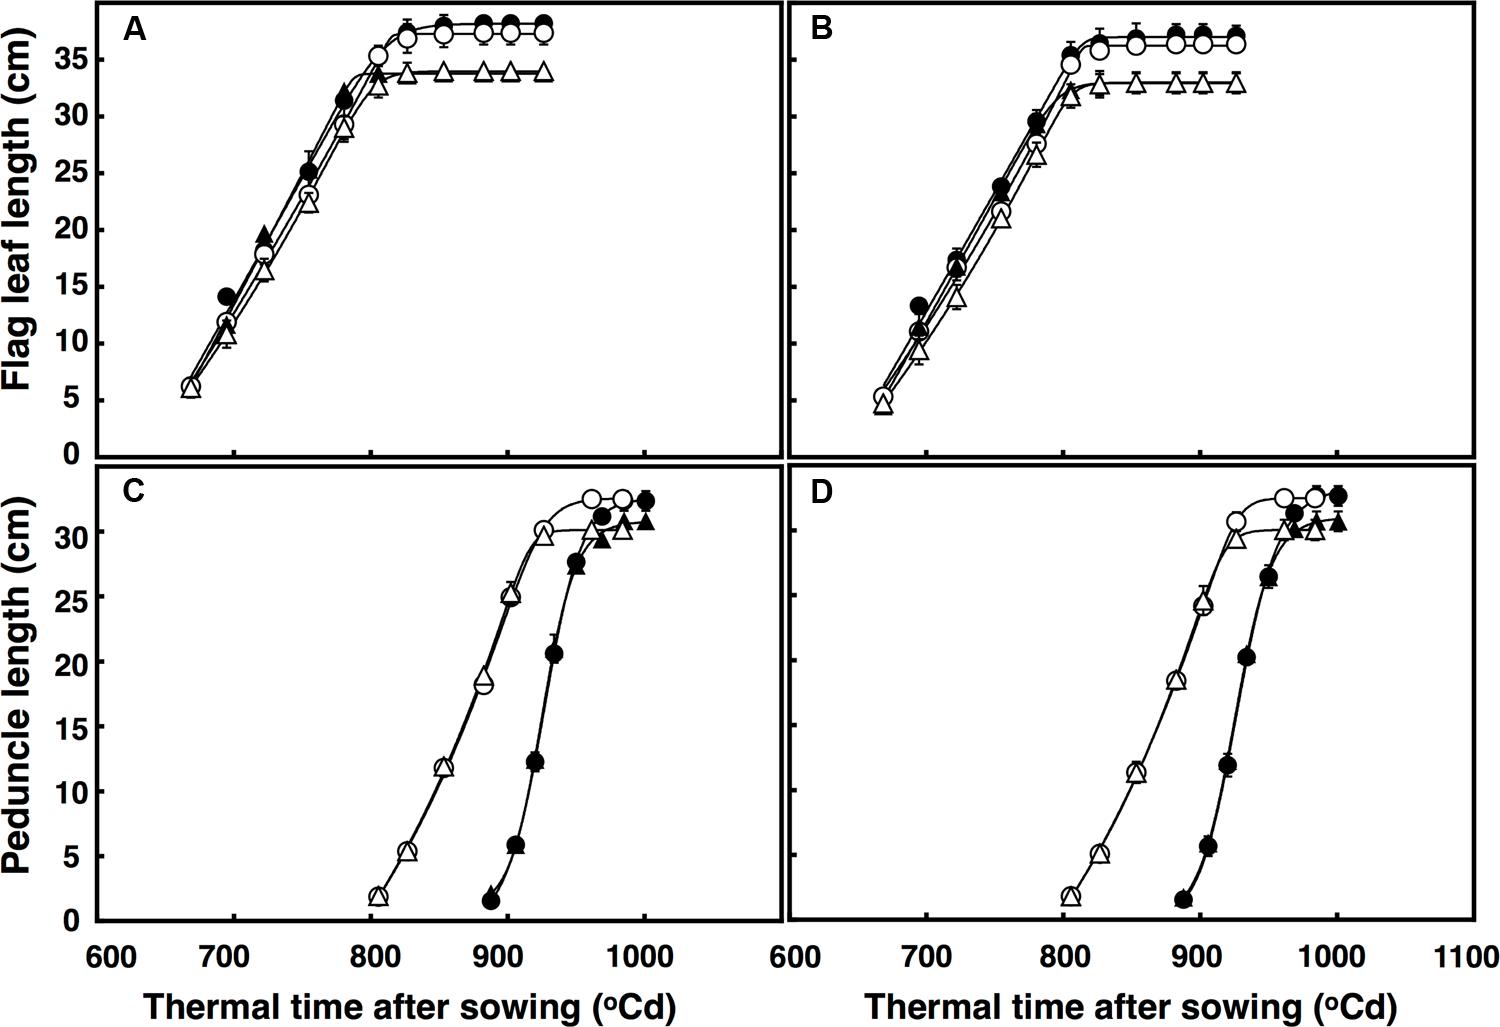
FIGURE 3. Length of the flag leaf (A,B) and peduncle (C,D) in (A) free-tillering and (B) restricted-tillering lines. Black triangles = ACO2 + HT; white triangles = ACO2 + AT; black circles = ECO2 + HT; and white circles = ECO2 + AT. Each point is mean ± SEM of 10 replicates.
The extension of the peduncle after ear emergence was affected by the interaction of thermal time × temperature × CO2 (P < 0.001). In both lines, the rate of peduncle extension was faster under high temperature regardless of CO2 concentration, but under ambient CO2, the duration of peduncle extension was shorter (∼10°C d). Therefore, the mainstem peduncle ambient CO2 + high temperature was on average 4.3 cm shorter than under elevated CO2 + high temperature (Figures 3C,D).
Grain Growth
The lag phase of grain growth was 12% longer in the restricted-tillering line than the free-tillering line. Moreover, terminal drought reduced the lag phase by 11% on average between the two lines. The period of total grain growth was also reduced by terminal drought in both lines (by 7%). There was a significant interaction of CO2 × sister line × watering treatment (P = 0.003) for grain dry weight. The rapid growth stage in the restricted-tillering line had 17% higher rates of grain filling than the free-tillering line under both CO2 concentrations when well-watered (Figure 4). Under terminal drought, the free-tillering line had similar rates of grain filling regardless of CO2 concentration, while the restricted-tillering line had 12% higher rates of grain filling under elevated CO2. There was a second significant interaction of CO2 × temperature (P < 0.001). In this interaction, grain filling rate was 15% slower and individual mean grain dry weight was on average 7% less under ambient CO2 + ambient temperature than across the other treatments.
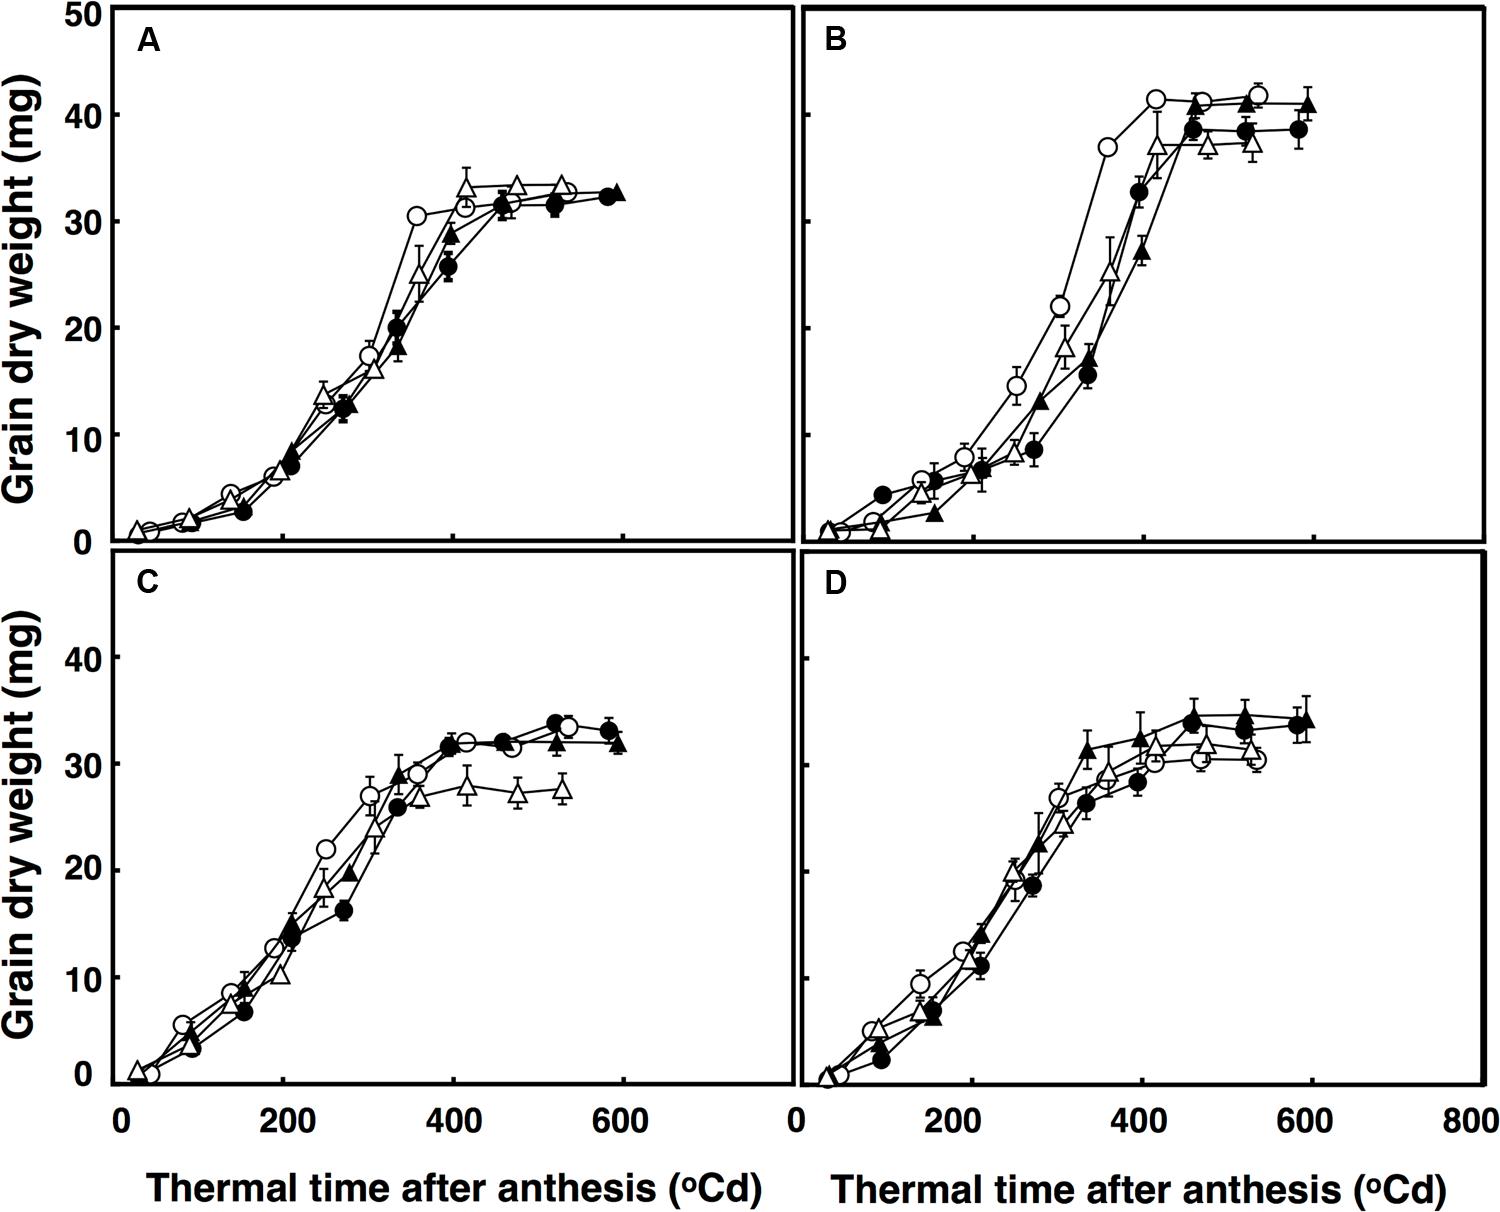
FIGURE 4. Grain dry weight in free-tillering (A,C) and restricted-tillering (B,D) lines under well-watered (A,B) and terminal drought (C,D) conditions. Black triangles = ACO2 + HT; white triangles = ACO2 + AT; black circles = ECO2 + HT; and white circles = ECO2 + AT. Each point is mean ± SEM of five replicates.
Aboveground Biomass, Grain Yield and Yield Components
The interaction of CO2 × temperature was significant for total aboveground biomass (P = 0.004) because under elevated CO2 + high temperature aboveground biomass increased in both lines by an average of 18%, but not under ambient CO2. Terminal drought reduced aboveground biomass by 13% (P = 0.008), but there was no difference between the two lines (P = 0.704; Table 1). The interaction of CO2 × temperature (P = 0.002) affected HI (Table 1) which increased from 0.48 to 0.53 when crops were grown under high temperature and decreased from 0.51 to 0.46 when grown under elevated CO2. There were no significant main effects on HI (P = 0.058–0.880).
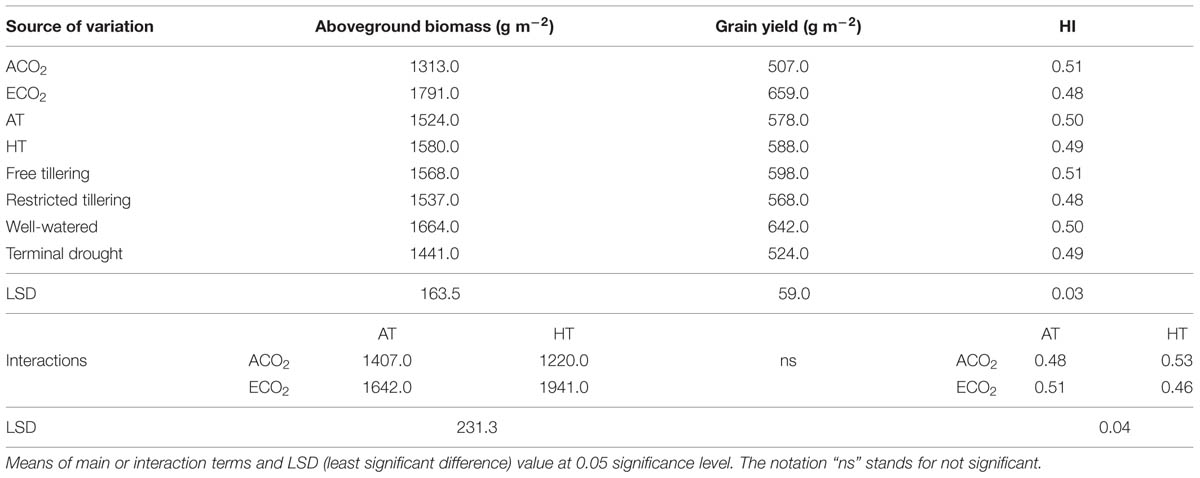
TABLE 1. Sources of variation for aboveground biomass (g m-2), grain yield (g m-2) and harvest index (HI) in a free-tillering and restricted-tillering line grown under ECO2 (elevated CO2) and ACO2 (ambient CO2), HT (+3°C above ambient temperature) and AT (ambient temperature), and well-watered and terminal drought conditions.
Grain yield was not affected by any interaction of CO2, temperature or terminal drought for both lines (P = 0.105–0.996; Table 1). Furthermore, there was no difference in grain yield between lines (P = 0.309), or between temperatures (P = 0.739). However, main effects of elevated CO2 and terminal drought affected both lines (P < 0.001 for both) in opposite directions. While elevated CO2 increased grain yield on average by 30%, terminal drought reduced it by an average of 19% (Table 1). Ear number m-2 in both lines contrasting in tillering was not affected by any interactions (P = 0.104–0.670). Ear number was also not affected by main effects of temperature (P = 0.516) or terminal drought (P = 0.147; Table 2). However, there were 12.5% more ears m-2 in the free-tillering line than the restricted-tillering line (P = 0.036) and elevated CO2 increased ear number m-2 in both lines by an average of 18% (P = 0.004).
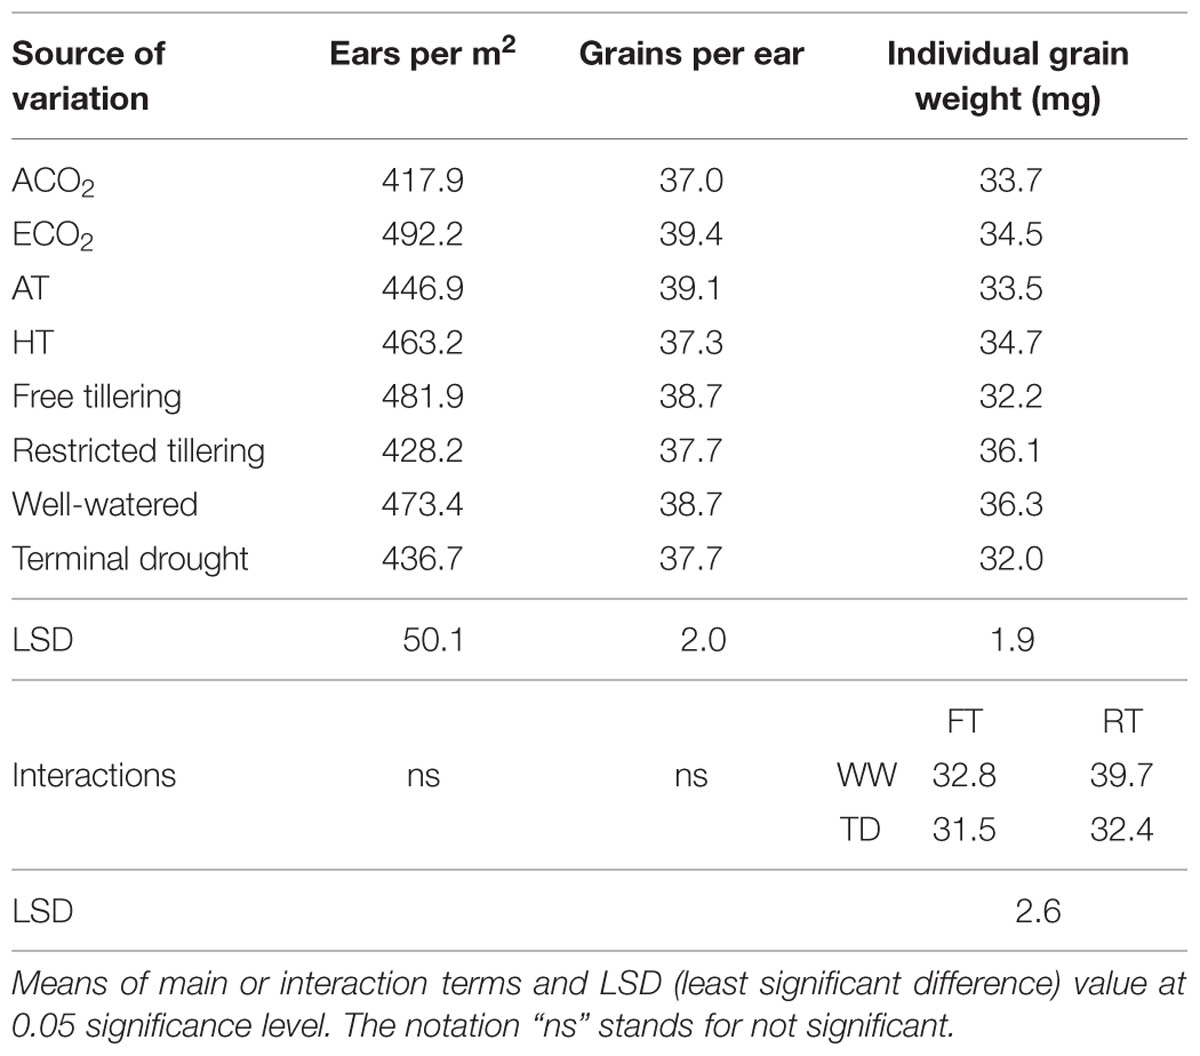
TABLE 2. Sources of variation of ears per m-2, grains per ear and single grain weight (mg) ina free-tillering (FT) and a restricted-tillering (RT) line grown under ECO2 (elevated CO2) and ACO2 (ambient CO2), HT (+3°C above ambient temperature) and AT (ambient temperature), and well-watered and terminal drought conditions.
Grain number per ear in both lines was not affected by any interactions (P = 0.077–0.924). Both lines had on average 38.2 grains per ear under ambient and well-watered conditions (P = 0.300) and they were not affected by temperature (P = 0.074) or terminal drought (P = 0.347; Table 2). Elevated CO2 was the only significant main effect (P = 0.021), which increased grain number per ear by 6.5% compared with ambient CO2.
Individual grain dry weights were affected by the interaction of sister line × watering regime after anthesis (P = 0.002) with 21.5% heavier grains in the restricted-tillering than the free-tillering line under well-watered conditions, but not under terminal drought (Figure 4). There were no CO2 (P = 0.390) or temperature effects (P = 0.217) on individual grain dry weight.
Leaf Net Photosynthesis and Transpiration Rates, Instantaneous Transpiration Efficiency (TEi) and Leaf Water Potential (ΨLeaf)
Leaf net photosynthetic rate was fitted using a polynomial regression including g quadratic terms, which accounted for 86% of the variation (Figure 5). Leaf net photosynthesis rate after anthesis was affected by a significant interactive effect of thermal time × CO2 × sister line (P = 0.041). In this interaction, the restricted-tillering line had net photosynthesis rates 16% higher on average than the free-tillering line. Under elevated CO2, leaf net photosynthesis rates were higher in the restricted-tillering line (25%) than in the free-tillering line (14%) and the decline in leaf photosynthetic rate with thermal time after anthesis was faster in the restricted-tillering line and slower in the free-tillering line (Figure 5). On average, the rates of leaf photosynthesis were 10% higher in the restricted-tillering line than in the free-tillering line across all treatments (P < 0.001; Figure 5). Under terminal drought, the net photosynthesis rate declined almost linearly, whereas the well-watered treatment reduced this decline (P < 0.001).
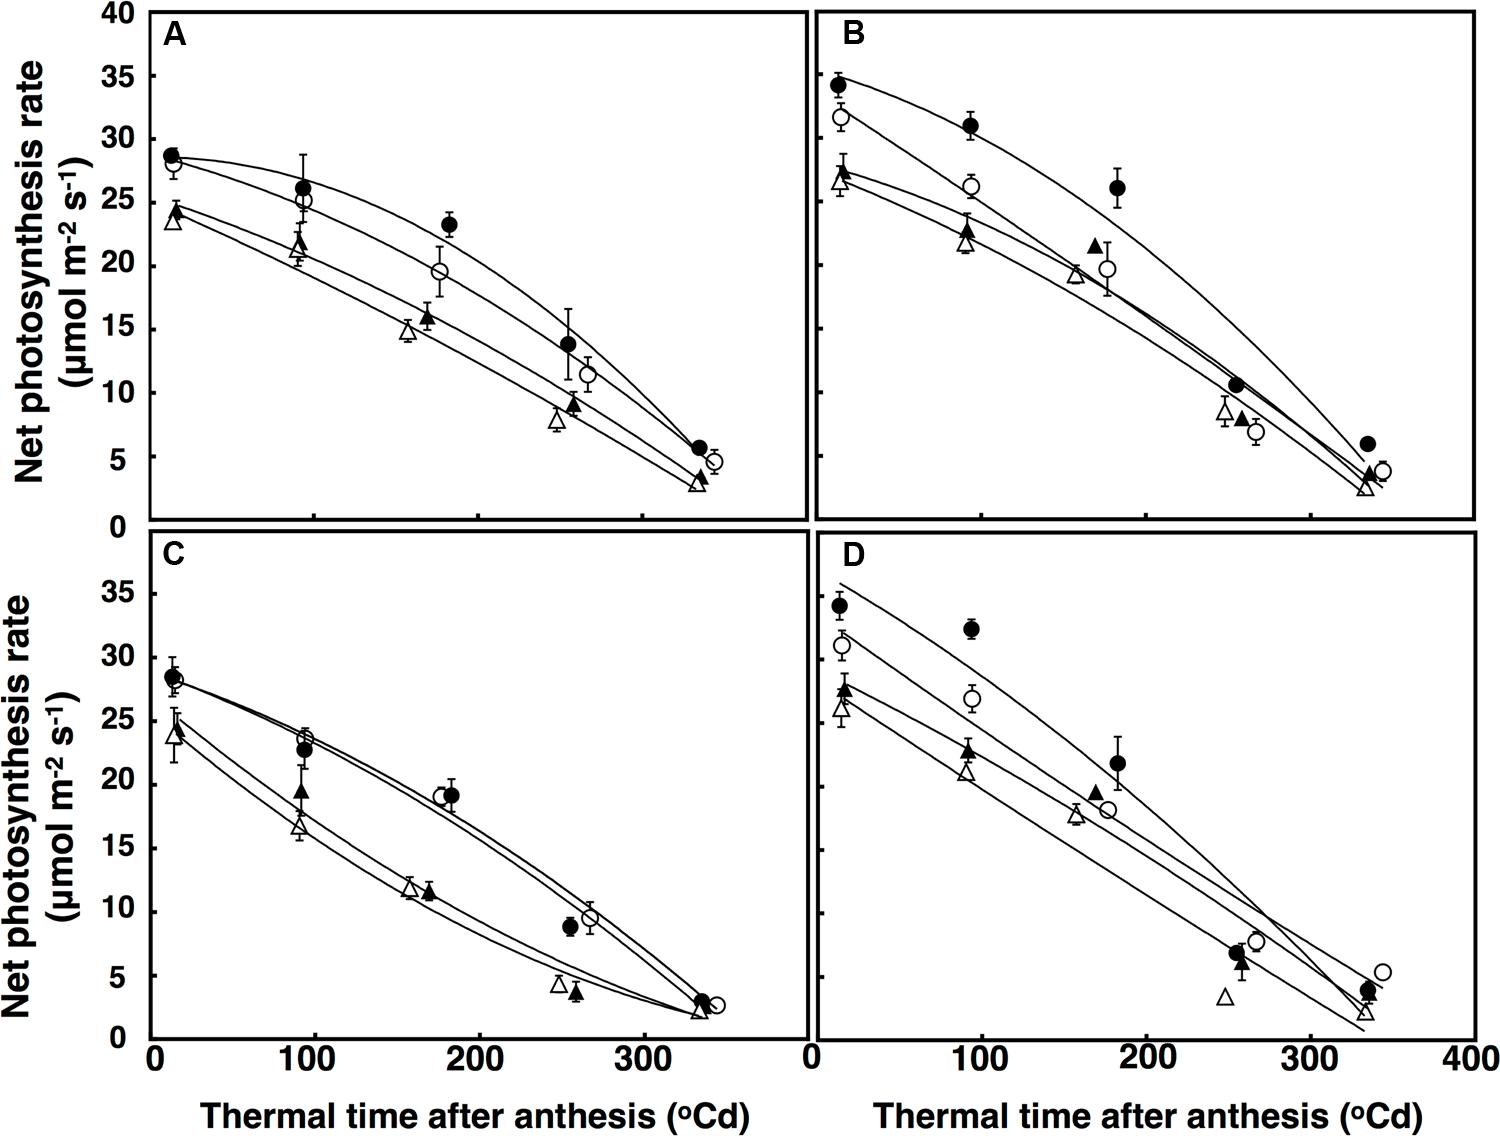
FIGURE 5. Leaf photosynthesis rate (μmol m-2 s-1) under well-watered (A,B) and terminal drought conditions (C,D) in the free-tillering and restricted-tillering lines. Black triangles = ACO2 + HT; white triangles = ACO2 + AT; black circles = ECO2 + HT; and white circles = ECO2 + AT. Each point is mean ± SEM of five replicates.
Leaf transpiration rate over time was fitted using a polynomial regression with a quadratic component, which accounted for 72% of the variation (Figure 6). There was a significant interaction of CO2 × sister line for leaf transpiration rate (P = 0.005) with leaf transpiration rates decreasing more under elevated CO2 in the free-tillering line (32%) than in the restricted-tillering line (22%; Figure 6). Leaf transpiration rates at anthesis in both sister lines increased by an average of 35% across all combinations (P < 0.001) when crops were grown under high temperature. The difference in transpiration rate between ambient and high temperature was maintained after anthesis. Leaf transpiration rate in the restricted-tillering line declined almost linearly after anthesis and was on average 12% lower than the free-tillering line, which declined non-linearly after anthesis. Terminal drought did not affect leaf transpiration rates (P = 0.734).
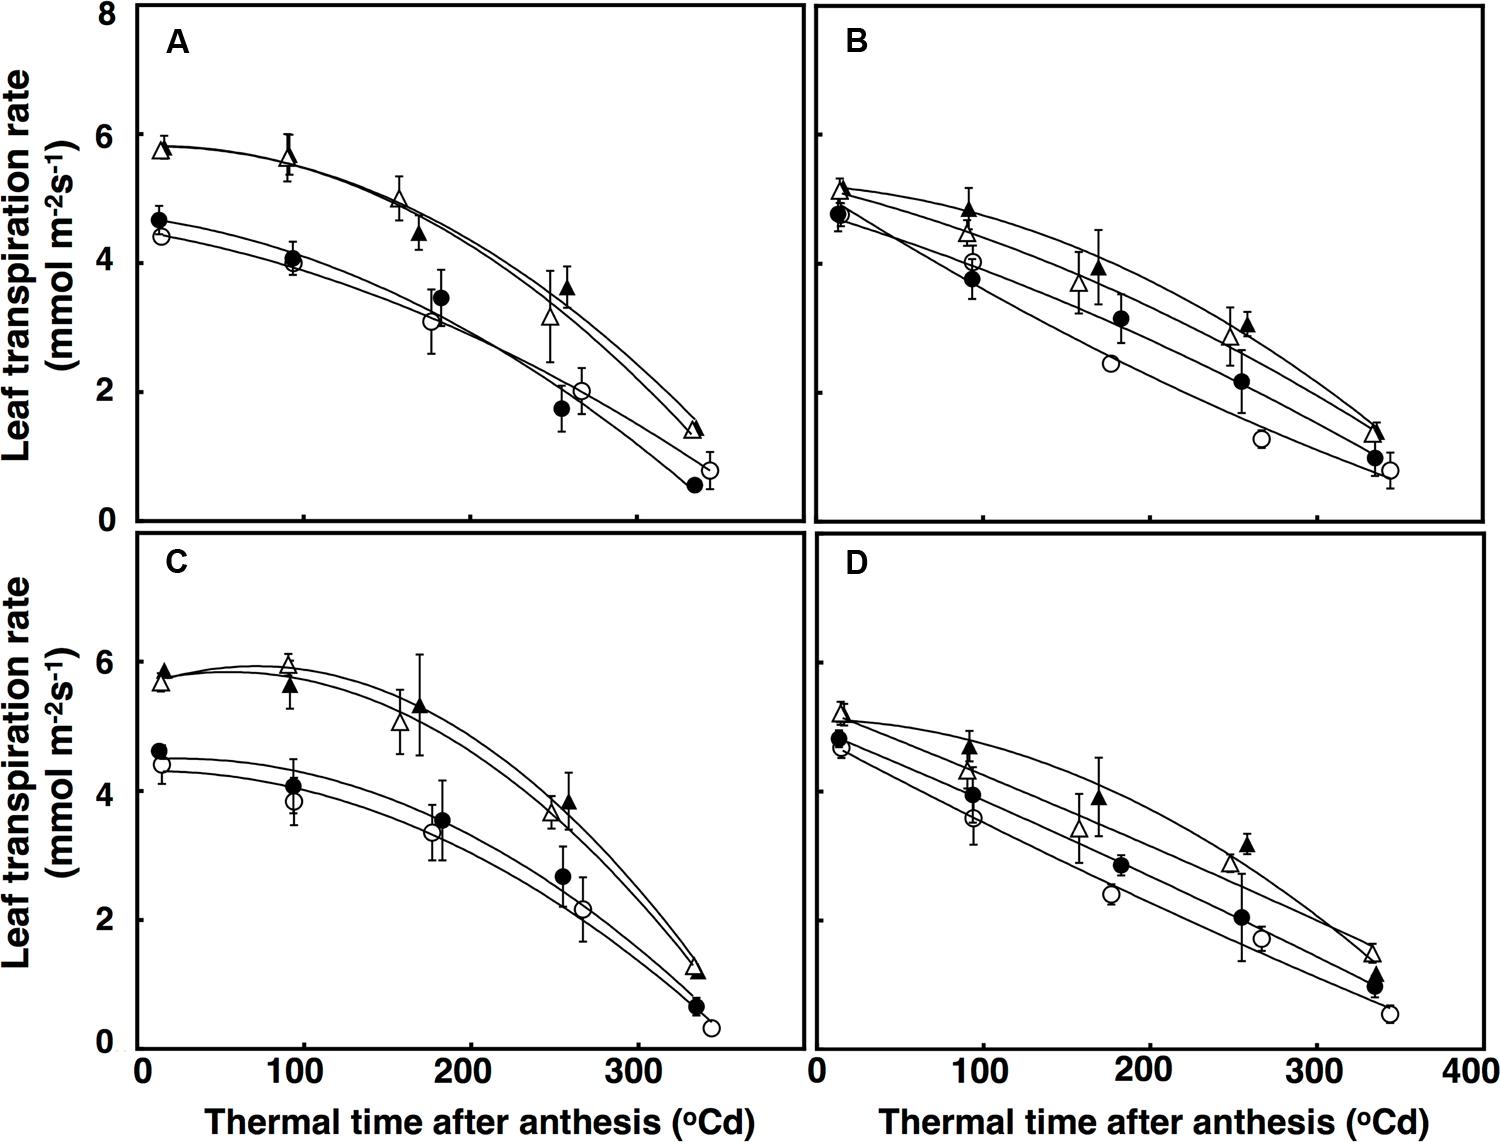
FIGURE 6. Leaf transpiration rates (mmol m-2 s-1) under well-watered (A,B) and terminal drought conditions (C,D) in the free-tillering and restricted-tillering lines. Black triangles = ACO2 + HT; white triangles = ACO2 + AT; black circles = ECO2 + HT; and white circles = ECO2 + AT. Each point is mean ± SEM of five replicates.
Transpiration efficiency over time was fitted using a polynomial regression, which explained 84% of the variation (Figure 7). There was a significant interaction of thermal time × CO2 × temperature (P = 0.048) for TEi. Elevated CO2 and ambient temperature increased TEi in both lines after approximately 320°C d, but at high temperature, TEi decreased in the restricted-tillering line under terminal drought. Terminal drought increased TEi in both lines by an average of 12% (P = 0.043). TEi in the restricted-tillering line was on average 20% higher than in the free-tillering line (P = 0.003; Figure 7).
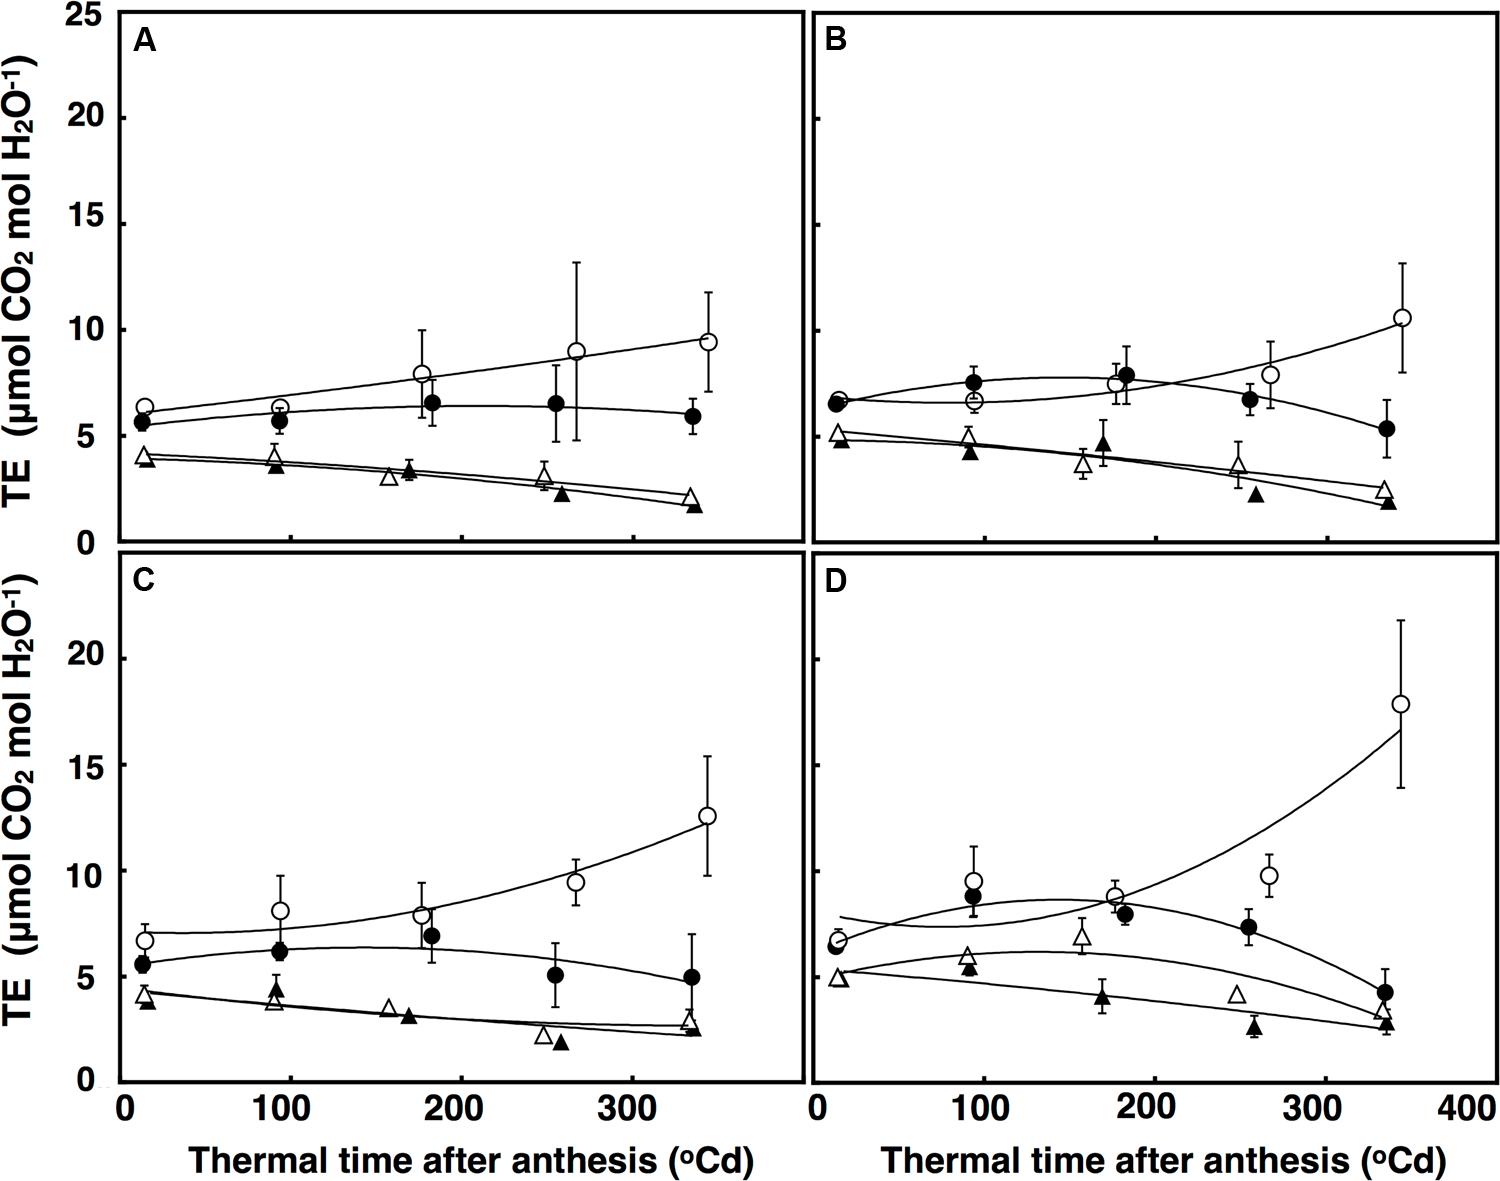
FIGURE 7. Transpiration Efficiency (μmol CO2 mol H2O-1) under well-watered (A,B) and terminal drought conditions (C,D) in the free-tillering and restricted-tillering lines. Black triangles = ACO2 + HT; white triangles = ACO2 + AT; black circles = ECO2 + HT; and white circles = ECO2 + AT. Each point is mean ± SEM of five replicates.
Discussion
Elevated CO2 increased grain yield in both lines contrasting in tillering by increasing grain number per ear. Under elevated CO2 there were more florets at anthesis than under ambient CO2. The potential number of florets did not increase, but floret mortality decreased. This finding supports the first hypothesis that elevated CO2 increases grain number per ear by reducing the rate of floret mortality. The carbon resources needed to produce florets are insignificant compared to that needed to support floret growth and development (Kirby, 1988; Ferrante et al., 2013a). Therefore, the high rates of net leaf photosynthesis under elevated CO2 most likely provided sufficient carbon assimilates (Balaguer et al., 1995; Palta and Ludwig, 2000) that enabled greater survival of competent florets. Greater availability of carbon assimilates have previously been suggested as the cause of floret mortality reduction (Siddique et al., 1989; Miralles et al., 1998). The greater dry weight of the ear and longer peduncle and flag leaf under elevated CO2 also indicate that the high rate of net leaf photosynthesis under elevated CO2 may have increased the availability of carbon assimilates. Despite increasing fertile florets in the main stem by 42%, elevated CO2 only increased total number of grains per ear by around 6.5%. This may be due to intraplant competition for assimilates. Main stem develops earlier than the other tillers, and supposedly, more grains to fill in the main stem could reduce carbon assimilates at for the tillers negating the gain in fertile florets. Another possibility would be that more fertile florets in the tillers are reducing the development grains on basal or apical spikelets.
The number of floret deaths at anthesis was hastened under the combination ambient CO2 + high temperature, reducing the potential number of grains per ear at anthesis in both lines. However, under the combination elevated CO2 + high temperature the rate of floret death was not affected, indicating that the hastening effect of high temperature was mitigated by elevated CO2 and hence the potential grain number per ear was not affected. Time to maturity was hastened under the combination of elevated CO2 + high temperature because elevated CO2 did not mitigate the effect that high temperature had on phenology. This may be due to better efficiency of photosystem II, as found in other C3 plants (Martínez-Carrasco et al., 2005; Aranjuelo et al., 2008), which reduces photorespiration (Bunce, 1998; Long and Bernacchi, 2003; Long et al., 2006; Sage and Mckown, 2006; Ainsworth et al., 2012) and can improve accumulation of assimilates for floret survival.
There was no difference in grain yield between the two sister lines contrasting in tillering under any treatment, despite the presence of more tillers in the free-tillering line under elevated CO2. Although tillering in the restricted-tillering line was not affected by elevated CO2 or high temperature, leaf extension, and leaf area do respond to elevations in CO2 (Dias de Oliveira et al., 2015) as well as leaf photosynthetic rates. Therefore, total canopy photosynthesis was probably similar between both lines. More tillers in the free-tillering line resulted in more grains per unit area, but the average individual grain dry weight was lower than the restricted-tillering line. The restricted-tillering line had fewer grains per unit area than the free-tillering line, but individual grain dry weight was higher. Potential grain size, which is correlated with grain dry weight, is determined by the size of the carpels within the florets (Siddique et al., 1989; Calderini et al., 2001), and presumably grain number was adjusted according to the potential grain size (Egli, 2006; Sadras and Egli, 2008). Although both lines had similar grain numbers per ear, it cannot be assumed that the potential grain size was the same. It is well understood how environmental variation affects final grain size, but not how they affect potential grain size (Slafer et al., 1996). It is likely that the changes in atmospheric CO2 concentration, temperature and water regime studied here did not affect potential grain size, since the plasticity in grain size has a narrow range when compared to grain number (Sadras, 2007). It is possible that final grain size was influenced by the rates of net leaf photosynthesis, which was higher in the restricted-tillering line than the free-tillering line. This could be an indication of how the sink influences the carbon source (Aranjuelo et al., 2011), but also that more assimilates were available per grain in the restricted-tillering line. Furthermore, it is possible that increased grain number per unit area reduces mean grain size (Loss et al., 1989; Siddique et al., 1989; Acreche and Slafer, 2006).
The greater number of ears m-2, grains per ear, grain size and leaf photosynthetic rates under elevated CO2 reduced the negative impact that terminal drought had on grain yield when crops were grown under ambient CO2 and terminal drought conditions in both sister lines. However, terminal drought reduced grain dry weight in both sister lines in this study, regardless of CO2 concentration or temperature. Terminal drought was induced by withdrawing irrigation when 50% of plants reached anthesis and it is, therefore, likely that the water deficit immediately after anthesis reduced grain dry weight through reduced cell expansion (Borrás et al., 2004). Furthermore, terminal drought reduced assimilation of carbon for grain filling in both lines (Pheloung and Siddique, 1991; Kobata et al., 1992; Palta et al., 1994) affecting grain growth rates.
Grain growth had a longer lag phase (period of slow grain filling) in the restricted-tillering line, and in both sister lines the lag phase was longer under well-watered conditions. The difference in final grain dry weight between the two isogenic lines for tillering under well-watered conditions resulted mainly from the faster rates of grain filling in the restricted-tillering line compared with the free-tillering line. This was probably a consequence of fewer grains per m2 and larger potential grain size, supported by higher carbon assimilation rates maintained after anthesis. Under terminal drought, the duration of grain filling decreased in both sister lines. Therefore, the plateau phase (maximum grain dry weight) was reached earlier, hence the reduction in grain size under terminal drought.
In both lines contrasting in tillering, elevated CO2 increased TEi, more as a result of reduced rates of transpiration in the free-tillering line, and increased photosynthetic rates in the restricted-tillering line. Leaf photosynthetic rates in both lines decreased at different rates as leaf senescence progressed under elevated CO2. Hastened phenology or limited genetic potential may have restricted biomass accumulation from higher photosynthetic rates. This limitation was previously observed in the vigorous growth breeding line 38–19, in which accelerated phenology and reduced tillering limited higher biomass accumulation despite higher leaf photosynthesis rates (Dias de Oliveira et al., 2013).
Conclusion
Any prediction of increased grain yield due to more tillers produced was not attained because the trade-off between yield components limited grain yield in the free-tillering line. The variables of climate change did not affect the number of potential florets on the mainstem or the trade-off between yield components that limited grain yield. The number of competent florets on the mainstem at anthesis increased under elevated CO2 presumably, because of a greater carbon source through increased leaf area and photosynthetic rate, although the final grain number was not increased proportionally. The weight of grains in the free-tillering line was not increased, limiting any potential advantage of the free-tillering line over the restricted-tillering line under elevated CO2, high temperature and terminal drought conditions. This study indicates that selection of wheat germplasm with a greater potential number of florets can improve grain yield under future climates, because the amount of carbon assimilates to produce florets is very small and was not affected by any of the climate change variables. Greater photosynthetic capacity under elevated CO2, between stem elongation and anthesis, could support floret survival resulting in more competent florets at anthesis.
Conflict of Interest Statement
The authors declare that the research was conducted in the absence of any commercial or financial relationships that could be construed as a potential conflict of interest.
Acknowledgments
We thank Dr. Greg Rebetzke for providing wheat seeds and background information on the genotypes. ED thanks the Commonwealth Department of Agriculture, Forestry and Fisheries (DAFF), The University of Western Australia Institute of Agriculture and School of Plant Biology, and CSIRO for the support that made his Ph.D. research possible. This research was supported by DAFF.
References
Acreche, M. M., and Slafer, G. A. (2006). Grain weight response to increases in number of grains in wheat in a Mediterranean area. Field Crops Res. 98, 52–59. doi: 10.1016/j.fcr.2005.12.005
Ainsworth, E. A., Yendrek, C. R., Skoneczka, J. A., and Long, S. P. (2012). Accelerating yield potential in soybean: potential targets for biotechnological improvement. Plant Cell Environ. 35, 38–52. doi: 10.1111/j.1365-3040.2011.02378.x
Aranjuelo, I., Cabrera-Bosquet, L., Morcuende, R., Avice, J. C., Nogués, S., Araus, J. L., et al. (2011). Does ear C sink strength contribute to overcoming photosynthetic acclimation of wheat plants exposed to elevated CO2? J. Exp. Bot. 62, 3957–3969. doi: 10.1093/jxb/err095
Aranjuelo, I., Erice, G., Nogués, S., Morales, F., Irigoyen, J. J., and Sánchez-Díaz, M. (2008). The mechanism(s) involved in the photoprotection of PSII at elevated CO2 in nodulated alfalfa plants. Environ. Exp. Bot. 64, 295–306. doi: 10.1016/j.envexpbot.2008.01.002
Asseng, S., Jamieson, P., Kimball, B., Pinter, P., Sayre, K., Bowden, J., et al. (2004). Simulated wheat growth affected by rising temperature, increased water deficit and elevated atmospheric CO2. Field Crops Res. 85, 85–102. doi: 10.1016/S0378-4290(03)00154-0
Austin, R. B. (1990). “Prospects for genetically increasing the photosynthetic capacity of crops,” in Perspectives in Biochemical and Genetic Regulation of Photosynthesis, ed. I. Zelitch (New York: Allan R. Liss Inc.), 395–409.
Balaguer, L., Barnes, J. D., Panicucci, A., and Borland, A. M. (1995). Production and utilization of assimilates in wheat (Triticum aestivum L.) leaves exposed to elevated O3 and/or CO2. New Phytol. 129, 557–568. doi: 10.1111/j.1469-8137.1995.tb03023.x
Bancal, P. (2009). Early development and enlargement of wheat floret primordia suggest a role of partitioning within spike to grain set. F. Crop. Res. 110, 44–53. doi: 10.1016/j.fcr.2008.06.014
Borrás, L., Slafer, G. A., and Otegui, M. E. (2004). Seed dry weight response to source–sink manipulations in wheat, maize and soybean: a quantitative reappraisal. Field Crops Res. 86, 131–146. doi: 10.1016/j.fcr.2003.08.002
Bunce, J. A. (1998). The temperature dependence of the stimulation of photosynthesis by elevated carbon dioxide in wheat and barley. J. Exp. Bot. 49, 1555–1561. doi: 10.1093/jxb/49.326.1555
Calderini, D. F., Savin, R., Abeledo, L. G., Reynolds, M. P., and Slafer, G. A. (2001). The importance of the period immediately preceding anthesis for grain weight determination in wheat. Euphytica 199, 199–204. doi: 10.1023/A:1017597923568
Dias de Oliveira, E., Bramley, H., Siddique, K. H. M., Henty, S., Berger, J., and Palta, J. A. (2013). Can elevated CO2 combined with high temperature ameliorate the effect of terminal drought in wheat? Funct. Plant Biol. 40, 160–171. doi: 10.1071/FP12206
Dias de Oliveira, E. A., Siddique, K. H. M., Bramley, H., Stefanova, K., and Palta, J. A. (2015). Response of wheat restricted-tillering and vigorous growth traits to variables of climate change. Glob. Chang. Biol. 21, 857–873. doi: 10.1111/gcb.12769
Egli, D. B. (2006). The role of seed in the determination of yield of grain crops. Aust. J. Agric. Res. 57, 1237–14247. doi: 10.1071/AR06133
Ferrante, A., Savin, R., and Slafer, G. A. (2013a). Floret development and grain setting differences between modern durum wheats under contrasting nitrogen availability. J. Exp. Bot. 64, 169–184. doi: 10.1093/jxb/ers320
Ferrante, A., Savin, R., and Slafer, G. A. (2013b). Is floret primordia death triggered by floret development in durum wheat? J. Exp. Bot. 64, 2859–2869. doi: 10.1093/jxb/ert129
Fischer, R. A. (1985). Number of kernels in wheat crops and the influence of solar radiation and temperature. J. Agric. Sci. 105, 447–461. doi: 10.1017/S0021859600056495
Fischer, R. A. (2011). Wheat physiology: a review of recent developments. Crop Pasture Sci. 62, 95–114. doi: 10.1071/CP10344
Fischer, R. A., and Aguilar, I. M. (1976). Yield potential in a dwarf spring wheat and the effect of carbon dioxide fertilization. Agron. J. 68, 749–752. doi: 10.2134/agronj1976.00021962006800050016x
Grafius, J. E. (1972). Competition for environmental resources by component characters. Crop Sci. 12, 364–367. doi: 10.2135/cropsci1972.0011183X001200030032x
Habash, D. Z., Paul, M. J., Parry, M. A. J., Keys, A. J., and Lawlor, D. W. (1995). Increased capacity for photosynthesis in wheat grown at elevated CO2 - the relationship between electron-transport and carbon metabolism. Planta 197, 482–489. doi: 10.1007/BF00196670
Hanft, J. M., and Wych, R. D. (1982). Visual indicators of physiological maturity of hard red spring wheat. Crop Sci. 22, 584–588. doi: 10.2135/cropsci1982.0011183X002200030036x
Henson, I. E., Jensen, C. R., and Turner, N. C. (1990). Influence of leaf age and light environment on the gas exchange of lupins and wheat. Physiol. Plant. 79, 15–22. doi: 10.1111/j.1399-3054.1990.tb05860.x
Högy, P., Brunnbauer, M., Koehler, P., Schwadorf, K., Breuer, J., Franzaring, J., et al. (2013). Grain quality characteristics of spring wheat (Triticum aestivum) as affected by free-air CO2 enrichment. Environ. Exp. Bot. 88, 11–18. doi: 10.1016/j.envexpbot.2011.12.007
Högy, P., Wieser, H., Köhler, P., Schwadorf, K., Breuer, J., Franzaring, J., et al. (2009). Effects of elevated CO2 on grain yield and quality of wheat: results from a 3-year free-air CO2 enrichment experiment. Plant Biol. (Stuttg.) 11(Suppl. 1), 60–69. doi: 10.1111/j.1438-8677.2009.00230.x
Kirby, E. J. M. (1988). Analysis of leaf, stem and ear growth in wheat from terminal spikelet stage to anthesis. F. Crop. Res. 18, 127–140. doi: 10.1016/0378-4290(88)90004-4
Kobata, T., Palta, J. A., and Turner, N. C. (1992). Rate of development of postanthesis water deficits and grain filling of spring wheat. Crop Sci. 32, 1238–1242. doi: 10.2135/cropsci1992.0011183X003200050035x
Long, S. P., and Bernacchi, C. J. (2003). Gas exchange measurements, what can they tell us about the underlying limitations to photosynthesis? Procedures and sources of error. J. Exp. Bot. 54, 2393–2401. doi: 10.1093/jxb/erg262
Long, S. P., Zhu, X. G., Naidu, S. L., and Ort, D. R. (2006). Can improvement in photosynthesis increase crop yields? Plant Cell Environ. 29, 315–330. doi: 10.1111/j.1365-3040.2005.01493.x
Loss, S. P., Kirby, E. J. M., Siddique, K. H. M., and Perry, M. W. (1989). Grain growth and development of old and modern australian wheats. Field Crops Res. 21, 131–146. doi: 10.1016/0378-4290(89)90049-X
Ludwig, F., and Asseng, S. (2006). Climate change impacts on wheat production in a Mediterranean environment in Western Australia. Agric. Syst. 90, 159–179. doi: 10.1016/j.agsy.2005.12.002
Manderscheid, R., and Weigel, H. J. (1997). Photosynthetic and growth responses of old and modern spring wheat cultivars to atmospheric CO2 enrichment. Agric. Ecosyst. Environ. 64, 65–73. doi: 10.1016/S0167-8809(97)00020-0
Marc, J., and Gifford, R. M. (1984). Floral initiation in wheat, sunflower, and sorghum under carbon dioxide enrichment. Can. J. Bot. 62, 9–14. doi: 10.1139/b84-002
Martínez-Carrasco, R., Pérez, P., and Morcuende, R. (2005). Interactive effects of elevated CO2, temperature and nitrogen on photosynthesis of wheat grown under temperature gradient tunnels. Environ. Exp. Bot. 54, 49–59. doi: 10.1016/j.envexpbot.2004.05.004
McArthur, W. M., and Bettenay, E. (1974). Development and Distribution of Soils of the Swan Coastal Plain, 2 Edn. Melbourne, VIC: Soil Publication no 16.
Miralles, D. J., Katz, S. D., Colloca, A., and Slafer, G. A. (1998). Floret development in near isogenic wheat lines differing in plant height. Field Crops Res. 59, 21–30. doi: 10.1016/S0378-4290(98)00103-8
Musgrave, M. E., and Strain, B. R. (1988). Response of two wheat cultivars to CO2 enrichment under subambient oxygen conditions. Plant Phisiol. 87, 346–350. doi: 10.1104/pp.87.2.346
Palta, J. A., Kobata, T., Turner, N. C., and Fillery, I. R. (1994). Remobilization of carbon and nitrogen in wheat as influenced by postanthesis water deficits. Crop Sci. 34, 118–124. doi: 10.2135/cropsci1994.0011183X003400010021x
Palta, J. A., and Ludwig, C. (2000). Elevated CO2 during pod filling increased seed yield but not harvest index in indeterminate narrow-leafed lupin. Aust. J. Agric. Res. 51, 279–286. doi: 10.1071/PP97167
Pheloung, P., and Siddique, K. (1991). Contribution of stem dry matter to grain yield in wheat cultivars. Funct. Plant Biol. 18, 53–64. doi: 10.1071/PP9910053
Ragab, R., and Prudhomme, C. (2002). Climate change and water resources management in arid and semi-arid regions: prospective and challenges for the 21st century. Biosyst. Eng. 81, 3–34. doi: 10.1006/bioe.2001.0013
Rajaram, S., and Ginkel, M. V. (1996). “Yield potential debate: germplasm vs methodology, or both,” in Increasing Yield Potential in Wheat: Breaking the Barriers, eds M. P. Reynolds, S. Rajaram, and A. McNab (Houston, TX: CIMMYT).
Reynolds, M., Foulkes, M. J., Slafer, G. A., Berry, P., Parry, M. A. J., Snape, J. W., et al. (2009). Raising yield potential in wheat. J. Exp. Bot. 60, 1899–1918. doi: 10.1093/jxb/erp016
Sadras, V. O. (2007). Evolutionary aspects of the trade-off between seed size and number in crops. Field Crop. Res. 100, 125–138. doi: 10.1016/j.fcr.2006.07.004
Sadras, V. O., and Egli, D. B. (2008). Seed size variation in grain crops: allometric relationships between rate and duration of seed growth. Crop Sci. 48, 408–416. doi: 10.2135/cropsci2007.05.0292
Sage, R. F., and Mckown, A. D. (2006). Is C4 photosynthesis less phenotypically plastic than C3 photosynthesis? J. Exp. Bot. 57, 303–317. doi: 10.1093/jxb/erj040
Siddique, K. H. M., Kirby, E. J. M., and Perry, M. W. (1989). Ear:stem ratio in old and modern wheat varieties; relationship with improvement in number of grains per ear and yield. Field Crops Res. 21, 59–78. doi: 10.1016/0378-4290(89)90041-5
Slafer, G. A. (2003). Genetic basis of yield as viewed from a crop physiologist’s perspective. Ann. Appl. Biol. 142, 117–128. doi: 10.1111/j.1744-7348.2003.tb00237.x
Slafer, G. A., Calderini, D. F., and Miralles, D. J. (1996). “Yield components and compensation in wheat: opportunities for further increasing yield potential,” in Increasing Yield Potential in Wheat: Breaking the Barriers, eds M. P. Reynolds, S. Rajaram, and M. McNab (Houston, TX: CIMMYT).
Turner, N. C., Molyneux, N., Yang, S., Xiong, Y., and Siddique, K. H. M. (2011). Climate change in south-west Australia and north-west China: challenges and opportunities for crop production. Crop Pasture Sci. 62, 445–456. doi: 10.1071/CP10372
Keywords: Triticum aestivum, restricted tillering, free -tillering, climate change, yield, compensation, florets
Citation: Dias de Oliveira E, Palta JA, Bramley H, Stefanova K and Siddique KHM (2015) Elevated CO2 Reduced Floret Death in Wheat Under Warmer Average Temperatures and Terminal Drought. Front. Plant Sci. 6:1010. doi: 10.3389/fpls.2015.01010
Received: 01 September 2015; Accepted: 30 October 2015;
Published: 20 November 2015.
Edited by:
Edmundo Acevedo, University of Chile, USAReviewed by:
Fulai Liu, University of Copenhagen, DenmarkAlejandro Del Pozo, Universidad de Talca, Chile
Copyright © 2015 Dias de Oliveira, Palta, Bramley, Stefanova and Siddique. This is an open-access article distributed under the terms of the Creative Commons Attribution License (CC BY). The use, distribution or reproduction in other forums is permitted, provided the original author(s) or licensor are credited and that the original publication in this journal is cited, in accordance with accepted academic practice. No use, distribution or reproduction is permitted which does not comply with these terms.
*Correspondence: Jairo A. Palta, jairo.palta@csiro.au
†Present address: Eduardo Dias de Oliveira, University of São Paulo, Bandeirantes, 3900, Monte Alegre, 14040-90, Ribeirão Preto, São Paulo, Brazil; Helen Bramley, Plant Breeding Institute, Faculty of Agriculture and Environment, The University of Sydney, 12656 Newell Highway, Narrabri, NSW 2390, Australia