Identification of Quercus agrifolia (coast live oak) resistant to the invasive pathogen Phytophthora ramorum in native stands using Fourier-transform infrared (FT-IR) spectroscopy
 Anna O. Conrad
 Pierluigi Bonello
- 1Forest Health Research and Education Center, Department of Forestry, University of Kentucky, Lexington, KY, USA
- 2Department of Plant Pathology, The Ohio State University, Columbus, OH, USA
New approaches for identifying disease resistant trees are needed as the incidence of diseases caused by non-native and invasive pathogens increases. These approaches must be rapid, reliable, cost-effective, and should have the potential to be adapted for high-throughput screening or phenotyping. Within the context of trees and tree diseases, we summarize vibrational spectroscopic and chemometric methods that have been used to distinguish between groups of trees which vary in disease susceptibility or other important characteristics based on chemical fingerprint data. We also provide specific examples from the literature of where these approaches have been used successfully. Finally, we discuss future application of these approaches for wide-scale screening and phenotyping efforts aimed at identifying disease resistant trees and managing forest diseases.
Introduction
Forest tree species are increasingly being threatened by native and introduced pathogens as a result of globalization and climate change, which can alter the life cycles of pathogens that have co-evolved with tree hosts and facilitate the spread of non-native and invasive pathogens to areas where native tree species lack specific defenses against them. Because non-native and invasive species continue to be introduced, regulations have been imposed by government organizations to curtail the spread of pathogens capable of causing disease in naïve habitats (Frankel, 2008; Potter et al., 2011). However, these efforts have had no real impact on our ability to contain pathogens due to failure to sever the pathways by which non-native and invasive species enter naïve areas (Liebhold et al., 2012), uncontrollable pathogen dispersal patterns and potential, and the effects of global change, which has made many areas more suitable to invasion by destructive agents (Rustad et al., 2012; reviewed in Sturrock et al., 2011).
In general, few options exist for managing forest diseases, with preventative management (e.g., pathogen exclusion) likely to be the most effective. Other options such as chemical control, either before or after infection, may be effective on individual trees, e.g., in the urban landscape, but are logistically and economically impossible, and environmentally unacceptable, on large spatial scales, e.g., in a forest stand or at a landscape level. For these reasons, the identification and utilization of resistant trees for disease management and restoration of disturbed habitats should be a top priority (Telford et al., 2015; Wingfield et al., 2015). In many instances, intensive artificial selection of resistant trees is required since there is an insufficient amount of quantitative genetic variation to allow for natural recovery in forest populations (Ennos, 2015). Examples of where resistant trees have been identified and bred using intensive artificial selection include: inter-specific chestnut hybrids resistant to Cryphonectria parasitica (causal agent of chestnut blight) (Burnham, 1988), Port-Orford-cedar resistant to Phytophthora lateralis (causal agent of Port-Orford-cedar root rot) (Sniezko et al., 2012), and elm tolerant to Ophiostoma novo-ulmi (causal agent of Dutch elm disease) (Martín et al., 2015).
However, even successful breeding programs face many challenges, including dealing with long lifespans and generation times of most tree species (Telford et al., 2015). For example, breeding programs for chestnut, Port-Orford-cedar, and elm have taken decades to produce any resistant or tolerant germplasm (Burnham, 1988; Oh et al., 2006; Martín et al., 2015). In addition, methods for screening and phenotyping trees for disease resistance typically rely on artificial inoculation or natural infection of individual trees. This approach is labor and time intensive, and is not suitable for rapid, high-throughput screening, or phenotyping (Neale and Kremer, 2011). Finally, in instances where intensive artificial selection is not feasible, high-throughput methods, not reliant on artificial or natural infection, are needed to assess the proportion of resistant trees within a population. This type of information can be used to facilitate and dictate what, if any management practices are implemented.
KEY CONCEPT 1. Resistance
Trees are classified as resistant based on qualitative and/or quantitative attributes. For example, a tree with a lesion length, caused by pathogen infection, at or below some critical threshold, could be defined as resistant. A tree that no longer shows active symptoms of disease, after an initial display of those symptoms, i.e., a tree that is in remission, could also be considered resistant.
Genetic and genomic approaches, including genomic selection for quantitative traits, like disease resistance, are being developed and are currently used in some high value tree crops such as Pinus taeda (loblolly pine) (Resende et al., 2012). However, these approaches have not been widely implemented because the genetic basis of host resistance is still unknown for many forest pathosystems (Neale and Kremer, 2011; Muranty et al., 2014). Therefore, more rapid and less expensive alternative approaches are needed for screening and phenotyping trees, especially non-model tree species.
One such approach, which has the potential to overcome current screening and phenotyping limitations, utilizes infrared (IR) or Raman spectroscopy to generate chemical fingerprints of biological samples. Chemical fingerprinting can be combined with chemometrics—multivariate analysis of chemical data—to identify spectral features that differentiate two or more groups (Fiehn, 2001, 2002; Goodacre et al., 2004; Xia and Wishart, 2011).
KEY CONCEPT 2. Chemical fingerprinting
A comprehensive analysis of all the chemicals (metabolites) present within a given sample; individual chemicals are not separated, identified, or quantified.
KEY CONCEPT 3. Chemometrics
Multivariate statistical analysis of chemical data that is aimed at identifying differences between two or more groups. In the context of tree disease resistance, chemometrics is used to identify spectral signatures that are capable of distinguishing between resistant and susceptible trees.
Vibrational spectroscopy-based approaches, like Fourier-transform mid-infrared (FT-IR) spectroscopy, near-infrared (NIR) reflectance spectroscopy, and Raman spectroscopy typically are more rapid, reproducible, and reliable than traditional metabolomic methods, like high performance liquid chromatography (Fiehn, 2001, 2002). Chemical fingerprint data generated from IR and Raman spectrometers can be analyzed using various chemometric methods, like principal components analysis (PCA), soft independent modeling of class analogy (SIMCA), or partial least squares regression (PLSR) (Goodacre et al., 2004; Allwood et al., 2008; Cozzolino, 2014).
Although spectroscopic approaches have been widely used to assess the physiological status of trees, particularly in relation to water stress, there are relatively few examples of where vibrational spectroscopy-based methods, combined with chemometrics, have been used to distinguish between trees that vary in disease susceptibility. Early examples are provided in a series of papers by Martin et al. in the mid to late 2000s, in which the authors detailed the use of FT-IR spectroscopy, combined with chemometrics, to distinguish between elm species and clones that differed in susceptibility to O. novo-ulmi before and after infection (Martin et al., 2005a,b; Martín et al., 2007, 2008). More recently Conrad et al. (2014) utilized FT-IR spectroscopy combined with chemometrics to identify Quercus agrifolia (coast live oak) naturally resistant to the non-native and invasive pathogen Phytophthora ramorum, the causal agent of sudden oak death.
The extensive use of vibrational spectroscopy-based methods in many different scientific disciplines is a testament to their general applicability and relative ease of use. For example, these methods have been used for human disease diagnosis (Ellis and Goodacre, 2006) and for general plant phenotyping (Cozzolino, 2014; Li et al., 2014). However, these methods have not been widely adopted for the study and identification of disease resistant trees, perhaps because most forest pathologists, and tree breeders are unaware of their potential applicability to this field. Therefore, the focus of this review is to: (1) summarize commonly used vibrational spectroscopic tools and chemometric methods, (2) provide specific examples of where such tools have been used in the context of trees and tree diseases, and (3) discuss future applications of this technology for large-scale screening and identification of disease resistant trees.
Vibrational Spectroscopy-Based Methods for Chemical Fingerprinting
Vibrational spectroscopy-based methods, which include IR and Raman spectroscopy, can produce chemical fingerprints of solid, liquid, and gaseous samples, and have the capability to be adapted for high-throughput analysis (Diem, 1993; Fiehn, 2001). Solid samples include intact leaf or twig tissue, or ground tissue. Liquid extracts from tree tissues can also be analyzed, often with benchtop or portable (i.e., smaller and easier to transport) devices in laboratory settings. Handheld devices can be used beyond the laboratory and are most appropriate for in-field or forest applications.
Fourier-Transform (mid)-Infrared (FT-IR) Spectroscopy
FT-IR spectroscopy measures changes in the molecular absorption of IR radiation and vibrations (e.g., stretching, bending, deformation), which are influenced by molecular structure (Diem, 1993; Guillén and Cabo, 1997; Ellis and Goodacre, 2006; reviewed in Rodriguez-Saona and Allendorf, 2011). It is commonly used to examine the mid-infrared (MIR) spectral region, which ranges from 4000 to 600 cm−1 (cm−1—inverse wavenumbers) or 2500–25,000 nm (reviewed in Ellis and Goodacre, 2006; Cozzolino, 2014). FT-based methods use interferometers to collect and focus emitted light, and with FT-IR spectroscopy all the wavelengths are analyzed simultaneously as they arrive at the detector (Diem, 1993).
Fourier transformation is also combined with NIR and Raman spectroscopy; however, for the purpose of this review, FT-IR spectroscopy will be used to describe analyses of the MIR spectral region, unless otherwise noted. The MIR spectral region contains many sharp peaks and thus is information rich (Figure 1), which is why it is often said to contain the fingerprint region or zone (Ellis and Goodacre, 2006). One potential disadvantage of using the MIR spectral region for analysis is that water absorbs strongly in this region. To mitigate this, different approaches can be used to remove potentially obscuring signals, such as sample dehydration or utilization of attenuated total reflectance attachments (reviewed in Ellis and Goodacre, 2006).
FIGURE 1
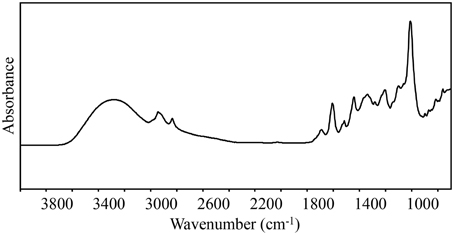
Figure 1. A representative chemical fingerprint using raw spectra collected in the mid-IR region (4000–700 cm−1) from Quercus agrifolia. FT-IR spectroscopy produces chemical fingerprints that can be analyzed using chemometrics to identify spectral differences between resistant and susceptible trees.
Laboratory benchtop and portable FT-IR spectrometers are most commonly used for sample analysis, although handheld devices equipped with attenuated total reflectance accessories are available (Sorak et al., 2012; Santos et al., 2013). Handheld devices could be readily adopted for in-field (forest) use, though device size may impact measurements, since smaller devices may have reduced performance (Sorak et al., 2012). Still, the obvious benefits of handheld devices—i.e., potential for in-field measurement of chemical fingerprints, without the need to process samples in the laboratory—would likely outweigh any reduction in measurement performance.
Near-Infrared (NIR) Spectroscopy
Like with FT-IR spectroscopy, the attenuation of the IR beam as it passes through the sample is monitored by NIR spectroscopy as a function of wavelength (or wavenumber) (Diem, 1993). Minimum sample preparation is required for NIR spectroscopy, and sample analysis is relatively straightforward. NIR spectrometers—which cover spectral ranges from 13,400 to 4000 cm−1 (750–2500 nm)—are capable of analyzing organic chemical structures containing O-H, N-H, and C-H bonds (Foley et al., 1998; Cozzolino, 2014). Unique physico-chemical properties of different molecules result in characteristic spectra through wavelength-dependent scattering and absorption (Cozzolino, 2014). However, unlike analysis in the MIR region, peaks from NIR spectroscopy are not distinct or sharp and can be lower in intensity (Foley et al., 1998; Cozzolino, 2014).
There are many commercial options available for high-throughput screening and/or phenotyping using portable and handheld NIR spectrometers, some of which come equipped with interchangeable accessories, like fiber-optic probes (Foley et al., 1998; Sorak et al., 2012; Warburton et al., 2014). While NIR spectrometers may be less sensitive and accurate than FT-IR spectrometers and Raman spectrometers (see below), ease of use and generally lower costs for NIR sample analysis make it an ideal tool for rapidly screening trees for disease resistance (Lupoi et al., 2014).
Raman Spectroscopy
Raman spectroscopy also is capable of producing chemical fingerprints; however, Raman spectroscopy measures the exchange of energy at a given wavelength after molecules are irradiated with an excitation source, such as a laser (Ellis and Goodacre, 2006; Lupoi et al., 2014). Instead of measuring the attenuation of light itself (as in IR spectroscopy), Raman spectroscopy measures the spectra of scattering photons coming from the sample (Diem, 1993). Raman shifts in wavelength of incident laser light are analogous to IR absorption by molecules after they are interrogated with an IR beam (Ellis and Goodacre, 2006). For this reason, data analysis is essentially the same for IR and Raman spectroscopy.
One potential disadvantage of using Raman spectroscopy is that the Raman effect may be weak, requiring longer signal collection times (i.e., the amount of time spectra must be collected by the detector) (Ellis and Goodacre, 2006). Still, there are many advantages to using Raman spectroscopy. For example, handheld and portable Raman spectrometers may be more appropriate for on-site qualitative analysis than other IR-based devices, because the laser focus can be positioned directly on a sample—e.g., a sample can be analyzed even if stored in a plastic bag or glass vial—and water does not have an obscuring effect on spectra (Ellis and Goodacre, 2006; Sorak et al., 2012).
Chemometric Analysis of Chemical Fingerprint Data
Regardless of the approach used to generate chemical fingerprints of biological samples, fingerprint data must be analyzed using appropriate methods (i.e., chemometrics) in order to reveal underlying spectral patterns that may be associated with variation between groups, either before or after pathogen infection, and ultimately to develop accurate models for predicting tree resistance. There are three primary steps to analyzing chemical fingerprints: (1) pre-processing of raw data to minimize background noise and to improve model fit; (2) chemometric methods, including methods for data visualization, data mining, data reduction, and predictive modeling; and (3) model validation, including methods for assessing model fit and accuracy.
Data Pre-processing
Pre-processing methods are needed to deconvolute overlapping bands (peaks), minimize background and noise, and improve model predictions. There are a variety of different methods for spectral data normalization and smoothing, which can be used individually or in combination. Commonly used methods for pre-processing spectral data can be found in Table 1.
TABLE 1
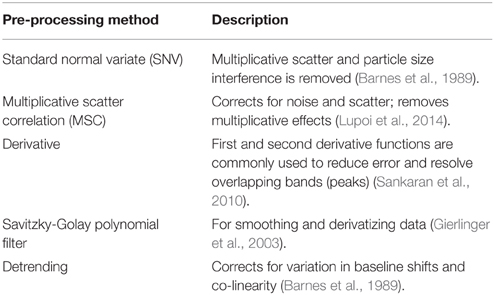
Table 1. Commonly used pre-processing methods for infrared spectroscopy and Raman spectroscopy derived data.
Chemometric Methods
In order to use chemical fingerprints to develop models capable of accurately grouping trees based on variation in susceptibility, data need to be visualized and the most important spectra for discriminating between groups need to be identified (Gierlinger et al., 2003; Durgante et al., 2013). The chemometric methods used should be able to reduce the dimensionality of data and handle potential co-linearity between variables. These methods should also be capable of identifying which factors or latent variables are most important and should be included in the final model. Calibration models (i.e., models developed from a training data set) that are over-fit contain too many factors or latent variables and thus take into account random noise (Lupoi et al., 2014). Over-fit models may appear to be more accurate when tested against training data, but will make less accurate predictions when used on a testing data set, and can be avoided by using cross validation (see subsequent section) (Moore et al., 2010; Lupoi et al., 2014).
KEY CONCEPT 4. Training and testing data sets
Training data are used to build a predictive model, whereas testing data, which were not included in the training data set, are used for model validation and can also be used to assess model sensitivity and specificity.
There are two primary types of chemometric models: supervised (a priori groupings used to inform the model) and unsupervised (a priori groupings are not used to inform the model). There are many methods for supervised analysis, including: SIMCA, partial least squares discriminant analysis (PLS-DA), PLSR, and linear discriminant analysis (LDA) (Sankaran et al., 2010; Guzmán et al., 2012; Durgante et al., 2013). For supervised analysis, samples must be grouped (i.e., phenotyped) using reliable and accurate methods. Among unsupervised approaches, PCA is used most widely. Based on our review of literature related to trees and IR and Raman spectroscopy, we compiled a list of commonly used chemometric methods and included a general description of each method in Table 2. Finally, while some methods can be used independently (e.g., SIMCA), others should be used in conjunction (e.g., PCA combined with DFA or LDA) to identify important spectra and to develop models capable of discriminating between groups of trees that vary in disease susceptibility. See Figure 2 for an example of a hypothetical output from SIMCA analysis.
TABLE 2
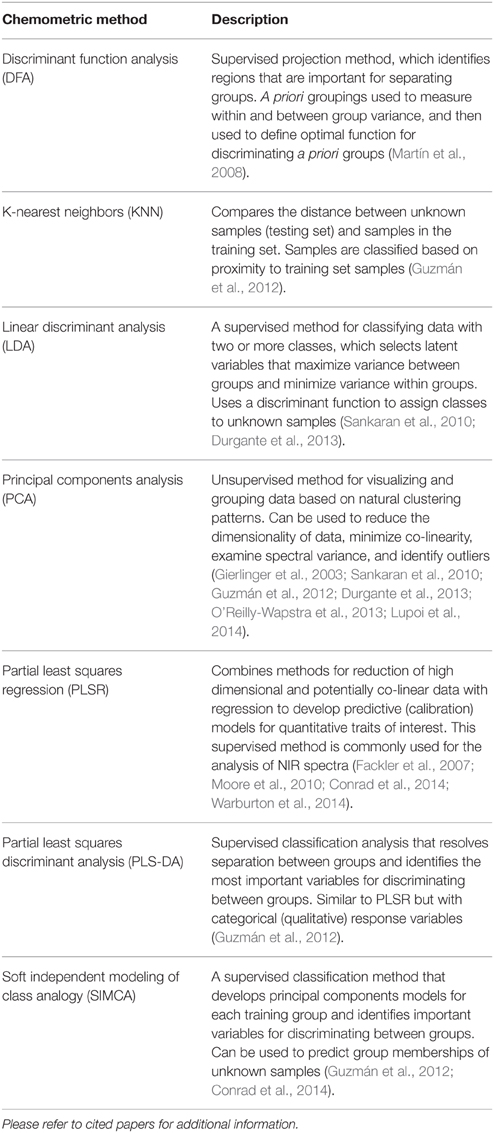
Table 2. List of commonly used chemometric methods for visualizing and mining spectral data, and for building predictive models from spectral data for trees.
FIGURE 2
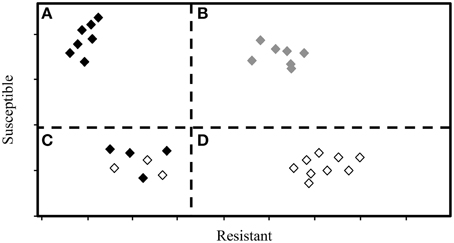
Figure 2. This hypothetical output from SIMCA analysis displays the relative, dimension-free distance between samples (trees), and groupings of individual trees into resistant and susceptible phenotypes. Dashed lines represent critical sample residual thresholds. Trees in quadrant (A) would be classified as resistant by the SIMCA model, while trees in quadrant (B) would be classified as neither resistant nor susceptible, i.e., as ambiguous. Trees in quadrant (C) could be classified as either resistant or susceptible, and may therefore include trees of intermediate phenotype. Trees in quadrant (D) would be classified as susceptible.
Model Validation
The final step in analysis of chemical fingerprint data, model validation is the most important for ensuring that accurate and good-fitting models have been developed (see Moore et al., 2010; Sankaran et al., 2010; Guzmán et al., 2012; O'Reilly-Wapstra et al., 2013; Lupoi et al., 2014). Validation can include testing the calibration model (i.e., the model derived from the training data set) on a testing data set, or using cross validation (Foley et al., 1998). For cross validation, the sample population is randomly divided into smaller groups and an iterative process is used to test predictions of one group based on calibration models developed from the remaining groups (Foley et al., 1998). Leave-one-out cross validation (LOOCV) is a commonly used method that involves removing one individual (instead of group) at a time (Durgante et al., 2013; Lupoi et al., 2014). Validation using a testing set can be used when the sample size is large enough to split data sets into two, while cross validation methods may be more appropriate for data sets with smaller samples sizes and are more convenient because a testing data set does not need to be maintained (Foley et al., 1998).
KEY CONCEPT 5. Model validation
In order to ensure accurate predictions, models must be validated by testing model predictions on a naïve data set (i.e., testing data set) or by using cross-validation methods, such as leave-one-out cross validation.
Chemical Fingerprinting of Trees using IR and Raman Spectroscopy
FT-IR Spectroscopy
For more than 10 years, FT-IR spectroscopy combined with chemometrics has been used as a tool to discriminate between trees that differ in disease susceptibility before and after pathogen infection. The elm (Ulmus spp.)-O. novo-ulmi pathosystem (Martin et al., 2005a,b; Martín et al., 2007, 2008) is the most studied system. Using FT-IR spectroscopy combined with chemometrics (e.g., PCA and DFA), Martin et al. (2005a,b) were able to monitor chemical changes in resistant and susceptible U. minor following infection with O. novo-ulmi. Using the same approach, Martín et al. (2007) detected changes in chemical profiles, specifically in lignin levels, of inoculated U. minor and U. minor × U. pumila hybrids compared to their respective non-inoculated controls. Finally, they used chemical fingerprints from healthy xylem tissue to separate resistant U. pumila, susceptible U. minor, and resistant U. minor clones and identify spectral bands that were important for discriminating between those groups (Martín et al., 2008).
More recently, Hardoim et al. (2015) used FT-IR spectroscopy and chemometrics to examine changes in the metabolic patterns of Quercus suber roots following infection with the pathogen Phytophthora cinnamomi; significant differences in the intensity of certain spectral bands were detected between inoculated and mock-inoculated plants. Vivas et al. (2014) also recently used a combined FT-IR spectroscopic and chemometric approach to analyze maternal effects on the MIR spectrum of Pinus pinaster before and after inoculation with the pathogen Fusarium circinatum, the causal agent of pitch canker disease. They found that control seedlings from an unfavorable maternal environment, which were previously found to be less tolerant to F. circinatum (compared to seedlings from a favorable maternal environment), showed higher mean absorbances in the MIR spectral region compared to control seedlings from a favorable maternal environment; the same pattern held for seedlings after pathogen inoculation (Vivas et al., 2014). The authors concluded that variation in the intensity of the MIR spectrum may be associated with seedling carbohydrate content, and changes in carbohydrate content of seedlings following infection may impact their tolerance to F. circinatum (Vivas et al., 2014).
In our own work, we used a combined FT-IR spectroscopy and chemometric approach to distinguish between resistant and susceptible Q. agrifolia from natural populations before infection with the pathogen P. ramorum (Conrad et al., 2014). SIMCA analysis was used to discriminate between resistant and susceptible Q. agrifolia trees and to identify the most important spectra for discriminating between those groups (Conrad et al., 2014). In addition, PLSR was used to estimate the concentration of specific phenolic compounds previously associated with Q. agrifolia resistance to P. ramorum, based on FT-IR spectra.
NIR Spectroscopy
Even though NIR reflectance spectroscopy has been used widely, the technique has not been used extensively to screen trees for disease resistance. FT-NIR combined with PLSR was used to predict larch (Larix spp.) heartwood durability—a trait of interest in many tree breeding programs—and PCA was used to examine spectral variation between durability classes (Gierlinger et al., 2003). Furthermore, NIR spectroscopy combined with PLSR was used to predict decay resistance of Pinus sylvestris heartwood to the brown rot fungus Poria placenta (Flæte and Haartveit, 2004). Although the authors were primarily interested in using the technology to assess natural tree durability after harvesting, the results suggest that NIR spectroscopy can be used to detect chemical differences between groups that are phenotypically different (Flæte and Haartveit, 2004).
The ability to detect chemical differences between groups is important, because plant-derived chemicals are often associated with tree defense responses. For example Moore et al. (2010) used NIR reflectance spectroscopy to examine the relationship between palatability of Eucalyptus foliage and the total amount of formylated phloroglucinol compounds (FPCs). FPCs are known deterrents of koala feeding (Moore et al., 2010). These authors were able to estimate the total concentration of FPC in Eucalyptus foliage using calibration models that were created using NIR spectra and concentrations of FPC in Eucalyptus foliage quantitated by high performance liquid chromatography. Estimates were then combined with spatial tree distribution data to produce palatability maps based on koala feeding preferences of Eucalyptus foliage. A similar approach could be used to map the distribution of disease resistant trees on a landscape scale.
Most recently, O'Reilly-Wapstra et al. (2013) used chemical fingerprints generated from NIR reflectance spectroscopy (using a FT-NIR spectrometer equipped with a fiber optic probe), in combination with chemometric analysis (PCA and linear models), to differentiate between multiple generations of interspecific Eucalyptus globulus × Eucalyptus nitens hybrids and parent species. While the authors did not use this method to screen trees for disease resistance, they clearly showed that the technique can be used to discriminate between groups based on genetic differences in chemistry. Since tree disease resistance is genetically based and often an inherited trait, it is plausible that NIR spectroscopy and chemometrics could also be used to distinguish between genetic-based differences in resistance that manifest as differences in chemical composition. Further applications and examples of NIR spectroscopy for analyzing the chemical composition, anatomical features, mechanical properties, and other attributes of trees can be found in a recent review by Tsuchikawa and Kobori (2015).
Raman Spectroscopy
We were unable to find any papers where Raman spectroscopy and chemometrics were used to distinguish between trees that varied in disease susceptibility. However, it has been used to measure and estimate various chemical constituents of trees. For example, FT-Raman spectroscopy was used to study chemical changes in waterlogged Pinus spp. and Quercus spp. (Petrou et al., 2009). The authors assessed the depletion of cellulose, hemicellulose, and lignin in ancient wood samples from these tree species. Raman spectroscopy was also used to measure the lignin syringyl/guaiacyl (S/G) ratio of 17 eucalypt and Acacia tree species (Lupoi et al., 2014). Lupoi et al. (2014) were interested in assessing whether or not Raman (but also MIR and NIR) could be used to screen trees for biofuel feedstock candidates. While all three methods could be used to estimate S/G ratios, estimations were most accurate when determined using spectral data collected from Raman and MIR spectroscopy (Lupoi et al., 2014). Finally, a portable Raman spectrometer (equipped with a laser diode and optical fiber) was used to assess the quality of fruit from olive trees and could differentiate between sound (i.e., higher quality) and ground (i.e., lower quality) fruit using PCA, SIMCA, PLS-DA, and KNN (Guzmán et al., 2012).
Raman spectroscopy is clearly capable of detecting chemical differences between sample groups. Since plant-derived chemicals (e.g., phenolics) can be associated with tree resistance (reviewed in Witzell and Martin, 2008), this technology could also be used to identify spectra associated with variation in tree disease resistance.
Future Application of IR and Raman Spectroscopy for Identifying Disease Resistant Trees
In the preceding sections, we described methods for chemically fingerprinting trees using IR and Raman spectroscopy. Chemical fingerprinting, when combined with chemometrics, is a powerful tool that can be used to distinguish between groups of trees that vary in disease susceptibility. Alternatively, these methods could be used to estimate quantitative traits of interest, like the concentration of plant-derived chemicals, which may be associated with resistant tree responses.
Many of the studies referenced above utilized benchtop spectrometers for chemical fingerprinting of samples; however, there are many portable and handheld devices available that could be used directly in the forest to screen larger numbers of trees for disease resistance, once protocols to deal with fresh tissues have been optimized (see reviews by Sorak et al., 2012; Cozzolino, 2014). Handheld devices have not yet been used for this purpose, though on-site screening methods using NIR spectroscopy have been developed to predict sugarcane smut resistance for plant breeding (Purcell et al., 2011) and portable NIR spectrometers were used for in-forest prediction of Kraft pulp yield and cellulose content of standing trees (Meder et al., 2011). Although Meder et al. (2011) acknowledge that their approach needs to be modified to improve accuracy of model predictions, they believe hand-held devices are a feasible, rapid, and low-cost alternative that can be used to screen trees for breeding programs.
Handheld or automated laboratory devices will need to be utilized if chemical fingerprinting by IR and Raman spectroscopy is to be implemented on more high-throughput scales to efficiently screen trees for disease resistance. Instruments for these types of analyses are commercially available and chemometric pipelines for analyzing large data sets are well established. The next steps will be to scale-up existing experiments using handheld and portable devices, increase sample diversity within training and testing data sets, and validate predictive models for in-forest assessment of tree resistance. Once these steps have been completed, chemical fingerprinting and chemometrics should be viewed as a reliable method for screening individuals in tree breeding programs and for managing forest diseases by identifying and utilizing naturally resistant trees.
Author Contributions
AC and PB discussed content and structure of review prior to writing review. AC reviewed relevant literature and compiled initial draft of review. PB reviewed first and subsequent drafts and contributed content. AC revised manuscript based on PB contributions and feedback.
Conflict of Interest Statement
The authors declare that the research was conducted in the absence of any commercial or financial relationships that could be construed as a potential conflict of interest.
Acknowledgments
The authors thank Dr. Caterina Villari and Dr. Luis Rodriguez-Saona for pre-submission reviews, and two reviewers of the first submission for providing constructive feedback that led to significant improvements in the quality of the document.
Author Biography

References
Allwood, J. W., Ellis, D. I., and Goodacre, R. (2008). Metabolomic technologies and their application to the study of plants and plant-host interactions. Physiol. Plant. 132, 117–135. doi: 10.1111/j.1399-3054.2007.01001.x
Barnes, R. J., Dhanoa, M. S., and Lister, S. J. (1989). Standard normal variate transformation and de-trending of near-infrared diffuse reflectance spectra. Appl. Spectrosc. 43, 772–777. doi: 10.1366/0003702894202201
Burnham, C. (1988). The restoration of the American chestnut: mendelian genetics may solve a problem that has resisted other approaches. Am. Sci. 76, 478–487.
Conrad, A. O., Rodriguez-Saona, L. E., McPherson, B. A., Wood, D. L., and Bonello, P. (2014). Identification of Quercus agrifolia (coast live oak) resistant to the invasive pathogen Phytophthora ramorum in native stands using Fourier-transform infrared (FT-IR) spectroscopy. Front. Plant Sci. 5:521. doi: 10.3389/fpls.2014.00521
Cozzolino, D. (2014). Use of infrared spectroscopy for in-field measurement and phenotyping of plant properties: instrumentation, data analysis, and examples. Appl. Spectrosc. Rev. 49, 564–584. doi: 10.1080/05704928.2013.878720
Durgante, F. M., Higuchi, N., Almeida, A., and Vicentini, A. (2013). Species spectral signature: discriminating closely related plant species in the Amazon with near-infrared leaf-spectroscopy. For. Ecol. Manage. 291, 240–248. doi: 10.1016/j.foreco.2012.10.045
Ellis, D. I., and Goodacre, R. (2006). Metabolic fingerprinting in disease diagnosis: biomedical applications of infrared and Raman spectroscopy. Analyst 131, 875–885. doi: 10.1039/b602376m
Ennos, R. A. (2015). Resilience of forests to pathogens: an evolutionary ecology perspective. Forestry 88, 41–52. doi: 10.1093/forestry/cpu048
Fackler, K., Schwanninger, M., Gradinger, C., Hinterstoisser, B., and Messner, K. (2007). Qualitative and quantitative changes of beech wood degraded by wood-rotting basidiomycetes monitored by Fourier transform infrared spectroscopic methods and multivariate data analysis. FEMS Microbiol. Lett. 271, 162–169. doi: 10.1111/j.1574-6968.2007.00712.x
Fiehn, O. (2001). Combining genomics, metabolome analysis, and biochemical modelling to understand metabolic networks. Comp. Funct. Genomics 2, 155–168. doi: 10.1002/cfg.82
Fiehn, O. (2002). Metabolomics – the link between genotypes and phenotypes. Plant Mol. Biol. 48, 155–171. doi: 10.1023/A:1013713905833
Flæte, P. O., and Haartveit, E. Y. (2004). Non-destructive prediction of decay resistance of Pinus sylvestris heartwood by near infrared spectroscopy. Scand. J. For. Res. 19, 55–63. doi: 10.1080/02827580410017852
Foley, W. J., McIlwee, A., Lawler, I., Aragones, L., Woolnough, A. P., and Berding, N. (1998). Ecological applications of near infrared reflectance spectroscopy - a tool for rapid, cost-effective prediction of the composition of plant and animal tissues and aspects of animal performance. Oecologia 116, 293–305. doi: 10.1007/s004420050591
Frankel, S. J. (2008). Sudden oak death and Phytophthora ramorum in the USA: a management challenge. Australas. Plant Pathol. 37, 19–25. doi: 10.1071/AP07088
Gierlinger, N., Jacques, D., Schwanninger, M., Wimmer, R., Hinterstoisser, B., and Pâques, L. E. (2003). Rapid prediction of natural durability of larch heartwood using Fourier transform near-infrared spectroscopy. Can. J. For. Res. 33, 1727–1736. doi: 10.1139/x03-092
Goodacre, R., Vaidyanathan, S., Dunn, W. B., Harrigan, G. G., and Kell, D. B. (2004). Metabolomics by numbers: acquiring and understanding global metabolite data. Trends Biotechnol. 22, 245–252. doi: 10.1016/j.tibtech.2004.03.007
Guillén, M. D., and Cabo, N. (1997). Infrared spectroscopy in the study of edible oils and fats. J. Sci. Food Agric. 75, 1–11.
Guzmán, E., Baeten, V., Pierna, J. A. F., and García-Mesa, J. A. (2012). A portable Raman sensor for the rapid discrimination of olives according to fruit quality. Talanta 93, 94–98. doi: 10.1016/j.talanta.2012.01.053
Hardoim, P. R., Guerra, R., Rosa da Costa, A. M., Serrano, M. S., Sánchez, M. E., and Coelho, A. C. (2015). Temporal metabolic profiling of the Quercus suber - Phytophthora cinnamomi system by middle-infrared spectroscopy. For. Pathol. doi: 10.1111/efp.12229. [Epub ahead of print].
Li, L., Zhang, Q., and Huang, D. (2014). A review of imaging techniques for plant phenotyping. Sensors 14, 20078–20111. doi: 10.3390/s141120078
Liebhold, A. M., Brockerhoff, E. G., Garrett, L. J., Parke, J. L., and Britton, K. O. (2012). Live plant imports: the major pathway for forest insect and pathogen invasions of the US. Front. Ecol. Environ. 10, 135–143. doi: 10.1890/110198
Lupoi, J. S., Singh, S., Davis, M., Lee, D. J., Shepherd, M., and Simmons, B. A., et al. (2014). High-throughput prediction of eucalypt lignin syringyl/guaiacyl content using multivariate analysis: a comparison between mid-infrared, near-infrared, and Raman spectroscopies for model development. Biotechnol. Biofuels 7:93. doi: 10.1186/1754-6834-7-93
Martín, J. A., Solla, A., Venturas, M., Collada, C., Domínguez, J., Miranda, E., et al. (2015). Seven Ulmus minor clones tolerant to Ophiostoma novo-ulmi registered as forest reproductive material in Spain. iForest 8, 172–180. doi: 10.3832/ifor1224-008
Martin, J., Solla, A., Woodward, S., and Gil, L. (2005b). Fourier transform-infrared spectroscopy as a new method for evaluating host resistance in the Dutch elm disease complex. Tree Physiol. 25, 1331–1338. doi: 10.1093/treephys/25.10.1331
Martin, J. A., Solla, A., Coimbra, M. A., and Gil, L. (2005a). Metabolic distinction of Ulmus minor xylem tissues after inoculation with Ophiostoma novo-ulmi. Phytochemistry 66, 2458–2467. doi: 10.1016/j.phytochem.2005.08.004
Martín, J. A., Solla, A., Coimbra, M. A., and Gil, L. (2008). Metabolic fingerprinting allows discrimination between Ulmus pumila and U. minor, and between U. minor clones of different susceptibility to Dutch elm disease. For. Pathol. 38, 244–256. doi: 10.1111/j.1439-0329.2007.00542.x
Martín, J. A., Solla, A., Woodward, S., and Gil, L. (2007). Detection of differential changes in lignin composition of elm xylem tissues inoculated with Ophiostoma novo-ulmi using Fourier transform-infrared spectroscopy. For. Pathol. 37, 187–191. doi: 10.1111/j.1439-0329.2007.00495.x
Meder, R., Brawner, J., Downes, G., and Ebdon, N. (2011). Towards the in-forest assessment of Kraft pulp yield: comparing the performance of laboratory and hand-held instruments and their value in screening breeding trials. J. Near Infrared Spectrosc. 19, 421. doi: 10.1255/jnirs.954
Moore, B. D., Lawler, I. R., Wallis, I. R., Beale, C. M., and Foley, W. J. (2010). Palatability mapping: a koala's eye view of spatial variation in habitat quality. Ecology 91, 3165–3176. doi: 10.1890/09-1714.1
Muranty, H., Jorge, V., Bastien, C., Lepoittevin, C., Bouffier, L., and Sanchez, L. (2014). Potential for marker-assisted selection for forest tree breeding: lessons from 20 years of MAS in crops. Tree Genet. Genomes 10, 1491–1510. doi: 10.1007/s11295-014-0790-5
Neale, D. B., and Kremer, A. (2011). Forest tree genomics: growing resources and applications. Nat. Rev. Genet. 12, 111–122. doi: 10.1038/nrg2931
O'Reilly-Wapstra, J. M., Freeman, J. S., Barbour, R., Vaillancourt, R. E., and Potts, B. M. (2013). Genetic analysis of the near-infrared spectral phenome of a global Eucalyptus species. Tree Genet. Genomes 9, 943–959. doi: 10.1007/s11295-013-0607-y
Oh, E., Hansen, E. M., and Sniezko, R. A. (2006). Port-Orford-cedar resistant to Phytophthora lateralis. For. Pathol. 36, 385–394. doi: 10.1111/j.1439-0329.2006.00474.x
Petrou, M., Edwards, H. G. M., Janaway, R. C., Thompson, G. B., and Wilson, A. S. (2009). Fourier-transform Raman spectroscopic study of a Neolithic waterlogged wood assemblage. Anal. Bioanal. Chem. 395, 2131–2138. doi: 10.1007/s00216-009-3178-x
Potter, C., Harwood, T., Knight, J., and Tomlinson, I. (2011). Learning from history, predicting the future: the UK Dutch elm disease outbreak in relation to contemporary tree disease threats. Philos. Trans. R. Soc. Lond. B 366, 1966–1974. doi: 10.1098/rstb.2010.0395
Purcell, D. E., Oxley, J. P., Cox, M. C., Croft, B. J., and O'Shea, M. G. (2011). On-site rapid screening for sugarcane smut resistance using near-infrared (NIR) spectroscopy. Int. Sugar J. 113, 135–139.
Resende, M. F. R., Muñoz, P., Resende, M. D. V., Garrick, D. J., Fernando, R. L., Davis, J. M., et al. (2012). Accuracy of genomic selection methods in a standard data set of loblolly pine (Pinus taeda L.). Genetics 190, 1503–1510. doi: 10.1534/genetics.111.137026
Rodriguez-Saona, L. E., and Allendorf, M. E. (2011). Use of FTIR for rapid authentication and detection of adulteration of food. Annu. Rev. Food Sci. Technol. 2, 467–483. doi: 10.1146/annurev-food-022510-133750
Rustad, L., Campbell, J., Dukes, J. S., Huntington, T., Fallon Lambert, K., Mohan, J., et al. (2012). Changing Climate, Changing forests: The Impacts of Climate Change on Forests of the Northeastern United States and Eastern Canada. Newtown Square, PA: U.S. Department of Agriculture, Forest Service, Northern Research Station, 48.
Sankaran, S., Mishra, A., Ehsani, R., and Davis, C. (2010). A review of advanced techniques for detecting plant diseases. Comput. Electron. Agric. 72, 1–13. doi: 10.1016/j.compag.2010.02.007
Santos, P. M., Pereira-Filho, E. R., and Rodriguez-Saona, L. E. (2013). Application of hand-held and portable infrared spectrometers in bovine milk analysis. J. Agric. Food Chem. 61, 1205–1211. doi: 10.1021/jf303814g
Sniezko, R. A., Hamlin, J., and Hansen, E. M. (2012). “Operational program to develop Phytophthora lateralis-resistant populations of Port-Orford-cedar (Chamaecyparis lawsoniana),” in Proceedings of the Fourth International Workshop on the Genetics of Host-parasite Interactions in Forestry: Disease and Insect Resistance in Forest Trees (Albany, CA: Pacific Southwest Research Station, Forest Service, U.S. Department of Agriculture), 65–79.
Sorak, D., Herberholz, L., Iwascek, S., Altinpinar, S., Pfeifer, F., and Siesler, H. W. (2012). New developments and applications of handheld Raman, mid-infrared, and near-infrared Spectrometers. Appl. Spectrosc. Rev. 47, 83–115. doi: 10.1080/05704928.2011.625748
Sturrock, R. N., Frankel, S. J., Brown, A. V., Hennon, P. E., Kliejunas, J. T., Lewis, K. J., et al. (2011). Climate change and forest diseases. Plant Pathol. 60, 133–149. doi: 10.1111/j.1365-3059.2010.02406.x
Telford, A., Cavers, S., Ennos, R. A., and Cottrell, J. E. (2015). Can we protect forests by harnessing variation in resistance to pests and pathogens? Forestry 88, 3–12. doi: 10.1093/forestry/cpu012
Tsuchikawa, S., and Kobori, H. (2015). A review of recent application of near infrared spectroscopy to wood science and technology. J. Wood Sci. 61, 213–220. doi: 10.1007/s10086-015-1467-x
Vivas, M., Nunes, C., Coimbra, M. A., and Solla, A. (2014). Maternal effects and carbohydrate changes of Pinus pinaster after inoculation with Fusarium circinatum. Trees 28, 373–379. doi: 10.1007/s00468-013-0955-0
Warburton, P., Brawner, J., and Meder, R. (2014). Technical Note: Handheld near infared spectroscopy for the prediction of leaf physiological status in tree seedlings. J. Near Infrared Spectrosc. 22, 433–438. doi: 10.1255/jnirs.1137
Wingfield, M. J., Brockerhoff, E. G., Wingfield, B. D., and Slippers, B. (2015). Planted forest health: the need for a global strategy. Science 349, 832–836. doi: 10.1126/science.aac6674
Witzell, J., and Martin, J. A. (2008). Phenolic metabolites in the resistance of northern forest trees to pathogens - past experiences and future prospects. Can. J. For. Res. 38, 2711–2727. doi: 10.1139/X08-112
Keywords: trees, disease, resistance, infrared and Raman spectroscopy, chemometrics
Citation: Conrad AO and Bonello P (2016) Application of Infrared and Raman Spectroscopy for the Identification of Disease Resistant Trees. Front. Plant Sci. 6:1152. doi: 10.3389/fpls.2015.01152
Received: 15 October 2015; Accepted: 04 December 2015;
Published: 07 January 2016.
Edited by:
Roger Deal, Emory University, USAReviewed by:
Steve Woodward, University of Aberdeen, UKAlejandro Solla, Universidad de Extremadura, Spain
Copyright © 2016 Conrad and Bonello. This is an open-access article distributed under the terms of the Creative Commons Attribution License (CC BY). The use, distribution or reproduction in other forums is permitted, provided the original author(s) or licensor are credited and that the original publication in this journal is cited, in accordance with accepted academic practice. No use, distribution or reproduction is permitted which does not comply with these terms.
*Correspondence: anna.conrad@uky.edu