 G. Brett Runion
 Stephen A. Prior
 Ludovic J. A. Capo-chichi
 H. Allen Torbert
 Edzard van Santen3
- 1National Soil Dynamics Laboratory, Agricultural Research Service, United States Department of Agriculture, Auburn, AL, USA
- 2Alberta Innovates Technology Futures, Vegreville, AB, Canada
- 3Department of Crop, Soil and Environmental Sciences, Auburn University, Auburn, AL, USA
Cogongrass [Imperata cylindrica (L.) P. Beauv] is an invasive C4 perennial grass which is listed as one of the top ten worst weeds in the world and is a major problem in the Southeast US. Five cogongrass ecotypes [Florida (FL), Hybrid (HY), Louisiana (LA), Mobile (MB), and North Alabama (NA)] collected across the Southeast and a red-tip (RT) ornamental variety were container grown for 6 months in open top chambers under ambient and elevated (ambient plus 200 ppm) atmospheric CO2. Elevated CO2 increased average dry weight (13%) which is typical for grasses. Elevated CO2 increased height growth and both nitrogen and water use efficiencies, but lowered tissue nitrogen concentration; again, these are typical plant responses to elevated CO2. The HY ecotype tended to exhibit the greatest growth (followed by LA, NA, and FL ecotypes) whiles the RT and MB ecotypes were smallest. Interactions of CO2 with ecotype generally showed that the HY, LA, FL, and/or NA ecotypes showed a positive response to CO2 while the MB and RT ecotypes did not. Cogongrass is a problematic invasive weed in the southeastern U.S. and some ecotypes may become more so as atmospheric CO2 continues to rise.
Introduction
Invasive plants are estimated to cost U.S. agricultural and forest producers 34 billion dollars annually from decreased productivity and increased cost of weed control and are considered to be a major threat to the Earth’s biodiversity (Pimentel, 2002). Elevated CO2 stimulates plant photosynthesis, resource use efficiency, and biomass production (Amthor, 1995) which may affect the physiology and competitiveness of invasive plants. However, the effects of elevated CO2 on invasive plants remains an understudied aspect of global change research. Bright (1998) summarizes, “Fast-growing, highly invasive plants may also be able to profit directly from the atmosphere’s increased carbon content...any slower-growing natives would tend to lose out to the invaders.” It has been suggested that the increase in the atmospheric concentration of CO2 since the beginning of the 20th century may be a primary factor affecting the establishment and spread of some invasive species (Ziska, 2003).
Invasive plants can disrupt terrestrial ecosystems, particularly in the southeastern U.S. with its numerous ports of entry and mild climate. One example that has become a serious problem is cogongrass [Imperata cylindrica (L.) P. Beauv], a perennial grass native to Southeast Asia which was introduced into the southeastern U.S. in the early 1900s (Tabor, 1949) for forage, erosion control and as packing material (Bryson and Carter, 1993). It is a widespread invader to warmer regions (>500 million ha worldwide), is tolerant of shade, poor soils, and drought and naturalizes aggressively in dense monocultures which displace native plants (Bryson and Carter, 1993). Cogongrass is one of the top ten worst weeds in the world (Holm et al., 1991) and is a Federal Noxious Weed (Miller et al., 2010). Cogongrass is a major problem in the Southeast on disturbed lands such as forest plantations and roadsides and may become problematic on agricultural lands (Patterson et al., 1980). It is present in five or more varieties including a commercially available red-tip (RT; ‘Red Baron’) ornamental sold by nurseries in some states (Capo-chichi et al., 2008). Sale of this RT variety is prohibited in some southern states and removal of prior plantings has been recommended since it has viable pollen that might spread to invasive cogongrass plants and has been known to revert back to the green aggressive type (Miller et al., 2010).
It has been suggested that populations introduced from several origins over an extended period of time should have higher genetic diversity than populations that were introduced only a few times or from a single source (Pappert et al., 2000). For example, cogongrass was first introduced to Alabama from Japan (Tabor, 1952), but has likely also arrived from other locations to different ports of entry. Genetic characterization of differing populations of cogongrass may help explain spread dynamics and means of establishment (Capo-chichi et al., 2008). These investigators determined that genetic variation within and between cogongrass sites in the southern U.S. was quite large given how recently it was introduced. Spread dynamics were found to be greatly influenced by anthropogenic activities (e.g., soil disturbance, canopy removal) compared to natural factors which may accelerate opportunities for bringing together cross-compatible species previously isolated by ecology and/or geography. The objective of this study was to evaluate the response of five cogongrass ecotypes collected across the southeastern U.S. plus the RT variety to ambient and elevated atmospheric CO2. This is the first study to examine the effects of elevated CO2 on cogongrass and the first for any weed species to look at potential differences among ecotypes.
Materials and Methods
The study was conducted at the soil bin facilities at the USDA-ARS National Soil Dynamics Laboratory, Auburn, Alabama. The bin used for the experimental setup is 6 m wide and 76 m long and has been modified for container studies; modifications consisted of installing a geomembrane liner (20 mL) and gravel drain system to ensure a good working surface and drainage for container studies. Open top field chambers (OTC; Rogers et al., 1983a), encompassing 7.3 m×7.3 m of ground surface area, were used to continuously deliver target CO2 concentrations of ambient or ambient plus 200 μmol mol-1 (elevated) using a delivery and monitoring system described by Mitchell et al. (1995).
The six cogongrass ecotypes used in this study were from a collection maintained at Auburn University and included Louisiana, North Alabama, Florida, Mobile, a LA-MB HY, and RT. The MB ecotype was from the suspected point of introduction near Grand Bay in Mobile County, AL as described by Tabor (1952). The RT represents a commercially available variety that can be found in ornamental nurseries. Rhizomes were collected, stored in plastic bags, and transported to glasshouses at the Plant Sciences Research Center of the Alabama Agricultural Experiment Station on the campus of Auburn University for molecular analysis. An out-crossing involving the non-native and native species led to different genotypes such as the LA-MB HY. Amplified Fragment Length Polymorphism (AFLP) confirmed that the cogongrass ecotype LA-MB HY was derived from non-native (wild type cogongrass ecotype) and native (non-invasive cogongrass ecotype) species (Capo-chichi et al., 2008). The atpB-rbcL non-coding spacer of chloroplast DNA revealed that only a few nucleotide substitutions contributed to the variation among the wild cogongrass MB ecotype and the RT (data not shown).
Plants were grown in a peat-based general purpose growing medium (PRO-MIX Bx, Premier Horticulture Inc., Quakertown, PA 18951, USA) in 1.65 L tree-pots (Short One Tree-pot, 10 cm × 23 cm, Stuewe and Sons Inc., Corvallis, OR 97333, USA) in a glasshouse for establishment (∼3 wk). Plants were then transplanted into 10.65 L tree pots (TPOT4 Round Tree-pot, 22 cm × 39 cm, Stuewe and Sons Inc., Corvallis, OR 97333, USA) containing the same standard growth medium described above. Forty-eight containers of each ecotype were selected for use in the study. These plants were ranked, according to size and placed into four groups of 12 containers each, representing the largest 12 first in declining order down to the smallest 12; one container from each group was randomly assigned to each of the 12 OTCs (i.e., four containers of each plant ecotypes in each chamber). The study was conducted as a randomized complete block design with the six blocks occurring along the length of the soil bin. Plants were fertilized monthly with Miracle-Gro (15:30:15, N:P:K; Scotts Products Inc., Marysville, OH, USA) according to manufacture recommendations by mixing 600 g Miracle-Gro in 130 L deionized water; each plant received 500 mL of this solution. Containers were subjected to ambient rainfall and watered once or twice a week (1 L per container) to prevent drought-induced plant mortality.
Prior to harvest, WUE was calculated from LI-6400 Portable Photosynthesis System (LI-COR, Inc., Lincoln, NE, USA) measurements. After 6 months, height was measured and the aboveground portions were harvested by severing the plant at the ground-line. Roots were separated from the growing medium using the sieve method (Bohm, 1979). Above- and belowground plant components were then dried separately in a forced-air oven at 55°C to a constant weight, and dry weights recorded. Subsamples of above- and belowground biomass (1 mm sieve) were analyzed separately for N by dry combustion using a LECO TruSpec analyzer (LECO Corp., St. Joseph, MI, USA). Prior to analyses, data from the four containers of each ecotype within each chamber were averaged making the chamber the experimental unit (N = 6). Statistical analyses were conducted using the Mixed Models procedure (Proc Mixed) from SAS (Littell et al., 1996). In all cases, differences were considered significant at P ≤ 0.05 and trends were recognized at 0.05 > P ≤ 0.10.
Results
Cogongrass height was significantly increased (P < 0.001) under elevated atmospheric CO2 (111.3 cm) compared to ambient conditions (105.4 cm) when averaged across all ecotypes (Figure 1). When averaged across CO2 concentrations, significant differences in height (P < 0.001) were noted among the ecotypes (i.e., LA = NA > FL > HY > MB > RT). Further, a significant interaction (P = 0.001) showed that height was increased by elevated CO2 for LA, NA, FL, and HY only (Figure 1).
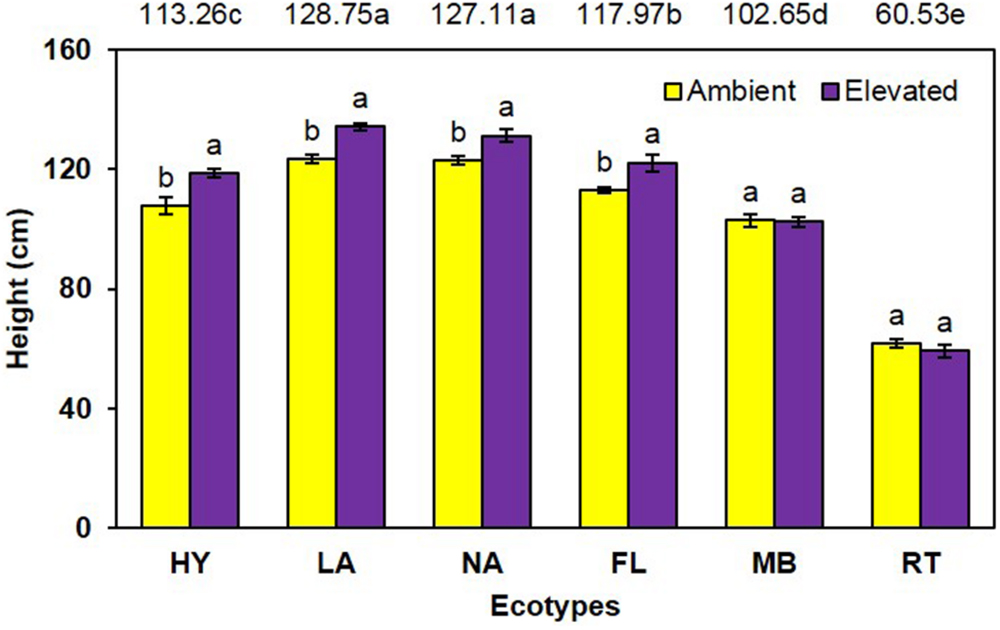
FIGURE 1. Height of cogongrass ecotypes under ambient and elevated atmospheric CO2 (HY, Hybrid; LA, Louisiana; NA, North Alabama; FL, Florida; MB, Mobile; RT, Red-tip). N = 6. Means with standard errors are shown; standard errors reflect the variability in the data and are not a means separation technique. Main effects of CO2 (P < 0.001), ecotype (P < 0.001), and their interaction (P = 0.001) were significant. Bars with different letters show a significant effect of CO2 for each ecotype; main effect ecotype means shown at the top of the graph (means followed by the same letter are not significantly different).
Similarly, aboveground dry weight was significantly increased (P = 0.001) 13% under elevated (98.5 g) compared with ambient (87.4 g) CO2 (Figure 2). A significant main effect of ecotype (P < 0.001) was also observed (i.e., HY > LA > NA = FL > MB > RT) as was a trend for an interaction (P = 0.095), where dry weight was increased by elevated CO2 for HY, LA, and FL only (Figure 2).
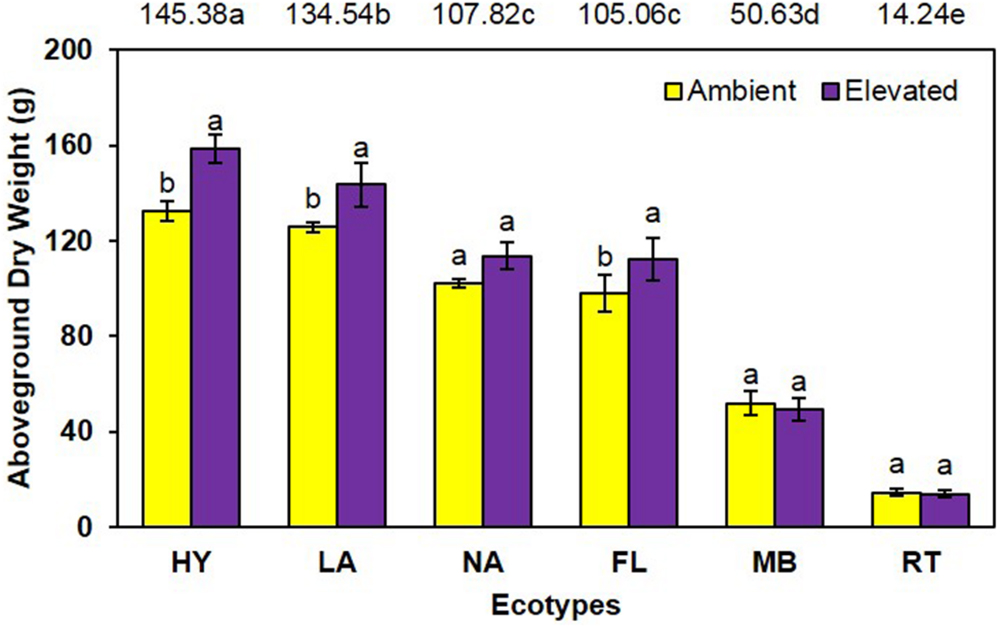
FIGURE 2. Aboveground biomass of cogongrass ecotypes under ambient and elevated atmospheric CO2 (HY, Hybrid; LA, Louisiana; NA, North Alabama; FL, Florida; MB, Mobile; RT, Red-tip). N = 6. Means with standard errors are shown; standard errors reflect the variability in the data and are not a means separation technique. Main effects of CO2 (P = 0.001) and ecotype (P < 0.001) were significant and their interaction showed a trend (P = 0.095). Bars with different letters show a significant effect of CO2 for each ecotype; main effect ecotype means shown at the top of the graph (means followed by the same letter are not significantly different).
Although elevated CO2 resulted in a slight increase (8.9%) in belowground dry weight (elevated = 155.6 g vs. ambient = 142.9 g; Figure 3), this effect was not statistically significant (P = 0.118). However, the main effect of ecotype was significant (P < 0.001; HY > NA > FL = LA > MB > RT. No significant CO2 by ecotype interaction (P = 0.487) was noted for this measure.
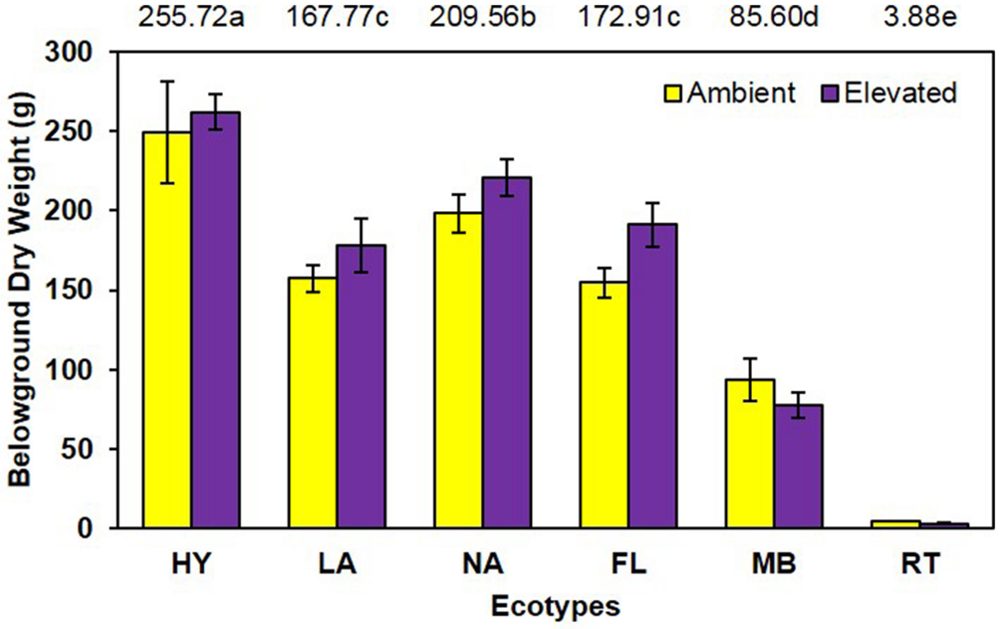
FIGURE 3. Belowground biomass of cogongrass ecotypes under ambient and elevated atmospheric CO2 (HY, Hybrid; LA, Louisiana; NA, North Alabama; FL, Florida; MB, Mobile; RT, Red-tip). N = 6. Means with standard errors are shown; standard errors reflect the variability in the data and are not a means separation technique. Main effect of ecotype (P < 0.001) was significant while the main effect of CO2 showed a trend (P = 0.118) and their interaction (P = 0.487) was not significant. The omission of letters above bars indicates no effect of CO2 for any ecotype; main effect ecotype means shown at the top of the graph (means followed by the same letter are not significantly different).
Unlike growth measurements, the main effect of CO2 showed significantly lower (P < 0.001) tissue nitrogen concentration [N] under elevated (6.06 mg N/g) than ambient (6.74 mg N/g) CO2 (Figure 4). A significant main effect of ecotype (P < 0.001) indicated that RT > FL = HY = NA > MB = LA. A significant interaction of CO2 with ecotype (P = 0.008) showed that [N] was decreased by elevated CO2 for the FL, HY, and NA ecotypes only (Figure 4). Calculations of NUE as g plant biomass produced per g plant N were significant (P = 0.001) for the main effect of CO2 (ambient = 153.1 vs. elevated = 175.2; Figure 5). Ecotype, averaged across both CO2 treatments, significantly (P < 0.001) affected NUE (i.e., LA > MB = NA = HY = FL > RT). The CO2 by ecotype interaction was not significant for NUE (P = 0.118); however, NUE showed a similar response as other variables in that FL, HY, LA, and NA were numerically higher under elevated CO2 while MB and RT were actually slightly lower (Figure 5).
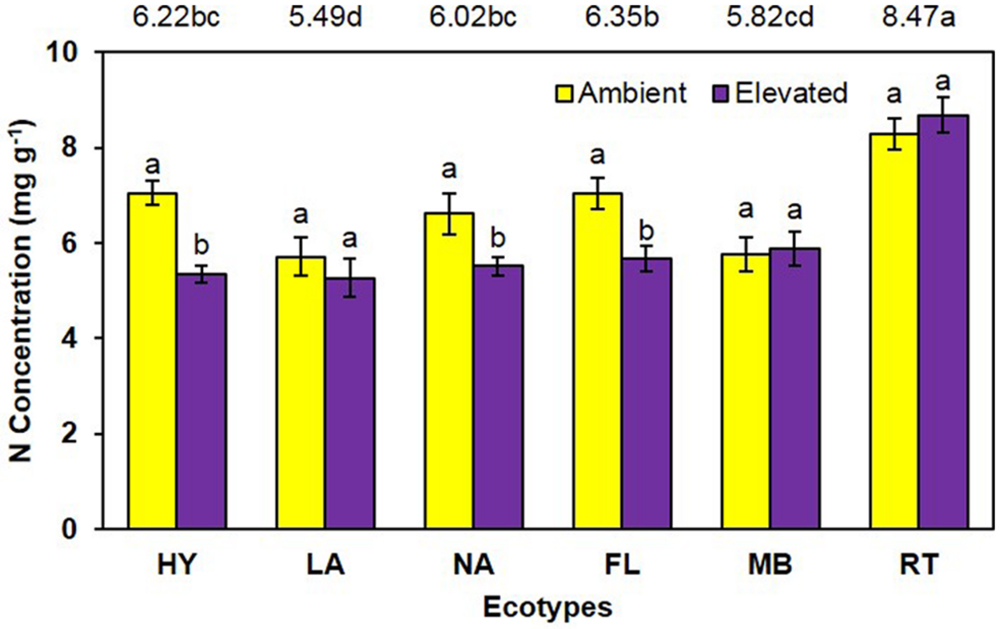
FIGURE 4. Total plant nitrogen concentration of cogongrass ecotypes under ambient and elevated CO2 (HY, Hybrid; LA, Louisiana; NA, North Alabama; FL, Florida; MB, Mobile; RT, Red-tip). N = 6. Means with standard errors are shown; standard errors reflect the variability in the data and are not a means separation technique. Main effects of CO2 (P < 0.001), ecotype (P < 0.001), and their interaction (P = 0.008) were significant. Bars with different letters show a significant effect of CO2 for each ecotype; main effect of ecotype means shown at the top of the graph (means followed by the same letter are not significantly different).
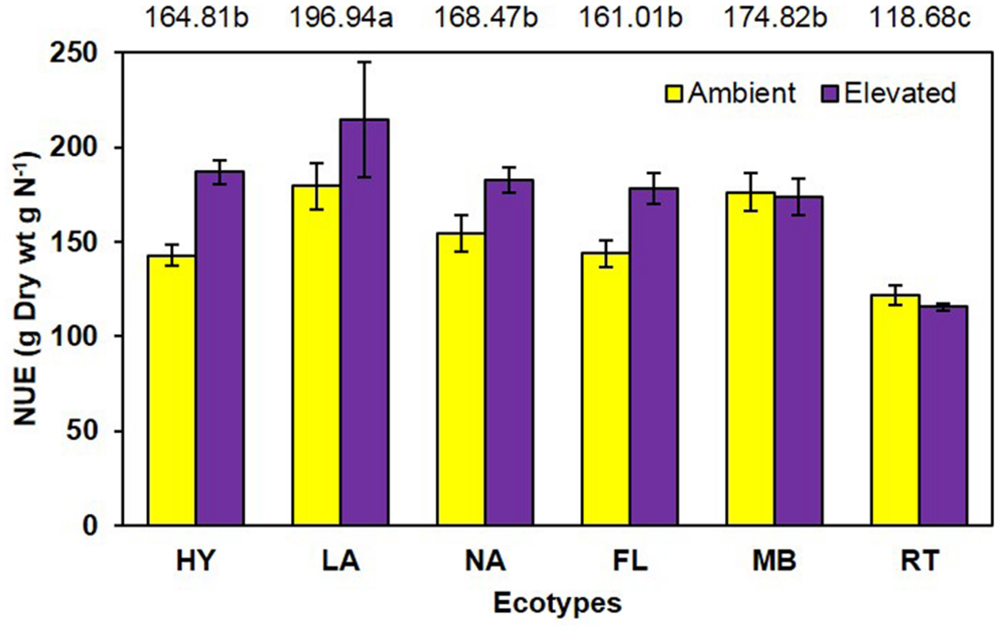
FIGURE 5. Nitrogen use efficiency of cogongrass ecotypes under ambient and elevated CO2 (HY, Hybrid; LA, Louisiana; NA, North Alabama; FL, Florida; MB, Mobile; RT, Red-tip). N = 6. Means with standard errors are shown; standard errors reflect the variability in the data and are not a means separation technique. Main effects of CO2 (P = 0.001) and ecotype (P < 0.001) significant; their interaction (P = 0.118) showed a trend. The omission of letters above bars indicates no effect of CO2 for any ecotype; main effect ecotype means shown at the top of the graph (means followed by the same letter are not significantly different).
Water use efficiency, calculated from LICOR gas exchange measurements as mmol CO2 per mol H2O, was significantly increased (P = 0.001) 96% by growth in elevated CO2 (ambient = 6.8 vs. elevated = 13.3; Figure 6). The main effect of ecotype (P = 0.513) and its interaction with CO2 (P = 0.226) did not affect WUE (Figure 6).
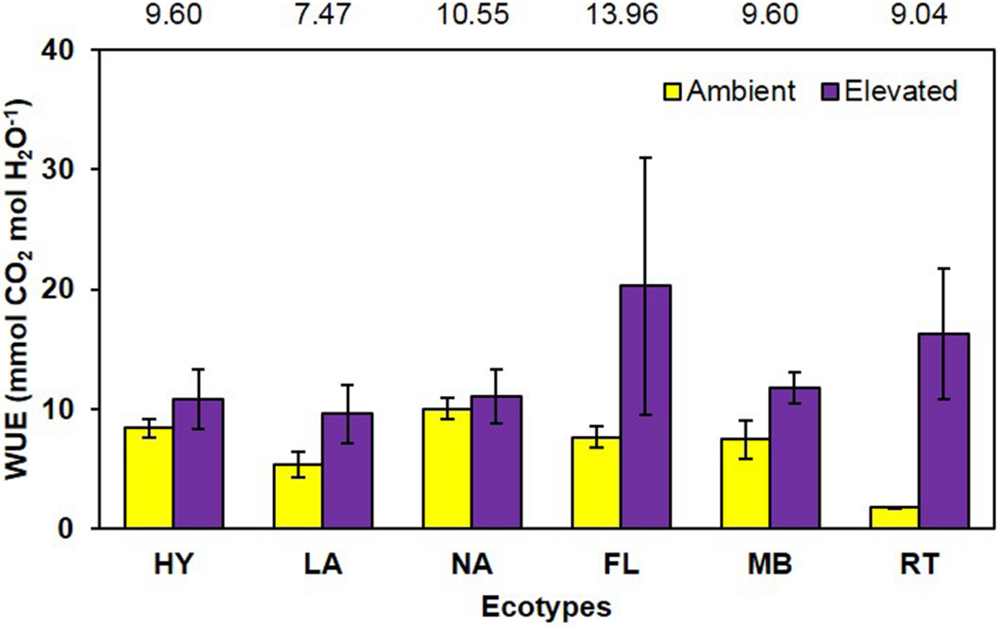
FIGURE 6. Water use efficiency of cogongrass ecotypes under ambient and elevated CO2 (HY, Hybrid; LA, Louisiana; NA, North Alabama; FL, Florida; MB, Mobile; RT, Red-tip). N = 6. Means with standard errors are shown; standard errors reflect the variability in the data and are not a means separation technique. Main effect of CO2 (P = 0.001) was significant while ecotype (P = 0.513) and their interaction (P = 0.226) were not. The omission of letters above bars indicates no effect of CO2 for any ecotype; main effect ecotype means shown at the top of the graph.
Discussion
Cogongrass growth parameters were increased when exposed to elevated CO2, which is typical of most plants (Rogers et al., 1994; Amthor, 1995). Although height was only slightly higher (5.6%; Figure 1), aboveground dry weight increase (12.7%; Figure 2) was in a range (10–15%) typical of C4 plant response to CO2 enrichment (Kimball, 1983; Prior et al., 2003). The fact that responsive ecotypes showed growth responses to elevated CO2 typical for C4 plants suggests that their invasive potential will not be altered as atmospheric CO2 continues to rise, but does indicate that some ecotypes of this serious invasive weed may become more problematic.
Cogongrass ecotype also affected both height and aboveground dry weight; in general, the MB and RT were smaller than the other ecotypes. The significant interactions for these variables further showed that MB and RT were not responsive to CO2 concentration, while the other ecotypes tended to be larger under high CO2. It is interesting to note that HY tended to exhibit the greatest response to elevated CO2 among ecotypes even though it was a cross from the MB ecotype which was not responsive. It is not uncommon for HYs to exhibit growth responses that either differ from or exceed their progenitors (Capo-chichi et al., 2008). This is, after all, why plant breeding programs exist for virtually all important crop species.
Despite the importance of root systems in attaining essential soil resources (i.e., water and nutrients), their response to CO2 has received less attention than aboveground parts; however, it has been reported that roots often exhibit a larger response to elevated CO2 than other plant organs (Rogers et al., 1994). In contrast, our study showed no increase in root dry weight under elevated CO2 and no significant interaction with cogongrass ecotype. It is interesting to note that, despite the lack of significance, the belowground response pattern (Figure 3) was similar to that seen for aboveground growth (Figure 2). Further, ecotype effect also followed the same general pattern as aboveground dry weight in that MB and RT were smaller than the other ecotypes.
Given that weed species are more likely to have greater genetic diversity and physiological plasticity (compared to crops), they are more likely to be able to adapt to a changing environment (Ziska and Runion, 2007). This may have significant implications for developing effective weed control stategies given that elevated CO2 may increase herbicide tolerance in some weeds due to a herbicide dilution effect caused by increased growth, as well as other potential CO2-induced changes in plant morphology, biochemistry, and physiology (Ziska et al., 1999; Ziska and Teasdale, 2000; Archambault et al., 2001). However, increased herbicide tolerance under elevated CO2 is not always observed (Marble et al., 2015). How cogongrass herbicide efficacy will be impacted by elevated CO2 is not known and deserves futher study.
Total plant nitrogen concentration was reduced under elevated CO2 (Figure 4). As with plant growth, this is a common response to high CO2 (Rogers et al., 1994; Norby et al., 2001; Prior et al., 2008; Runion et al., 2009). This is a result of increased plant growth under elevated CO2 causing a dilution effect on nutrient concentrations (Rogers et al., 1994, 1999). The RT ecotype had the highest [N] and LA was lowest (Figure 4). RT had the smallest growth which likely resulted in the high [N]; it is unclear why MB did not exhibit this pattern given it also had less growth. A significant CO2 by ecotype interaction indicated that [N] was lowered by elevated CO2 in FL, HY, and NA only. In general, these ecotypes had a larger dilution effect due to greater growth (Figures 1 and 2); however, why LA did not follow this pattern is not known.
Another common response to elevated CO2 is increased NUE (Rogers et al., 1994) as observed in this study (Figure 5). Nutrient use efficiency (unit of biomass produced per unit of nutrient) generally increases under elevated CO2 as plants are able to produce more biomass with available nutrients. Ecotype also affected NUE with LA being highest and RT lowest. Although the CO2 by ecotype interaction was not significant, the response pattern was similar to other variables in that NUE was numerically higher for FL, HY, LA, and NA but not MB and RT under elevated CO2.
As with NUE, it is also common for plants grown under elevated CO2 to exhibit increases in water use effiency (Rogers and Dahlman, 1993). In general, C3 plants exhibit increased photosynthesis and decreased stomatal conductance under elevated CO2 (Amthor and Loomis, 1996), leading to increased WUE. However, the CO2-concentrating mechanism used by C4 species limits their photosynthetic response to CO2 enrichment (Amthor and Loomis, 1996), but they do tend to show decreased stomatal conductance which often increases WUE (Rogers et al., 1983b). This was observed in the current study, in that photosynthesis was not significantly affected by CO2 concentration (ambient = 2.13, elevated = 2.61 μmol CO2 m-2 s-1; P = 0.14), while stomatal conductance tended to be decreased (ambient = 0.018, elevated = 0.014 mol H2O m-2 s-1; P = 0.06) under elevated CO2 (full data not shown). These responses led to a large increase in WUE (96%) under elevated CO2 (Figure 6). Ecotype and its interaction with CO2 did not affect WUE.
Conclusion
Cogongrass is one of the top ten worst weeds in the world and is listed as a Federal Noxious Weed. Since its introduction to the Southeastern U.S. it has become a major problem in forest plantations, roadsides, and agricultural systems due to its aggressive ability to develop dense monocultures which can compete with and displace desirable species. This is the first study to examine the effects of elevated CO2 on cogongrass and the first for any weed species to look at potential differences among ecotypes. In our study, elevated CO2 (averaged across ecotypes) increased height, biomass, and both nitrogen and water use efficiencies, but lowered tissue nitrogen concentration; again, these are typical C4 plant responses to elevated CO2. In general, the HY ecotype tended to exhibit the greatest growth (followed by LA, NA, and FL) while RT and MB ecotypes were smallest. Interactions of CO2 with ecotype showed that MB and RT ecotypes did not respond to CO2. This lack of response to CO2 for RT (sold commerically as ‘Red Baron’) is significant since concerns over its potential to spread into the native landscape should not be exacerbated by the rising atmospheric CO2 concentration. Nevertheless, it is still prohibited for sale in some states and its removal has been recommended. However, HY, LA, FL, and/or NA ecotypes responded positively to elevated CO2, suggesting some ecotypes of this serious invasive weed may become more problematic in a future CO2-enriched environment. These findings may influence development of future cogongrass control strategies, a subject area requiring further investigation.
Author Contributions
GB conceived and conducted the research, collected and analyzed the data and co-wrote the manuscript; SP assisted with conducting the research, collecting the data, and co-wrote the manuscript; LC provided the cogongrass ecotypes, co-wrote and reviewed the manuscript; HT assisted with conducting the research and reviewed the manuscript; ES assisted with providing the cogongrass ecotypes and reviewed the manuscript.
Conflict of Interest Statement
The authors declare that the research was conducted in the absence of any commercial or financial relationships that could be construed as a potential conflict of interest.
Acknowledgment
The authors wish to thank Barry Dorman and Jerry Carrington for technical assistance.
Abbreviations
FL, Florida cogongrass ecotype; HY, Louisiana/Mobile hybrid cogongrass ecotype; LA, Louisiana cogongrass ecotype; MB, Mobile cogongrass ecotype; NA, North Alabama cogongrass ecotype; NUE, nitrogen use efficiency; OTC, Open Top Chamber; RT, red-tip ornamental cogongrass variety; WUE, water use efficiency.
References
Amthor, J. S. (1995). Terrestrial higher-plant response to increasing atmospheric [CO2] in relation to the global carbon cycle. Global Change Biol. 1, 243–274. doi: 10.1111/j.1365-2486.1995.tb00025.x
Amthor, J. S., and Loomis, R. S. (1996). “Integrating knowledge of crop responses to elevated CO2 and temperature with mechanistic simulation models: model components and research needs,” in Carbon Dioxide and Terrestrial Ecosystems, eds G. W. Koch and H. A. Mooney (San Diego, CA: Academic Press), 317–346.
Archambault, D. J., Li, X., Robinson, D., O’Donovan, J. T., and Klein, K. K. (2001). The effects of elevated CO2 and temperature on herbicide efficacy and weed/crop competition. Rept. Prairie Adapt. Res. Collab. 1–29.
Bright, C. (1998). Life Out of Bounds: Bioinvasion in a Borderless World. New York, NY: W.W. Norton & Company.
Bryson, C. T., and Carter, R. (1993). Cogongrass, Imperata cylindrica, in the United States. Weed Technol. 7, 1005–1009.
Capo-chichi, L. J. A., Faircloth, W. H., Williamson, A. G., Patterson, M. G., Miller, J. H., and van Santen, E. (2008). Invasion dynamics and genotypic diversity of Cogongrass (Imperata cylindrica) at the point of introduction in the Southeastern United States. Invasive Plant Sci. Manage. 1, 133–141. doi: 10.1614/IPSM-07-007.1
Holm, L. G., Plucknett, D. L., Pancho, J. V., and Herberger, J. P. (1991). The World(s Worst Weeds: Distribution and Biology. Malabar, FL: Krieger Publishing.
Kimball, B. A. (1983). Carbon dioxide and agricultural yield: an assemblage and analysis of 430 prior observations. Agron. J. 75, 779–788. doi: 10.2134/agronj1983.00021962007500050014x
Littell, R. C., Milliken, G. A., Stroup, W. W., and Wolfinger, R. D. (1996). SAS System for Mixed Models. Cary, NC: SAS Institute, Inc.
Marble, S. C., Prior, S. A., Runion, G. B., and Torbert, H. A. (2015). Control of yellow and purple nutsedge in elevated CO2 environments with glyphosate and halosulfuron. Front. Plant Sci. 6:1. doi: 10.3389/fpls.2015.00001
Miller, J. H., Manning, S. T., and Enloe, S. F. (2010). “A Management Guide for Invasive Plants in Southern Forests,” in General Technology Report SRS-131, (Asheville, NC: U.S. Department of Agriculture Forest Service).
Mitchell, R. J., Runion, G. B., Prior, S. A., Rogers, H. H., Amthor, J. S., and Henning, S. P. (1995). Effects of nitrogen on Pinus palustris foliar respiratory responses to elevated atmospheric CO2 concentration. J. Exp. Bot. 46, 1561–1567.
Norby, R. J., Cotrufo, M. F., Ineson, P., O’Neill, E. G., and Canadell, J. G. (2001). Elevated CO2, litter quality, and decomposition: a synthesis. Oecologia 127, 153–165. doi: 10.1007/s004420000615
Pappert, R. A., Hamrick, J. L., and Donovan, L. A. (2000). Genetic variation in Pueraria lobata (Fabaceae), an introduced, clonal, invasive plant of the southeastern United States. Am. J. Bot. 87, 1240–1245. doi: 10.2307/2656716
Patterson, D. T., Flint, E. P., and Dickens, R. (1980). Effects of temperature, photoperiod, and population source on the growth of cogongrass (Imperata cylindrica). Weed Sci. 28, 505–509.
Pimentel, D. (2002). Biological Invasions: Economic and Environmental Costs of Alien Plant, Animal, and Microbe Species. Boca Raton, FL: CRC Press.
Prior, S. A., Runion, G. B., Rogers, H. H., and Torbert, H. A. (2008). Effects of atmospheric CO2 enrichment on crop nutrient dynamics under no-till conditions. J. Plant Nutr. 31, 758–773. doi: 10.1080/01904160801928364
Prior, S. A., Torbert, H. A., Runion, G. B., and Rogers, H. H. (2003). Implications of elevated CO2-induced changes in agroecosystem productivity. J. Crop Prod. 8, 217–244. doi: 10.1300/J144v08n01_09
Rogers, H. H., and Dahlman, R. C. (1993). Crop responses to CO2 enrichment. Vegetatio 104/105, 117–131. doi: 10.1007/BF00048148
Rogers, H. H., Heck, W. W., and Heagle, A. S. (1983a). A field technique for the study of plant responses to elevated carbon dioxide concentrations. Air Pollut. Control Assn. J. 33, 42–44. doi: 10.1080/00022470.1983.10465546
Rogers, H. H., Thomas, J. F., and Bingham, G. E. (1983b). Response of agronomic and forest species to elevated atmospheric carbon dioxide. Science 220, 428–429. doi: 10.1126/science.220.4595.428
Rogers, H. H., Runion, G. B., and Krupa, S. V. (1994). Plant responses to atmospheric CO2 enrichment with emphasis on roots and the rhizosphere. Environ. Pollut. 83, 155–189. doi: 10.1016/0269-7491(94)90034-5
Rogers, H. H., Runion, G. B., Prior, S. A., and Torbert, H. A. (1999). “Response of plants to elevated atmospheric CO2: root growth, mineral nutrition, and soil carbon,” in Carbon Dioxide and Environmental Stress, eds Y. Luo and H. A. Mooney (San Diego, CA: Academic Press), 215–244.
Runion, G. B., Torbert, H. A., Prior, S. A., and Rogers, H. H. (2009). “Effects of elevated atmospheric carbon dioxide on soil carbon in terrestrial ecosystems of the southeastern U.S,” in Soil Carbon Sequestration and the Greenhouse Effect, 2nd Edn, eds R. Lal and R. F. Follett (Madison, WI: Soil Science Society of America), 233–262.
Tabor, P. (1949). Cogongrass, Imperata cylindrica (L.) Beauv., in the southeastern United States. Agron. J. 41, 270. doi: 10.2134/agronj1949.00021962004100060011x
Tabor, P. (1952). Cogongrass in Mobile County. Alabama. Agron. J. 44:50. doi: 10.2134/agronj1952.00021962004400010012x
Ziska, L. H. (2003). Evaluation of the growth response of six invasive species to past, present and future atmospheric carbon dioxide. J. Exp. Bot. 54, 395–404. doi: 10.1093/jxb/erg027
Ziska, L. H., and Runion, G. B. (2007). “Future weed, pest, and disease problems for plants,” in Agroecosystems in a Changing Climate, eds P. C. D. Newton, R. A. Carran, G. R. Edwards, and P. A. Niklaus (Boca Raton, FL: CRC Press), 261–287.
Ziska, L. H., and Teasdale, J. R. (2000). Sustained growth and increased tolerance to glyphosate observed in a C3 perennial weed, quackgrass (Elytrigia repens), grown at elevated carbon dioxide. Aust. J. Plant Physiol. 27, 159–166.
Keywords: carbon dioxide, global change, Imperata cylindrica, invasive weed, nitrogen use efficiency, water use efficiency
Citation: Runion GB, Prior SA, Capo-chichi LJA, Torbert HA and van Santen E (2016) Varied Growth Response of Cogongrass Ecotypes to Elevated CO2. Front. Plant Sci. 6:1182. doi: 10.3389/fpls.2015.01182
Received: 28 September 2015; Accepted: 10 December 2015;
Published: 05 January 2016.
Edited by:
Richard S. Winder, Natural Resources Canada, CanadaReviewed by:
Gerald Moser, Justus Liebig University Giessen, GermanyArkadiusz Kosmala, Institute of Plant Genetics of the Polish Academy of Sciences, Poland
Copyright © 2016 Runion, Prior, Capo-chichi, Torbert and van Santen. This is an open-access article distributed under the terms of the Creative Commons Attribution License (CC BY). The use, distribution or reproduction in other forums is permitted, provided the original author(s) or licensor are credited and that the original publication in this journal is cited, in accordance with accepted academic practice. No use, distribution or reproduction is permitted which does not comply with these terms.
*Correspondence: G. Brett Runion, brett.runion@ars.usda.gov