 Jia Liu
 Wenxiang Wang
 Desheng Mei1
 Hui Wang
 Qiong Hu
- 1Key Laboratory of Biology and Genetic Improvement of Oil Crops, Ministry of Agriculture, Oil Crops Research Institute of the Chinese Academy of Agricultural Sciences, Wuhan, China
- 2Agricultural Sciences Institute of Lu'an Municipal, Lu'an, China
Changes in the rapeseed branch angle alter plant architecture, allowing more efficient light capture as planting density increases. In this study, a natural population of rapeseed was grown in three environments and evaluated for branch angle trait to characterize their phenotypic patterns and genotype with a 60K Brassica Infinium SNP array. Significant phenotypic variation was observed from 20 to 70°. As a result, 25 significant quantitative trait loci (QTL) associated with branch angle were identified on chromosomes A2, A3, A7, C3, C5, and C7 by the MLM model in TASSEL 4.0. Orthologs of the functional candidate genes involved in branch angle were identified. Among the key QTL, the peak SNPs were close to the key orthologous genes BnaA.Lazy1 and BnaC.Lazy1 on A3 and C3 homologous genome blocks. With the exception of Lazy (LA) orthologous genes, SQUMOSA PROMOTER BINDING PROTEIN LIKE 14 (SPL14) and an auxin-responsive GRETCHEN HAGEN 3 (GH3) genes from Arabidopsis thaliana were identified close to two clusters of SNPs on the A7 and C7 chromosomes. These findings on multiple novel loci and candidate genes of branch angle will be useful for further understanding and genetic improvement of plant architecture in rapeseed.
Introduction
Rapeseed (Brassica napus L. 2n = 4 × = 38, AACC genomes) is a widely cultivated oil crop throughout the world. Yield improvement and mechanized harvesting are extremely urgent recently for the demands of rapeseed producers in addition to the edible oil and biofuel industries (Diepenbrock, 2000). The ideotype of a plant is defined as the spatial distribution of various architectures which is an important agronomic character that affects photosynthesis and seed yields (Donald, 1968; Mansfield and Mumm, 2014). The ideotype can influence photosynthesis, plant growth, and seed yield due to the least competition among the individuals in a population (Wang and Li, 2005). The ideotype is determined by a combination of architecture factors including branch angle (BA), plant height (PH), first branch height (FBH), inflorescence length (IL), and branch number (BN; Mei et al., 2009; Shi et al., 2009; Xu et al., 2014). In particular, branch angle, or the angle between branch and erect primary stem, has long attracted the attention of breeders because of the significant contribution of this trait to plant architecture.
High yields can be achieved through high plant density with a small branch angle, which determines the plant's ability to grow and capture light efficiently. Wang and Li (2008) reported in rice more upright and dense leaves not only improve light capture but also improve the accumulation of leaf nitrogen for grain filling. The branch (or leave) angle has also been studied in maize, cotton, and other important crops to achieve an ideal plant architecture to improve yields (Li et al., 2007; Jin et al., 2008; Song and Zhang, 2009; Ku et al., 2011; Tian et al., 2011; Bai et al., 2012). Several quantitative trait loci (QTL) related to leaf angle have been identified genetically in maize.
In recent years, genome-wide association (GWA) mapping has become a powerful tool for identifying important genes associated with complex traits, which has been used with success in model and non-model plants (Breseghello and Sorrells, 2006; Atwell et al., 2010; Huang et al., 2010; Zhao et al., 2011). Additionally, with the dramatically decreasing cost of genome sequencing and rapid developments in genome analysis, Brassica A genome sequence from Brassica rapa and Brassica C genome sequence from Brassica oleracea have been published (Wang et al., 2011; Liu et al., 2014). It is important to complete the rapeseed (B. napus, AC genome) genome sequencing (Chalhoub et al., 2014). Single nucleotide polymorphisms (SNPs) are abundant and evenly distributed throughout the genomes, which is more conducive to GWA. In 2012, a B. napus 60K SNP Infinium genotyping array was produced and applied by the international Brassica SNP consortium in cooperation with Illumina Inc. San Diego, CA, USA (Snowdon and Iniguez Luy, 2012; Edwards et al., 2013). Studies about GWAS in rapeseed have gained attention in recent years and various traits including flowering time, seed weight and seed quality have been dissected (Harper et al., 2012; Cai et al., 2014; Li et al., 2014; Lu et al., 2014; Raman et al., 2014; Wang et al., 2014). However, no report was found on association mapping for rapeseed branch angle to our knowledge.
Numerous genes are known to influence the branch (tiller) angle in model and other crops. For instance, OsTAC1 was reported to play a critical role in controlling rice architecture (Yu et al., 2007). Li et al. (2007) reported that LAZY1 regulates shoot gravitropism through which the rice tiller angle is controlled. Enlarged branch angles with agravitropic shoots were similarly also found in Atlazy1 mutant of Arabidopsis (Yoshihara et al., 2013). Dong et al. (2013) identified maize ZmLA1 gene as a functional ortholog of LAZY1 in rice and Arabidopsis. The regulation of branch angle is a combination of environmental factors and hormone homeostasis (Lomax, 1997). Auxin may be the primary hormone involved in shoot gravitropism (Robert and Friml, 2009), which is a key process in determining branch (leave) angle. The member of GH3 family plays crucial roles in auxin homeostasis in relation to leaf inclination control (Zhao et al., 2012). Recent evidence showed that new strigolactone plant hormones regulated rice tiller angle by attenuating shoot gravitropism through the inhibition of auxin biosynthesis (Sang et al., 2014). Although interaction of auxin and strigolactone plays an important role in shoot gravitropism, the key genes by which the two hormones regulate shoot gravitropism is not yet identified. However, knowledge of the genes that control genetic variation for branch angle of rapeseed is limited.
In this study, a panel of 143 elite rapeseed accessions was analyzed by the 60 K Brassica Infinium SNP array. The branch angle was measured in 2013–2014 at three environments. The SNPs in the array were in silico mapped to A and C genomes of Darmor-bzh B. napus genome “pseudomolecules” to obtain their hypothetical position. The aims were (1) to gain the population structure and genetic diversity in elite germplasms; (2) to detect QTL controlling branch angle and mine for elite alleles; and (3) to predict the candidate genes.
Methods
Plant Material and Field Experiments
A total of 143 rapeseed accessions were used for an association analysis in this study. According to the information from field observations, the accessions were classified to three different germplasm types, i.e., spring oilseed rape (OSR) (13), semi-winter OSR (124), and winter OSR (6). Based on their origins, 112 accessions originated from China, 24 from Oceania, 5 from Europe, 1 from North America, and 1 from India (Supplementary Table 1). The seeds from all the accessions were collected, stored and supplied by Oil Crops Research Institute of Chinese Academy of Agricultural Sciences (OCRI-CAAS). In recent decades, these accessions have been widely used as parents in breeding programs.
The experiments were conducted at Yangluo Agronomic Experimental Station of OCRI-CAAS (28°42′N, 112°33′E), Wuhan, China, during the 2013 and 2014 winter growing season and at Lu'an Experimental Station (31°73′N, 116°52′E) in Anhui, China, during the 2013 winter growing season. In each environment, the experiment was conducted in randomized complete blocks with two replicates. Each plot contained three rows with 54 individuals, setting as 33 cm between rows and 11 cm between plants within each row, with a planting density of 270,000 plants/ha. All experiments were performed under local field management and cultivation conditions.
Trait Measurements and Statistical Analysis
In each plot, five typical plants were harvested for branch angle measurement at the mature stage. The branch angle (BA) was measured as the angle between the main stem and the branch. BA was scanned with a digital camera (SONY DSLR-A350; SONY, Japan). The angle value from the images was obtained using AutoCAD software (Autodesk Inc., San Rafael, CA). The average BA value of five individual plants for each plot was calculated as the final phenotypic value. In addition, the best linear unbiased estimators (BLUPs) across all three environments were predicted by assuming fixed genotypic effects to minimize the effects of environmental variation. Finally, each environment and BLUP value was used as a phenotype for the association analysis.
Statistical analysis of the data was performed by using PROC MEANS in SAS software, Version 9.3 (2000, SAS Institute Inc., Cary, NC, US). Analysis of variance (ANOVA) was conducted by using PROC GLM to determine the effects of block, environment, genotype and genotype-environment interactions. Correlation coefficients were obtained by using PROC CORR. The Broad-sense heritability (H2) was calculated as H2 = σg2/(σg2 + σgl2/n +σe2/nr), in which σg2, σgl2, σe2, r, and n represent the estimated variances for the genetic effects, genotype-environment interactions, random errors, number of replications and number of environments, respectively. The estimated variances for σg2, σgl2, and σe2 were obtained by ANOVA.
SNP Genotyping, Quality Control and In silico Mapping of SNPs
The genotype of 143 accessions was detected with a Brassica 60K Illumina Infinium SNP array according to the work flow by Emei Tongde Co. All of the SNP data were clustered and called up automatically by using Illumina BeadStudio genotyping software. The SNP quality was checked and comparable with previous studies (Li et al., 2014; Wang et al., 2014). The low quality SNP loci (call rate < 80% and/or minor allele frequency < 0.05) in all accessions were deleted from the results. Out of 52,157 SNPs in the array, 2836 that had a zero call frequency of AA or BB were excluded according to the quality control. Using a cut-off for missing data >0.2 and MAF < 0.05, 1860 and 1909 SNPs were filtered, respectively, reducing the number of SNPs to 38,063.
SNP mapping was performed as previously reported (Altschul et al., 1990). In brief, BLAST search against the “pseudomolecules” representative of the B. napus genome (version 4). Only the top BLAST hits with an E-value cut-off of 1E-15 against the pseudomolecules were retained, while BLAST matches to multiple loci with the same E-value were deleted. A final set of 34,469 high-performing SNPs was used for all the analyses.
Population Genetic Analysis
Nei's genetic distance matrix for all SNPs is the distance and it was calculated to build unrooted neighbor-joining trees by using PowerMarker (Liu and Muse, 2005). The result was visualized by using FigTree software based on 34,469 SNPs (http://tree.bio.ed.ac.uk/software/figtree/). Kinship (K) matrix used to compare all the pairs of the 143 accessions was calculated with 2434 informative SNPs with a MAF > 0.2 by using the SPAGeDi software package (Hardy and Vekemans, 2002). All negative kinship values that were found between two individuals, which indicates that there was less of a relation than expected between two random individuals, were transformed to zero (Yu et al., 2005).
A total of 2434 SNPs [minor allele frequency (MAF) ≥ 0.2] that were evenly distributed across the whole genome were selected to create the population structure inferred by using the STRUCTURE v2.3.4 software package (Pritchard et al., 2000). Iterations were performed 100,000 times by using a burn-in length of 100,000 MCMC (Markov chain Monte Carlo) with the admixture and related frequency model. Five independent runs were performed with K-values (the putative number of populations) ranging from 1 to 10. The optimal K-value was determined by taking the log probability of the data [LnP(D)] and an ad hoc statistical Δk based on the rate of change for LnP(D) between successive k-values as described by Evanno et al. (2005). The cluster membership coefficient matrices of replicate runs from STRUCTURE were integrated to obtain a Q matrix by using CLUMPP software (Jakobsson and Rosenberg, 2007) and graphically displayed by using the DISTRUCT software package (Rosenberg, 2004). Accessions with a probability of membership >0.7 were assigned to corresponding clusters, and those < 0.7 were assigned to a mixed group. The population structure matrix (Q) was generated for further analyses. Linkage disequilibrium (LD) parameter (r2) for estimating the degree of LD between pair-wise SNPs (MAF ≥ 0.05) was calculated using the software TASSEL 4.0 (Bradbury et al., 2007).
Association Analysis
Two different models were used to test associations. The first model was a simple and general linear model (GLM) without controlling for Q and K, containing only the SNP that was tested as a fixed effect. The second model was a mixed linear model (MLM) where, in addition to testing the SNP, the population structure (Q) and relative kinship matrix were included as fixed and random effects, respectively. Analyses were performed by using TASSEL 4.0 software, for which the optimum compression and population parameters previously determined (P3D) variance component estimation were implemented to decrease the computing time for the large data set (Zhang et al., 2010).
The significance of associations between SNPs and trait was based on a threshold of p < 2.90 × 10⁻⁵ [i.e., -log10(p) = 4.5]. The threshold is 2.90 × 10⁻⁵ at a significant level of 1% after Bonferroni multiple test correction (1/34,496). Furthermore, we applied the false discovery rate (FDR) technique. We calculated an FDR q-value for each association test by using the software QVALUE (Dabney and Storey, 2004). The FDR q-value of the significant SNP with the lowest test statistic (P < 0.05) provided an estimate of the proportion of false positives among the significant associations. The significant value and the marker effect for each SNP were exported, and a Manhattan plot was generated in the R package qqman (Turner, 2014, http://cran.r-project.org/web/packages/qqman/).
Stepwise regression was performed to detect the effect of multiple alleles with different functional polymorphisms on branch angle and to estimate the total variance explained (R2) by using the lm function in R (Ihaka and Gentleman, 1996).
Results
Phenotypic Variation of Branch Angle
Significant variation was observed among the 143 rapeseed accessions in the three environments studied, with branch angles ranging from 20 to 70° (Figure 1, Table 1). In three environments Yangluo-2013, Yangluo-2014, and Lu'an-2013, the natural population exhibited average branch angle values (±SD) of 39.93 ± 5.98, 37.52 ± 7.26, and 42.30 ± 6.65, respectively. The frequency distributions of branch angle in the natural population are summarized in Figure 2. Branch angle ranged from 22.32 to 59.57, 20.04 to 69.09, and 22.98 to 70.77 in three environments, respectively.
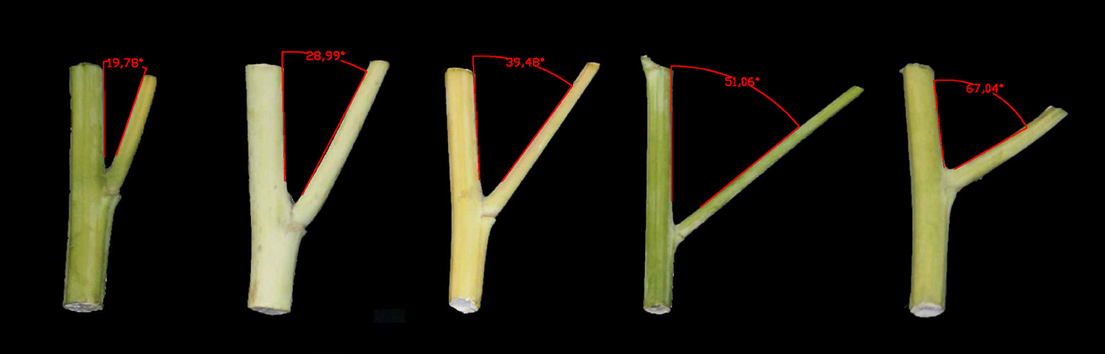
Figure 1. Branch angle was measured using AutoCAD software.
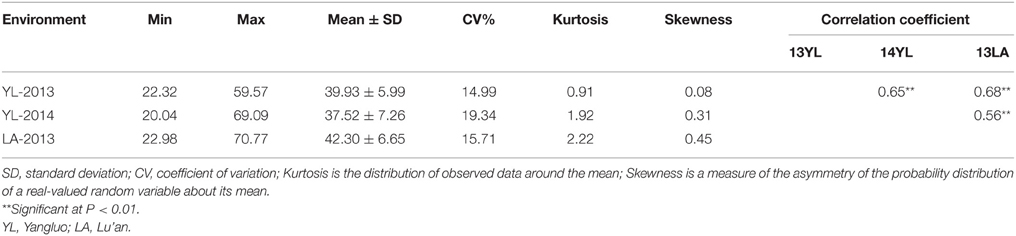
Table 1. Phenotypic characteristics for branch angle in 143 rapeseed accessions.
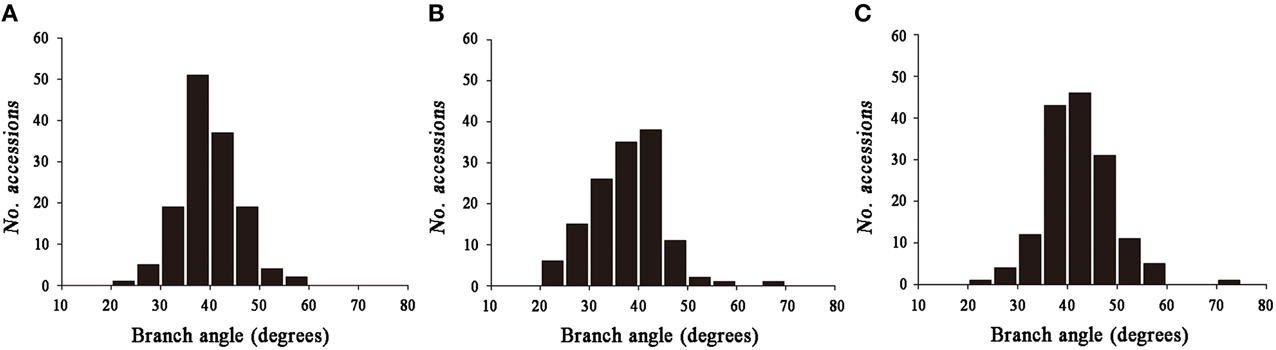
Figure 2. The frequency distribution for branch angle in three environments. (A) 2013YL; (B) 2014YL; (C) 2013LA.
The two-way ANOVA showed that differences among the lines in the branch angle were highly significant. This finding confirmed that a large number of genetic variation existed in the population. The effects from years and location were significant (Table 2). The broad-sense heritability (H2) for branch angle was calculated as 93.90%, demonstrating that branch angle in these rapeseed lines was conditioned primarily by genetic factors. The correlation coefficients for branch angle between environments were all relatively high (r ≥ 0.557, P < 0.01).This observation indicated that branch angle in the 143 lines was relatively consistent across environments.
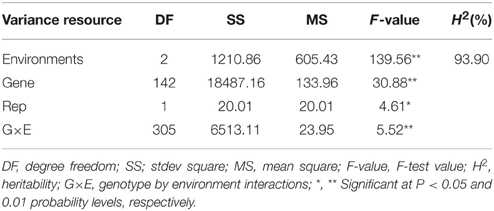
Table 2. ANOVA and broad-sense heritability for branch angle.
SNP Genetic Diversity and Linkage Disequilibrium
Supplementary Table 2 gives the information on all of the SNPs. Estimates of an average nucleotide diversity (polymorphism information content or PIC) of 0.366 showed that the overall genetic variation in the accessions studied here represents ~62.9% of the rapeseed diversity. There had the most markers (2745) with a marker density of one per 26.4 kb in C3 linkage group and the fewest markers (932) with a marker density of one per 47.6 kb in C5.
To evaluate the extent of LD, r2 was used to calculate LD. The genome-wide LD decay of A and C genome for rapeseed germplasms are shown in Figure 3. Taken together, the LD of A genome decayed significantly faster than that of the C genome. We estimated the LD decay, r2 decayed to 0.2 when the average distance for A genome was 206 kb and r2 decayed to 0.2 when the average distance for C genome was 949 kb.
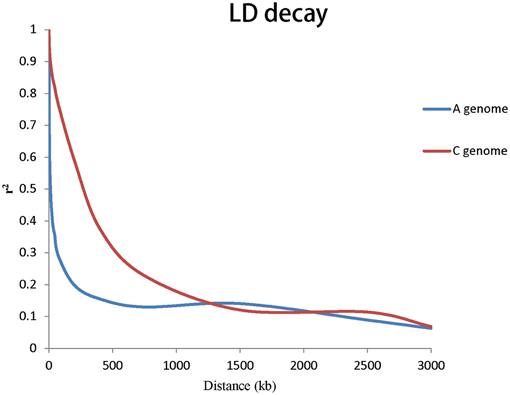
Figure 3. Genome-wide LD decay of A and C genomes for all the 143 accessions.
Population Structure and Relative Kinship
Population structure of the association panel was calculated using 2434 SNPs, and a clustering inference performed with possible clusters (k) from 1 to 10 showed that the most significant change in likelihood occurred when K increased from 2 to 3, and the highest Δk-value was observed at k = 2 (Figure 4). Based on the Δk method (Figure 4B), the 143 accessions could be divided into two sub-populations (Figure 4C). By using a probability-of-membership threshold of 70%, 99 and 17 lines were assigned to the two groups, respectively. The remaining 27 lines were classified into a mixed group (Supplementary Table 1). In comparison with a previous study, this population structure classification yields the same results (Harper et al., 2012; Lu et al., 2014; Wang et al., 2014). In addition, the NJ phylogenetic tree based on Nei's genetic distances displayed two clear clades (Supplementary Figure 1), corresponding to the two groups estimated by STRUCTURE. The lines belong to mixed groups were distributed across the whole tree. Tree-based analyses yielded results very similar to those of the STRUCTURE analysis.
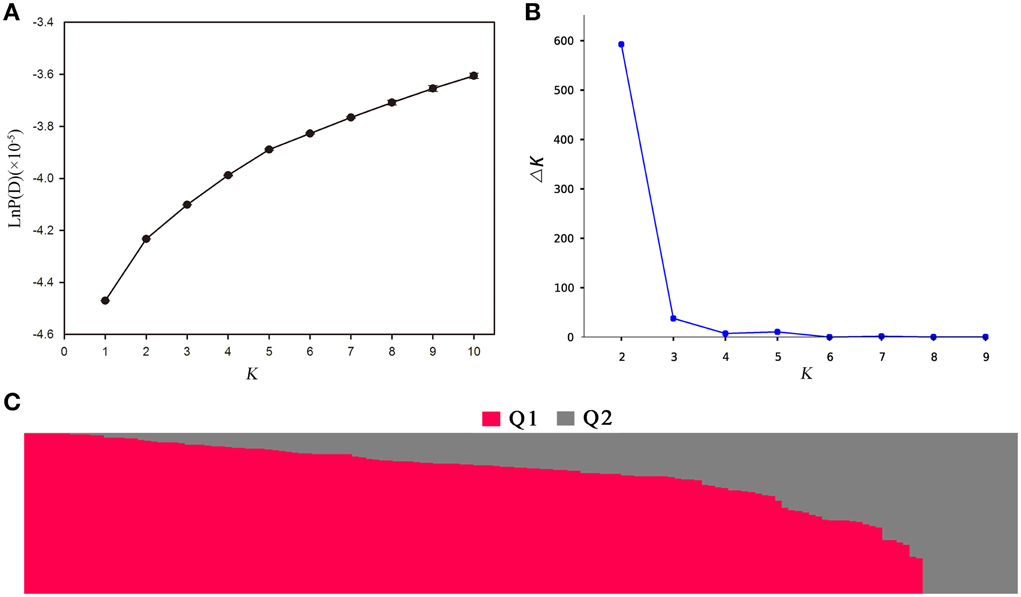
Figure 4. Population structure analysis of 143 rapeseed accessions by STRUCTURE software. (A) The estimated LnP(D) of possible clusters (k) from 1 to 10; (B) Δk based on the change of LnP(D) between consecutive k; and (C) Q1 and Q2 are the composition values belonging to the two sub-populations (K = 2) for a given accession which is represented by a vertical bar.
The 2434 informative SNPs with a MAF > 0.2 and little or no missing data were used to estimate the relative kinship in the set of 143 lines. As shown in Figure 5, the average relative kinship between any two lines was 0.0332, or ~57% of the pairwise kinship estimates were close to 0, and 21% of the kinship estimates ranged from 0 to 0.05. The remaining estimates ranged from 0.05 to 1, with a continuously decreasing number of pairs falling in higher estimated categories. These results indicated that most lines in the panel have no or very weak kinship, which might be attributed to the broad ranging collection of genotypes and the exclusion of similar genotypes before analysis.
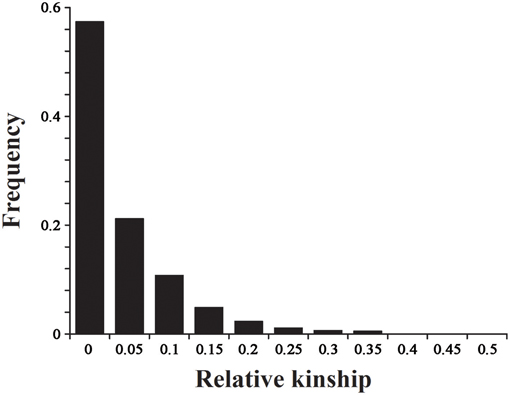
Figure 5. The distribution for pairwise relative kinship. Only the kinship values ranging from 0 to 0.5 are shown.
Association Mapping and Candidate Gene Prediction
A total of 25 and 60 associations (P < 2.90E−5) were detected for branch angle by using BLUP across three environments and an individual environment (Figure 6, Table 3; Supplementary Figure 2). To select the major QTL among all the significant SNPs, these SNPs were clumped by using an LD block as a criterion (Gabriel et al., 2002), and the peak SNP within each LD block was retained. After the clumping of SNPs, six QTL for branch angle were distinguished with the BLUP values of a branch angle across three environments and the peak SNPs are listed in Table 3. The six peak regions were 6.1, 3.5, 23.2, 3.0, 39.5, and 48.7 Mb of A2, A3, A7, C3, C5, and C7, respectively, in the “pseudomolecules” of B. napus, and the cumulative phenotypic variance explained by all significant SNPs was 92.42%, which contributed to 16.60–18.95% of the phenotypic variance based on the R2-values. In Yangluo-2013, nine peak SNPs were detected in Q+K models with an FDR of 0.021, and the eight peak regions were 10.1, 22.2, 18.0, 0.1, 42.8, 48.7, and 2.9 Mb for A2, A5, A8, A10, C2, C6, C7, and C8, respectively. In Yangluo-2014, two peak SNPs were detected with FDRs of 0.013 and 0.027, and the two peak regions were 48.7 and 23.2 Mb of A7 and C7, respectively. In Lu'an-2013, only one significantly peak SNP in A3 was detected in 31.3 Mb region with an FDR of 0.263.
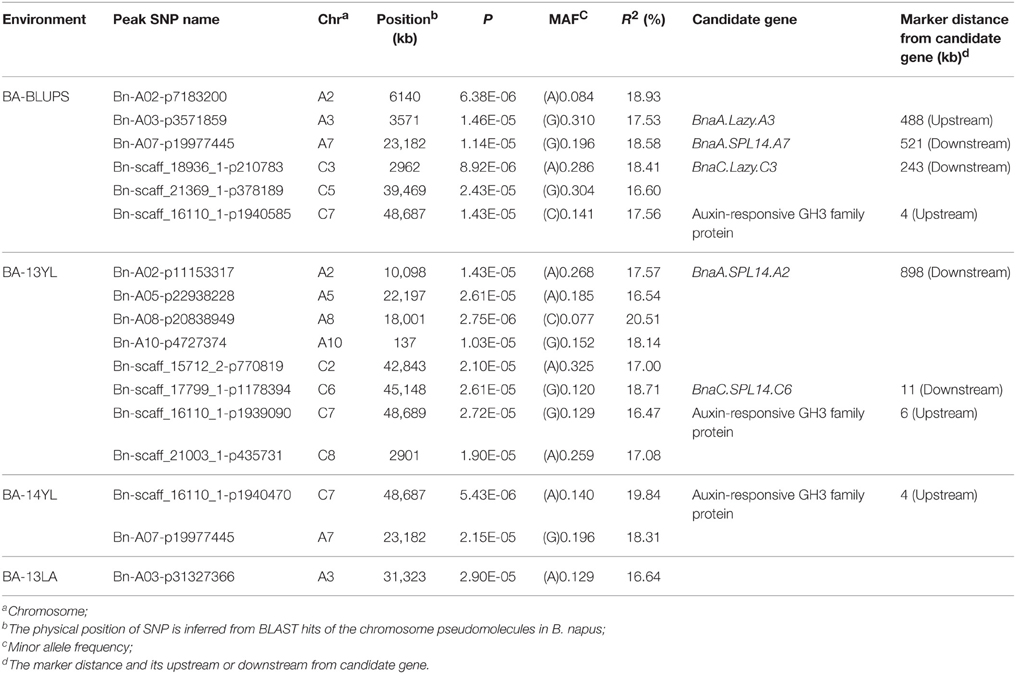
Table 3. A summary of significant (P < 2.90E−5) SNP-trait associations associated with branch angle.
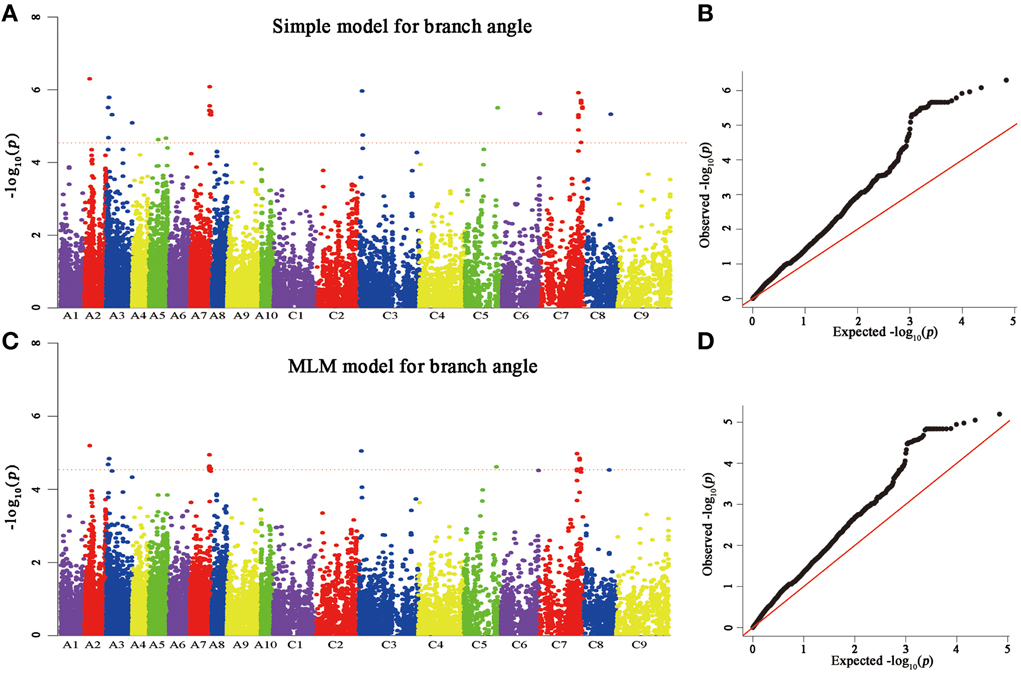
Figure 6. Genome-wide association analysis of branch angle. (A) Manhattan plots of the simple model for BA. (B) A quantile-quantile (QQ) plot for a simple branch model (C) Manhattan plots of MLM for BA, as in (A). (D) A quantile-quantile (QQ) plot of MLM for BA. Each dot represents a SNP. The horizontal dashed red line indicates the Bonferroni-corrected significance threshold at -log10(P) = 4.5.
Notably, the Lazy orthologs were searched in the “pseudomolecules” of B. napus and two orthologs were found at 2.6 Mb in A3 and 3.2 Mb in C3, which were 488 kb away from the peak SNP Bn-A03-p3571859 and 243 kb away from the peak SNP Bn-A03-p3571859. In addition, the Squamosa Promoter Binding Protein-like 14 (SPL14) orthologs were searched in the “pseudomolecules” of B. napus and one ortholog was found at 24.3 Mb of A7, which was 521 kb away from the peak SNP Bn-A07-p19977445. Aside from the Lazy and SPL14 genes, an auxin-responsive GRETCHEN HAGEN 3 (GH3) ortholog “pseudomolecules” of B. napus in 48.7 Mb of C7, which was very close (only 4 kb) to the peak SNP Bn-scaff-16110-1-p1940585.
Discussion
In this study, a panel comprising 143 B. napus germplasm lines was adopted for association mapping study. Significant natural phenotypic variation in branch angle was observed in rapeseed germplasms. In general, to unravel the genetic basis of trait variation, a number of traditional genome-wide phenotype-to-genotype approaches have been employed by LD association mapping. An association mapping study employs the large number of recombination events that occur throughout the entire breeding selection history of the mapping population, thereby allowing fine-scale QTL mapping (Nordborg and Tavaré, 2002). Although the sample size is not sufficiently large in our association panel, the phenotypic variation in branch angle is very large. The heritability of this trait is relatively high, and it is related to significant genome loci with great effects. However, there must be existence of some unknown genes regulating branch angle in rapeseed comparing to model plant Arabidopsis and rice (Teichmann and Muhr, 2015), which still could not make of it. The novelty SNP clusters of QTL from our preliminary exploration are starting to decompose this aspect. Based on the MLM model, a total of 60 SNP associations (P < 2.90E−5) were detected for branch angle in three environments, and 25 significant SNP loci were further verified using BLUP model. Through the analysis of GWA, the markers detected in the environmental BLUPs value correlated significantly (P < 0.001) with branch angle, with phenotypic value effects between 16.60 and 18.93%. Exploring these associated markers provides a genetic basis to analyze branch angle variation in rapeseed.
The discovery of many false-positive QTL is due to the population structure (Zhao et al., 2007). To resolve this problem, several models have been developed including the Q+K model and the PCA model. Although the Q+K model have been demonstrated the most powerful method for identifying associations by many studies (Yu et al., 2005; Stich and Melchinger, 2009), we also compared different models and obtained the same conclusion that the MLM model (Q+K) was most suitable for our population. In our study, all B. napus accession lines can be largely divided into two sub-populations in STRUCTURE and compared with an association analysis from a previous study (Harper et al., 2012), and the population structure classification leads to the same results. Hence, the reasonable results for a population structure-associated analysis provide a foundation and guarantee. For the association analysis, we used a mixed model approach that avoided a confounding effect in the population structure and population relations. We acquired the branch angle BLUP values in three independent environments to eliminate the influence of environment.
To account for the potential number of false positives, we implemented stringent quality control on the included polymorphisms, with conservative non-parametric testing and an adjusted statistical significance threshold. Our approach relied on natural variations in rapeseed, leading to a set of strong candidate genes by comparative genome method. A high degree of co-linearity and congruence in the A. thaliana and Brassica genomes has been recognized (Parkin et al., 2005; Ziolkowski et al., 2006) and a single locus in the Arabidopsis genome is generally represented by three distinct loci in diploid Brassica species. Several genes that play key roles in regulating branch development in Arabidopsis have been identified. By applying this method to the recently grown tetraploid crop B. napus, we identified genomic regions that underlie four QTL for branch angle. The detected regions contained two Lazy (AT5G14090) orthologous, SPL14 (AT1G20980) and Auxin-responsive GH3 family protein (AT5G51470) genes, which were all relevant to angle formation in Arabidopsis thaliana.
Rapeseed is an excellent model for association analyses because of the extensive architectural variation across its native range and its diverse germplasm collections through artificial selection. During rapeseed domestication and breeding process, breeders often focus on important characteristics such as oil content, biotic stress resistance, and quality for directional selection for greater oil yield and better quality, which were directly caused by an artificial selection gene locus mutation at a lower frequency. For example, in terms of oil and glucosinolate contents, and because of the artificial selection on Fatty Acid Elongation 1 (FAE1) and High Aliphatic Glucosinolate 1 (HAG1) gene locus, gene locus mutation occurs at a lower frequency in double-low rapeseed populations (Li et al., 2014). However, the optimation of rapeseed architecture (branch angle and plant height) to improve yield is more urgent nowadays. Association-mapping approach has advantage for distinguishing the most favorable alleles within a diverse genetic background, which provides the necessary genotypic information to facilitate the design of efficient rapeseed introgression and selection schemes throughout the world. This study indicated that the SNP variation frequency control of rapeseed branch angle habits is slightly higher than the results. This finding may be related to the domestication and genetic improvement of characteristics that are not particularly selected by the breeding program.
The association of branch angle with increased plant productivity in rapeseed may be beneficial to lodging resistance and high-density field cultivation. This genetic analysis of branch angle and plant morphological characteristics was only based on one natural population. Therefore, the observed inter-trait and trait-marker associations must be confirmed in other rapeseed populations. Further evaluations of branch angle and plant morphology should be conducted under contrasting cropping density, and total seed yield measurements should be taken because the seed harvest index in addition to the plant growth and productivity are strongly affected by the cropping density.
Conclusion
In this study, GWA mapping with corrections for the population structure were used to identify a number of novel loci and refine the map locations of known loci related to branch angle in rapeseed. This information not only demonstrates that GWAS mapping can be used as a powerful tool for dissecting plant architecture mechanisms in rapeseed but also provides valuable markers for breeding rapeseed cultivars with the ideotype. In addition, the candidate genes nearby these SNP loci represent promising targets for efforts to further identify causal variants and to clarify how the implicated genes affect branch angle in rapeseed.
Author Contributions
JL and QH conceived and designed the study. JL, WW, and DL conducted the experiments; DM and HW coordinated genotyping with SNP markers; LF and YL provided rapeseed lines; JL and WW analyzed and interpreted data, and prepared the manuscript; QH supervised the whole study; all authors reviewed and edited the manuscript.
Conflict of Interest Statement
The authors declare that the research was conducted in the absence of any commercial or financial relationships that could be construed as a potential conflict of interest.
Acknowledgments
The Science and Technology Innovation Project of Chinese Academy of Agricultural Sciences (Group No. 118), the Earmarked Fund for China Agriculture Research System (CARS-13), the Hubei Agricultural Science and Technology Innovation Center, the Natural Science Foundation of China (31471535), and Natural Science Foundation of Hubei Province (2014CFB156) supported this work.
Supplementary Material
The Supplementary Material for this article can be found online at: http://journal.frontiersin.org/article/10.3389/fpls.2016.00021
References
Altschul, S. F., Gish, W., Miller, W., Myers, E. W., and Lipman, D. J. (1990). Basic local alignment search tool. J. Mol. Biol. 215, 403–410. doi: 10.1016/s0022-2836(05)80360-2
Atwell, S., Huang, Y. S., Vilhjálmsson, B. J., Willems, G., Horton, M., Li, Y., et al. (2010). Genome-wide association study of 107 phenotypes in Arabidopsis thaliana inbred lines. Nature 465, 627–631. doi: 10.1038/nature08800
Bai, F., Reinheimer, R., Durantini, D., Kellogg, E. A., and Schmidt, R. J. (2012). TCP transcription factor, BRANCH ANGLE DEFECTIVE 1 (BAD1), is required for normal tassel branch angle formation in maize. Proc. Natl. Acad. Sci. U.S.A. 109, 12225–12230. doi: 10.1073/pnas.1202439109
Bradbury, P. J., Zhang, Z., Kroon, D. E., Casstevens, T. M., Ramdoss, Y., and Buckler, E. S. (2007). TASSEL: software for association mapping of complex traits in diverse samples. Bioinformatics 23, 2633–2635. doi: 10.1093/bioinformatics/btm308
Breseghello, F., and Sorrells, M. E. (2006). Association mapping of kernel size and milling quality in wheat (Triticum aestivum L.) cultivars. Genetics 172, 1165–1177. doi: 10.1534/genetics.105.044586
Cai, D., Xiao, Y., Yang, W., Ye, W., Wang, B., Younas, M., et al. (2014). Association mapping of six yield-related traits in rapeseed (Brassica napus L.). Theor. Appl. Genet. 127, 85–96. doi: 10.1007/s00122-013-2203-9
Chalhoub, B., Denoeud, F., Liu, S., Parkin, I. A., Tang, H., Wang, X., et al. (2014). Early allopolyploid evolution in the post-Neolithic Brassica napus oilseed genome. Science 345, 950–953. doi: 10.1126/science.1253435
Dabney, A., and Storey, J. D. (2004). Q-value estimation for false discovery rate control. Medicine 344, 539–548.
Diepenbrock, W. (2000). Yield analysis of winter oilseed rape (Brassica napus L.): a review. Field Crop. Res. 67, 35–49. doi: 10.1016/s0378-4290(00)00082-4
Donald, C. M. (1968). The breeding of crop ideotypes. Euphytica 17, 385–403. doi: 10.1007/BF00056241
Dong, Z., Jiang, C., Chen, X., Zhang, T., Ding, L., Song, W., et al. (2013). Maize LAZY1 mediates shoot gravitropism and inflorescence development through regulating auxin transport, auxin signaling, and light response. Plant Physiol. 163, 1306–1322. doi: 10.1104/pp.113.227314
Edwards, D., Batley, J., and Snowdon, R. J. (2013). Accessing complex crop genomes with next-generation sequencing. Theor. Appl. Genet. 126, 1–11. doi: 10.1007/s00122-012-1964-x
Evanno, G., Regnaut, S., and Goudet, J. (2005). Detecting the number of clusters of individuals using the software STRUCTURE: a simulation study. Mol. Ecol. 14, 2611–2620. doi: 10.1111/j.1365-294x.2005.02553.x
Gabriel, S. B., Schaffner, S. F., Nguyen, H., Moore, J. M., Roy, J., Blumenstiel, B., et al. (2002). The structure of haplotype blocks in the human genome. Science 296, 2225–2229. doi: 10.1126/science.1069424
Hardy, O. J., and Vekemans, X. (2002). SPAGeDi: a versatile computer program to analyse spatial genetic structure at the individual or population levels. Mol. Ecol. Notes 2, 618–620. doi: 10.1046/j.1471-8286.2002.00305.x
Harper, A. L., Trick, M., Higgins, J., Fraser, F., Clissold, L., Wells, R., et al. (2012). Associative transcriptomics of traits in the polyploid crop species Brassica napus. Nat. Biotechnol. 30, 798–802. doi: 10.1038/nbt.2302
Huang, X., Wei, X., Sang, T., Zhao, Q., Feng, Q., Zhao, Y., et al. (2010). Genome-wide association studies of 14 agronomic traits in rice landraces. Nat. Genet. 42, 961–967. doi: 10.1038/ng.695
Ihaka, R., and Gentleman, R. R. (1996). A language for data analysis and graphics. J. Comput. Graph. Statist. 5, 299–314.
Jakobsson, M., and Rosenberg, N. A. (2007). CLUMPP: a cluster matching and permutation program for dealing with label switching and multimodality in analysis of population structure. Bioinformatics 23, 1801–1806. doi: 10.1093/bioinformatics/btm233
Jin, J., Huang, W., Gao, J. P., Yang, J., Shi, M., Zhu, M. Z., et al. (2008). Genetic control of rice plant architecture under domestication. Nat. Genet. 40, 1365–1369. doi: 10.1038/ng.247
Ku, L., Wei, X., Zhang, S., Zhang, J., Guo, S., and Chen, Y. (2011). Cloning and characterization of a putative TAC1 ortholog associated with leaf angle in maize (Zea mays L.). PLoS ONE 6:e20621. doi: 10.1371/journal.pone.0020621
Li, F., Chen, B., Xu, K., Wu, J., Song, W., Bancroft, I., et al. (2014). Genome-wide association study dissects the genetic architecture of seed weight and seed quality in rapeseed (Brassica napus L.). DNA Res. 21, 355–367. doi: 10.1093/dnares/dsu002
Li, P., Wang, Y., Qian, Q., Fu, Z., Wang, M., Zeng, D., et al. (2007). LAZY1 controls rice shoot gravitropism through regulating polar auxin transport. Cell Res. 17, 402–410. doi: 10.1038/cr.2007.38
Liu, K., and Muse, S. V. (2005). PowerMarker: an integrated analysis environment for genetic marker analysis. Bioinformatics 21, 2128–2129. doi: 10.1093/bioinformatics/bti282
Liu, S., Liu, Y., Yang, X., Tong, C., Edwards, D., Parkin, I. A., et al. (2014). The Brassica oleracea genome reveals the asymmetrical evolution of polyploid genomes. Nat. Commun. 5:3930. doi: 10.1038/ncomms4930
Lomax, T. L. (1997). Molecular genetic analysis of plant gravitropism. Gravit. Space Biol. Bull. 10, 75–82.
Lu, G., Harper, A. L., Trick, M., Morgan, C., Fraser, F., O'Neill, C., et al. (2014). Associative transcriptomics study dissects the genetic architecture of seed glucosinolate content in Brassica napus. DNA Res. 21, 613–625. doi: 10.1093/dnares/dsu024
Mansfield, B. D., and Mumm, R. H. (2014). Survey of plant density tolerance in US maize germplasm. Crop Sci. 54, 157–173. doi: 10.2135/cropsci2013.04.0252
Mei, D., Wang, H., Hu, Q., Li, Y., Xu, Y., and Li, Y. (2009). QTL analysis on plant height and flowering time in Brassica napus. Plant Breed. 128, 458–465. doi: 10.1111/j.1439-0523.2008.01528.x
Nordborg, M., and Tavaré, S. (2002). Linkage disequilibrium: what history has to tell us. Trends Genet. 18, 83–90. doi: 10.1016/S0168-9525(02)02557-X
Parkin, I. A., Gulden, S. M., Sharpe, A. G., Lukens, L., Trick, M., Osborn, T. C., et al. (2005). Segmental structure of the Brassica napus genome based on comparative analysis with Arabidopsis thaliana. Genetics 171, 765–781. doi: 10.1534/genetics.105.042093
Pritchard, J. K., Stephens, M., and Donnelly, P. (2000). Inference of population structure using multilocus genotype data. Genetics 155, 945–959.
Raman, H., Raman, R., Kilian, A., Detering, F., Carling, J., Coombes, N., et al. (2014). Genome-wide delineation of natural variation for pod shatter resistance in Brassica napus. PLoS ONE 9:e101673. doi: 10.1371/journal.pone.0101673
Robert, H. S., and Friml, J. (2009). Auxin and other signals on the move in plants. Nat. Chem. Biol. 5, 325–332. doi: 10.1038/nchembio.170
Rosenberg, N. A. (2004). DISTRUCT: a program for the graphical display of population structure. Mol. Ecol. Notes 4, 137–138. doi: 10.1046/j.1471-8286.2003.00566.x
Sang, D., Chen, D., Liu, G., Liang, Y., Huang, L., Meng, X., et al. (2014). Strigolactones regulate rice tiller angle by attenuating shoot gravitropism through inhibiting auxin biosynthesis. Proc. Natl. Acad. Sci. U.S.A. 111, 11199–11204. doi: 10.1073/pnas.1411859111
Shi, J., Li, R., Qiu, D., Jiang, C., Long, Y., Morgan, C., et al. (2009). Unraveling the complex trait of crop yield with quantitative trait loci mapping in Brassica napus. Genetics 182, 851–861. doi: 10.1534/genetics.109.101642
Snowdon, R. J., and Iniguez Luy, F. L. (2012). Potential to improve oilseed rape and canola breeding in the genomics era. Plant Breed. 131, 351–360. doi: 10.1111/j.1439-0523.2012.01976.x
Song, X., and Zhang, T. (2009). Quantitative trait loci controlling plant architectural traits in cotton. Plant Sci. 177, 317–323. doi: 10.1016/j.plantsci.2009.05.015
Stich, B., and Melchinger, A. E. (2009). Comparison of mixed-model approaches for association mapping in rapeseed, potato, sugar beet, maize, and Arabidopsis. BMC Genomics 10:94. doi: 10.1186/1471-2164-10-94
Teichmann, T., and Muhr, M. (2015). Shaping plant architecture. Front. Plant Sci. 6:233. doi: 10.3389/fpls.2015.00233
Tian, F., Bradbury, P. J., Brown, P. J., Hung, H., Sun, Q., Flint-Garcia, S., et al. (2011). Genome-wide association study of leaf architecture in the maize nested association mapping population. Nat. Genet. 43, 159–162. doi: 10.1038/ng.746
Turner, S. D. (2014). qqman: an R package for visualizing GWAS results using Q-Q and manhattan plots. biorXiv. doi: 10.1101/005165
Wang, N., Li, F., Chen, B., Xu, K., Yan, G., Qiao, J., et al. (2014). Genome-wide investigation of genetic changes during modern breeding of Brassica napus. Theor. Appl. Genet. 127, 1817–1829. doi: 10.1007/s00122-014-2343-6
Wang, X., Wang, H., Wang, J., Sun, R., Wu, J., Liu, S., et al. (2011). The genome of the mesopolyploid crop species Brassica rapa. Nat. Genet. 43, 1035–1039. doi: 10.1038/ng.919
Wang, Y., and Li, J. (2005). The plant architecture of rice (Oryza sativa). Plant Mol. Biol. 59, 75–84. doi: 10.1007/s11103-004-4038-x
Xu, J., Song, X., Cheng, Y., Zou, X., Zeng, L., Qiao, X., et al. (2014). Identification of QTL for branch number in oilseed rape (Brassica napus L.). J. Genet. Genomics 41, 557–559. doi: 10.1016/j.jgg.2014.06.006
Yoshihara, T., Spalding, E. P., and Iino, M. (2013). AtLAZY1 is a signaling component required for gravitropism of the Arabidopsis thaliana inflorescence. Plant J. 74, 267–279. doi: 10.1111/tpj.12118
Yu, B., Lin, Z., Li, H., Li, X., Li, J., Wang, Y., et al. (2007). TAC1, a major quantitative trait locus controlling tiller angle in rice. Plant J. 52, 891–898. doi: 10.1111/j.1365-313X.2007.03284.x
Yu, J., Pressoir, G., Briggs, W. H., Bi, I. V., Yamasaki, M., Doebley, J. F., et al. (2005). A unified mixed-model method for association mapping that accounts for multiple levels of relatedness. Nat. Genet. 38, 203–208. doi: 10.1038/ng1702
Ziolkowski, P. A., Kaczmarek, M., Babula, D., and Sadowski, J. (2006). Genome evolution in Arabidopsis/Brassica: conservation and divergence of ancient rearranged segments and their breakpoints. Plant J. 47, 63–74. doi: 10.1111/j.1365-313X.2006.02762.x
Zhang, Z., Ersoz, E., Lai, C. Q., Todhunter, R. J., Tiwari, H. K., Gore, M. A., et al. (2010). Mixed linear model approach adapted for genome-wide association studies. Nat. Genet. 42, 355–360. doi: 10.1038/ng.546
Zhao, K., Aranzana, M. J., Kim, S., Lister, C., Shindo, C., Tang, C., et al. (2007). An Arabidopsis example of association mapping in structured samples. PLoS Genet. 3:e4. doi: 10.1371/journal.pgen.0030004
Zhao, K., Tung, C. W., Eizenga, G. C., Wright, M. H., Ali, M. L., Price, A. H., et al. (2011). Genome-wide association mapping reveals a rich genetic architecture of complex traits in Oryza sativa. Nat. Commun. 2:467. doi: 10.1038/ncomms1467
Keywords: Brassica napus L., branch angle, genetic variation, association mapping, multiple environments, candidate genes
Citation: Liu J, Wang W, Mei D, Wang H, Fu L, Liu D, Li Y and Hu Q (2016) Characterizing Variation of Branch Angle and Genome-Wide Association Mapping in Rapeseed (Brassica napus L.). Front. Plant Sci. 7:21. doi: 10.3389/fpls.2016.00021
Received: 01 October 2015; Accepted: 08 January 2016;
Published: 04 February 2016.
Edited by:
Donal Martin O'Sullivan, University of Reading, UKReviewed by:
Maoteng Li, Huazhong University of Science and Technology, ChinaDaniela Marone, Centre of Cereal Research, Italy
Copyright © 2016 Liu, Wang, Mei, Wang, Fu, Liu, Li and Hu. This is an open-access article distributed under the terms of the Creative Commons Attribution License (CC BY). The use, distribution or reproduction in other forums is permitted, provided the original author(s) or licensor are credited and that the original publication in this journal is cited, in accordance with accepted academic practice. No use, distribution or reproduction is permitted which does not comply with these terms.
*Correspondence: Qiong Hu, huqiong01@caas.cn