 Ying Wang
 Di-Feng Zhan2
 Xian Jia
 Hao-Fu Dai
 Shi-Qing Peng
- 1Key Laboratory of Biology and Genetic Resources of Tropical Crops, Ministry of Agriculture, Institute of Tropical Bioscience and Biotechnology, Chinese Academy of Tropical Agricultural Sciences, Haikou, China
- 2College of Agronomy, Hainan University, Haikou, China
- 3State Key Laboratory of Cellular Stress Biology, School of Life Sciences, Xiamen University, Xiamen, China
Aquilaria sinensis (Lour.) Gilg is an important medicinal woody plant producing agarwood, which is widely used in traditional Chinese medicine. High-throughput sequencing of chloroplast (cp) genomes enhanced the understanding about evolutionary relationships within plant families. In this study, we determined the complete cp genome sequences for A. sinensis. The size of the A. sinensis cp genome was 159,565 bp. This genome included a large single-copy region of 87,482 bp, a small single-copy region of 19,857 bp, and a pair of inverted repeats (IRa and IRb) of 26,113 bp each. The GC content of the genome was 37.11%. The A. sinensis cp genome encoded 113 functional genes, including 82 protein-coding genes, 27 tRNA genes, and 4 rRNA genes. Seven genes were duplicated in the protein-coding genes, whereas 11 genes were duplicated in the RNA genes. A total of 45 polymorphic simple-sequence repeat loci and 60 pairs of large repeats were identified. Most simple-sequence repeats were located in the noncoding sections of the large single-copy/small single-copy region and exhibited high A/T content. Moreover, 33 pairs of large repeat sequences were located in the protein-coding genes, whereas 27 pairs were located in the intergenic regions. Aquilaria sinensis cp genome bias ended with A/T on the basis of codon usage. The distribution of codon usage in A. sinensis cp genome was most similar to that in the Gonystylus bancanus cp genome. Comparative results of 82 protein-coding genes from 29 species of cp genomes demonstrated that A. sinensis was a sister species to G. bancanus within the Malvales order. Aquilaria sinensis cp genome presented the highest sequence similarity of >90% with the G. bancanus cp genome by using CGView Comparison Tool. This finding strongly supports the placement of A. sinensis as a sister to G. bancanus within the Malvales order. The complete A. sinensis cp genome information will be highly beneficial for further studies on this traditional medicinal plant. Moreover, the results will enhance our understanding about the evolution of cp genomes of the Malvales order, particularly with regard to the role of A. sinensis in plant systematics and evolution.
Introduction
Plant chloroplasts (cps) are key organelles for photosynthesis and carbon fixation (Neuhaus and Emes, 2000). The cp genome sequence contains useful information in plant systematics because of its maternal inheritance in most angiosperms (Corriveau and Coleman, 1988; Zhang et al., 2003). Substitution rates in plant cp genomes are much lower than those in nuclear genomes (Wolfe et al., 1987). Plant cp genomes are valuable sources of genetic markers for phylogenetic analyses because of their very low level of recombination (Provan et al., 2001; Ravi et al., 2008). The cp DNA sequence was initially discovered during physical mapping of the Zea mays cp, which was produced by digestion with multiple restriction enzymes (Bedbrook and Bogorad, 1976). Subsequently, the first complete nucleotide sequence of Nicotiana tabacum was determined by the clone sequencing of plasmid and cosmid libraries (Kumano, 1986). Over 600 plant cp genomes have been sequenced and deposited in the NCBI Organelle Genome Resources. The cp genome evolution in land plants may be elucidated using these database resources. The cp in angiosperms exhibits a conserved quadripartite structure ranging from 115 to 165 kb in length and consists of one large single-copy (LSC) region, one small single-copy (SSC) region, and two copies of inverted repeat (IR; Palmer, 1991; Raubeson and Jansen, 2005). The Arabidopsis thaliana cp genome contains a circular DNA composed of 154,478 bp with 87 potential protein-coding genes (Sato et al., 1999). The cp DNA from maize (Z. mays) consists of 140,387 bp with a total of 104 genes (Bedbrook and Bogorad, 1976). The complete cp DNA of Cedrus deodara is circular molecule of 119,298 bp with 114 genes (Ching et al., 2010). However, some parasitic plants, such as Conopholis americana, which demonstrate unique life cycles, are exceptions because the sizes of their cp genomes are beyond 115–165 kb, with the smallest plastome of 45 kb in land plants (Wicke et al., 2013). The development of DNA sequencing technology has resulted in the extensive use of cp genomes for molecular marker and molecular phylogenetic studies (Tangphatsornruang et al., 2009; Takano and Okada, 2011; Awasthi et al., 2012; Jheng et al., 2012; Chen and Melis, 2013; Turner et al., 2013; Gaudeul et al., 2014).
Agarwood is widely used as a sedative, digestive, and antiemetic traditional drug. Agarwood sculpturing is valuable for interior decoration and is also popularly used as incense and perfume in Asia. The stems, branches, or roots of Aquilaria and Gyrinops trees are wounded and infected by fungi to produce agarwood (the wounds can be caused by wind, lightning strikes, gnawing of ants or insects, or microorganism invasion). Aquilaria sinensis is the only certified source for producing agarwood listed in China Pharmacopoeia (China pharmacopoeia Committee, 2010). All A. sinensis species are endangered because of the high demand for agarwood products; hence, these species are regulated under the Convention on International Trade in Endangered Species of Wild Fauna and Flora. However, the genomic resources for A. sinensis are limited, and little is known about the composition and organization of its cp genomes and their evolution. In this study, we report the complete cp genome sequence of A. sinensis (GenBank accession number: KT148967) in accordance with the Illumina Hiseq2500 standard protocol. Overall, the results provide basic genetic information on A. sinensis cp and the role of A. sinensis in plant systematics and evolution.
Materials and Methods
DNA Extraction and Sequencing
Aquilaria sinensis fresh leaves were collected from a 2-year-old tree at the Experimental Farm of the Chinese Academy of Tropical Agriculture Sciences, Hainan, PR China. The leaves were cleansed, frozen in liquid nitrogen, and ground using a tissue lyser. DNA was extracted using a Plant Genomic DNA Kit (Foregene Biotech, China). DNA was used to generate 500 bp (insert size) paired-end library in accordance with the Illumina Hiseq2500 standard protocol. Approximately 3.1 Gb of raw data were generated with pair-end 125 bp read length.
De novo CP Genome Assembly
The obtained nucleotide sequencing reads were qualitatively assessed and assembled to contigs by using SOAPdenovo2 (Luo et al., 2012) with kmer length of 83. The assembled contigs included a mixture of sequences from organellar and nuclear genomes. The average coverage of cp genomes is usually much higher than that of nuclear genomes because many cps are found in a single cell (Steele et al., 2012; Straub et al., 2012). Thus, a complete de novo assembly of the cp genomes was performed using the assembly quality-filtered reads that exhibit high coverage for the cp genomes. We sorted the assembled contigs by contig-read depth analysis of assemblies by using the high correlation between sequencing depth and number of copies in the genome. The quality-filtered reads were remapped to the assembled contigs to calculate the sequencing depth with BWA (Li and Durbin, 2009). Thus, the cp contigs with high coverage (more than 500 ×) were isolated from the nuclear contigs by using the difference of read depths between contigs (Figure S1). All published cp genome sequences of dicotyledons were used as references to map the contigs with BLAST (Table S1) and thus confirm the cp genome contigs. Finally, all isolated cp contigs were combined, and reads were recaptured to isolate more cp DNA reads. Contigs were reassembled and extended to obtain a complete cp genome sequence.
Genomic Annotation and Analysis
Preliminarily gene annotation was performed using the online program Dual Organellar Genome Annotator (OGDRAW v1.2; Wyman et al., 2004) and cp Genome Annotation, Visualization, Analysis, and GenBank Submission Tool (Cheng et al., 2013) with plastid/bacterial genetic code and default conditions. Putative gene and protein sequences were BLAST-searched in non-redundant nucleotide database and non-redundant protein database to verify the exact gene and exon boundaries. All tRNA genes were further confirmed through online Trnascan-SE and tRNADB-CE search server (Griffiths-Jones et al., 2003; Schattner et al., 2005; Abe et al., 2011). The graphical map of the circular plastome was drawn using Organellar Genome DRAW (Lohse et al., 2007).
Identification of Simple-Sequence Repeats (SSRs)
The genomic sequence was applied to exploit potential SSRs by using MISA software (http://pgrc.ipk-gatersleben.de/misa/). Tandem repeats of 1–6 nucleotides were considered as microsatellites. The minimum numbers of repeats were set to 10, 6, 5, 5, 5, and 5 for mono-, di-, tri-, tetra-, penta-, and hexa-nucleotides, respectively.
Long Repeat Analysis
Web-based REPuter (http://bibiserv.techfak.uni-bielefeld.de/reputer/) was used to analyze the repeat sequences, which included forward, reverse, and tandem repeats with minimal lengths of 30 bp and edit distances of less than 3 bp.
Codon Usage
Codon usage was determined for all protein-coding genes. Statistical analyses of the distributions and visualization of codon usage in the form of heatmaps of 28 species of Angiosperms and histogram were conducted using R language with relative synonymous codon usage (RSCU) value (Sharp and Li, 1987).
RSCU is a simple measure of non-uniform usage of synonymous codons in a coding sequence. The RSCU value is the number of times a particular codon is observed, relative to the number of times that the codon would be observed for a uniform synonymous codon usage (i.e., all codons for a given amino acid exhibit similar probabilities). The RSCU value in the absence of any codon usage bias is 1.00, which is the case for the CDS sequence in the following example. A codon used less frequently than expected will achieve RSCU of <1.00, whereas codons used more frequently than expected may reach RSCU of >1.00.
Phylogenetic Analysis
The jModeltest 0.1.1 software was employed to analyze the general GTR+G+I model for nucleotide sequence and HIVb+I+G model for protein sequence by using optimized parameters (Posada, 2008). Phylogenetic analysis was subsequently performed using Maximum likelihood (ML) and Bayesian inference (BI) methods. ML analysis was conducted using RAxML8.1.5 with 1000 bootstrap replicates (Stamatakis, 2014). BI analysis was conducted using Phylobayes 4.1b with two chain max diff <0.01 (Lartillot et al., 2009).
CGView Comparison Tool (CCT) Map
The A. sinensis cp genome was compared with other available cp genomes of Malvales by using CCT (Grant and Stothard, 2008). Genes were signed by Clusters of Orthologous Groups, and BLAST was used to align other genomes to A. sinensis. The results are shown as a circular map. AT distributions were measured on the basis of AT skewed using the equation: AT-skew = (A−T)/(A+T).
Results and Discussion
Genome Sequencing and Assembly
A total of 2.48 × 10⁷ reads with an average read length of 125 bp were obtained after low-quality bases and adapter sequences were trimmed. De novo assembly produced 691,722 contigs (2.78%). The size of the A. sinensis cp genome was 159,565 bp (Figure 1). The genome included an LSC region of 87,482 bp, an SSC region of 19,857 bp, and a pair of IRs (IRa and IRb) of 26,113 bp each (Table 1). The GC content was 37.11% (Table S2). However, the GC content was unevenly distributed in the entire cp genome, with the highest value in the IR regions (42.86%), followed by the LSC (34.95%) and SSC (31.58%) regions. The frequency of codon usage was deduced for the cp genome on the basis of the CDS sequences. Notably, the AT contents were 54.64, 62.31, and 69.34% at the first, second, and third codon positions, respectively, within the protein-coding regions (Table S2). Bias toward higher AT content at the third codon position was consistent with the enrichment of A and T, which has been widely observed in many other sequenced land plant cp genomes (Morton, 1998; Tangphatsornruang et al., 2009; Nie et al., 2012; Qian et al., 2013). The sequences of the A. sinensis cp genome were deposited in GenBank with accession number KT148967.
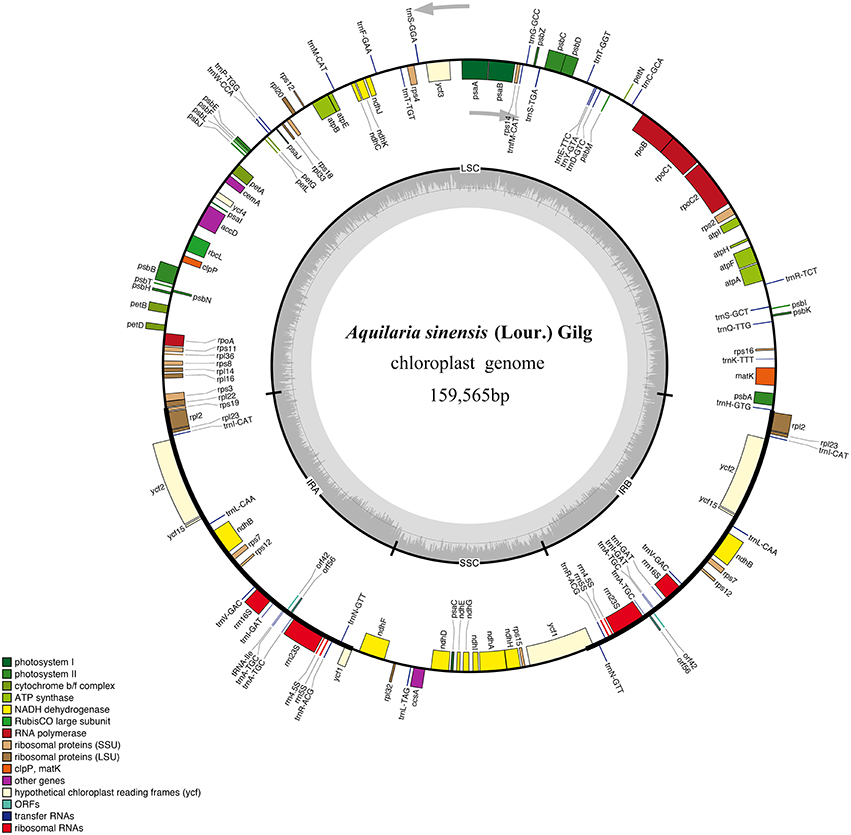
Figure 1. Gene map of A. sinensis chloroplast (cp) genome sequence. Organization of the cp genome of A. sinensis showing annotated genes. Genes drawn inside the circle are transcribed clockwise, and those outside are counter clockwise. Genes belonging to different functional groups are color-coded. The inner circle shows the locations of the large single-copy region, small single-copy, and the pair of inverted repeats (IRa and IRb). The darker gray in the inner circle corresponds to GC content, whereas the lighter gray corresponds to AT content.
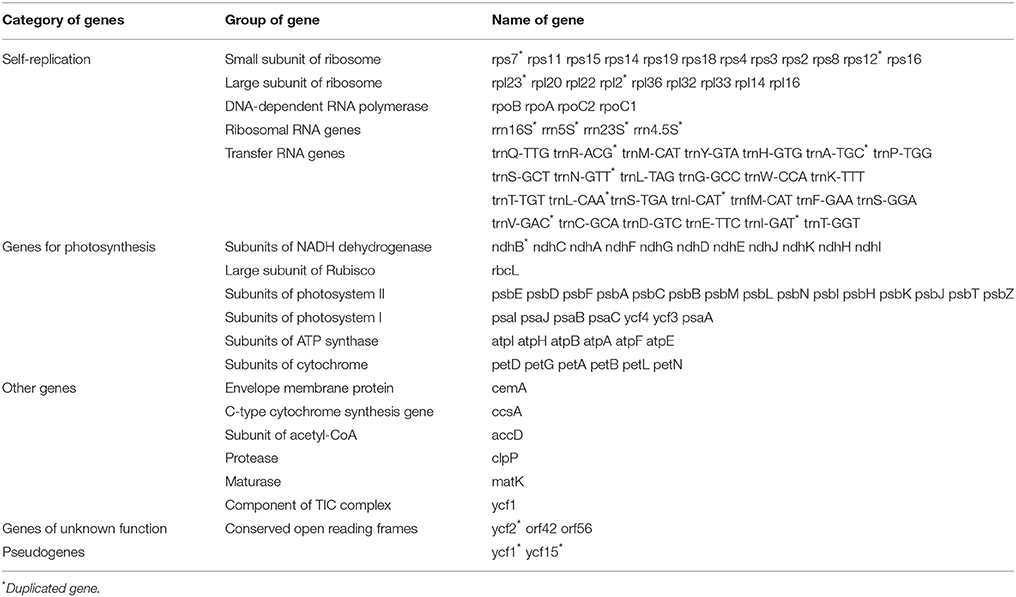
Table 1. Gene contents in A. sinensis chloroplast genome.
Genomic Annotation
The draft genome was drawn using OGDRAW v1.2 (Figure 1). The single collapsed IR contig was separated into two repeat regions. Assembly of the two IRs and LSC and SSC contigs covered the complete sequence without gaps. The positions of all genes identified in the cp genome and functional categorization of these genes are presented in Figure 1. The A. sinensis cp genome was 159,565 bp long with a typical quadripartite structure. A total of 113 functional genes were identified, which comprised 82 protein-coding genes, 27 tRNA genes, and 4 rRNA genes (Table 1). Comparing to the genes in other species (Figure S2), little change was found in gene structure. The very low level of recombination was also reported in the cp genome of land plant (Provan et al., 2001; Ravi et al., 2008). Among the 82 protein-coding genes, 75 were single-copy genes, and 7 were duplicates. Among the 31 RNA genes, 20 were unique, and 11 were duplicates. Among the 113 unique genes, 9 genes contained 1 intron (7 protein-coding and 2 tRNA genes), and 1 gene (ycf3) contained 2 introns (Table S3). The ycf3 gene was similar to those in Globe artichoke and Metasequoia glyptostroboides (Chen et al., 2015; Curci et al., 2015). Out of the 10 genes with introns, 3 protein-coding genes were located in the LSC, 1 in the SSC, and 6 (4 protein-coding genes and 2 tRNAs) in the IR region. The ndhA gene presented the largest intron (1148 bp). In addition, ndhB and rpl2 were identified as duplicate genes.
SSR Analysis
SSRs consist of 1–6 nucleotide repeat units, which are also known as microsatellites and short tandem repeats (Chen et al., 2006). SSRs are important in plant typing (Yang et al., 2011; Xue et al., 2012) and widely used for genetic molecular markers in population genetics (Doorduin et al., 2011; He et al., 2012). A total of 45 SSR regions were identified using the microsatellite identification tool (MISA) in A. sinensis cp genome (Table 2), accounting for 499 bp of the total sequence (0.3%), and 37 SSRs were only composed of A or T bases. Two SSRs were composed of C bases, and six SSRs were composed of dinucleotide (AT/TA/TC) repeats. Therefore, SSRs in A. sinensis cp genome were rich in AT. Poly(A)/(T) had been reported to exhibit higher proportion relative to poly(G)/(C) in many plant families (Kumar et al., 2009; Melotto-Passarin et al., 2011; Nie et al., 2012; Martin et al., 2013). Among these SSRs, 36 SSRs were located in noncoding sections of the LSC/SSC region, and 9 SSRs in protein-coding genes (rpoC2, rpoB, psbF, cemA, psbN, rps19, and ycf1). No tri- or tetra-nucleotide repeats over 15 bp long were found. The SSRs identified in this study may provide a new perspective to refine the phylogeny and elucidate the origin of cultivars.
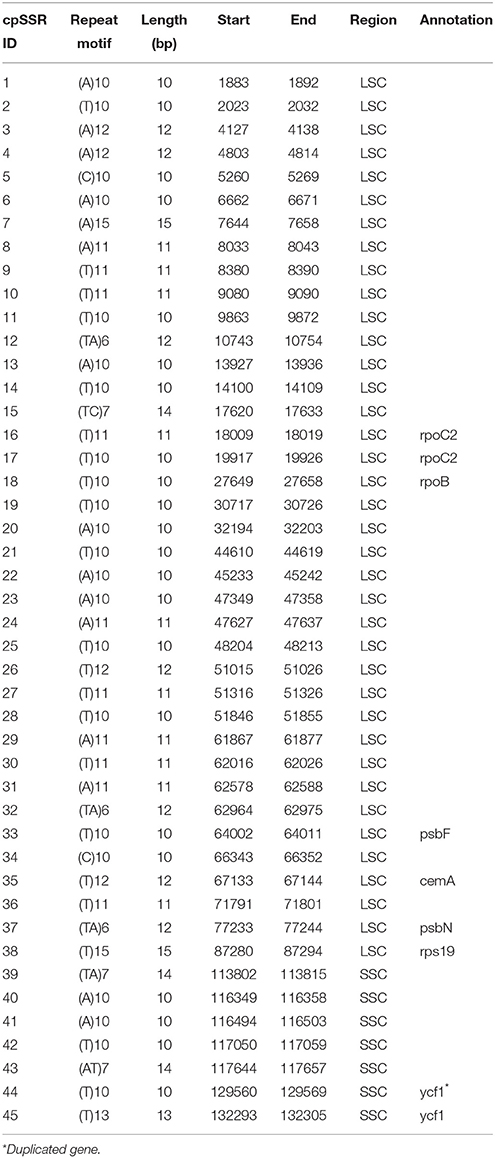
Table 2. Simple sequence repeats in A. sinensis chloroplast genome.
Large Repeat Analysis
Large repeat sequences showed repeats with length of ≥30 bp each. Sixty pairs of large repeat sequences with sequence identity of >90% were found in the A. sinensis cp genomes (Table 3). The repeats ranged from 30 to 600 bp in length and were repeated twice. A total of 33 large repeat sequences were located in protein-coding genes (e.g., ycf1 and ycf2), and 27 large repeat sequences were located in the intergenic regions. Numerous repeated sequences were identified in cp genomes, particularly in the intergenic spacer regions, and have been reported in several angiosperm lineages (Yang et al., 2013).
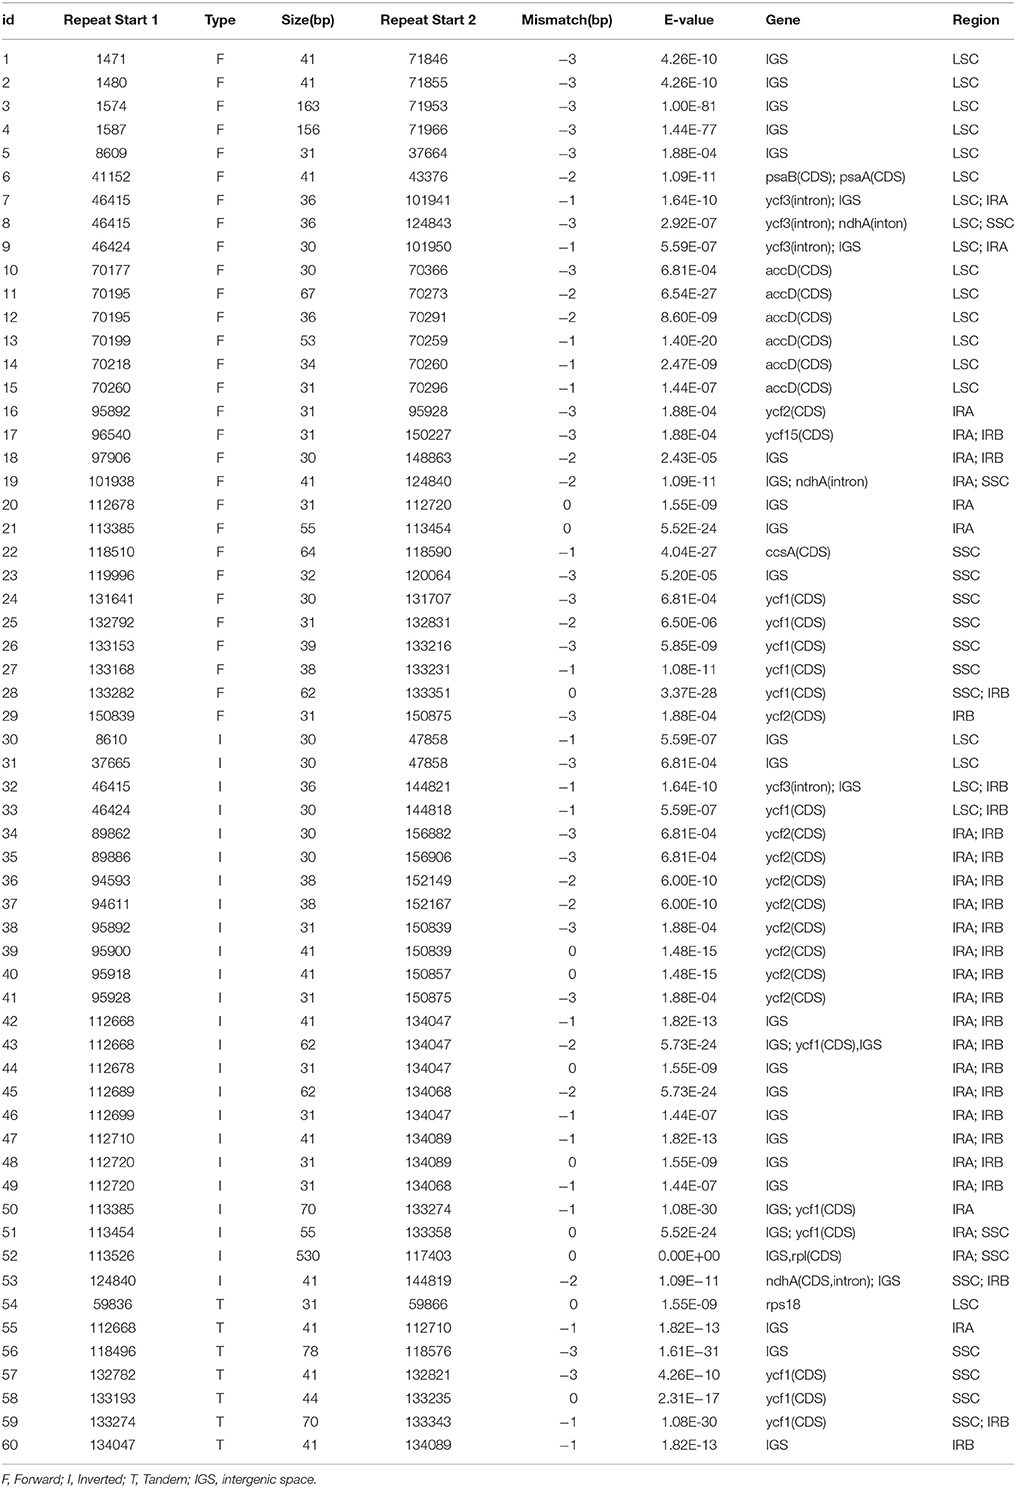
Table 3. Long repeat sequences in A. sinensis chloroplast genome.
Codon Usage
Most protein-coding genes in these basal eudicots employ the standard ATG as the initiator codon. However, ATA, ATC, TTG, and ATT are also used as alternatives to ATG as the start codon. Among the A. sinensis cp protein-coding genes, nine genes were used alternatively to ATG as the start codon as follows: ATA for atpF; ATT for ycf1 and petB; ATC for rpl16; GTG for rps8, psbC, and ndhD; and TTG for ndhA and rpoC1. In the N. tabacum cp genome, GTG was used as start codon for rps19, psbC, and ycf15, whereas ACG was used for psbL and ndhD (Sugiura et al., 1998). ACG and GTG were used as start codon for rpl2 and rps19, as reported in Oryza sativa (Liu and Xue, 2004).
Furthermore, the codon usage patterns of the 82 distinct cp protein-coding genes in A. sinensis were examined. All the protein-coding genes were composed of 26,160 codons. Interestingly, as synonymous codons, almost each of these codons contained half synonymous codon, which ended with A or T with high RSCU values, and the other half ended with C or G with low RSCU values (Table S4). These codon usage patterns may be driven by the composition bias of the high proportion of A/T similar to those of other reported cp genomes (Raubeson et al., 2007; Delannoy et al., 2011) and mitochondrial genomes (Barth and Berendonk, 2011).
Figure 2 shows that the RSCU value increased with the number of codons that code a particular amino acid. The high RSCU value was probably attributed to the function of the amino acid or the structure of the peptide to avoid error in transcription.
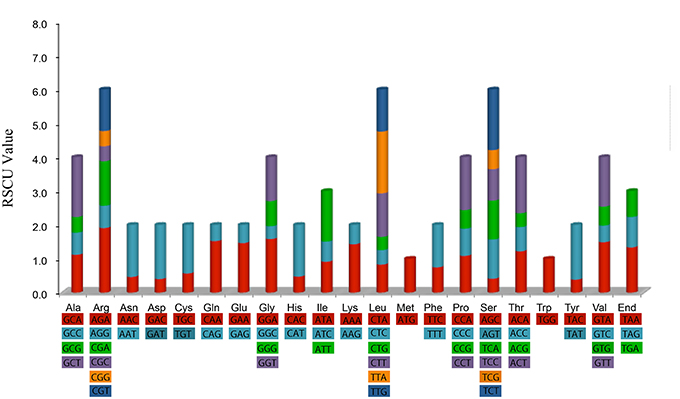
Figure 2. Codon content of 20 amino acid and stop codon of 82 coding genes of Aquilaria sinensis chloroplast genome. Color of the histogram is corresponding to the color of codons.
Statistical analyses of the distributions and visualization of codon usage in the form of heatmaps of 28 species of Angiosperms (Figure 3) showed that approximately half of the codons were not frequently used. These codons were denoted in blue, which indicated RSCU value of <1 and weak codon bias. Almost two-thirds of all the codons with high RSCU values ended with purine (A/T). Thus, we hypothesized that the codon in A. sinensis cp genome bias ended with A/T. This phenomenon was also found in many other plant and algal lineages (Morton, 1998). The distribution of codon usage in A. sinensis cp genome was most similar to the codon usage in Gonystylus bancanus cp genome.
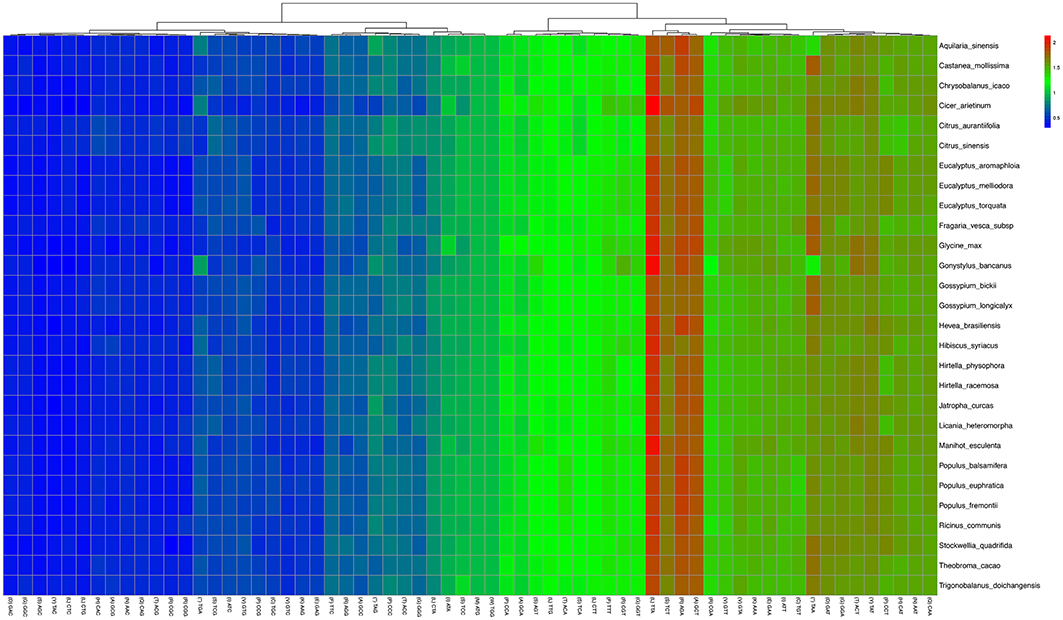
Figure 3. Codon distribution of all merged protein-coding genes for all considered species. Color key: higher red values indicate higher RSCU value and lower blue values indicate lower RSCU value; A Hierarchical clustering (Lance and Williams, 1967; average linkage method) was performed for codon patterns (x-axis).
Phylogenetic Analyses
cp genomes are significant in the research of phylogenetics, evolution, and molecular systematics. Numerous analytical studies have been conducted in the past decade to address phylogenetic issues at deep nodes by comparing multiple protein-coding genes (Lemieux et al., 2000; Delas Rivas et al., 2002; Moore et al., 2010) and complete sequences in cp genomes (Goremykin et al., 2004; Moore et al., 2007). These studies enhanced the understanding about enigmatic evolutionary relationships among Angiosperms. We examined the phylogenetic position of A. sinensis and relationships within Angiosperms. We previously selected 82 protein-coding genes commonly present in cp genomes of 29 species, including the A. sinensis cp genome sequenced in the current study. ML and BI nucleic acid analyses were performed, and the results are summarized in Figures 4, 5. Similar phylogenetic topologies were found in the ML and BI nucleic acid analyses. Bootstrap values were very high, and 28 of 29 nodes with 100% bootstrap values were found using ML. Up to 25 out of the 29 nodes with bootstrap values of ≥99% were found using BI. A. sinensis and G. bancanus were grouped in Malvales, with 100% bootstrap values in the ML and BI phylogenetic trees. Similarly, in the ML protein analyses, 27 of the 29 nodes yielded bootstrap values of 100%, and 24 nodes reached ≥99% in the BI. ML and BI protein analyses showed that A. sinensis can also be grouped with G. bancanus within Malvales. The phylogenetic results strongly support the position of A.sinensis within the Malvales order. However, the results were inconsistent because A.sinensis was classified into Myrtales according to the traditional morphological classification of China.
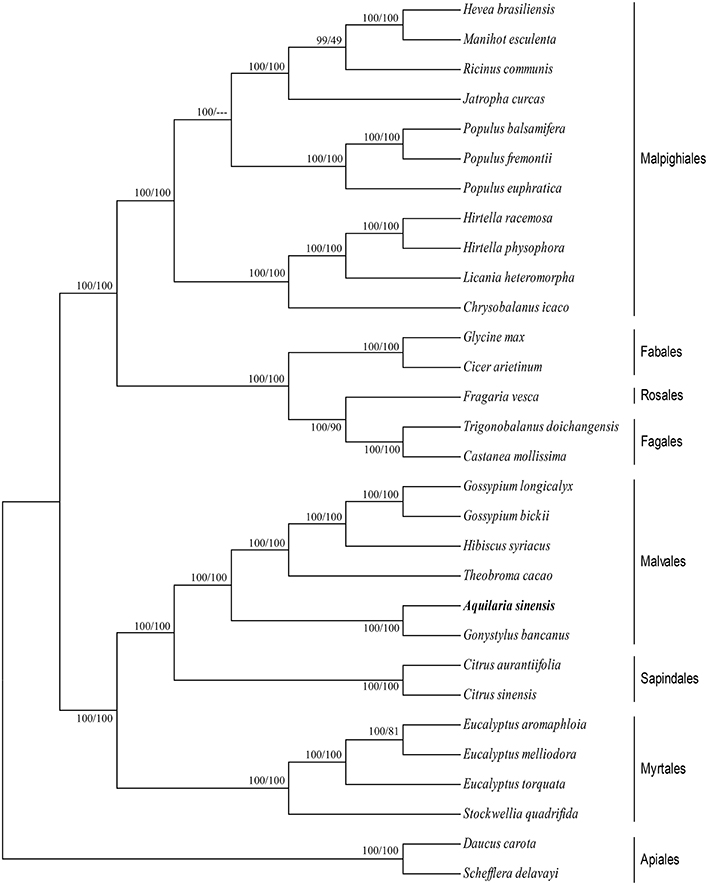
Figure 4. Phylogenetic position of A.sinensis inferred by Maximum likelihood (ML) and Bayesian inference (BI) nucleic acid analyses of 82 protein-coding genes. The first number above the lines indicates the BI bootstrap value of the nucleic acid analysis for each clade, whereas the second number indicates the ML bootstrap value. The position of A.sinensisis shown in boldface.
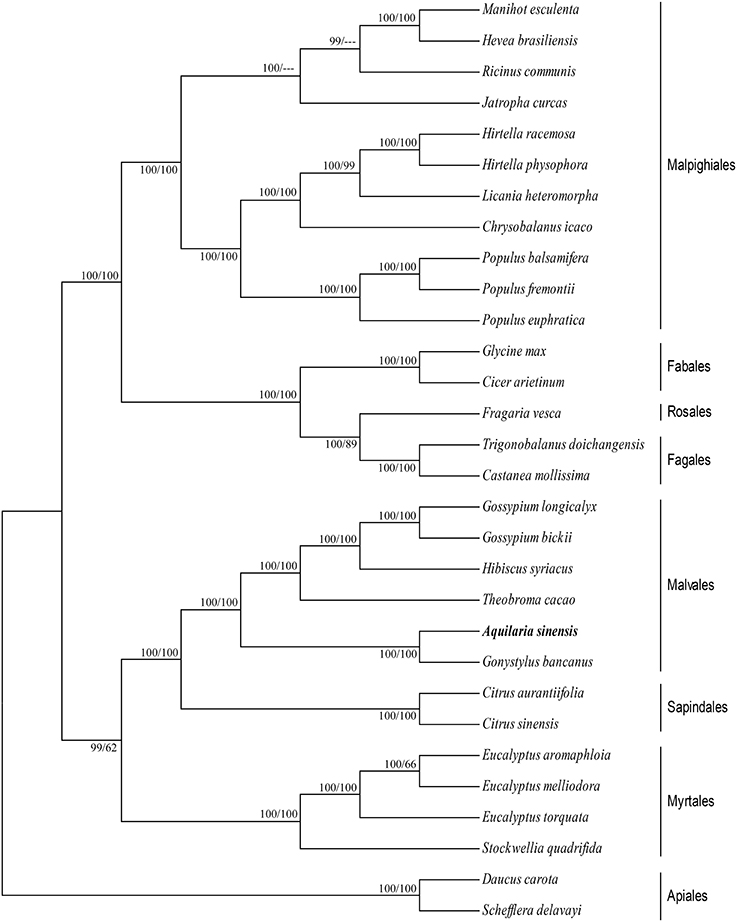
Figure 5. Phylogenetic position of A.sinensis inferred by ML and BI protein analyses of 82 protein-coding genes. The first number above the lines indicates the BI bootstrap value of the protein analysis for each clade, whereas the second number indicates the ML bootstrap value. The position of A.sinensis is shown in boldface.
CCT Map
Five available cp genomes of Malvales were compared with the A.sinensis cp genome by using CCT (Figure 6). The sequence identity between the A.sinensis cp and other representatives of the Malvales was analyzed. The results showed that G. bancanus cp genome achieved the highest sequence similarity (>90%), which was consistent with the result of the phylogenetic analysis. The highest similar region across all five cp genomes occurred in the IR region. LSC and SSC regions were less conservative; thus, many regions with identity results were lower than 90%, such as the ycf1 gene in the SSC region and intergenic space regions. This evolutionary conserved feature was reported in the IR region in cp (Curtis and Clegg, 1984; Palmer, 1985).
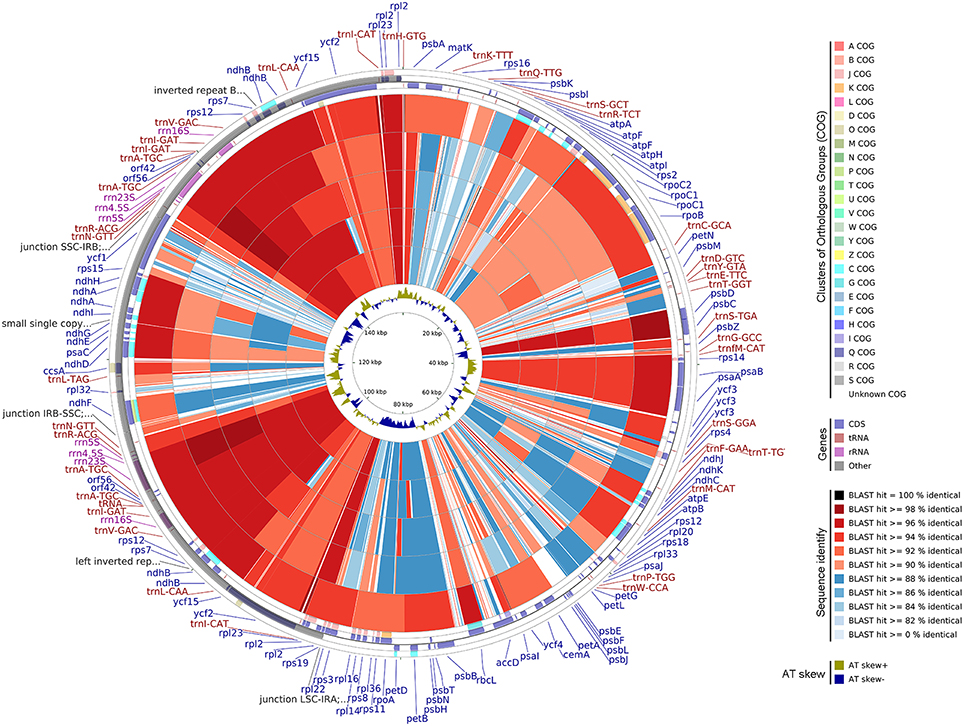
Figure 6. Genome comparison of five CP genomes of Malvales to A.sinensis. From the outer to the inner color ring: Gonystylus bancanus, Theobroma cacao, Gossypium longicalyx, Hibiscus syriacus, and Gossypium bickii. BLAST was used to align other genomes to A. sinensis, and the results are shown with a circular map. The color codes are based on the similarity score, that is, dark red and blue depict similarity scores of 100%, above 90%, and below 90%, respectively. The four outer narrow rings are the protein-coding gene positions based on the A. sinensis cp genome. The color codes are based on Clusters of Orthologous Groups. The innermost ring is AT skew in the A. sinensis. AT skew+ indicate A>T, AT skew- indicate A < T.
Conclusions
The complete cp sequence of traditional medicinal plant A. sinensis was assembled, annotated, and analyzed. The cp genome consisted of one LSC, one SSC, and two IR regions. A total of 45 polymorphic SSR loci and 60 pairs of large repeats were identified in the A. sinensis cp genome. These repeat motifs can be selected to develop markers and conduct phylogenetic analysis. Both ML and BI phylogenetic analyses strongly supported the position of A. sinensis as a sister to G. bancanus within the Malvales order. The distribution of codon usage in A. sinensis cp genome was most similar to that in G. bancanus cp genome. CCT analytical results also indicated that the A. sinensis cp genome achieved higher sequence similarity than the G. bancanus cp genome. However, the traditional morphological classification of China classified A. sinensis into Myrtales. The data obtained in this study will be beneficial for further investigations on A. sinensis. Moreover, the results will help expand the understanding about the evolutionary history of the Malvales order, particularly regarding the role of A. sinensis in plant systematics and evolution.
Author Contributions
YW designed and performed the experiment as well as drafted the manuscript. XC and SP conceived the study and revised the manuscript. DZ, XJ, WM, and HD prepared the samples and analyzed part of the data. All the authors have read and approved the final manuscript.
Conflict of Interest Statement
The authors declare that the research was conducted in the absence of any commercial or financial relationships that could be construed as a potential conflict of interest.
Acknowledgments
This research was supported by the Natural Science Foundation of Hainan of China (No. 314115) and the National Nonprofit Institute Research Grant of CATAS-ITBB (ITBB140201 and ITBB2015ZD05).
Supplementary Material
The Supplementary Material for this article can be found online at: http://journal.frontiersin.org/article/10.3389/fpls.2016.00280
Figure S1. Coverage depth of contigs of A. sinensis CP genome.
Figure S2. Comparisons of CP genomic structure among five land plants, including A. sinensis, using Easyfig. The arrowheads indicate genes with their orientations and positions. The orange arrows indicate the coding regions of genes. Gray ligature indicate positions and similarity of the genes of five land plants.
Table S1. List of CP genomes used as reference to map to contigs.
Table S2. Summary of A. sinensis chloroplast genome characteristics.
Table S3. The genes in the A. sinensis chloroplast genome with introns.
Table S4. Relative synonymous codon usage (RSCU) for the A. sinensis chloroplast genome.
References
Abe, T., Ikemura, T., Sugahara, J., Kanai, A., Ohara, Y., Uehara, H., et al. (2011). tRNADB-CE 2011: tRNA gene database curated manually by experts. Nucleic Acids Res. 39, 210–213. doi: 10.1093/nar/gkq1007
Awasthi, P., Ahmad, I., Gandhi, S. G., and Bedi, Y. S. (2012). Development of chloroplast microsatellite markers for phylogenetic analysis in Brassicaceae. Acta Biol. Hung. 63, 463–473. doi: 10.1556/ABiol.63.2012.4.5
Barth, D., and Berendonk, T. U. (2011). The mitochondrial genome sequence of the ciliate Paramecium caudatum reveals a shift in nucleotide composition and codon usage within the genus Paramecium. BMC Genomics 12:272. doi: 10.1186/1471-2164-12-272
Bedbrook, J. R., and Bogorad, L. (1976). Endonuclease recognition sites mapped on Zea mays chloroplast DNA. Proc. Natl. Acad. Sci. U.S.A. 73, 4309–4313. doi: 10.1073/pnas.73.12.4309
Chen, C., Zhou, P., Choi, Y. A., Huang, S., and Gmitter, F. G. Jr. (2006). Mining and characterizing microsatellites from citrus ESTs. Theor. Appl. Genet. 112, 1248–1257. doi: 10.1007/s00122-006-0226-1
Chen, H., and Melis, A. (2013). Marker-free genetic engineering of the chloroplast in the green microalga Chlamydomonas reinhardtii. Plant Biotechnol. J. 11, 818–828. doi: 10.1111/pbi.12073
Chen, J. H., Hao, Z. D., Xu, H. B., Yang, L. M., Liu, G. X., Sheng, Y., et al. (2015). The complete chloroplast genome sequence of the relict woody plant Metasequoia glyptostroboides Huet Cheng. Front. Plant. Sci. 6:447. doi: 10.3389/fpls.2015.00447
Cheng, J., Zeng, X., Ren, G., and Liu, Z. (2013). CGAP: a new comprehensive platform for the comparative analysis of chloroplast genomes. BMC Bioinformatics 14:95. doi: 10.1186/1471-2105-14-95
China pharmacopoeia Committee (2010). The Pharmacopoeia of People's Republic of China. Beijing: Chemical Industry Press.
Ching, P. L., Jen, P. H., Chung, S., Wu, Chih, Y. H., and Shu, M. C. (2010). Comparative chloroplast genomics reveals the evolution of Pinaceae Genera and subfamilies. Genome Biol. Evol. 2, 504–517. doi: 10.1093/gbe/evq036
Corriveau, J. L., and Coleman, A. W. (1988). Rapid screening method to detect potential biparental inheritance of plastid DNA and results for over 200 angiosperm species. Am. J. Bot. 75, 1443–1458. doi: 10.2307/2444695
Curci, P. L., De Paola, D., Danzi, D., Vendramin, G. G., and Sonnante, G. (2015). Complete Chloroplast genome of the multifunctional crop Globe Artichoke and comparison with other Asteraceae. PLoS ONE 10:e0120589. doi: 10.1371/journal.pone.0120589
Curtis, S. E., and Clegg, M. T. (1984). Molecular evolution of chloroplast DNA sequences. Mol. Biol. Evol. 1, 291–301.
Delannoy, E., Fujii, S., Des Francs-Small, C. C., Brundrett, M., and Small, I. (2011). Rampant gene loss in the underground orchid Rhizanthella gardneri highlights evolutionary constraints on plastid genomes. Mol. Biol. Evol. 28, 2077–2086. doi: 10.1093/molbev/msr028
Delas Rivas, J., Lozano, J. J., and Ortiz, A. R. (2002). Comparative analysis of chloroplast genomes: functional annotation, genome-based phylogeny, and deduced evolutionary patterns. Genome Res. 12, 567–583. doi: 10.1101/gr.209402
Doorduin, L., Gravendeel, B., Lammers, Y., Ariyurek, Y., Chin-A-Woeng, T., and Vrieling, K. (2011). The complete chloroplast genome of 17 individuals of pest species Jacobaeavulgaris: SNPs,microsatellites and barcoding markers for population and phylogenetic studies. DNA Res. 18, 93–105. doi: 10.1093/dnares/dsr002
Gaudeul, M., Gardner, M. F., Thomas, P., Ennos, R. A., and Hollingsworth, P. M. (2014). Evolutionary dynamics of emblematic Araucaria species (Araucariaceae) in New Caledonia: nuclear and chloroplast markers suggest recent diversification, introgression, and a tight link between genetics and geography within species. BMC Evol. Biol. 14:171. doi: 10.1186/s12862-014-0171-6
Goremykin, V. V., Hirsch-Ernst, K. I., Wolfl, S., and Hellwig, F. H. (2004). The chloroplast genome of Nymphaea alba: whole-genome analyses and the problem of identifying the most basal angiosperm. Mol. Biol. Evol. 21, 1445–1454. doi: 10.1093/molbev/msh147
Grant, J. R., and Stothard, P. (2008). The CGView Server: a comparative genomics tool for circular genomes. Nucleic. Acids. Res. 36 (Web Server issue), W181–W184. doi: 10.1093/nar/gkn179
Griffiths-Jones, S., Bateman, A., Marshall, M., Khanna, A., and Eddy, S. R. (2003). Rfam: an RNA family database. Nucleic Acids Res. 31, 439–441. doi: 10.1093/nar/gkg006
He, S., Wang, Y., Volis, S., Li, D., and Yi, T. (2012). Genetic diversity and population structure: implications for conservation of wildsoybean (Glycinesoja Sieb.et Zucc)based on nuclear and chloroplast microsatellite variation. Int. J. Mol. Sci. 13, 12608–12628. doi: 10.3390/ijms131012608
Jheng, C., Chen, T., Lin, J., Chen, T., Wu, W., and Chang, C. (2012). The comparative chloroplast genomic analysis of photosynthetic orchids and developing DNA markers to distinguish Phalaenopsis orchids. Plant Sci. 190, 62–73. doi: 10.1016/j.plantsci.2012.04.001
Kumano, M. (1986). Clone bank of the tobacco (Nicotiana tabacum) chloroplast genome as a set of overlapping restriction endonuclease fragments: mapping of eleven ribosomal protein genes. Plant Sci. 44, 211–216. doi: 10.1016/0168-9452(86)90093-2
Kumar, S., Hahn, F. M., McMahan, C. M., Cornish, K., and Whalen, M. C. (2009). Comparative analysis of the complete sequence of the plastid genome of Parthenium argentatum and identification of DNA barcodes to differentiate Parthenium species and lines. BMC Plant Biol. 9:131. doi: 10.1186/1471-2229-9-131
Lance, G. N., and Williams, W. T. (1967). A general theory of classificatory sorting strategies 1. hierarchical systems. Comput. J. 9, 373–380. doi: 10.1093/comjnl/9.4.373
Lartillot, N., Lepage, T., and Blanquart, S. (2009). PhyloBayes 3: a Bayesian software package for phylogenetic reconstruction and molecular dating. Bioinformatics. 25, 2286–2288. doi: 10.1093/bioinformatics/btp368
Lemieux, C., Otis, C., and Turmel, M. (2000). Ancestral chloroplast genome in Mesostigma viride reveals an early branch of green plant evolution. Nature 403, 649–652. doi: 10.1038/35001059
Li, H., and Durbin, R. (2009). Fast and accurate short read alignment with Burrows-Wheeler transform. Bioinformatics 25, 1754–1760. doi: 10.1093/bioinformatics/btp324
Liu, Q. B., and Xue, Q. Z. (2004). Codon usage in the chloroplast genome of rice (Oryza sativa L. ssp. japonica). Acta Agron. Sin. 30, 1220–1224.
Lohse, M., Drechsel, O., and Bock, R. (2007). Organellar Genome DRAW (OGDRAW): a tool for the easy generation of high-quality custom graphical maps of plastid and mitochondrial genomes. Curr. Genet. 52, 267–274. doi: 10.1007/s00294-007-0161-y
Luo, R., Liu, B., Xie, Y., Li, Z., Huang, W., Yuan, J., et al. (2012). SOAPdenovo2: an empirically improved memory-efficient short-read de novo assembler. Gigascience 1:18. doi: 10.1186/2047-217x-1-18
Martin, G., Baurens, F. C., Cardi, C., Aury, J. M., and D'Hont, A. (2013). The complete chloroplast genome of banana (Musa acuminata, Zingiberales): insight into plastid monocotyledon evolution. PLoS ONE 8:e67350. doi: 10.1371/journal.pone.0067350
Melotto-Passarin, D. M., Tambarussi, E. V., Dressano, K., De Martin, V. F., and Carrer, H. (2011). Characterization of chloroplast DNA microsatellites from Saccharum spp and related species. Genet. Mol. Res. 10, 2024–2033. doi: 10.4238/vol10-3gmr1019
Moore, M. J., Bell, C. D., Soltis, P. S., and Soltis, D. E. (2007). Using plastid genome-scale data to resolve enigmatic relationships among basal angiosperms. Proc. Natl. Acad. Sci. U.S.A. 104, 19363–19368. doi: 10.1073/pnas.0708072104
Moore, M. J., Soltis, P. S., Bell, C. D., Burleigh, J. G., and Soltis, D. E. (2010). Phylogenetic analysis of 83 plastid genes further resolves the early diversification of eudicots. Proc. Natl. Acad. Sci. U.S.A. 107, 4623–4628. doi: 10.1073/pnas.0907801107
Morton, B. R. (1998). Selection on the codon bias of chloroplast and cyanelle genes indifferent plant and algal lineages. J. Mol. Evol. 46, 449–459. doi: 10.1007/PL00006325
Neuhaus, H. E., and Emes, M. J. (2000). Nonphoto synthetic metabolism in plastids. Annu. Rev. Plant Physiol. Plant Mol. Biol. 51, 111–140. doi: 10.1146/annurev.arplant.51.1.111
Nie, X., Lv, S., Zhang, Y., Du, X., Wang, L., Biradar, S. S., et al. (2012). Complete chloroplast genome sequence of a major invasive species, crofton weed (Ageratinaadenophora). PLoS ONE 7:e36869. doi: 10.1371/journal.pone.0036869
Palmer, J. D. (1985). Comparative organization of chloroplast genomes. Annu. Rev. Genet. 19, 325–354. doi: 10.1146/annurev.ge.19.120185.001545
Palmer, J. D. (1991). “Plastid chromosomes: structure and evolution,” in Molecular Biology of Plastids, ed L. Bogorad (San Diego, CA: Academic Press), 5–53.
Posada, D. (2008). jModelTest: phylogenetic model averaging. Mol. Biol. Evol. 25, 1253–1256. doi: 10.1093/molbev/msn083
Provan, J., Powell, W., and Hollingsworth, P. M. (2001). Chloroplast microsatellites: new tools for studies in plant ecology and evolution. Trends Ecol. Evol. 16, 142–147. doi: 10.1016/S0169-5347(00)02097-8
Qian, J., Song, J., Gao, H., Zhu, Y., Xu, J., Pang, X., et al. (2013). The complete chloroplast genome sequence of the medicinal plant Salvia miltiorrhiza. PLoS ONE 8:e57607. doi: 10.1371/journal.pone.0057607
Raubeson, L. A., and Jansen, R. K. (2005). “Chloroplast genomes of plants,” in Plant Diversity and Evolution: Genotypic and Phenotypic Variation in Higher Plants, ed R. J. Henry (Cambridge, MA: CABI), 45–68.
Raubeson, L. A., Peery, R., Chumley, T. W., Dziubek, C., Fourcade, H. M., Boore, J. L., et al. (2007). Comparative chloroplast genomics: analyses including new sequences from the angiosperms Nuphar advena and Ranunculus macranthus. BMC Genomics 8:174. doi: 10.1186/1471-2164-8-174
Ravi, V., Khurana, J. P., Tyagi, A. K., and Khurana, P. (2008). An update on chloroplast genome. Plant Syst. Evol. 271, 101–122. doi: 10.1007/s00606-007-0608-0
Sato, S., Nakamura, Y., Kaneko, T., Asamizu, E., and Tabata, S. (1999). Complete structure of the chloroplast genome of Arabidopsis thaliana. DNAquilaria Res. 6, 283–290. doi: 10.1093/dnares/6.5.283
Schattner, P., Brooks, A. N., and Lowe, T. M. (2005). The tRNAscan-SE, snoscan and snoGPS web servers for the detection of tRNAs and snoRNAs. Nucleic Acids Res. 33, W686–W689. doi: 10.1093/nar/gki366
Sharp, P. M., and Li, W. H. (1987). The codon adaptation index–a measure of directional synonymous codon usage bias, and its potential applications. Nucleic Acids Res. 15, 1281–1295. doi: 10.1093/nar/15.3.1281
Stamatakis, A. (2014). RAxML Version 8: a tool for phylogenetic analysis and post-analysis of large phylogenies. Bioinformatics 30, 1312–1313. doi: 10.1093/bioinformatics/btu033
Steele, P. R., Hertweck, K. L., Mayfield, D., McKain, M. R., Leebens-Mack, J., Pires, J. C., et al. (2012). Quality and quantity of data recovered from massively parallel sequencing: examples in asparagales and poaceae. Am. J. Bot. 99, 330–348. doi: 10.3732/ajb.1100491
Straub, S. C., Parks, M., Weitemier, K., Fishbein, M., Cronn, R. C., and Liston, A. (2012). Navigating the tip of the genomic iceberg: next-generation sequencing for plant systematics. Am. J. Bot. 99, 349–364. doi: 10.3732/ajb.1100335
Sugiura, M., Hirose, T., and Sugita, M. (1998). Evolution and mechanism of translation in chloroplast. Annu. Rev. Genet. 32, 437–459. doi: 10.1146/annurev.genet.32.1.437
Takano, A., and Okada, H. (2011). Phylogenetic relationships among subgenera, species, and varieties of Japanese Salvia L. (Lamiaceae). J. Plant. Res. 124, 245–252. doi: 10.1007/s10265-010-0367-9
Tangphatsornruang, S., Sangsrakru, D., Chanprasert, J., Uthaipaisanwong, P., Yoocha, T., Jomchai, N., et al. (2009). The chloroplast genome sequence of mungbean (Vignaradiata) determined by high-throughput pyrosequencing: structural organization and phylogenetic relationships. DNAquilaria Res. 17, 1–22. doi: 10.1093/dnares/dsp025
Turner, B., Munzinger, J. E. R. O., Duangjai, S., Temsch, E. M., Stockenhuber, R., Barfuss, M. H., et al. (2013). Molecular phylogenetics of New Caledonian Diospyros (Ebenaceae) using plastid and nuclear markers. Mol. Phylogenet. Evol. 69, 740–763. doi: 10.1016/j.ympev.2013.07.002
Wicke, S., Muller, K. F., de Pamphilism, C. W., Quandt, D., Wickett, N. J., Zhang, Y., et al. (2013). Mechanisms of functional and physical genome reduction in photosynthetic and nonphotosynthetic parasitic plants of the broomrape family. Plant Cell. 25, 3711–3725. doi: 10.1105/tpc.113.113373
Wolfe, K. H., Li, W. H., and Sharp, P. M. (1987). Rates of nucleotide substitution vary greatly among plant mitochondrial, chloroplast, and nuclear DNAs. Proc. Natl. Acad. Sci. U.S.A. 84, 9054–9058. doi: 10.1073/pnas.84.24.9054
Wyman, S. K., Jansen, R. K., and Boore, J. L. (2004). Automatic annotation of organellar genomes with DOGMA. Bioinformatics 20, 3252–3255. doi: 10.1093/bioinformatics/bth352
Xue, J., Wang, S., and Zhou, S. L. (2012). Polymorphic chloroplast microsatel- lite loci in Nelumbo (Nelumbonaceae). Am. J. Bot. 99, e240–e244. doi: 10.3732/ajb.1100547
Yang, A. H., Zhang, J. J., Yao, X. H., and Huang, H. W. (2011). Chloroplast microsatellite markers in Liriodendron tulipifera (Magnoliaceae) and cross- species amplification in L.chinense. Am. J. Bot. 98, e123–e126. doi: 10.3732/ajb.1000532
Yang, J. B., Yang, S. X., Li, H. T., Yang, J., and Li, D. Z. (2013). Comparative chloroplast genomes of Camellia species. PLoS ONE 8:e73053. doi: 10.1371/journal.pone.0073053
Keywords: Aquilaria sinensis (lour.) gilg, chloroplast genome, simple-sequence repeat, relative synonymous codon usage, phylogenetic analysis
Citation: Wang Y, Zhan D-F, Jia X, Mei W-L, Dai H-F, Chen X-T and Peng S-Q (2016) Complete Chloroplast Genome Sequence of Aquilaria sinensis (Lour.) Gilg and Evolution Analysis within the Malvales Order. Front. Plant Sci. 7:280. doi: 10.3389/fpls.2016.00280
Received: 03 November 2015; Accepted: 21 February 2016;
Published: 08 March 2016.
Edited by:
Daniel Pinero, Universidad Nacional Autónoma de México, MéxicoReviewed by:
Mehboob-ur-Rahman, National Institute for Biotechnology & Genetic Engineering, PakistanShichen Wang, Kansas State University, USA
Copyright © 2016 Wang, Zhan, Jia, Mei, Dai, Chen and Peng. This is an open-access article distributed under the terms of the Creative Commons Attribution License (CC BY). The use, distribution or reproduction in other forums is permitted, provided the original author(s) or licensor are credited and that the original publication in this journal is cited, in accordance with accepted academic practice. No use, distribution or reproduction is permitted which does not comply with these terms.
*Correspondence: Xiong-Ting Chen, chenxiongting@itbb.org.cn;
Shi-Qing Peng, pengshiqing@itbb.org.cn