 Shuai Qi
 Liwen Yang
 Xiaohui Wen
 Yan Hong
 Xuebin Song
 Mengmeng Zhang
 Silan Dai
- College of Landscape Architecture, Beijing Forestry University, Beijing, China
Quantitative real-time PCR (qPCR) is a popular and powerful tool used to understand the molecular mechanisms of flower development. However, the accuracy of this approach depends on the stability of reference genes. The capitulum of chrysanthemums is very special, which is consisting of ray florets and disc florets. There are obvious differences between the two types of florets in symmetry, gender, histological structure, and function. Furthermore, the ray florets have various shapes. The objective of present study was to identify the stable reference genes in Chrysanthemum morifolium and Chrysanthemum lavandulifolium during the process of flower development. In this study, nine candidate reference genes were selected and evaluated for their expression stability acrosssamples during the process of flower development, and their stability was validated by four different algorithms (Bestkeeper, NormFinder, GeNorm, and Ref-finder). SAND (SAND family protein) was found to be the most stably expressed gene in all samples or different tissues during the process of C. lavandulifolium development. Both SAND and PGK (phosphoglycerate kinase) performed most stable in Chinese large-flowered chrysanthemum cultivars, and PGK was the best in potted chrysanthemums. There were differences in best reference genes among varieties as the genetic background of them were complex. These studies provide guidance for selecting reference genes for analyzing the expression pattern of floral development genes in chrysanthemums.
Introduction
Asteraceae is one of the largest families of flowering plants (Tähtiharju et al., 2012). Members of this family have typical capitulum, which is consists of ray florets and disc florets. Ray florets are highly specialized in pollinator attraction and disc florets assume the reproductive function. The combination of two types florets improve the chances of reproductive success and are more evolved than a single flower (Lane, 1994; Funk et al., 2009). In addition, there are obvious differences between the two types of florets in symmetry, gender, histological structure, and function. Chrysanthemum (Chrysanthemum × morifolium Ramat.), one of the 10 most well-known Chinese traditional flowers, is composed of the most abundant and various cultivars among the horticultural plants around the world (Dai et al., 2005). The petal types of chrysanthemums were classified into five groups containing flat, tubular, spoon, abnormal, and anemone (Chen, 2001). The diversity of the flower shape is determined by the numbers of the two types of florets and the variation of petal types. The regulatory mechanism controlling chrysanthemum flower shape is still not clear yet. Hence, analysis the expression patterns of key genes involved in the flower development of chrysanthemums will help us to understand the mechanism of flower development and promote molecular breeding in chrysanthemum flower shape. Chrysanthemums are classified as a hybrid cultigen complex after a long period of inter-specific hybridization and artificial selection (Chen, 1957, 1984; Dai et al., 2002). We then selected Chrysanthemum lavandulifolium (Fisch. ex Trautv.) Makino, one of the original species of C. morifolium, which has simple genetic background than most composite plants (Zhang and Dai, 2009), as a model plant for molecular biological research on chrysanthemums.
The conserved function of genes in flower development has provided some clues. Quantitative real-time RT-PCR (qPCR) is a reliable technique for gene expression analysis that is used in many research fields because of its sensitivity, accuracy, specificity, and high throughput (VanGuilder et al., 2008; Bustin et al., 2009; Artico et al., 2010). It has been widely used in researches on flower development in higher plants (Artico et al., 2010; Mallona et al., 2010). It is necessary to select reliable reference genes to normalize RT-qPCR analyses. An improper reference gene can lead to misinterpretation of expression data and thus generate incorrect results (Dheda et al., 2005). Many studies have been conducted to evaluate the stability of potential reference genes in plants, such as Arabidopsis thaliana (Czechowski et al., 2005; Remans et al., 2008; Dekkers et al., 2012), rice (Kim et al., 2003; Jain et al., 2006), wheat (Paolacci et al., 2009), tobacco (Schmidt and Delaney, 2010), and soybean (Jian et al., 2008; Libault et al., 2008; Hu et al., 2009; Kulcheski et al., 2010). A few studies have been reported in composite plants. MTP (Metalloprotease), SKIP16 (SKP1/ASK-interacting protein 16), and PGK were the most stable genes in different tissues at various developmental stages and in leaves, with varied photoperiodic treatments in C. lavandulifolium (Fu et al., 2013). F-box (F-box protein) and PP2A (protein phosphatase 2A) were the most stable genes in three flower color lines at five floral developmental stages and at two light conditions in C. × morifolium “Reagan” (Hong and Dai, 2015). EF-1a (elongation factor 1α) and PGK were the best combination for four taxa including diploid level and polyploid level in C. nankingense and C. zawadskii (Wang et al., 2015). TIP41 (TIP41 like protein) was shown to be the most stable gene in Cichorium intybus (Delporte et al., 2015). In chrysanthemum cultivar “Zhongshanzigui,” EF1a performed well for aphid infested plants but poorly for waterlogged ones. Furthermore, PP2Acs performed best during heat and waterlogging stress, but was the worst during aphid infestation (Gu et al., 2011). Nevertheless, there was limited information available concerning reference genes for flower shape in chrysanthemums.
Flower development in higher plants has fascinated researchers for a long time. It is one of the 125 most compelling puzzles and questions facing scientists today (Miller, 2005). We aimed to identify potential reference genes suitable for transcript normalization in different florets and ray florets of different petal types during chrysanthemum flower development and then validate their stability. These reference genes will enable more accurate and reliable RT-qPCR normalization for gene expression studies in chrysanthemum flower development.
Materials and Methods
Plant Materials
Organs of different developmental stages were collected from C. lavandulifolium (set1), four Chinese large-flowered chrysanthemum cultivars (set2), and three chrysanthemum hybrids of potted chrysanthemum (set3).
C. lavandulifolium
Seeds of C. lavandulifolium were collected from the campus of Peking University. They were germinated in plugs filled with vermiculite medium for 30 days and transferred to 9 × 9 cm flowerpots with turf and vermiculite (1/1 v/v) media under LD conditions (16 h light/8 h dark). At the end of their juvenile period, the seedlings with 14 leaves were placed in short-day (SD) conditions (12 h light/12 h dark). The room temperature was kept at 22 ± 1°C and relative air humidity of 60%.
The development of the flower was divided into six different developmental stages (Figure 1, Table 1). The development of the ray floret was divided into two stages, and the development of the disc floret was divided into three stages as their development were not synchronized (Figure 1, Table 1).
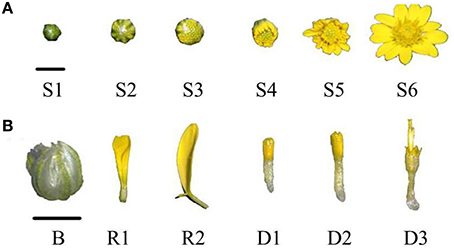
Figure 1. The definitions of the stages of C. lavandulifolium flower development. (A) Six stages of C. lavandulifolium capitulum development, (B) stages of C. lavandulifolium flower organ development. Bar = 0.5 cm.
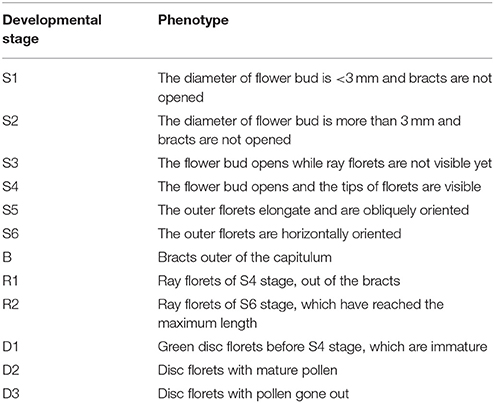
Table 1. The phenotype of C. lavandulifolium flower developmental stages.
C. morifolium
We selected four chrysanthemum varieties (Chinese large-flowered chrysanthemum cultivars) and three chrysanthemum hybrids (potted chrysanthemum), which covers four typical petal types (Figure 2, Tables 2, 3). They can be used to study gene expression of two florets and the different petal types. These materials were obtained from the Chrysanthemum Nursery of Beijing Forestry University, Beijing, China. Robust cutting slips were cut from mother plants and stuck in plugs (turf: vermiculite = 3:1, v/v) in April. Seedlings with strong roots were transferred to pots after 25 days. Water, fertilizer, insects, and disease control were supplied during this period. The whole process of growth was in natural conditions and chrysanthemums blossomed in October.
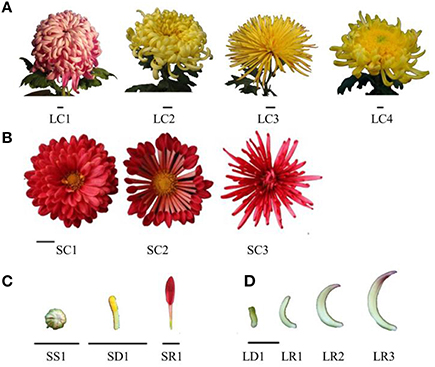
Figure 2. Inflorescence of four chrysanthemum cultivars and three chrysanthemum hybrids. (A) Chinese large-flowered chrysanthemum cultivars of four-petal type; (B) potted chrysanthemum of three petal types; (C,D) sample of chrysanthemum flower. Bar = 1 cm.
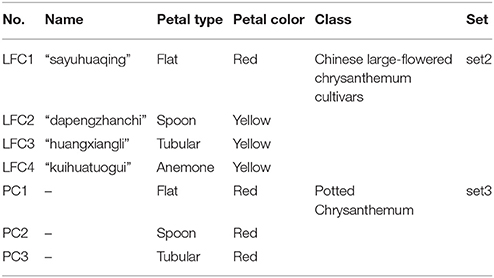
Table 2. Parameters of four chrysanthemum cultivars and three chrysanthemum hybrids.
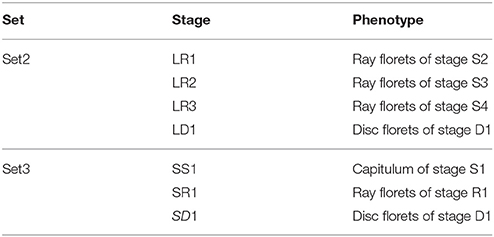
Table 3. The phenotype of the samples of chrysanthemum flower.
RNA Isolation and cDNA Synthesis
Total RNA was extracted from all samples using Quick RNA Isolation Kit (HUAYUEYANG, China). All RNA samples were adjusted to the same concentration after measuring the RNA concentration on a NanoDrop ND-1000 spectrophotometer (NanoDrop Technologies). The integrity of the RNA was further verified by 1% (w/v) agarose gel electrophoresis and ethidium bromide staining. All samples were pretreated with an RNase-free DNase I (Promega, USA) at 37°C for 30 min to eliminate any DNA contamination. The first strand cDNA was synthesized based on 1 μg of total RNA using the M-MLV reverse transcription system (Promega, USA) according to the manufacturer's protocol.
PCR Primer Design and Test of Amplification Efficiency
A synthetic comparison of the reference genes among different composite plants was taken and nine of them were selected as our candidate reference genes (Actin, EF-1α, PP2A, SAND, MTP, PGK, TUB, UBQ) as they performed well in the composite plants in previous researches (Gu et al., 2011; Fu et al., 2013; Jin et al., 2013; Hong and Dai, 2015; Wang et al., 2015; Table 4). Five primers have been reported in C. lavandulifolium or C. morifolium and the other four primers were designed using Primer5 software with melting temperatures (Tm) of 55–65°C, primer lengths of 19–26 bp and amplicon lengths of 197–297 bp (Table 4). The performance of the primers was tested by RT-PCR and the products of the primer amplicons was verified by 2% (w/v) gel electrophoretic analysis.
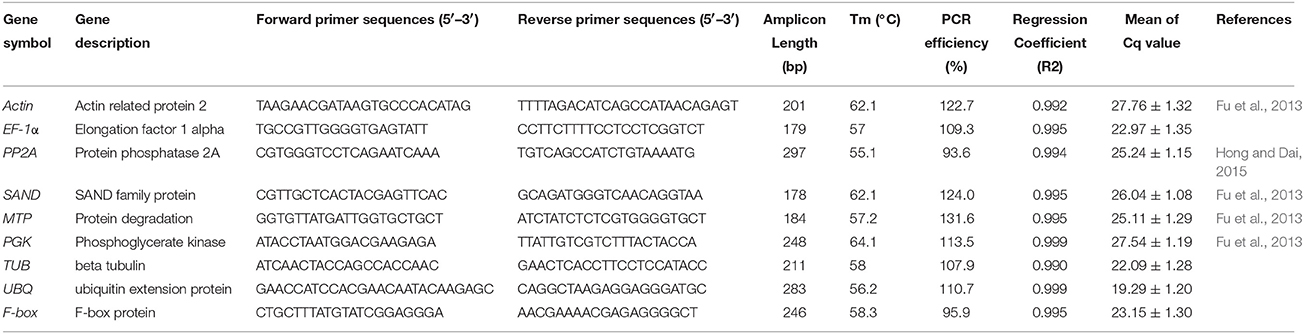
Table 4. Reference gene primer sequences and amplicon characteristics.
Quantitative RT-PCR Analysis
PCR reactions were performed using a Mini Opticon Real-time PCR System (Bio-Rad, USA) based on SYBR Premix Ex Taq (TaKaRa, Japan). Reactions with 20 μl total volume contained 2 μl of template (~50 ng), 0.4 μl of each amplification primer (10 μM), 10 μl of 2X SYBR Premix Ex Taq, and 7.2 μl of ddH2O. The amplification program was at 95°C for 30 s, and then 40 cycles of 95°C for 5 s, an optimized annealing temperature for 30 s and 72°C for 30 s. Melting curves were recorded after cycle 40 by heating from 65 to 95°C, increasing the temperature stepwise by 0.5°C every 5 s. Each experiment was repeated three times with three biological replicates. No template controls were performed with double distilled water as template.
Data Analysis
Four different VBA (Visual Basic Applet) applets were used to rank the stability of nine reference genes using the above Cq or raw Ct-values in all experimental sets in this study: GeNorm (Vandesompele et al., 2002), NormFinder (Brunner et al., 2004), Bestkeeper (Pfaffl et al., 2004), and Ref-finder (http://www.leonxie.com/referencegene.php). The GeNorm software calculates the gene expression stability (M) based on the average pairwise variation (V) among all other reference genes. The expression stability of reference genes was ranked through stepwise exclusion of the least stable gene and recalculation of the average M-values until only two genes were left. A low M-value defined to represent stable expression of the individual gene. The NormFinder program uses an ANOVA-based model to estimate intra- and inter-group variation and ranked the reference genes according to their stability in a given sample set. Bestkeeper ranks the reference genes based on the calculation of coefficient of variance (CV) and the standard deviation (SD) of the Cq-values (Pfaffl et al., 2004). The reference genes are identified as the most stable when they exhibit the lowest CV and SD [CV ± SD]. Ref-finder (http://www.leonxie.com/referencegene.php) was used to confirm the reliability of the calculation. Ref-finder is a web-based tool that integrates the current major computational programs, including GeNorm, NormFinder, Bestkeeper, and the comparative ΔCT method, to compare and rank the stability of candidate reference genes.
Assessment of Normalization
Flower color of seven chrysanthemum cultivars and C. lavandulifolium are typically red or yellow, which means the main pigments are anthocyanin or carotenoid. In order to validate the reference genes identified in this study, we evaluated the expression of DmDFR (dihydroflavonol 4-reductase) and LCYE (lycopene e-cyclase) genes (Table 9). DmDFR and LCYE play an important role in the anthocyanin biosynthesis pathway and carotenoid biosynthesis pathway, respectively. The homologs of LCYE and DFR were previously characterized by RT-PCR.
Results
Performance of the Primers for Each Reference Gene
Melting curve analysis was performed by qPCR after 40 cycles of amplification (Figure S2). The presence of a single peak indicated that the expected amplicons were amplified (Figure S1). The correlation coefficients (R2) ranged in value between 0.992 and 1.0000, and PCR amplification efficiencies between 93.6 and 131.6% were obtained from the standard curves generated using a 10-fold serial dilution of cDNA (Figure S3). No template controls showed no peak and this proved there were no primer dimers.
The expression levels of the nine candidate reference genes presented as Cq-values are shown in Table 4. The mean values of the reference genes were between 19.29 and 27.76, which represented the different expression levels. UBQ showed the highest expression level in all samples and the lowest Cq-value (19.29). Actin presented the lowest expression level and the highest Cq-value (27.76)(Table S1).
The Stability of Reference Genes
To achieve a more accurate expression analysis, the 36 samples were divided into three experimental sets and analyzed individually. Set1 consists of 12 samples from C. lavandulifolium. Set2 was composed of 16 samples from Chinese large-flowered chrysanthemum cultivars. Set3 was composed of eight samples from potted chrysanthemum. In addition, we analyzed the overall stability among the three sets and every variety.
GeNorm
The GeNorm program was used to rank the reference genes' expression stability by calculating the average expression stability (M). Stably expressed genes had values below 1.5 (Vandesompele et al., 2002). The ranking order according to the M-value is depicted in Figure 3.
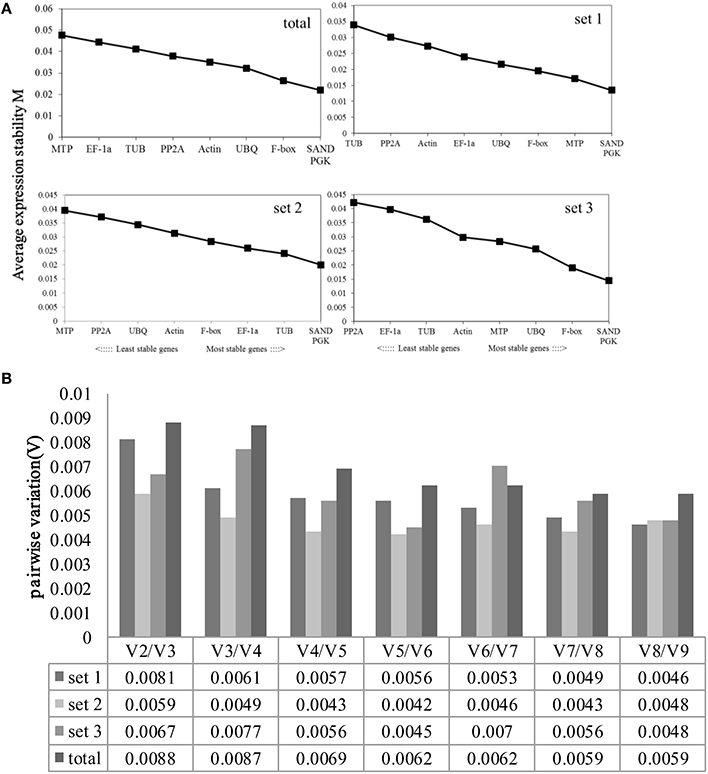
Figure 3. Average expression stability values (M) and pairwise variation (V) of the candidate reference genes were calculated using GeNorm. (A) Average expression stability values (M) following stepwise exclusion of the least stable gene across all treatment groups. The least stable genes are on the left, while the most stable genes are on the right. (B). The optimal number of reference genes required for effective normalization. The pairwise variation (Vn/Vn+1) was analyzed between the normalization factors NFn and NFn+1 using GeNorm.
All of the genes showed high expression stability, with M-values of <0.05. SAND and PGK were the most stably expressed genes, with an M-value of 0.022; MTP and EF-1a were the least stable genes in all samples (Figure 3). In set1, SAND and PGK performed well, with an M-value of 0.02; MTP and PP2A had high M-values. SAND and PGK were the most stable genes, with an M-value of 0.001; TUB and PP2A were the least stable genes in set2. In set3, SAND and PGK were the most highly ranked, with an M-value of 0.015; PP2A and EF-1a were the least stable genes. Generally, SAND and PGK were the most stable genes in all experimental conditions and could be used as housekeeping genes.
The pairwise variation (V) was also calculated to determine the optimal number of genes required for normalization. The Vn/Vn+1-values were far <0.15 under all experimental conditions, indicating that one stable reference gene is enough to obtain accurate results.
NormFinder
The NormFinder program is used to calculate an arbitrary stability value and standard error, considering the intragroup and intergroup variations of each reference gene in all groups (Andersen et al., 2004). The stability values of reference genes were calculated by NormFinder, as shown in Table 5. The ranking order generated by this method was somewhat similar to the results determined by GeNorm. SAND and PGK were still the two most stable genes among all tested samples.
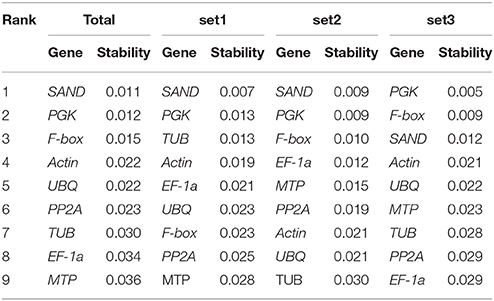
Table 5. Ranking of reference genes and their expression stability values calculated using NormFinder.
Bestkeeper
Bestkeeper ranks the reference genes according to the standard deviation (SD) of their Cqs, and the output includes more information, for example, the coefficient of variation (CV) and correlation (r) (Pfaffl et al., 2004). If the SD-values exceed 1.0, reference genes are considered to be unstable and should be avoided for gene expression normalization. Our results indicated that most genes had SD-values smaller than 1.0, including eight genes in the total, nine genes in set1, nine genes in set2, and three genes in set3 (Table 6). The ranking order was quite different from the results calculated by GeNorm and NormFinder, but the SD-values of PKG and SAND were smaller than one in all sets.
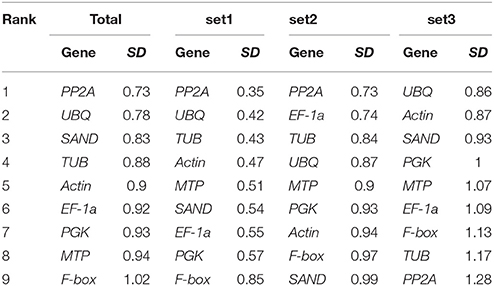
Table 6. Ranking of reference genes and their SD calculated using Bestkeeper.
Ref-finder
Finally, Ref-finder was used to generate an integrated ranking of the most stable candidate reference genes (Table 7). Differences of results were found among methods and slight disparities were also found when analysis with single method compared with result of integration. However, the most stable gene was roughly identical. SAND was found to be the most stably expressed gene in all samples and in set1. Both SAND and PGK were the most stable in set2, and PGK was the most stable in set3. MTP was the least stable gene in all samples and in set1. Actin and PP2A was the least stable gene in set2 and set3, respectively.
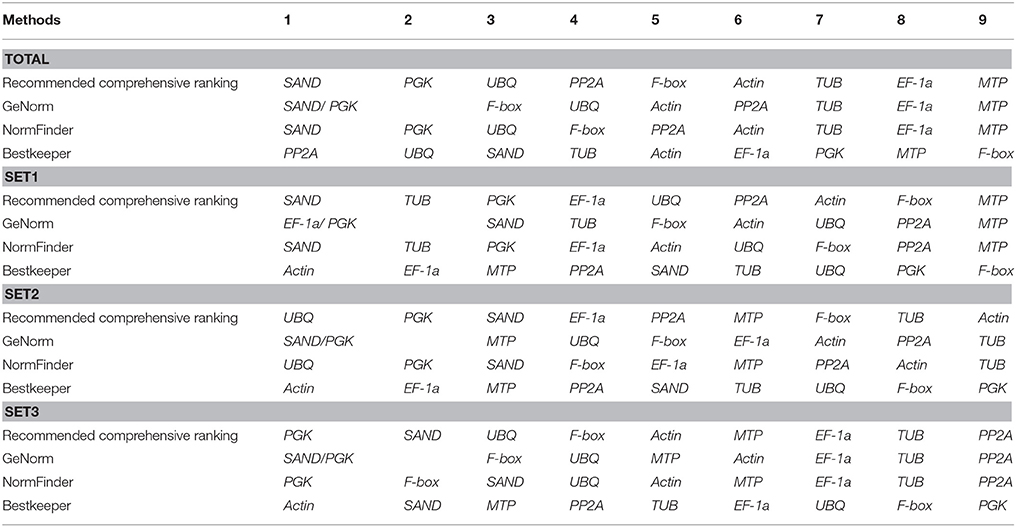
Table 7. Stability ranking of nine candidate reference genes.
Reference Gene in Varieties
Furthermore, we analyzed the stability in varieties by four algorithms (Bestkeeper, NormFinder, GeNorm, and Ref-finder). There is difference among varieties. PGK was the most stable reference gene in LFC2, LFC3, PC1, and PC24, and thus PGK could be a good candidate gene in chrysanthemums. F-box, Actin, and MTP performed well in LFC1, LFC4, and PC3, respectively. Still, PGK and SAND rank higher in most varieties (Table 8).
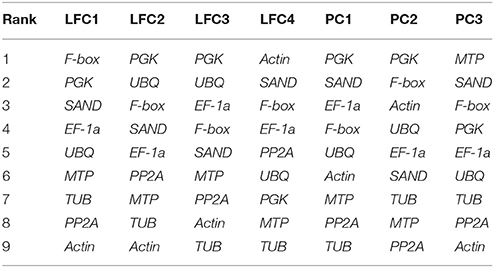
Table 8. Stability ranking of nine candidate reference genes in varieties of chrysanthemum.
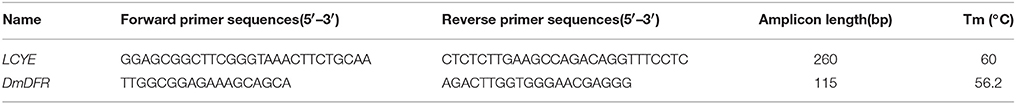
Table 9. Sequences of DmDFR and LCYE for RT-PCR.
Reference Gene Validation
Firstly, we quantified the expression of LCYE in C. lavandulifolium using the selected reference genes. When normalized using the two most stable genes (SAND and PGK) as internal controls, the relative expression levels were the same. The result showed that in C. lavandulifolium, the relative expression level was significantly increased in S2 and then decreased with flower development. The same pattern was shown in the ray floret and disc floret, and the relative expression level was lower in green bracts. When normalized using TUB, which was the third most stable gene as calculated, the expression pattern was slightly changed. The relative expression level in S4 was higher than that in S3, which is contradictory to the above patterns. The expression pattern of genes latter in the ranking order show more differences (Figure 4).
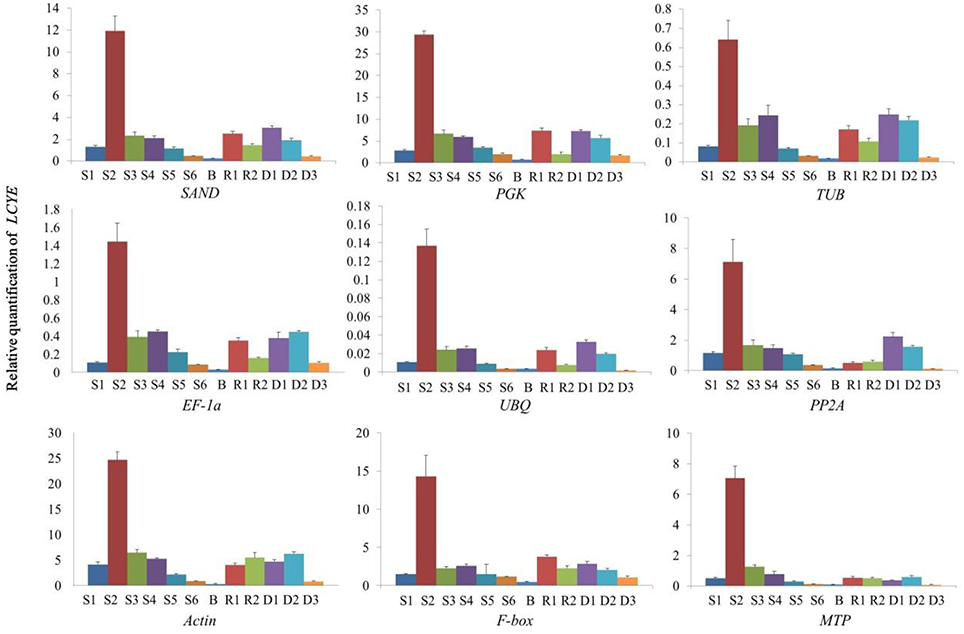
Figure 4. Relative quantification of LCYE expression in different tissues of C. lavandulifolium with competence to flower using validated reference genes for normalization.
We chose the most stable gene to normalize the expression level in different cultivars. The expression pattern of DmDFR was correlated with the color. It was more highly expressed in the red petals of ray florets, and there was almost no expression in disc florets and flower buds (Figure 5A). DmDFR expression increased during petal development in LFC1 (Figure 5B). LCYE was expressed in both ray florets and disc florets of yellow chrysanthemums and exhibited some differences among varieties. LCYE was more highly expressed in ray florets than disc florets, and its expression increased during petal development in LFC1 and LFC2. Nevertheless, it was more highly expressed in disc florets than ray florets and was expressed steadily during petal development in LFC3, which is typical of Anemone (Figure 6). By the results, it showed that there were some divergence among results calculated by different reference.
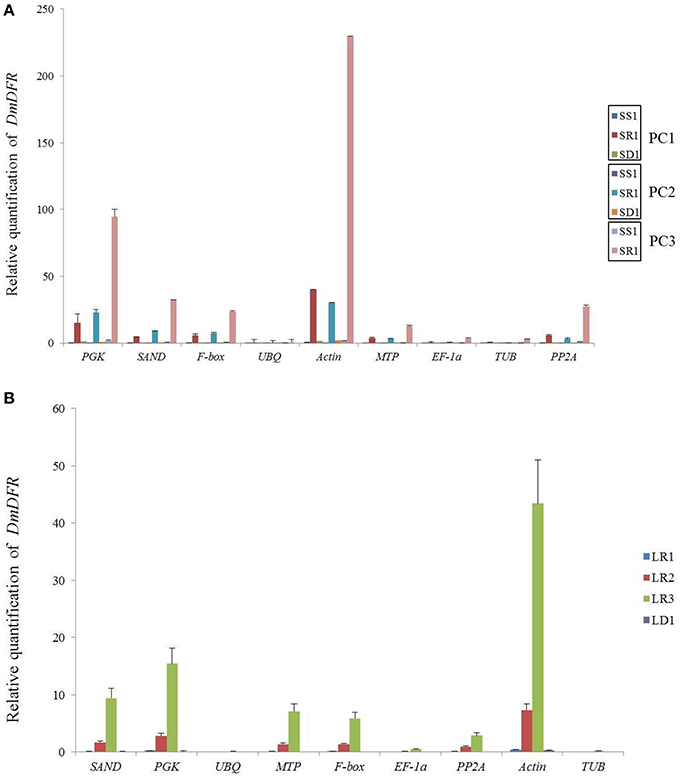
Figure 5. Relative mRNA levels of DmDFR in different organs of red chrysanthemums. (A) Relative mRNA levels of DmDFR in set3, (B) Relative mRNA levels of DmDFR in LC1.
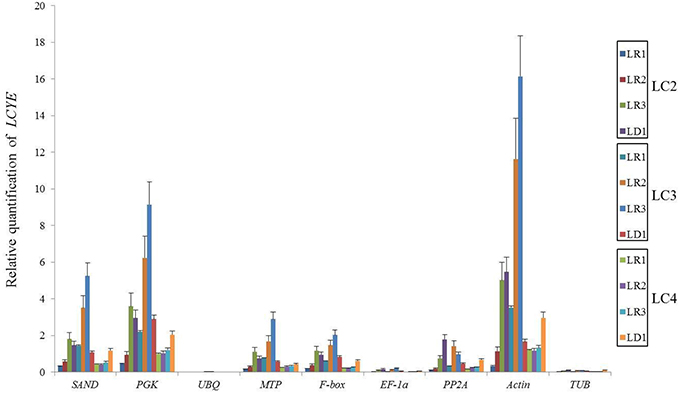
Figure 6. Relative mRNA levels of LCYE in different organs of yellow chrysanthemums.
Discussion
qRT-PCR has become an important technique for the analysis of gene expression because of its sensitivity, accuracy, and high throughput nature (Bustin, 2000). It is necessary to select the proper candidate reference genes as there are no universally-suitable reference genes. The ideal reference genes should be stably expressed under all experimental conditions and independent of organs, tissues, developmental stages, and different treatments (Huggett et al., 2005).
In this study, the stability of nine reference genes in various tissues during flower development in C. morifolium and C. lavandulifolium was analyzed. The structure of the capitulum in chrysanthemums is very special. The capitula of chrysanthemums consist of ray florets and disc florets, which are quite different in shape and gender. It is a great material for flower development research in higher plants. Several reference gene validation attempts have been reported for Asteraceae (Gu et al., 2011; Fu et al., 2013; Hong and Dai, 2015; Wang et al., 2015). They mainly focus on flower color, flowering and cross-species. There is no detailed validation has been conducted to test their stability in different organs during flower development. We selected nine genes as candidate reference genes, including genes involved in protein degradation (MTP), the regulation of phosphorylation (PP2A), determining cytoskeletal structure (TUB and ACTIN), protein synthesis (EF-1a) and others, including genes encoding a protein kinase (PGK), ubiquitin (UBQ), SAND family protein (SAND), and F-box family protein (F-box). Some of them are traditional reference genes and the others are new reference genes. A great deal of experiments in A. thaliana (Czechowski et al., 2005), Coffea Arabica (Cruz et al., 2009), Gossypium hirsutum (Artico et al., 2010) proved that the new reference genes were better for use than the conventional genes.
A good RT-qPCR experiment should always be based on a well-thought sampling protocol (De Keyser et al., 2013). Rieu and Powers (2009) proposed that, in ideal condition, all of the reactions should be run on the same plate. In addition, randomized block design is a better strategy considering the accuracy of statistic. In this work, we performed the program for each gene in a single plate, while, three independent biological replicates were conducted to diminish the error. The samples were collected on different flowers of at least three plants and RNA were extracted at the same time with same methods. Rieu and Powers further pointed out that the current generation of real-time PCR cyclers had a better performance in reducing the within-plate variation introduced during the PCR run. As a result, nonrandom plate setup could be a more practical method.
There is no consensus as to which type of algorithm should be used to determine the stability of gene expression because different statistical methods based on different principles yield potentially contradictory results from the same data. Therefore it is important to use at least three different softwares in order to achieve best results as possible in particular to avoid selection of co-regulated genes (Jacob et al., 2013). In this study, we used three frequently used statistical algorithms, GeNorm, NormFinder, and Bestkeeper, to analyze the stability of candidate reference genes. The optimal reference genes were determined by synthesizing using the above described methods. GeNorm and NormFinder are the most widely used algorithms, and they were different from each other in many studies, such those in as flax (Huis et al., 2010), rubber tree, tobacco (Schmidt and Delaney, 2010), and Oxytropis ochrocephala Bunge (Zhuang et al., 2015). However, there are still some studies in which these algorithms showed very few differences from each other, such as those in coffee (Cruz et al., 2009) and rice (Jain, 2009). There were reports that both NormFinder and GeNorm have minor differences in gene stability ranking (Jain et al., 2006; Cruz et al., 2009). NormFinder was more effective than GeNorm in wheat (Paolacci et al., 2009). The results of GeNorm and NormFinder were similar, but they showed some differences from the results obtained with Bestkeeper. SAND and PGK are the most stable genes when calculated by GeNorm and NormFinder. Additionally, their SDs were <1 when calculated by Bestkeeper. Thus, SAND and PGK are stable and available in our samples. Finally, we used Ref-finder to combine and validate the results. There are some differences among algorithms, but they are not obvious.
The results highlight the fact that it is better to select different reference genes depending on the biological samples. In conclusion, based on the results of the present study, SAND and PGK were good candidates for normalization in all samples, C. lavandulifolium and Chinese large-flowered chrysanthemum cultivars. The results of this study suggest that PGK yielded low M-values in different tissues during the developmental process of potted chrysanthemums. Functional studies suggest, that the SAND family proteins are involved in late steps of endocytic transport (Cottage et al., 2004; Poteryaev and Spang, 2005). SAND was revealed as one of the superior reference genes found for proper normalization in a large number of studies, such as in tomato development studies (Expósito-Rodríguez et al., 2008), in a set of organs and tissues of buckwheat (Demidenko et al., 2011), in different citrus organs and following different biotic stresses (Mafra et al., 2012), in Petunia hybrida during leaf and flower development (Mallona et al., 2010), in tissues during berry development (Ye et al., 2015) and in abiotic stress samples of Syntrichia caninervis (Li et al., 2015). PGK plays important roles in the glycolytic pathway (Anderson and Carol, 2005). PGK (phosphoglycerate kinase) was one of the superior reference genes found for proper normalization in chrysanthemum of cross-ploidy levels (Wang et al., 2015). MTP and EF-1a yielded poor values in all sample sets in this work, although its homolog in soybeans is one of the most optimal genes in different tissues and photoperiod treatment samples (Jian et al., 2008; Hu et al., 2009). There were differences for best reference genes among varieties as the genetic background of varieties were complex. PGK and SAND yielded low M-values in most varieties, although there are exceptions, such as F-box, Actin, and MTP, which was most stable in LFC1, LFC4, and PC3, respectively. It is advised to select reference genes for specific varieties. However, in general, PGK and SAND were the best genes among all samples, not only in varieties of different petal types but also in stages and tissues of flower development.
We quantified the expression of DmDFR and LCYE genes. DmDFR and LCYE play important roles in the anthocyanin biosynthesis pathway and carotenoid biosynthesis pathway, respectively (Kishimoto and Ohmiya, 2006; Huang et al., 2013). LCYE showed increasing levels of expression during petal development in the petals of the yellow chrysanthemum, and its pattern was well correlated with the pattern of carotenoid accumulation (Kishimoto and Ohmiya, 2006). Molecular breeding of DFR has been used to create blue colored flowers in roses and carnations (Katsumoto et al., 2007; Tanaka et al., 2009). The results showed that the expression pattern of DmDFR and LCYE were well correlated with the color. Interestingly, we found that there were differences in the expression pattern in ray florets and disc florets among varieties. For example, LCYE was more highly expressed in ray florets than in disc florets, and its expression increased during petal development in LFC2 and LFC3. Nevertheless, it was more highly expressed in disc florets than in ray florets and was expressed steadily during petal development in LFC4. They exhibit the same color with different pigment distribution.
This research analyzed reference genes of flower development in C. morifolium and C. lavandulifolium for RT-qPCR and discussed the expression of genes involved in flower color. It will provide basic data for molecular research of flower development in chrysanthemums.
Author Contributions
Designed and performed and the experiments: SQ, SD; Analyzed data and wrote the paper: SQ, LY, XW, and YH; Conducted the experiments: SQ; Materials support: XS, MZ.
Conflict of Interest Statement
The authors declare that the research was conducted in the absence of any commercial or financial relationships that could be construed as a potential conflict of interest.
Acknowledgments
This work was supported by the National Natural Science Foundation of China (31471907), Special Research Fund for the Doctoral Program of Higher Education of China (20130014110013), the National Natural Science Foundation of China (31530064).
Supplementary Material
The Supplementary Material for this article can be found online at: http://journal.frontiersin.org/article/10.3389/fpls.2016.00287
Table S1. The Ct value of primers.
Figure S1. The melt peak of primers.
Figure S2. The melt curve of primers.
Figure S3. The ten-fold serial dilution curves of primers.
References
Andersen, C. L., Jensen, J. L., and Ørntoft, T. F. (2004). Normalization of real-time quantitative reverse transcription-PCR data: a model-based variance estimation approach to identify genes suited for normalization, applied to bladder and colon cancer data sets. Cancer Res. 64, 5245–5250. doi: 10.1158/0008-5472.CAN-04-0496
Anderson, L. E., and Carol, A. A. (2005). Enzyme co-localization in the pea leaf cytosol: 3-P-glycerate kinase, glyceraldehyde-3-P dehydrogenase, triose-P isomerase and aldolase. Plant Sci. 169, 620–628. doi: 10.1016/j.plantsci.2005.05.012
Artico, S., Nardeli, S. M., Brilhante, O., Grossi-de-Sa, M. F., and Alves-Ferreira, M. (2010). Identification and evaluation of new reference genes in Gossypium hirsutum for accurate normalization of real-time quantitative RT-PCR data. BMC Plant Biol. 10:49. doi: 10.1186/1471-2229-10-49
Brunner, A. M., Yakovlev, I. A., and Strauss, S. H. (2004). Validating internal controls for quantitative plant gene expression studies. BMC Plant Biol. 4:14. doi: 10.1186/1471-2229-4-14
Bustin, S. A. (2000). Absolute quantification of mRNA using real-time reverse transcription polymerase chain reaction assays. J. Mol. Endocrinol. 25, 169–193. doi: 10.1677/jme.0.0250169
Bustin, S. A., Benes, V., Garson, J. A., Hellemans, J., Huggett, J., Kubista, M., et al. (2009). The MIQE guidelines: minimum information for publication of quantitative real-time PCR experiments. Clin. Chem. 55, 611–622. doi: 10.1373/clinchem.2008.112797
Chen, J. Y. (1984). “Studies on the origin of Chinese florist's chrysanthemum,” in II Symposium on Growth Regulators in Floriculture, Vol. 167 (Beijing), 349–362.
Cottage, A., Mullan, L., Portela, M. B., Hellen, E., Carver, T., Patel, S., et al. (2004). Molecular characterisation of the SAND protein family: a study based on comparative genomics, structural bioinformatics and phylogeny. Cell. Mol. Biol. Lett. 9, 739–753.
Cruz, F., Kalaoun, S., Nobile, P., Colombo, C., Almeida, J., Barros, L. M., et al. (2009). Evaluation of coffee reference genes for relative expression studies by quantitative real-time RT-PCR. Mol. Breed. 23, 607–616. doi: 10.1007/s11032-009-9259-x
Czechowski, T., Stitt, M., Altmann, T., Udvardi, M. K., and Scheible, W. R. (2005). Genome-wide identification and testing of superior reference genes for transcript normalization in Arabidopsis. Plant Physiol. 139, 5–17. doi: 10.1104/pp.105.063743
Dai, S. L., Wang, W. K., and Huang, J. P. (2002). Advances of researches on phylogeny of Dendranthema and origin of chrysanthemum. J. Beijing Forestry Univ. 24, 230–234. doi: 10.13332/j.1000-1522.2002.z1.046
Dai, S. L., Wang, W. K., Li, M. X., and Xu, Y. X. (2005). Phylogenetic relationship of Dendranthema (DC.) Des Moul. revealed by fluorescent in situ hybridization. J. Integr. Plant Biol. 47, 783–791. doi: 10.1111/j.1744-7909.2005.00068.x
De Keyser, E., Desmet, L., Van Bockstaele, E., and De Riek, J. (2013). How to perform RT-qPCR accurately in plant species? A case study on flower colour gene expression in an azalea (Rhododendron simsii hybrids) mapping population. BMC Mol. Biol. 14:13. doi: 10.1186/1471-2199-14-13
Dekkers, B. J., Willems, L., Bassel, G. W., van Bolderen-Veldkamp, R. M., Ligterink, W., Hilhorst, H. W., et al. (2012). Identification of reference genes for RT–qPCR expression analysis in Arabidopsis and tomato seeds. Plant Cell Physiol. 53, 28–37. doi: 10.1093/pcp/pcr113
Delporte, M., Legrand, G., Hilbert, J. L., and Gagneul, D. (2015). Selection and validation of reference genes for quantitative real-time PCR analysis of gene expression in Cichorium intybus. Front. Plant Sci. 6:651. doi: 10.3389/fpls.2015.00651
Demidenko, N. V., Logacheva, M. D., and Penin, A. A. (2011). Selection and validation of reference genes for quantitative real-time PCR in buckwheat (Fagopyrum esculentum) based on transcriptome sequence data. PLoS ONE 6:e19434. doi: 10.1371/journal.pone.0019434
Dheda, K., Huggett, J. F., Chang, J. S., Kim, L. U., Bustin, S. A., Johnson, M. A., et al. (2005). The implications of using an inappropriate reference gene for real-time reverse transcription PCR data normalization. Anal. Biochem. 344, 141–143. doi: 10.1016/j.ab.2005.05.022
Expósito-Rodríguez, M., Borges, A. A., Borges-Pérez, A., and Pérez, J. A. (2008). Selection of internal control genes for quantitative real-time RT-PCR studies during tomato development process. BMC Plant Biol. 8:131. doi: 10.1186/1471-2229-8-131
Fu, J. X., Wang, Y., Huang, H., Zhang, C., and Dai, S. L. (2013). Reference gene selection for RT-qPCR analysis of Chrysanthemum lavandulifolium during its flowering stages. Mol. Breed. 31, 205–215. doi: 10.1007/s11032-012-9784-x
Funk, V., Susanna, A., Stuessy, T. F., and Bayer, R. J. (2009). Systematics, Evolution, and Biogeography of Compositae. Vienna: International Association for Plant Taxonomy, 131–138.
Gu, C. S., Chen, S. M., Liu, Z. L., Shan, H., Luo, H. L., Guan, Z. Y., et al. (2011). Reference gene selection for quantitative real-time PCR in Chrysanthemum subjected to biotic and abiotic stress. Mol. Biotechnol. 49, 192–197. doi: 10.1007/s12033-011-9394-6
Hong, Y., and Dai, S. L. (2015). Selection of reference genes for real-time quantitative polymerase chain reaction analysis of light-dependent anthocyanin biosynthesis in chrysanthemum. J. Am. Soc. Hortic. Sci. 140, 68–77.
Hu, R., Fan, C., Li, H., Zhang, Q., and Fu, Y. F. (2009). Evaluation of putative reference genes for gene expression normalization in soybean by quantitative real-time RT-PCR. BMC Mol. Biol. 10:93. doi: 10.1186/1471-2199-10-93
Huang, H., Hu, K., Han, K. T., Xiang, Q. Y., and Dai, S. L. (2013). Flower colour modification of chrysanthemum by suppression of F3′H and overexpression of the exogenous Senecio cruentus F3′5′H gene. PLoS ONE 8:e74395. doi: 10.1371/journal.pone.0074395
Huggett, J., Dheda, K., Bustin, S., and Zumla, A. (2005). Real-time RT-PCR normalisation; strategies and considerations. Genes Immun. 6, 279–284. doi: 10.1038/sj.gene.6364190
Huis, R., Hawkins, S., and Neutelings, G. (2010). Selection of reference genes for quantitative gene expression normalization in flax (Linum usitatissimum L.). BMC Plant Biol. 10:71. doi: 10.1186/1471-2229-10-71
Jacob, F., Guertler, R., Naim, S., Nixdorf, S., Fedier, A., Hacker, N. F., et al. (2013). Careful selection of reference genes is required for reliable performance of RT-qPCR in human normal and cancer cell lines. PLoS ONE 8:e59180. doi: 10.1371/journal.pone.0059180
Jain, M. (2009). Genome-wide identification of novel internal control genes for normalization of gene expression during various stages of development in rice. Plant Sci. 176, 702–706. doi: 10.1016/j.plantsci.2009.02.001
Jain, M., Nijhawan, A., Tyagi, A. K., and Khurana, J. P. (2006). Validation of housekeeping genes as internal control for studying gene expression in rice by quantitative real-time PCR. Biochem. Biophys. Res. Commun. 345, 646–651. doi: 10.1016/j.bbrc.2006.04.140
Jian, B., Liu, B., Bi, Y., Hou, W., Wu, C., and Han, T. (2008). Validation of internal control for gene expression study in soybean by quantitative real-time PCR. BMC Mol. Biol. 9:59. doi: 10.1186/1471-2199-9-59
Jin, X., Fu, J., Dai, S. L., Sun, Y., and Hong, Y. (2013). Reference gene selection for qPCR analysis in cineraria developing flowers. Sci. Hortic. (Amsterdam). 153, 64–70. doi: 10.1016/j.scienta.2013.01.023
Katsumoto, Y., Fukuchi-Mizutani, M., Fukui, Y., Brugliera, F., Holton, T. A., Karan, M., et al. (2007). Engineering of the rose flavonoid biosynthetic pathway successfully generated blue-hued flowers accumulating delphinidin. Plant Cell Physiol. 48, 1589–1600. doi: 10.1093/pcp/pcm131
Kim, B. R., Nam, H. Y., Kim, S. U., Kim, S. I., and Chang, Y. J. (2003). Normalization of reverse transcription quantitative-PCR with housekeeping genes in rice. Biotechnol. Lett. 25, 1869–1872. doi: 10.1023/A:1026298032009
Kishimoto, S., and Ohmiya, A. (2006). Regulation of carotenoid biosynthesis in petals and leaves of chrysanthemum (Chrysanthemum morifolium). Physiol. Plant. 128, 436–447. doi: 10.1111/j.1399-3054.2006.00761.x
Kulcheski, F. R., Marcelino-Guimaraes, F. C., Nepomuceno, A. L., Abdelnoor, R. V., and Margis, R. (2010). The use of microRNAs as reference genes for quantitative polymerase chain reaction in soybean. Anal. Biochem. 406, 185–192. doi: 10.1016/j.ab.2010.07.020
Lane, M. A. (1994). “Pollination biology of Compositae,” in Compositae: Biology and Utilization, Proceedings of the International Compositae Conference, Vol. 2, (Kew, VIC), 61–80.
Li, X., Zhang, D., Li, H., Gao, B., Yang, H., Zhang, Y., et al. (2015). Characterization of reference genes for RT-qPCR in the desert moss Syntrichia caninervis in response to abiotic stress and desiccation/rehydration. Front. Plant Sci. 6:38. doi: 10.3389/fpls.2015.00038
Libault, M., Thibivilliers, S., Bilgin, D. D., Radwan, O., Benitez, M., Clough, S. J., et al. (2008). Identification of four soybean reference genes for gene expression normalization. Plant Genome 1, 44–54. doi: 10.3835/plantgenome2008.02.0091
Mafra, V., Kubo, K. S., Alves-Ferreira, M., Ribeiro-Alves, M., Stuart, R. M., Boava, L. P., et al. (2012). Reference genes for accurate transcript normalization in citrus genotypes under different experimental conditions. PLoS ONE 7:e31263. doi: 10.1371/journal.pone.0031263
Mallona, I., Lischewski, S., Weiss, J., Hause, B., and Egea-Cortines, M. (2010). Validation of reference genes for quantitative real-time PCR during leaf and flower development in Petunia hybrida. BMC Plant Biol. 10:4. doi: 10.1186/1471-2229-10-4
Miller, G. (2005). What is the biological basis of consciousness? Science 309:79. doi: 10.1126/science.309.5731.79
Paolacci, A. R., Tanzarella, O. A., Porceddu, E., and Ciaffi, M. (2009). Identification and validation of reference genes for quantitative RT-PCR normalization in wheat. BMC Mol. Biol. 10:11. doi: 10.1186/1471-2199-10-11
Pfaffl, M. W., Tichopad, A., Prgomet, C., and Neuvians, T. P. (2004). Determination of stable housekeeping genes, differentially regulated target genes and sample integrity: bestkeeper–Excel-based tool using pair-wise correlations. Biotechnol. Lett. 26, 509–515. doi: 10.1023/B:BILE.0000019559.84305.47
Poteryaev, D., and Spang, A. (2005). A role of SAND-family proteins in endocytosis. Biochem. Soc. Trans. 33, 606–608. doi: 10.1042/BST0330606
Remans, T., Smeets, K., Opdenakker, K., Mathijsen, D., Vangronsveld, J., and Cuypers, A. (2008). Normalisation of real-time RT-PCR gene expression measurements in Arabidopsis thaliana exposed to increased metal concentrations. Planta 227, 1343–1349. doi: 10.1007/s00425-008-0706-4
Rieu, I., and Powers, S. J. (2009). Real-time quantitative RT-PCR: design, calculations, and statistics. Plant Cell 21, 1031–1033. doi: 10.1105/tpc.109.066001
Schmidt, G. W., and Delaney, S. K. (2010). Stable internal reference genes for normalization of real-time RT-PCR in tobacco (Nicotiana tabacum) during development and abiotic stress. Mol. Genet. Genomics 283, 233–241. doi: 10.1007/s00438-010-0511-1
Tähtiharju, S., Rijpkema, A. S., Vetterli, A., Albert, V. A., Teeri, T. H., and Elomaa, P. (2012). Evolution and diversification of the CYC/TB1 gene family in Asteraceae—a comparative study in Gerbera (Mutisieae) and sunflower (Heliantheae). Mol. Biol. Evol. 29, 1155–1166. doi: 10.1093/molbev/msr283
Tanaka, Y., Brugliera, F., and Chandler, S. (2009). Recent progress of flower colour modification by biotechnology. Int. J. Mol. Sci. 10, 5350–5369. doi: 10.3390/ijms10125350
Vandesompele, J., De Preter, K., Pattyn, F., Poppe, B., Van Roy, N., De Paepe, A., et al. (2002). Accurate normalization of real-time quantitative RT-PCR data by geometric averaging of multiple internal control genes. Genome Biol. 3:research0034. doi: 10.1186/gb-2002-3-7-research0034
VanGuilder, H. D., Vrana, K. E., and Freeman, W. M. (2008). Twenty-five years of quantitative PCR for gene expression analysis. Biotechniques 44, 619. doi: 10.2144/000112776
Wang, H. B., Chen, S. M., Jiang, J. F., Zhang, F., and Chen, F. D. (2015). Reference gene selection for cross-species and cross-ploidy level comparisons in Chrysanthemum spp. Sci. Rep. 5:8094. doi: 10.1038/srep08094
Ye, X., Zhang, F., Tao, Y., Song, S., and Fang, J. (2015). Reference gene selection for quantitative real-time PCR normalization in different cherry genotypes, developmental stages and organs. Sci. Hortic. 181, 182–188. doi: 10.1016/j.scienta.2014.10.027
Zhang, L. J., and Dai, S. L. (2009). Research advance on germplasm resources of Chrysanthemum × morifolium. Chin. Bull. Bot. 44, 526–535. doi: 10.3969/j.issn.1674-3466.2009.05.002
Keywords: Chrysanthemum morifolium, Chrysanthemum lavandulifolium, reference genes, qRT-PCR, flower development
Citation: Qi S, Yang L, Wen X, Hong Y, Song X, Zhang M and Dai S (2016) Reference Gene Selection for RT-qPCR Analysis of Flower Development in Chrysanthemum morifolium and Chrysanthemum lavandulifolium. Front. Plant Sci. 7:287. doi: 10.3389/fpls.2016.00287
Received: 20 October 2015; Accepted: 22 February 2016;
Published: 11 March 2016.
Edited by:
Roger Deal, Emory University, USACopyright © 2016 Qi, Yang, Wen, Hong, Song, Zhang and Dai. This is an open-access article distributed under the terms of the Creative Commons Attribution License (CC BY). The use, distribution or reproduction in other forums is permitted, provided the original author(s) or licensor are credited and that the original publication in this journal is cited, in accordance with accepted academic practice. No use, distribution or reproduction is permitted which does not comply with these terms.
*Correspondence: Silan Dai, silandai@sina.com; silandai@gmail.com