 Niklas Körber1,2*
 Anja Bus1,2
 Jinquan Li1
 Isobel A. P. Parkin3
 Benjamin Wittkop4
 Rod J. Snowdon4Benjamin Stich1*
- 1Quantitative Crop Genetics, Max Planck Institute for Plant Breeding Research, Cologne, Germany
- 2Plant Breeding and Biotechnology, Institute of Crop Science and Resource Conservation, University of Bonn, Bonn, Germany
- 3Agriculture and Agri-Food Canada, Saskatoon, SK, Canada
- 4Department of Plant Breeding, Research Centre for BioSystems, Land Use and Nutrition, Justus Liebig University, Giessen, Germany
In Brassica napus breeding, traits related to commercial success are of highest importance for plant breeders. However, such traits can only be assessed in an advanced developmental stage. Molecular markers genetically linked to such traits have the potential to accelerate the breeding process of B. napus by marker-assisted selection. Therefore, the objectives of this study were to identify (i) genome regions associated with the examined agronomic and seed quality traits, (ii) the interrelationship of population structure and the detected associations, and (iii) candidate genes for the revealed associations. The diversity set used in this study consisted of 405 B. napus inbred lines which were genotyped using a 6K single nucleotide polymorphism (SNP) array and phenotyped for agronomic and seed quality traits in field trials. In a genome-wide association study, we detected a total of 112 associations between SNPs and the seed quality traits as well as 46 SNP-trait associations for the agronomic traits with a P < 1.28e-05 (Bonferroni correction of α = 0.05) for the inbreds of the spring and winter trial. For the seed quality traits, a single SNP-sulfur concentration in seeds (SUL) association explained up to 67.3% of the phenotypic variance, whereas for the agronomic traits, a single SNP-blossom color (BLC) association explained up to 30.2% of the phenotypic variance. In a basic local alignment search tool (BLAST) search within a distance of 2.5 Mbp around these SNP-trait associations, 62 hits of potential candidate genes with a BLAST-score of ≥100 and a sequence identity of ≥70% to A. thaliana or B. rapa could be found for the agronomic SNP-trait associations and 187 hits of potential candidate genes for the seed quality SNP-trait associations.
1. Introduction
In Brassica napus breeding, traits related to commercial success are of highest importance (Friedt and Snowdon, 2010). However, such traits in many cases can only be assessed in an advanced developmental stage. Therefore, the use of marker-assisted selection (MAS) has the potential to save time in the breeding process and increase the gain of selection. In order to do so, the identification of quantitative trait loci (QTL) controlling these traits is required. However, the detection of QTL which explain an adequate percentage of the phenotypic variance is challenging.
Linkage mapping or association mapping approaches are suitable methods for the discovery of QTL. Various studies in B. napus have identified several QTL for agronomic and seed quality traits using such approaches. Würschum et al. (2012) detected in nine segregating populations of elite rapeseed inbreds several QTL for diverse traits, including flowering time, plant height, protein content, oil content, glucosinolate content, and grain yield. Udall et al. (2006) used two DH populations and detected genomic regions which contributed to variation of grain yield, days to flowering, and leaf blight disease resistance. Due to only two parental alleles and large confidence intervals of QTL, however, the results of linkage mapping studies had so far little impact on the breeding process (Van Inghelandt et al., 2012).
Hasan et al. (2008) identified in an association mapping study with B. napus germplasm simple sequence repeat (SSR) markers which were physically linked to candidate genes for glucosinolate biosynthesis in Arabidopsis thaliana, to be associated with variation of the seed glucosinolate content in B. napus. However, the results of Linkage disequilibrium (LD) analyses suggested that the number of such SSR-markers is at the lower end of what is required to have a high power to detect marker-phenotype associations for seed quality traits in rapeseed (Bus et al., 2011; Delourme et al., 2013). In the meantime the B. napus A genome sequence from B. rapa (Wang et al., 2011b) as well as the C genome sequence from B. oleracea were published (Yu et al., 2013). This information allowed the design and use of a 6K SNP chip and latterly a 60K SNP chip. Bus et al. (2014) identified 29 loci significantly associated with variation of the shoot ionome in our diversity set consisting of 509 inbred lines that was genotyped with the 6K SNP array. Furthermore, in a previous study 63 significant associations for seedling development traits and 31 SNP-gene associations for candidate genes related to seedling development were identified using the same 6K SNP array (Körber et al., 2015). Recently, Li et al. (2014), Luo et al. (2015), and Hatzig et al. (2015) used the 60K SNP array and identified in an association mapping study in different B. napus populations significant associations for seed weight and seed quality traits, harvest index as well as seed germination and vigor traits.
In this study, we performed a genome-wide association study (GWAS) in our large-size worldwide diversity set of 405 B. napus inbred lines and analyzed 15 agronomic as well as 15 seed quality traits with a sufficient number of SNP markers which were mapped to the B. napus sequence.
The objectives of our study were to identify (i) genome regions associated with the examined agronomic and seed quality traits, (ii) the interrelationship of population structure and the detected associations, and (iii) candidate genes for the revealed associations.
2. Materials and Methods
2.1. Plant Material and Field Experiments
A subset of 405 rapeseed inbreds from the diversity set examined by Bus et al. (2011) was used in this study. The accessions belong to eight different germplasm types, namely winter oilseed rape (OSR) (156), winter fodder (8), swede (51), semi-winter OSR (7), spring OSR (177), spring fodder (4), and vegetable (2).
The multiplication of the genotypes was done in such a way that maternal environmental effects were minimized. The B. napus diversity set was evaluated in field experiments for several agronomic traits, and the harvested seeds were analyzed by near infrared reflectance spectroscopy (NIRS) to extract the seed quality parameters MOI, OIL, PRT, GSL, SUL, OLA, LIA, and ERA according to the standard protocol of VDLUFA and the parameters NDF, ADF, and ADL according to Wittkop et al. (2012) (Table 1).
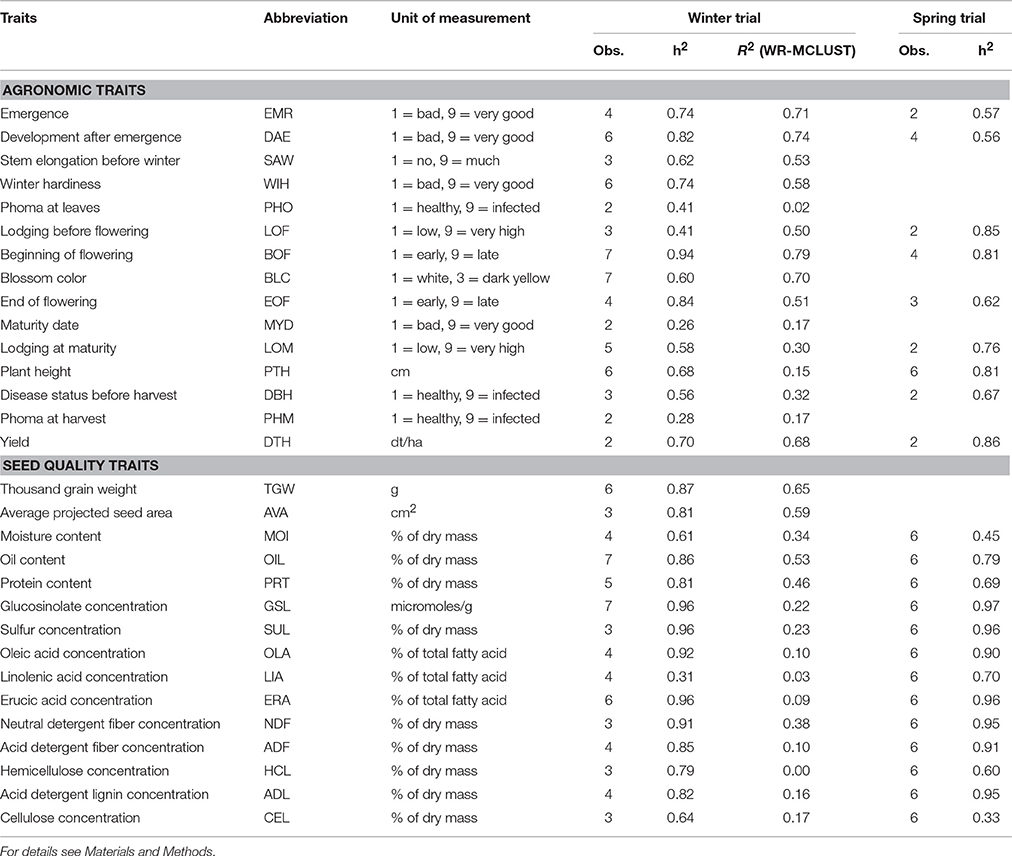
Table 1. Traits assessed in the B. napus diversity set, where h2 is the repeatability, R2 the proportion of the phenotypic variance explained by population structure, and Obs. the number of replicates or location-replicate combinations in which the corresponding trait was recorded.
As described by Körber et al. (2012), a subset of 217 winter B. napus genotypes was grown in a field experiment in the growing season 2009–2010, which is designated in the following as winter trial. In 2010, a subset of 188 spring B. napus genotypes was evaluated at three locations in Germany with two replications per location. The experiment is designated in the following as spring trial. The phenotypic mean values of agronomic and seed quality traits of the winter and spring trials are listed in the Data Sheet S1.
2.2. Genotyping of SNP Markers
For the GWAS, 398 B. napus inbred lines were assayed at Agriculture and Agri-Food Canada using a customized B. napus 6K Illumina Infinium SNP array (http://aafc-aac.usask.ca/ASSYST/). As described in detail in Körber et al. (2015), this array was designed from next generation sequence (NGS) data. It contained 5506 successful bead types representing the same number of potential SNPs. Samples were prepared and assayed as per the Infinium HD Assay Ultra Protocol (Infinium HD Ultra User Guide 11328087_RevB, Illumina, Inc., San Diego, CA). The Brassica 6K BeadChips were imaged using an Illumina HiScan system, and the SNP alleles were called using the Genotyping Module v1.9.4, within the GenomeStudio software suite v2011.1 (Illumina, Inc. San Diego, CA). Only SNPs with a percentage of missing data <30% across all genotypes and a minor allele frequency>0.05 as well as genotypes with a percentage of missing data < 20% across all SNPs were used for the following statistical analysis. From these 3910 SNPs, 3466 could be assigned to a physical map position derived from the reference information of the B. napus winter line Darmor-bzh (Chalhoub et al., 2014) (Data Sheet S2).
2.3. Statistical Analyses
2.3.1. Genome Positions of Trait Related Candidate Genes
A basic local alignment search tool (BLAST) search (Altschul et al., 1990) was performed with BLASTN (E-value ≤ 1e-03) between the reference sequences of potential A. thaliana as well as B. rapa genes and the reference sequences of B. napus (v4.1) (Chalhoub et al., 2014). All positions were used which had a Bit-score ≥ 100 and a BLAST identity ≥ 70%. The gene reference sequences are either based on the five A. thaliana chromosome sequences NC_003070.9, NC_003071.7, NC_003074.8, NC_003075.7, NC_003076.8, or on the B. rapa reference sequence GCF_000309985.1.
2.3.2. Adjusted Entry Means and Principal Component Analysis
The adjusted entry means (AEM) of each genotype-trait combination, which were the basis for all further analyses, were calculated for the agronomic and seed quality traits from the winter trial using model (1) and the spring trial using model (2):
where yijm was the observation of the ith genotype in the mth block at the jth location, μ an intercept term, gi the genotypic effect of the ith genotype, lj the effect of the jth location, bjm the effect of the mth block at the jth location, eijm the residual, yijkm the observation of the ith genotype in the mth block of the kth replication at the jth location, gi*lj the interaction effect of the ith genotype and the jth location, rjk the effect of the kth replicate at the jth location, bjkm the effect of the mth block in the kth replicate of the jth location, and eijkm the residual.
The repeatability h2 was calculated for the various traits according to Emrich et al. (2008). Using a principal component analysis (PCA) based on 89 SSR marker data for 398 of the 405 inbreds described by Bus et al. (2011) the 214 rapeseed inbreds of the winter trial were assigned to two clusters (WR-MCLUST groups 1 and 2), whereas no distinct clusters were observed for the 184 inbreds from the spring trial.
2.3.3. Assessment of Linkage Disequilibrium
In order to determine the physical map distance in which LD decays in our B. napus diversity set, r2 (the square of the correlation of the allele frequencies between all pairs of linked SNP loci) was calculated, where linked loci were defined as loci located on the same chromosome, and plotted against the physical distance in megabase pairs. The overall decay of LD was evaluated by nonlinear regression of r2 according to Hill and Weir (1988). The percentage of linked loci in significant LD was determined with the significance threshold of the 95% quantile of the r2-value among unlinked loci pairs, where unlinked loci were defined as loci located on different chromosomes. Pairwise modified Roger's distance (MRD) estimates between all inbreds and the WR-MCLUST groups 1–2 were calculated according to Wright (1978).
2.3.4. GWAS - Multiple Forward Regression
The genome-wide association analyses of the agronomic and seed quality traits were performed as a multiple forward regression analysis (Van Inghelandt et al., 2012) to take into account the LD between SNPs to identify those SNP marker combinations which explain best the genotypic variation. The Bonferroni correction (α = 0.05) was used as a P-to-enter criterion. We added the SNP with the lowest P-value in the single marker analysis, as fixed cofactor in the analyses, when examining all remaining SNP markers for their association with the phenotype. For each of the 30 traits, this procedure was repeated until no more significant SNPs could be selected. The above mentioned single marker analysis was based on the PK method (Stich et al., 2008):
where Mlm was the adjusted entry mean of the lth inbred carrying allele m, am the effect of the mth allele, vu the effect of the uth column of z columns of the population structure matrix P, g the residual genetic effect of the lth entry, and elm the residual. The first and second principal component calculated based on the 89 SSR markers (Bus et al., 2011) was used as P matrix. The variance of the random effect g* = {, …, } was assumed to be Var(g*) = 2Kσ, where σ was the residual genetic variance. The kinship coefficient Kij between inbreds i and j were calculated based on the above mentioned SSR markers according to:
where Sij was the proportion of marker loci with shared variants between inbreds i and j and T the average probability that a variant from one parent of inbred i and a variant from one parent of inbred j are alike in state, given that they are not identical by descent (Bernardo, 1993). The optimum T-value was calculated according to Stich et al. (2008) for each trait. To perform the above outlined association analysis, the R package EMMA (Kang et al., 2008) was used. We chose as a significance threshold the Bonferroni correction (α = 0.05). The association analysis was performed for the inbreds of the spring trial, the inbreds of the winter trial, and for each of the two WR-MCLUST groups. For the separate association analyses of the two WR-MCLUST groups, only the kinship matrix K but no P matrix was considered.
If not stated differently, all analyses were performed with the statistical software R (R Development Core Team, 2011).
3. Results
The repeatability h2 of the agronomic and seed quality traits ranged for the winter trial from 0.26 to 0.96 and for the spring trial from 0.33 to 0.96. The AEM of the agronomic and seed quality traits were approximately normally distributed (Figures 1, 2). The proportion of the phenotypic variance of the agronomic and seed quality traits collected in the winter trial which was explained by population structure ranged from 0.00 to 0.79 (Table 1). For the winter trial, the average MRD (±standard error) of the inbreds of the WR-MCLUST group 1 vs. the inbreds of the WR-MCLUST group 2 was 0.45 (±0.01), whereas the average MRD of the inbreds of the winter trial vs. the inbreds of the spring trial was 0.31 (±0.01).
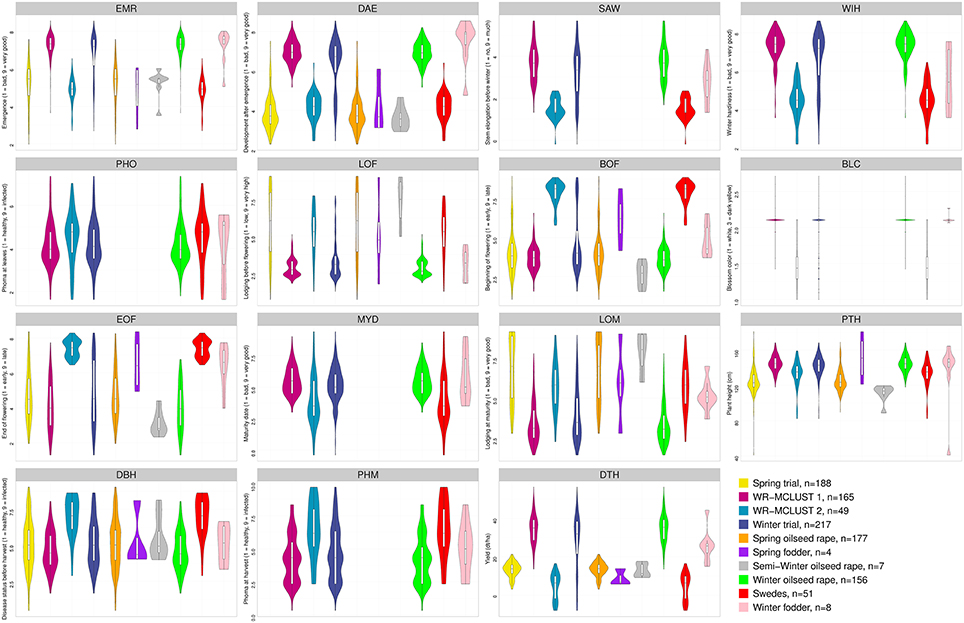
Figure 1. Frequency distribution of adjusted entry means determined for 15 agronomic traits of the B. napus inbred lines for the spring and winter trial as well as the two WR-MCLUST groups and for six different germplasm types represented by different colors. Yellow plots represent the 188 inbreds of the spring trial and blue plots the 217 inbreds of the winter trial. The number of genotypes for each germplasm type is given in the legend. In each plot, a marker denotes the median of the data, a box indicates the interquartile range, and spikes extend to the upper and lower adjacent values, overlaid is the density.
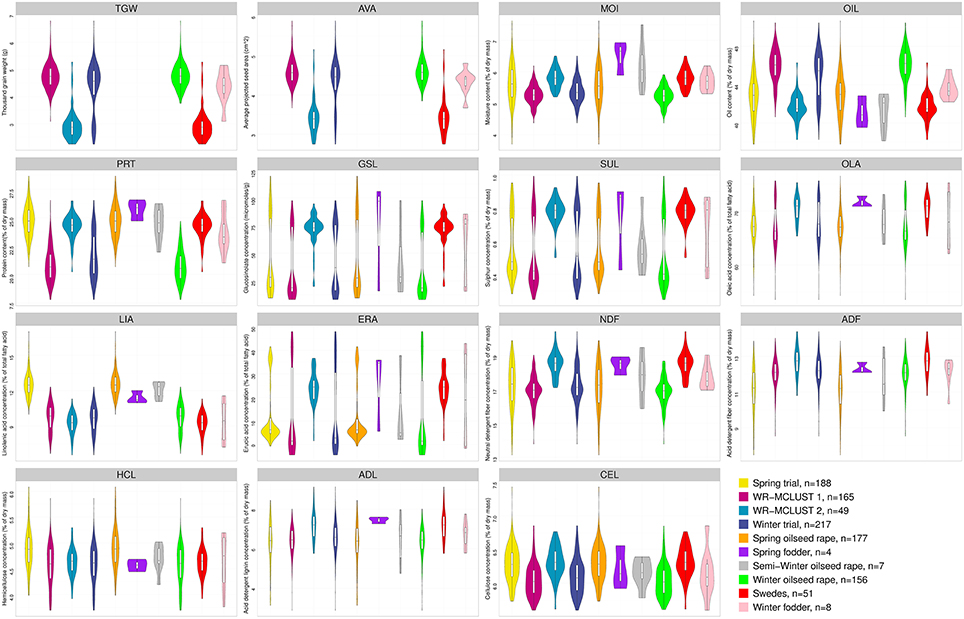
Figure 2. Frequency distribution of adjusted entry means determined for 15 seed quality traits of the B. napus inbred lines for the spring and winter trial as well as the two WR-MCLUST groups and for six different germplasm types represented by different colors. Yellow plots represent the 188 inbreds of the spring trial and blue plots the 217 inbreds of the winter trial. The number of genotypes for each germplasm type is given in the legend. In each plot, a marker denotes the median of the data, a box indicates the interquartile range, and spikes extend to the upper and lower adjacent values, overlaid is the density.
In the GWAS which was performed as a multiple forward regression analysis with 3910 SNPs, we observed 58 significant [P < 1.28e-05 (Bonferroni correction of α = 0.05)] SNP-trait associations for 12 of the 15 examined seed quality traits for the 184 B. napus inbreds of the spring trial. The SNP-seed quality trait associations explained individually from 0.0 to 63.1% of the phenotypic variance. For the 12 seed quality traits, between 1 and 21 SNPs were identified to be significantly associated with a single seed quality trait. These associations explained, on average, in a simultaneous fit 38.9% of the phenotypic variance for a single seed quality trait with a range from 11.7 to 87.2% (Table 2).
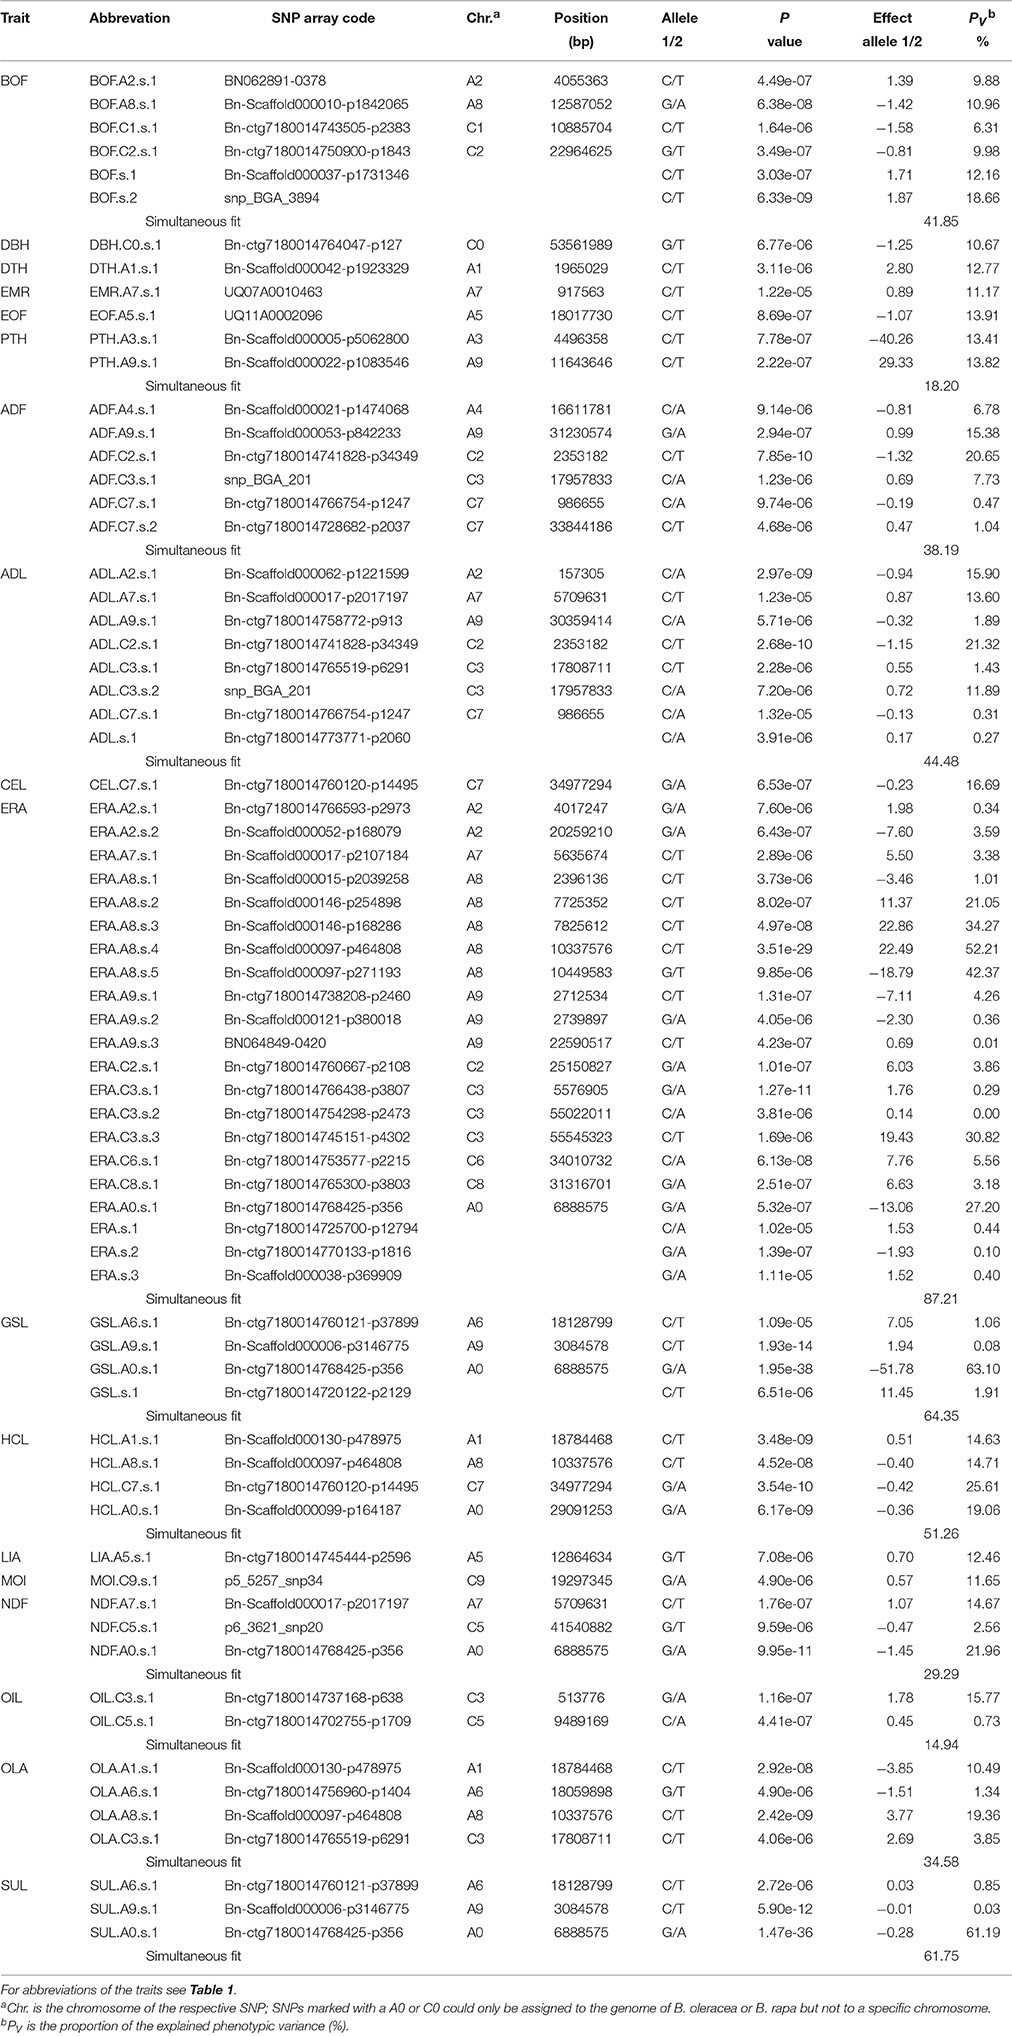
Table 2. Single nucleotide polymorphism (SNP)-trait associations with P < 1.28e-05 (Bonferroni correction of α = 0.05) across the 184 inbreds of the spring trial.
We observed for the 214 B. napus inbreds of the winter trial, 54 significant SNP associations for 12 seed quality traits (Table 3). We identified between 1 and 14 SNPs to be significantly [P < 1.28e-05 (Bonferroni correction of α = 0.05)] associated with a single seed quality trait. The identified loci explained individually from 0.0 to 67.3% of the phenotypic variance. The SNP-trait associations explained, on average, in a simultaneous fit 35.2% of the phenotypic variance for a single trait with a range of 9.8–76.7% (Table 3).
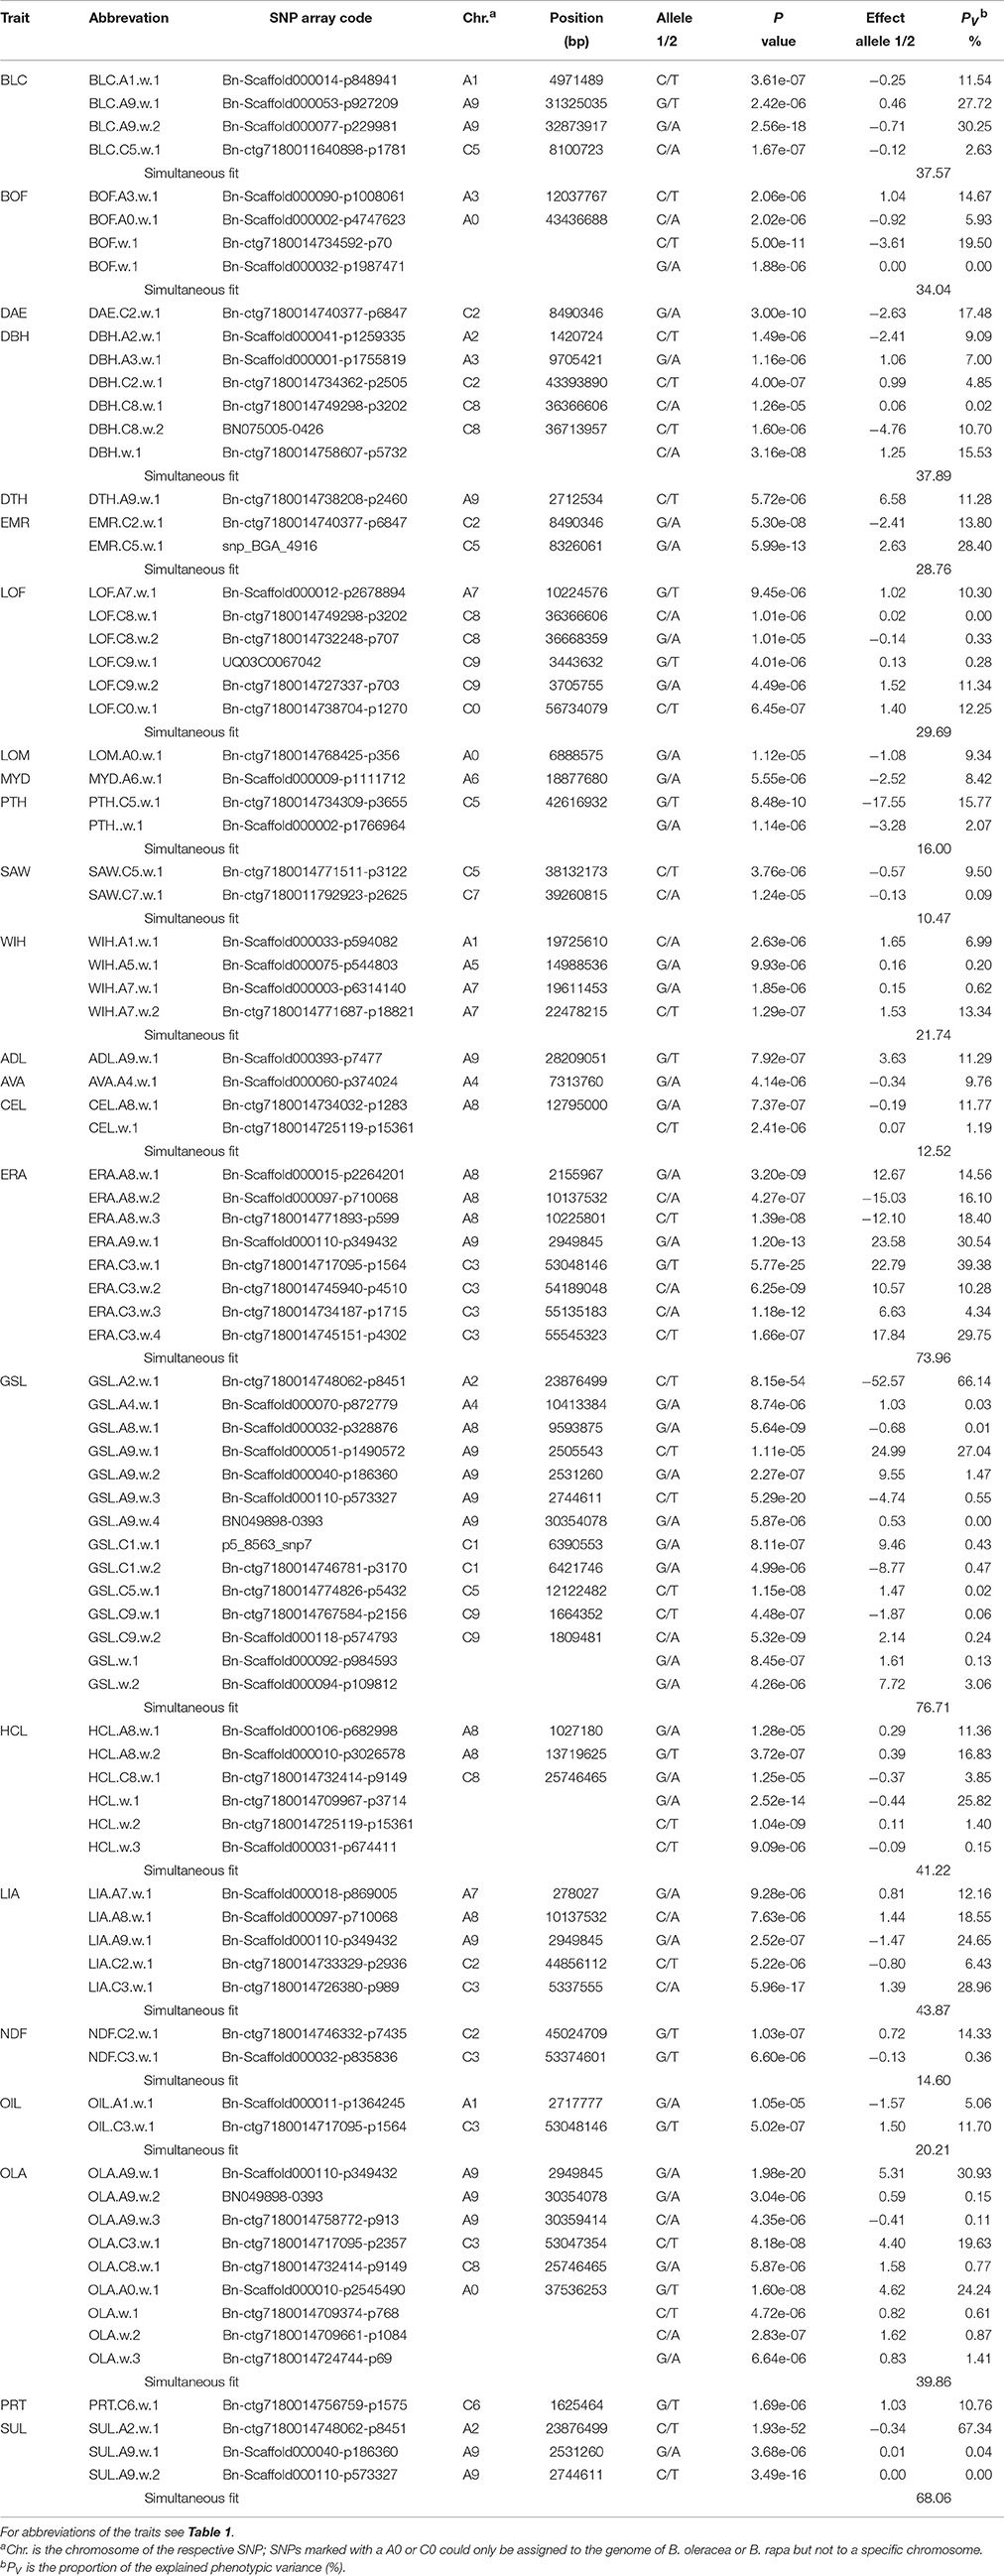
Table 3. Single nucleotide polymorphism (SNP)-trait associations with P < 1.28e-05 (Bonferroni correction of α = 0.05) across the 214 inbreds of the winter trial.
For the association analysis of the agronomic traits, we observed for the inbreds of the spring trial 12 SNP-trait associations for six of the 15 agronomic traits with a P < 1.28e-05 (Table 2). These significant associations explained individually from 6.3 to 18.7% of the phenotypic variance. Furthermore, for these traits, we found 1–6 SNP-trait associations which explained, on average, in a simultaneous fit 18.1% of the phenotypic variance (Table 2).
For the winter trial, we found 34 significant SNP-trait associations for 12 of the 15 agronomic traits (Table 3) and they explained individually from 0.0 to 30.2% of the phenotypic variance. We observed 1–6 significant SNPs to be associated with a trait and they explained on average in a simultaneous fit 21.9% (range 8.4–37.9%) of the phenotypic variance (Table 3).
For the seed quality trait ERA a co-localized SNP association between the spring and the winter trial could be identified on chromosome C3, whereas no associated SNP co-localizations between the spring and the winter trial were examined for the agronomic traits (Tables 2, 3).
In a BLAST search within a distance of 2.5 Mbp around the SNP-trait associations, 28 hits of potential candidate genes with a BLAST-score of ≥100 and a sequence identity of ≥70% to A. thaliana or B. rapa could be found for the agronomic SNP-trait associations of the inbreds of the spring trial and 34 candidate gene hits for the inbreds of the winter trial. Furthermore, for the seed quality SNP-trait associations 82 candidate gene hits were identified for the inbreds of the spring trial and 105 candidate gene hits for the inbreds of the winter trial (Tables 4, 5, Tables S1–S6).
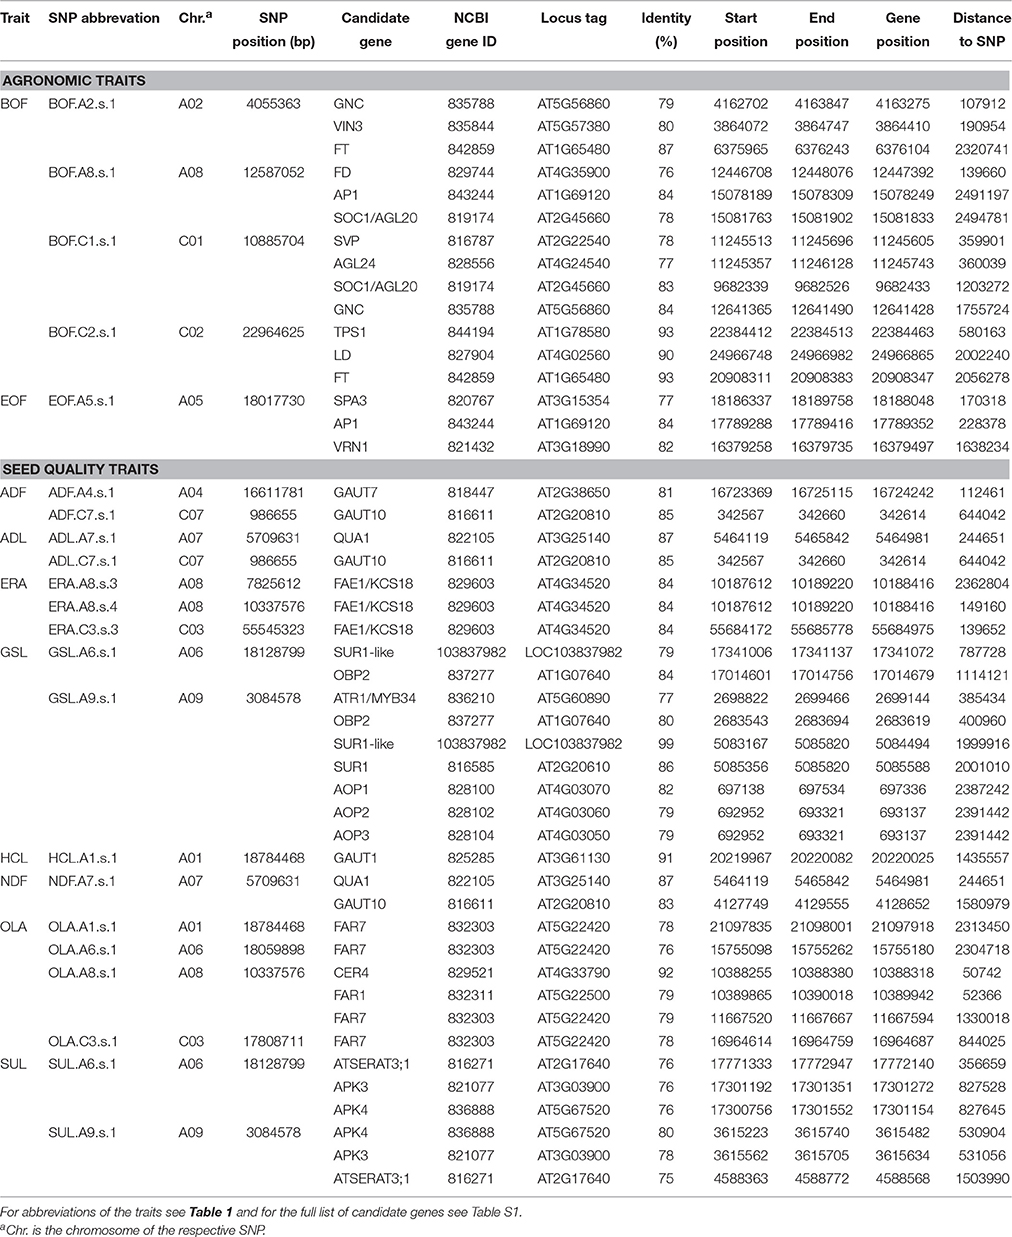
Table 4. BLAST search results for pre-selected candidate genes for the single nucleotide polymorphism (SNP)-trait associations with P < 1.28e-05 (Bonferroni correction of α = 0.05) within a distance of 2.5 Mbp around the SNP-trait associations across the 184 inbreds of the spring trial.
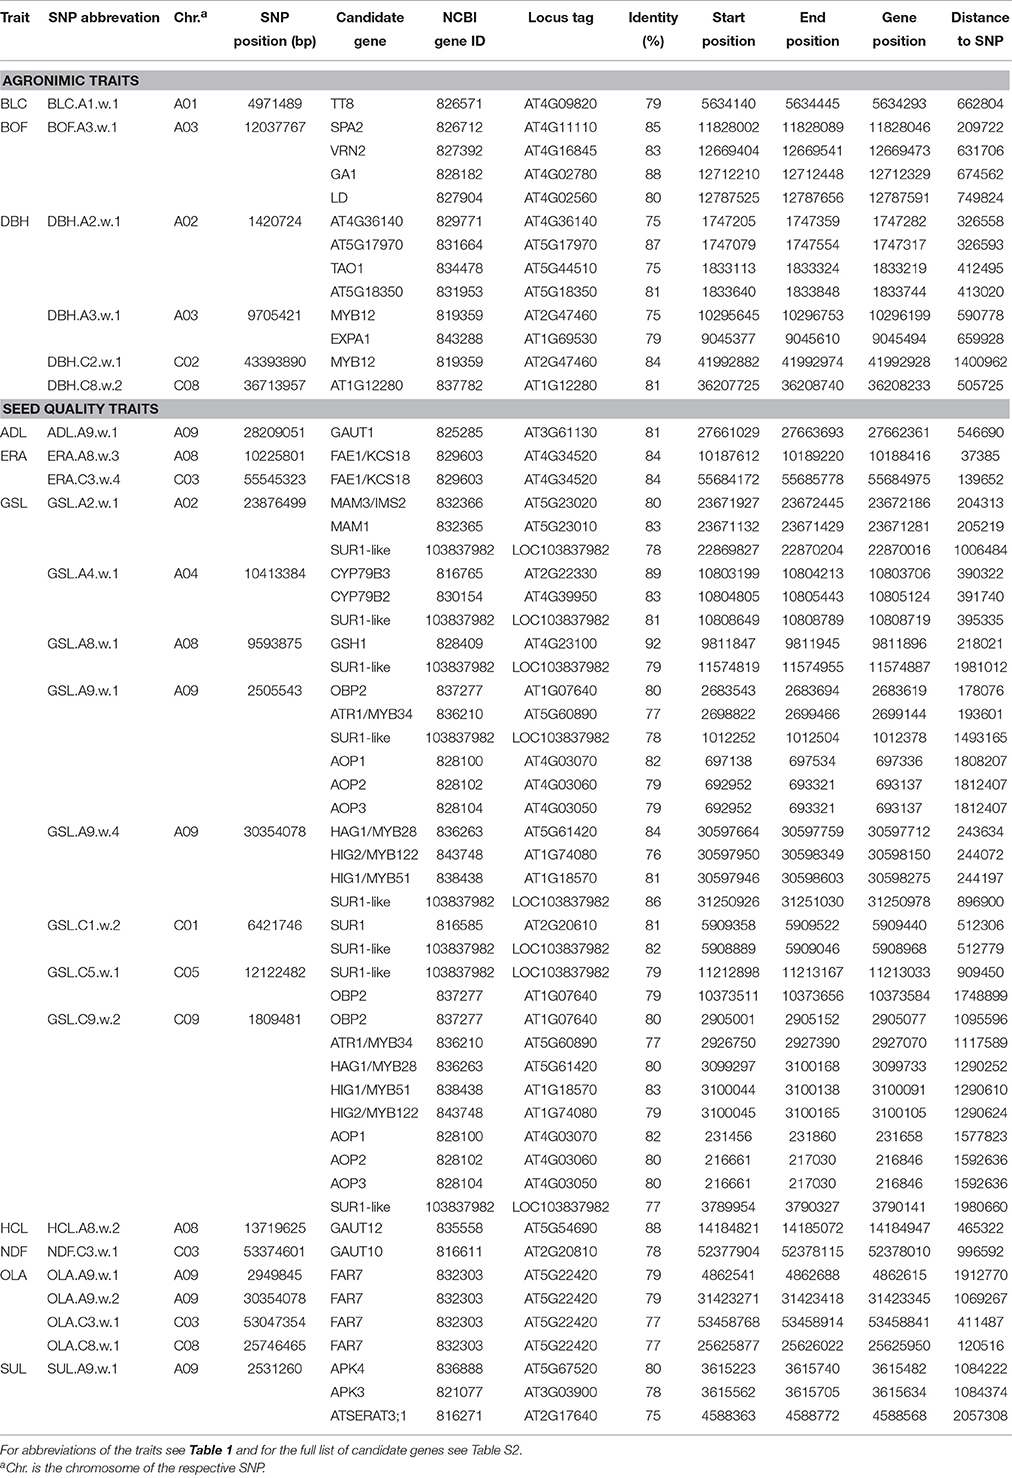
Table 5. BLAST search results for pre-selected candidate genes for the single nucleotide polymorphism (SNP)-trait associations with P < 1.28e-05 (Bonferroni correction of α = 0.05) within a distance of 2.5 Mbp around the SNP-trait associations across the 214 inbreds of the winter trial.
4. Discussion
In our B. napus diversity set, the nonlinear trend line of the LD measure r2 decayed below the significance threshold within a distance of 677 kb. Bus et al. (2011) estimated based on 89 SSR markers that the pairwise LD within our B. napus diversity set decayed within a genetic map distance of ~1 cM. This corresponds to about 500 kb (Arumuganathan and Earle, 1991) and is in good accordance to the value observed in our study. Furthermore, the LD observed by Delourme et al. (2013) in a B. napus collection of 313 inbred lines decayed within 0.6–0.7 cM (~300–350 kb) for their whole collection and within 1.2 cM for their 00İ winter types. The extent of LD in the collection of Delourme et al. (2013) varied depending on the linkage group and the collection between 0.2 and 3.4 cM (~0.1–1.7 Mbp). In addition, Qian et al. (2014) identified in the allopolyploid B. napus genome on average an around ten times more rapidly decayed mean LD for the A-genome (0.25–0.30 Mbp) than for the C-genome (2.00–2.50 Mbp). Due to the variation within the decay of LD between B. napus subgroups and even between chromosomes, potential candidate genes for SNP-trait associations were searched in our study 2.5 Mbp up- and downstream of each association.
In our study, 1577 SNPs mapped to the A genome, whereas 1889 SNPs mapped to the C genome of B. napus which is on average one SNP every 0.7 cM expecting that the B. napus genome has a length of ~2500 cM (Ecke et al., 2010; Delourme et al., 2013). As the pairwise LD within our B. napus diversity set decayed within a genetic map distance of ~1 cM (677 kb), a total of 96.8% of the adjacent SNPs on the A genome and 83.0% of the adjacent SNPs on the C genome had a distance smaller than the average range of LD. These results indicate that the SNP marker density of our study is expected to provide a sufficient power to detect SNP-trait associations in the B. napus diversity set.
SNP-trait associations detected for the agronomic traits in the spring and winter trial explained in a simultaneous fit on average 18.1 and 21.9% of the phenotypic variance, respectively (Tables 2, 3). This is in accordance with the results of Mei et al. (2009) who observed, on average, an explained phenotypic variance for flowering time and plant height of 16.4% in a QTL analysis based on a segregating population.
The SNP-trait associations for the seed quality traits in the spring and winter trial explained in a simultaneous fit on average 38.9 and 35.2% of the phenotypic variance, respectively (Tables 2, 3). These values were much higher than those observed for the agronomic traits which indicates that the latter are genetically more complex inherited than the rather mono- or oligogenic seed quality traits.
For most of the examined agronomic and seed quality traits, a couple of major SNP-trait associations with a valuable percentage of explained phenotypic variance were identified which could be useful for MAS in B. napus (Tables 2, 3, Figures 3, 4, Tables S1, S2, Figures S3, S4).
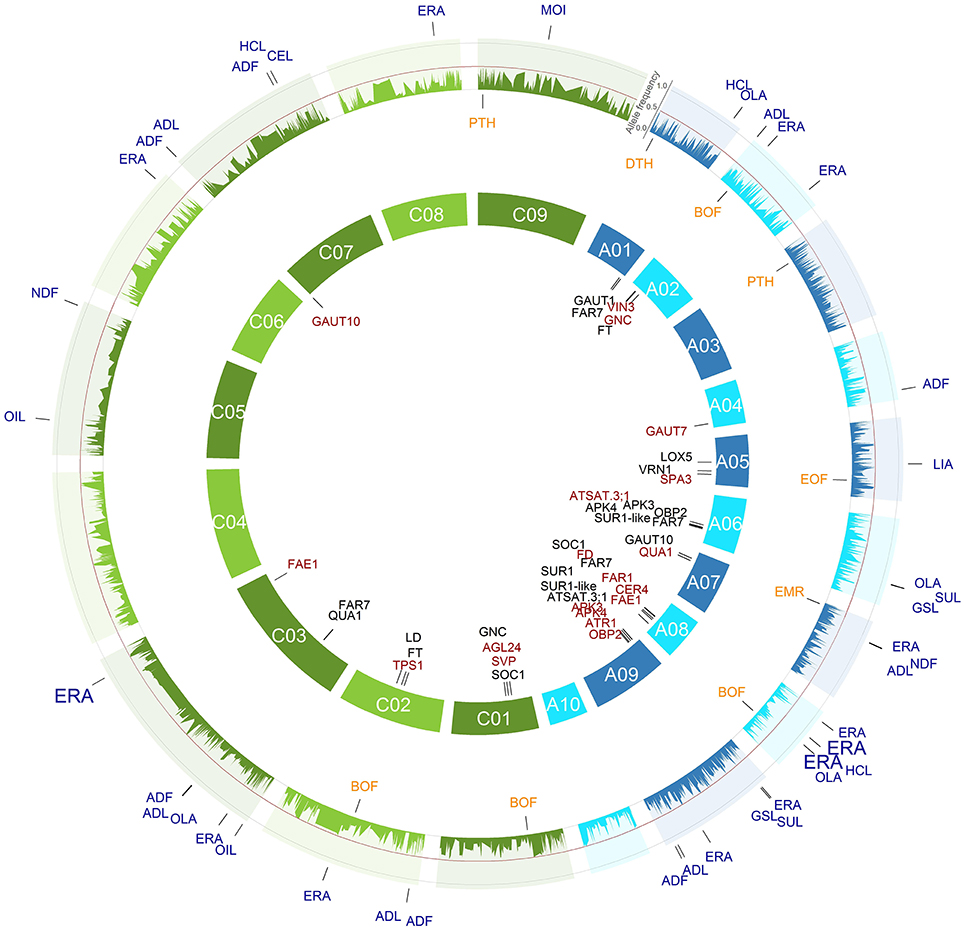
Figure 3. All single nucleotide polymorphism (SNP)-trait associations with a P < 1.28e-05 (Bonferroni correction of α = 0.05) identified across the 184 inbreds of the spring trial and their respective positions are marked on the B. napus genome. The 3466 SNPs with their minor allele frequencies in the spring trial are given in the outer circle. The SNPs associated with the agronomic SNP-trait associations are plotted in orange below the allele frequency circle and the seed quality SNP-trait associations in blue outside the allele frequency circle. The size of the letters is related to the proportion of the variance explained by the associations. In the inner circle of the 19 chromosomes, the candidate genes were plotted to their mapping position on the B. napus reference genome. The A genome is colored blue and the C genome green.
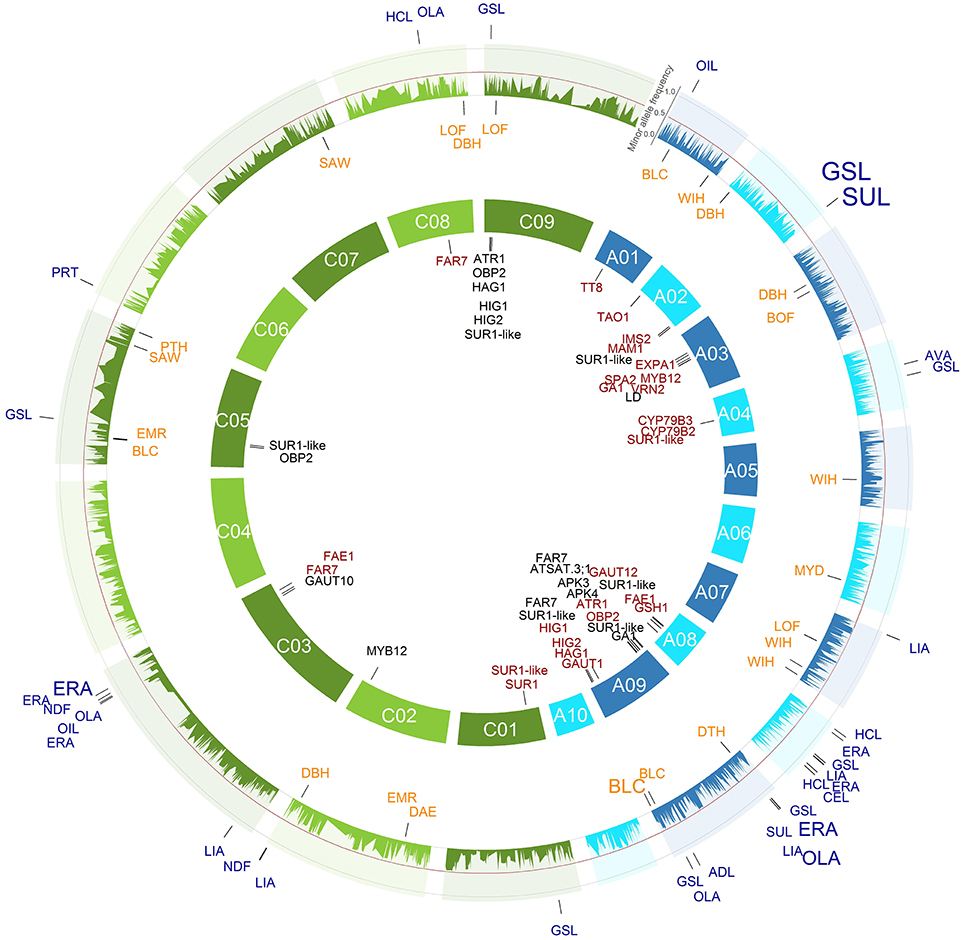
Figure 4. All single nucleotide polymorphism (SNP)-trait associations with a P < 1.28e-05 (Bonferroni correction of α = 0.05) identified across the 214 inbreds of the winter trial and their respective positions are marked on the B. napus genome. The 3466 SNPs with their minor allele frequencies in the winter trial are given in the outer circle. The SNPs associated with the agronomic SNP-trait associations are plotted in orange below the allele frequency circle and the seed quality SNP-trait associations in blue outside the allele frequency circle. The size of the letters is related to the proportion of the variance explained by the associations. In the inner circle of the 19 chromosomes, the candidate genes were plotted to their mapping position on the B. napus reference genome. The A genome is colored blue and the C genome green.
4.1. Genome-Wide Associations of Agronomic Traits
4.1.1. Begin of Flowering (BOF) and End of Flowering (EOF)
In B. napus breeding, flowering time adaptation is one of the breeding goal (Wang et al., 2011a). For example, spring types flower early without vernalization to utilize fully the short vegetation period in regions with strong winters. Therefore, alleles which have a low frequency in a germplasm type and a desirable effect on the trait of interest could be selected for to improve this trait. The allele one at the SNP-BOF associations BOF.A8.s.1, BOF.C1.s.1, and BOF.C2.s.1 leads to an early flowering and occurs with a frequency of 84.3, 5.4, and 37.3% in the spring OSR cultivars (Figure 3, Table 2). According to this, these associations except for BOF.A8.s.1 at which the favorable allele has already a frequency of 47.8%, could also be used for MAS to also improve early flowering in the winter OSR.
High temperatures at flowering reduce yield of B. napus (Angadi et al., 2000). Thus, with climate change, high temperatures at flowering are expected to occur more often. Therefore, it could be advantageous for some geographic regions to breed early flowering winter OSR cultivars. The early flowering alleles of BOF.C1.s.1, and BOF.C2.s.1 which have low frequencies (1.6 and 3.8%) in the winter OSR cultivars might be interesting for breeding early flowering cultivars. In contrast, the allele which causes late flowering at BOF.A2.s.1 is a major allele in the spring and winter OSR but not present in the semi-winter OSR. From this it follows that the early flowering allele in the semi-winter OSR might be a potential target for MAS of early flowering cultivars in the spring and winter OSR.
The SNP-BOF associations BOF.A2.s.1 and BOF.A3.w.1 co-located with the QTL dtf2.1 and dtf2.3 as well as dtf3.1 - dtf3.4 identified by Udall et al. (2006) and Quijada et al. (2006) in a B. napus DH population and its testcross progeny. In addition, Wang et al. (2011a) identified a major flowering time QTL on chromosome A3 at 49.8 cM which co-localized with a putative rapeseed ortholog of FRIGIDA. Furthermore, Quijada et al. (2006) also identified the QTL dtf12b at 33.1 and 36.7 cM which is in good accordance with our BOF.C2.1 association. The validation of genome regions in several experiments with different environmental conditions as well as different genetic background suggests that these regions have a major impact on the trait of interest.
Several known genes which are related to flowering could be localized within a distance of up to 2.5 Mbp to the associations for BOF identified in this study (Tables 4, 5). Only 580 kb downstream of BOF.C2.s.1 the TREHALOSE-6-PHOSPHATE SYNTHASE 1 (TPS1) which causes in case of a loss A. thaliana to flower extremely late could be identified (Wahl et al., 2013). The FLOWERING LOCUS T gene (FT) which is antagonistic with its homologous gene, TERMINAL FLOWER1 (TFL1) and promotes flowering together with the gene LFY could be mapped 2.3 Mbp upstream of BOF.A2.s.1 and 2.1 Mbp downstream of BOF.C2.s.1. Furthermore, the gene GNC which is a GATA transcription factor act upstream from the flowering time regulator SUPPRESSOR OF OVEREXPRESSION OF CONSTANS1 (SOC1/AGL20) to directly repress SOC1 expression and thereby repress flowering (Richter et al., 2013) and could be located only 108 kb upstream of BOF.A2.s.1 as well as 1.8 Mbp upstream of BOF.C1.s.1. In addition, 360 kb upstream of BOF.C1.s.1 the MADS-box gene AGAMOUS-LIKE 24 (AGL24) which promotes flowering by a positive-feedback loop with SOC1 at the shoot apex (Liu et al., 2008) could be mapped. The gene FD first identified by Koornneef et al. (1991) in A. thaliana could be mapped within a distance of 140 kb downstream of the BOF.A8.s.1. The FD gene activates in a complex with the FLOWERING LOCUS T (FT) protein so-called floral identity genes such as APETALA1 (AP1) (Wigge et al., 2005) which could be mapped to BOF.A8.s.1 and EOF.A5.s.1. The VERNALIZATION2 (VRN2) gene stably maintains FLOWERING LOCUS C (FLC) repression after a cold treatment (Gendall et al., 2001) and could be mapped to BOF.A3.w.1 for the inbreds of the winter trial. Further research is needed to examine which are the causal polymorphisms in these genome regions.
For the trait end of flowering (EOF), we identified one significant SNP-EOF association EOF.A5.s.1 which explained 13.9% of the phenotypic variance (Figure 3, Table 2). The late ending of flowering allele is already present in 67.2 and 85.7% of the spring and winter OSR cultivars in this study. The low number of EOF-SNP associations might be due to the fact that this trait was evaluated at only four locations in contrast to the trait BOF which has been assessed at seven locations.
4.1.2. Plant Height (PTH)
The significant SNP-PTH association PTH.A3.s.1 was located in the same genome region as the QTL ph3.3 for plant height which was detected in a DH population on chromosome A3 at 36.5 cM (Udall et al., 2006) (Figure 3, Table 2). If PTH.A3.s.1 and ph3.3 characterize the same locus, however, requires further research.
The SNP-PTH association PTH.A3.s.1 caused a reduction in plant height and is present in 93.1% of the spring OSR but only present in 46.2% of the winter OSR. Furthermore, the allele which reduce the plant height at the locus PTH.A9.s.1 is only present in 4.4 and 11.5% of the spring and winter OSR, respectively. From this it follows that both SNP-PTH associations could be useful to reduce the plant height in B. napus winter OSR variaties.
4.1.3. Disease Status before Harvest (DBH)
The trait DBH is a summary score and included various diseases before harvest, such as Alternaria brassicae, Sclerotinia sclerotiorum, and Leptosphaeria maculans. The SNP-DBH associations DBH.A2.w.1 and DBH.A3.w.1 were in good accordance with S. sclerotiorum resistance QTL on chromosome A2 at 11.0 cM and on chromosome A3 at 68.0 cM detected by Zhao et al. (2006) (Figure 4, Table 3).
The first allele of DBH.A2.w.1 which is present in 2.7% of the winter OSR and 6.9% of the spring OSR is responsible for an improved disease status, whereas the allele of DBH.A3.w.1 which causes the improved disease status is already present in 88.0% of the winter OSR and 40.2% of the spring OSR. Also the resistance allele of DBH.C8.w.2 is already present in most of the modern cultivars. Thus, DBH.A2.w.1 might be a promising candidate for MAS to increase the disease status in winter OSR as well as spring OSR.
4.1.4. Yield (DTH)
We found the two significant association DTH.A1.s.1 and DTH.A9.w.1 and the first alleles caused an increase in seed yield between 2.8 and 6.6% (Figures 3, 4, Tables 2, 3). However, the low number of significant SNP associations for this quantitative and highly complex trait is most likely due to the fact that the trait was examined at only two locations. This suggests that the SNP-DTH associations are not directly usable for MAS.
4.2. Genome-Wide Associations of Seed Quality Traits
4.2.1. Seed Oil Content (OIL)
B. napus is planted for oil production and, therefore, an maximization of oil content in the seeds is a major goal in the breeding process (Zhao et al., 2007; Würschum et al., 2012). In our study, four significant SNP-OIL associations were detected on the chromosomes A1, C3, and C5 for the inbreds of the spring and winter trial (Figures 3, 4, Tables 2, 3). The position of the identified SNP-OIL association OIL.C3.w.1 was in accordance with that of the QTL detected by Qiu et al. (2006) on the chromosome C3 at 88.9 and 89.7 cM using a TNDH population. This result validates the OIL.C3.w.1 association and indicates that this genome region seems to be of particular importance.
The allele which is responsible for an increase of oil content is present in most of the spring and winter OSR for the associations OIL.A1.w.1 and OIL.C3.s.1, whereas it is only present in same of the spring and winter OSR for the associations OIL.C3.w.1 and OIL.C5.s.1 and, thus, provides an opportunity for MAS.
4.2.2. Erucic Acid Concentration (ERA; C22:1)
We detected several significant SNP-ERA associations which explained in a simultaneous fit for the spring trial, the winter trial, and the WR-MCLUST group 1 with 87.2, 74.0, and 80.5% a large proportion of the phenotypic variance, respectively (Figures 3, 4, Tables 2, 3). Our findings are in good accordance with the results of QTL for erucic acid concentration of previous studies (Barret et al., 1998; Fourmann et al., 1998; Burns et al., 2003; Qiu et al., 2006; Basunanda et al., 2007; Zhao et al., 2007; Smooker et al., 2011). This supports that the diversity set used in our study is a powerful tool to dissect quantitative traits.
The mapping positions of the major SNP-ERA associations which were observed for the summer trial were close by or in some cases even identical to that observed for the winter trial (Tables 2, 3, Table S3). These results are in accordance with the breeding history that the low erucic acid variation in the winter OSR has been introduced from the spring cultivar “Liho” (Friedt and Snowdon, 2010).
Barret et al. (1998) isolated two α-ketoacyl-CoA synthase sequences from a B. napus immature embryocDNAlibrary. This enzyme controls erucic acid synthesis in B. napus seeds and was first described in A. thaliana where it is encoded by the FATTY ACID ELONGATION1 (FAE1 or KCS18) gene (James and Dooner, 1990; James et al., 1995). Using a BLAST search, we could map this gene of A. thaliana very closely to the major SNP-ERA associations on the chromosomes A8, A9, and C3 (Tables 4, 5). This finding is in accordance with results of Barret et al. (1998) who already localized these FAE1 genes to the loci E1 and E2 on the chromosomes A8 and C3 which were already known to be tightly linked to erucic acid content (Jourdren et al., 1996). Qiu et al. (2006), Basunanda et al. (2007), and Smooker et al. (2011) could specify these positions on the chromosome A8 and C3 by QTL analyses. Li et al. (2014) identified the two associations with erucic acid content on chromosome A8 at 9.5 Mbp and C3 at 63.7 Mbp within a distance of 233 and 128 kb away from the genes BnaFAE1.1 and BnaFAE1.2, respectively. Thus, our examined SNP-ERA associations on chromosome A8 at 10.3 Mbp and on chromosome C3 at 55.5 Mbp were located in the same genome region as in previous studies and the FAE1 genes were within the range of LD and, therefore, very likely responsible for our identified associations. The small differences to the study of Li et al. (2014) were most likely due to the fact that the SNP in our study were mapped to the recently published B. napus genome sequence.
4.2.3. Glucosinolate Concentration (GSL)
Plant breeders have strongly reduced the levels of the unhealthy and uneatable glucosinolates in the seeds to be able to use the protein-rich seed cake as an animal feed supplement (Halkier and Gershenzon, 2006). In our study, a number of significantly associated SNPs could be detected which explained even up to 66.1% of the phenotypic variance (Figures 3, 4, Tables 2, 3). Our findings are in accordance with results of previous studies which identified several of the marker-trait associations at the same positions (Basunanda et al., 2007; Feng et al., 2012; Harper et al., 2012; Li et al., 2014; Gajardo et al., 2015).
Hasan et al. (2008) suggested that effective molecular markers for MAS could be used to introduce new genetic variation for low seed glucosinolate content. However, the results of our study suggested that associations which explained high percentages of the phenotypic variation were already present in most of the modern cultivars with alleles which causes low glucosinolate content in the seeds. These low glucosinolate content alleles most likely derived from the strong bottleneck selection for low seed glucosinolate content (so-called double-low, 00, or canola quality) using the low-glucosinolate spring rape cultivar “Bronowski” (Hasan et al., 2008). Nevertheless, the associations GSL.C9.w.2, GSL.w.1, GSL.w.2, GSL.A9.s.1, and GSL.A6.s.1 still have a higher proportion of the undesirable allele in modern cultivars and are promising targets for for MAS.
Several known glucosinolate genes could be mapped near the associations for GSL by BLAST searches (Tables 4, 5). The candidate genes MAM1 and MAM3/IMS2 (methylthioalkylmalate synthase 1/3) of A. thaliana which catalyzes the condensation step of the first three elongation cycles of the Glucosinolate biosynthesis pathway (Kroymann et al., 2001; Textor et al., 2004) were located next to GSL.A2.w.1. Furthermore, the myb transcription factor ATR1/MYB34 of A. thaliana controls indolic glucosinolate homeostasis (Celenza et al., 2005) and could be mapped in physical proximity to the associations GSL.A9.s.1 and GSL.A9.w.2. Our findings are in accordance with results of Hasan et al. (2008) who also identified MAM1 and ATR1 as potential candidate genes for QTLs of glucosinolate content at these genome positions of B. napus. In addition, the myb transcription factor ATR1 could also be located by a BLAST search next to GSL.C9.w.2 which might be duo to the fact that this is a homolog genome region to the genome region on chromosome A9 (Parkin et al., 2003).
Furthermore, ~200 kb upstream of the ATR1 transcription factor on chromosome C9 (GSL.C9.w.2) as well as next to GSL.A9.w.4 the HIGH ALIPHATIC GLUCOSINOLATE 1 (HAG1) gene (also known as MYB28) which is a positive regulator of aliphatic methionine-derived glucosinolates (Gigolashvili et al., 2007b) was localized. This HAG1 gene was also detected by Harper et al. (2012) and Li et al. (2014) as a candidate gene for glucosinolate content. Next to ATR1 also HIG1/MYB51 and HIG2/MYB122 are involved in the transcriptional regulation of indole glucosinolate biosynthesis (Gigolashvili et al., 2007a; Frerigmann and Gigolashvili, 2014) and could be mapped to the region of GSL.A9.w.4 at the end of chromosome A9.
Beyond that additional candidate genes like the OBF BINDING PROTEIN2 OBP2 which upregulates glucosinolate biosynthesis (Skirycz et al., 2006), the cytochrome P450s CYP79B2 and CYP79B3 catalyze controlled by the transcription factor ATR1 (Skirycz et al., 2006) the conversion of tryptophan to indole-3-aldoxime (IAOx) which is a precursor to IAA and indole glucosinolates (Hull et al., 2000; Mikkelsen et al., 2000), and SUR1 of A. thaliana as well as SUR1-like of B. rapa (Zang et al., 2009) which was characterized as the C-S lyase in glucosinolate biosynthesis (Mikkelsen et al., 2004) could be identified. However, all these candidate genes have to be validated in additional approaches like RNA-seq analysis, gene overexpression or gene knockout.
4.3. Co-Localizing SNP-Trait Associations
We detected 34 SNP-trait associations which co-localized between two or more different traits (Figure 5). For the traits OLA, ERA, ADL, GSL, HCL, and SUL we found more than six SNP-trait associations which were co-localizing with other traits. The trait pairs with the highest number of identical SNP-trait associations were GSL-SUL, ERA-OLA, OLA-HCL, HCL-CEL, and ADL-ADF. With these co-localizing SNP-trait associations, we identified loci which were affecting two or more different traits. These traits, like glucosinolates (GSL) which are a group of sulfur-rich secondary metabolites, and the sulfur concentration (SUL), were tightly positive correlated between the trait pairs (Figures 6, 7 and Figures S1, S2). Such co-localizing SNP-trait associations can be an advantage in plant breeding if the effect of an allele is beneficial for both traits.
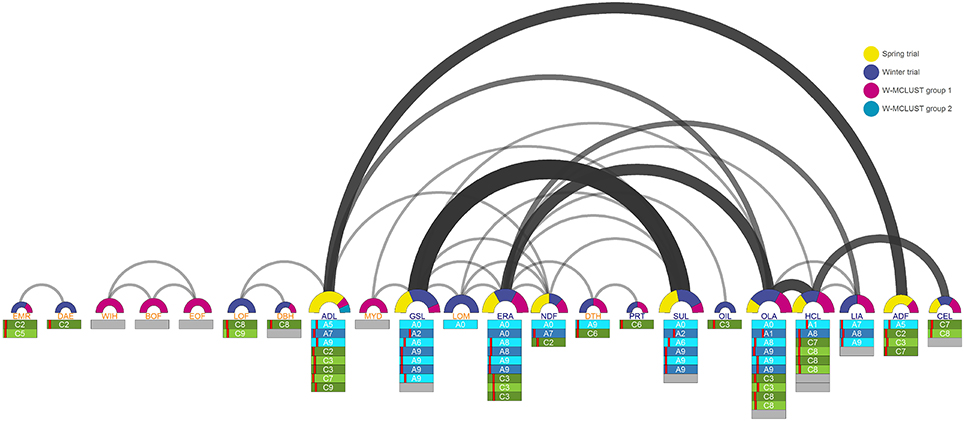
Figure 5. Arcdiagram of co-localizing SNP-trait associations between two or more traits for the agronomic and seed quality traits. The width of the arcs as well as the size of the semicircles are related to the number of co-localizing SNP-trait associations between the connected traits. The colors of the semicircles represent the distribution of the co-localizing SNP-trait associations to the spring trial, winter trial, and the WR-MCLUST groups 1 and 2. The bars below the traits symbolize the chromosomes and the red dashes the position of the respective co-localizing SNP-trait associations on these chromosomes. The chromosomes of the A genome are colored blue and the chromosomes of the C genome green. Unknown chromosome positions are colored gray.
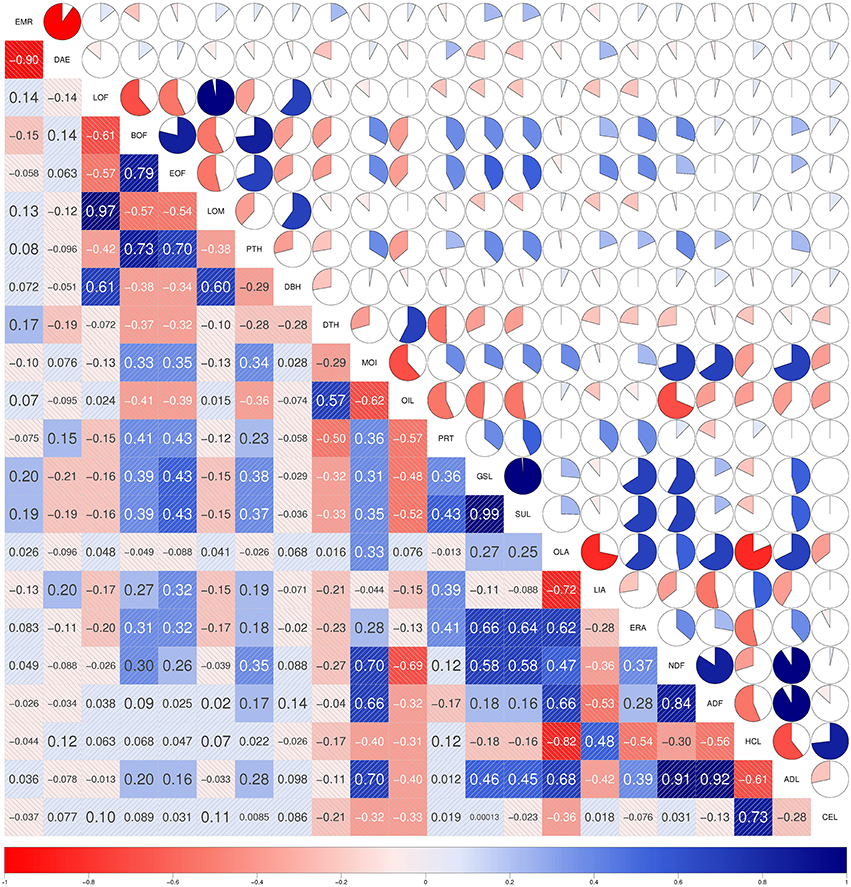
Figure 6. Correlations of the agronomic and seed quality traits across the 188 inbreds of the spring trial. In the diagonal panel the traits are listed. In the upper panel the filled portion of the pie and in the lower panel the depth of the shading as well as the font size indicate the magnitude of the correlations. Negative correlations are colored red and positive correlations blue.
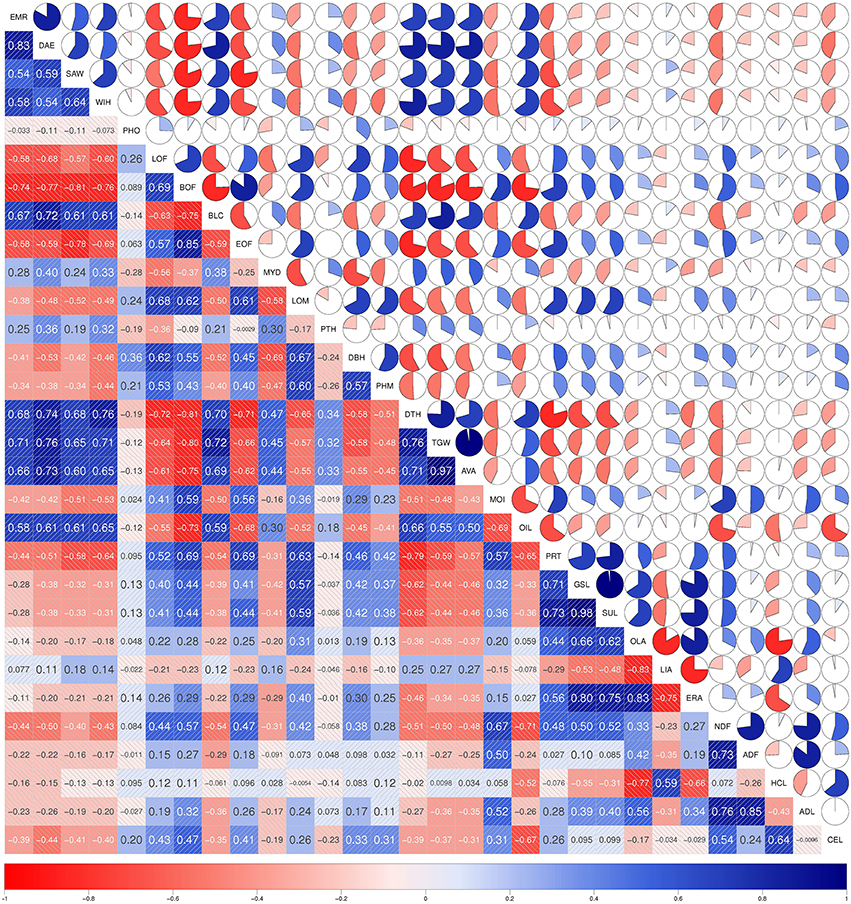
Figure 7. Correlations of the agronomic and seed quality traits across the 217 inbreds of the winter trial. In the diagonal panel the traits are listed. In the upper panel the filled portion of the pie and in the lower panel the depth of the shading as well as the font size indicate the magnitude of the correlations. Negative correlations are colored red and positive correlations blue.
For several co-localizing SNPs associated with the trait pair GSL-SUL we identified by a BLAST-search the candidate genes MAM1, MAM3/IMS2, SUR1, CYP79B2, and CYP79B3 (Tables 4, 5, Tables S3–S6). These glucosinolate biosynthetic genes are all down-regulated by sulfur deficiency and genes controlling sulfur uptake and assimilation are up-regulated (Hirai et al., 2005; Falk et al., 2007). These co-localizing SNP results of the trait pair GSL-SUL are in good accordance with the fact that glucosinolates may represent up to 30% of the total sulfur content of plant organs (Falk et al., 2007). Thus, the co-localizing GSL-SUL associations suggested pleiotropic effects or might be due to linkage between the underlying genes, because the extent of LD decays over distances of 677 kb in the B. napus diversity set in this study. However, to answer this question conclusively additional approaches like RNA-seq analysis or high resolution fine mapping in segregating populations will be necessary.
Author Contributions
NK, AB, and JL performed the statistical and bioinformatic analyses. IP provided the 6K array data. BW and RS carried out most of the field experiments. NK drafted the manuscript. BS designed and supervised the project. All authors read and approved the final manuscript.
Funding
This research was funded by the Deutsche Forschungsgemeinschaft and the Max Planck Society.
Conflict of Interest Statement
The authors declare that the research was conducted in the absence of any commercial or financial relationships that could be construed as a potential conflict of interest.
Acknowledgments
The authors thank Wolfgang Ecke (University of Göttingen, Germany), the Leibniz Institute of Plant Genetics and Crop Plant Research, Gatersleben (Germany), Nordic Gene Bank, Alnarp (Sweden), the Centre for Genetic Resources (Netherlands), and Warwick Horticulture Research International Genetic Resources Unit (UK) for providing the seeds of the examined germplasm. This research was performed in the framework of the ERA-NET PG project “ASSYST.” We are deeply grateful to Andrea Lossow, Nele Kaul, Frank Eikelmann, and Andreas Lautscham for excellent technical assistance. Finally, we thank the associate editor Stewart Gillmor and the two reviewers for their valuable suggestions on the manuscript.
Supplementary Material
The Supplementary Material for this article can be found online at: http://journal.frontiersin.org/article/10.3389/fpls.2016.00386
Abbreviations
AEM, adjusted entry mean; BLAST, basic local alignment search tool; DH, doubled haploid; cDNA, complementary deoxyribonucleic acid; GWAS, genome-wide association study; LD, linkage disequilibrium; MAS, marker-assisted selection; MRD, modified Roger's distance; OSR, oilseed rape; PCA, principal component analysis; QTL, quantitative trait loci; RNA, ribonucleic acid; SNP, single nucleotide polymorphism; SSR, simple sequence repeat.
References
Altschul, S. F., Gish, W., Miller, W., Myers, E. W., and Lipman, D. J. (1990). Basic local alignment search tool. J. Mol. Biol. 215, 403–410.
Angadi, S. V., Cutforth, H. W., Miller, P. R., McConkey, B. G., Entz, M. H., Brandt, S. A., et al. (2000). Response of three Brassica species to high temperature stress during reproductive growth. Can. J. Plant. Sci. 80, 693–701. doi: 10.4141/P99-152
Arumuganathan, K., and Earle, E. D. (1991). Nuclear DNA content of some important plant species. Plant Mol. Biol. Rep. 9, 415–415.
Barret, P., Delourme, R., Renard, M., Domergue, F., Lessire, R., Delseny, M., et al. (1998). A rapeseed FAE1 gene is linked to the E1 locus associated with variation in the content of erucic acid. Theor. Appl. Genet. 96, 177–186.
Basunanda, P., Spiller, T. H., Hasan, M., Gehringer, A., Schondelmaier, J., Lühs, W., et al. (2007). Marker-assisted increase of genetic diversity in a double-low seed quality winter oilseed rape genetic background. Plant Breed. 126, 581–587. doi: 10.1111/j.1439-0523.2007.01404.x
Bernardo, R. (1993). Estimation of coefficient of coancestry using molecular markers in maize. Theor. Appl. Genet. 85, 1055–1062.
Burns, M. J., Barnes, S. R., Bowman, J. G., Clarke, M. H. E., Werner, C. P., and Kearsey, M. J. (2003). QTL analysis of an intervarietal set of substitution lines in Brassica napus: (i) Seed oil content and fatty acid composition. Heredity 90, 39–48. doi: 10.1038/sj.hdy.6800176
Bus, A., Körber, N., Parkin, I. A. P., Samans, B., Snowdon, R. J., Li, J., et al. (2014). Species- and genome-wide dissection of the shoot ionome in Brassica napus and its relationship to seedling development. Front. Plant Sci. 5:485. doi: 10.3389/fpls.2014.00485
Bus, A., Körber, N., Snowdon, R. J., and Stich, B. (2011). Patterns of molecular variation in a species-wide germplasm set of Brassica napus. Theor. Appl. Genet. 123, 1413–1423. doi: 10.1007/s00122-011-1676-7
Celenza, J. L., Quiel, J. A., Smolen, G. A., Merrikh, H., Silvestro, A. R., Normanly, J., et al. (2005). The Arabidopsis ATR1 Myb transcription factor controls indolic glucosinolate homeostasis. Plant Physiol. 137, 253–262. doi: 10.1104/pp.104.054395
Chalhoub, B., Denoeud, F., Liu, S., Parkin, I. A. P., Tang, H., Wang, X., et al. (2014). Early allopolyploid evolution in the post-Neolithic Brassica napus oilseed genome. Science 345, 950–953. doi: 10.1126/science.1253435
Delourme, R., Falentin, C., Fomeju, B. F., Boillot, M., Lassalle, G., André, I., et al. (2013). High-density SNP-based genetic map development and linkage disequilibrium assessment in Brassica napus L. BMC Genomics 14:120. doi: 10.1186/1471-2164-14-120
Ecke, W., Clemens, R., Honsdorf, N., and Becker, H. C. (2010). Extent and structure of linkage disequilibrium in canola quality winter rapeseed (Brassica napus L.). Theor. Appl. Genet. 120, 921–931. doi: 10.1007/s00122-009-1221-0
Emrich, K., Wilde, F., Miedaner, T., and Piepho, H. P. (2008). REML approach for adjusting the Fusarium head blight rating to a phenological date in inoculated selection experiments of wheat. Theor. Appl. Genet. 117, 65–73. doi: 10.1007/s00122-008-0753-z
Falk, K. L., Tokuhisa, J. G., and Gershenzon, J. (2007). The effect of sulfur nutrition on plant glucosinolate content: physiology and molecular mechanisms. Plant Biol. 9, 573–581. doi: 10.1055/s-2007-965431
Feng, J., Long, Y., Shi, L., Shi, J., Barker, G., and Meng, J. (2012). Characterization of metabolite quantitative trait loci and metabolic networks that control glucosinolate concentration in the seeds and leaves of Brassica napus. New Phytol. 193, 96–108. doi: 10.1111/j.1469-8137.2011.03890.x
Fourmann, M., Barret, P., Renard, M., Pelletier, G., Delourme, R., and Brunel, D. (1998). The two genes homologous to Arabidopsis FAE1 co-segregate with the two loci governing erucic acid content in Brassica napus. Theor. Appl. Genet. 96, 852–858.
Frerigmann, H., and Gigolashvili, T. (2014). Update on the role of R2R3-MYBs in the regulation of glucosinolates upon sulfur deficiency. Front. Plant Sci. 5:626. doi: 10.3389/fpls.2014.00626
Friedt, W., and Snowdon, R. J. (2010). “Oilseed rape,” in Handbook of Plant Breeding, Chapter Vol. 4: Oil Crops Breeding, eds J. Vollmann and R. Istvan (Berlin/Heidelberg: Springer), 91–126.
Gajardo, H. A., Wittkop, B., Soto-Cerda, B., Higgins, E. E., Parkin, I. A. P., Snowdon, R. J., et al. (2015). Association mapping of seed quality traits in Brassica napus L. using GWAS and candidate QTL approaches. Mol. Breed. 35, 143. doi: 10.1007/s11032-015-0340-3
Gendall, A. R., Levy, Y. Y., Wilson, A., and Dean, C. (2001). The VERNALIZATION 2 gene mediates the epigenetic regulation of vernalization in Arabidopsis. Cell 107, 525–535. doi: 10.1016/S0092-8674(01)00573-6
Gigolashvili, T., Berger, B., Mock, H.-P., Müller, C., Weisshaar, B., and Flügge, U.-I. (2007a). The transcription factor HIG1/MYB51 regulates indolic glucosinolate biosynthesis in Arabidopsis thaliana. Plant J. 50, 886–901. doi: 10.1111/j.1365-313X.2007.03099.x
Gigolashvili, T., Yatusevich, R., Berger, B., Müller, C., and Flügge, U.-I. (2007b). The R2R3-MYB transcription factor HAG1/MYB28 is a regulator of methionine-derived glucosinolate biosynthesis in Arabidopsis thaliana. Plant J. 51, 247–61. doi: 10.1111/j.1365-313X.2007.03133.x
Halkier, B. A., and Gershenzon, J. (2006). Biology and biochemistry of glucosinolates. Annu. Rev. Plant Biol. 57, 303–333. doi: 10.1146/annurev.arplant.57.032905.105228
Harper, A. L., Trick, M., Higgins, J., Fraser, F., Clissold, L., Wells, R., et al. (2012). Associative transcriptomics of traits in the polyploid crop species Brassica napus. Nat. Biotechnol. 30, 798–802. doi: 10.1038/nbt.2302
Hasan, M., Friedt, W., Pons-Kühnemann, J., Freitag, N. M., Link, K., and Snowdon, R. J. (2008). Association of gene-linked SSR markers to seed glucosinolate content in oilseed rape (Brassica napus ssp. napus). Theor. Appl. Genet. 116, 1035–1049. doi: 10.1007/s00122-008-0733-3
Hatzig, S. V., Frisch, M., Breuer, F., Nesi, N., Ducournau, S., Wagner, M.-H., et al. (2015). Genome-wide association mapping unravels the genetic control of seed germination and vigor in Brassica napus. Front. Plant Sci. 6:221. doi: 10.3389/fpls.2015.00221
Hill, W. G., and Weir, B. S. (1988). Variances and covariances of squared linkage disequilibria in finite populations. Theor. Popul. Biol. 33, 54–78.
Hirai, M. Y., Klein, M., Fujikawa, Y., Yano, M., Goodenowe, D. B., Yamazaki, Y., et al. (2005). Elucidation of gene-to-gene and metabolite-to-gene networks in Arabidopsis by integration of metabolomics and transcriptomics. J. Biol. Chem. 280, 25590–25595. doi: 10.1074/jbc.M502332200
Hull, A. K., Vij, R., and Celenza, J. L. (2000). Arabidopsis cytochrome P450s that catalyze the first step of tryptophan-dependent indole-3-acetic acid biosynthesis. Proc. Natl. Acad. Sci. U.S.A. 97, 2379–2384. doi: 10.1073/pnas.040569997
James, D. W. Jr., and Dooner, H. K. (1990). Isolation of EMS-induced mutants in Arabidopsis altered in seed fatty acid composition. Theor. Appl. Genet. 80, 241–245.
James, D. W. Jr., Lim, E., Keller, J., Plooy, I., Ralston, E., and Dooner, H. K. (1995). Directed tagging of the Arabidopsis FATTY ACID ELONGATION1 (FAE1) gene with the maize transposon activator. Plant Cell 7, 309–319.
Jourdren, C., Barret, P., Horvais, R., Foisset, N., Delourme, R., and Renard, M. (1996). Identification of RAPD markers linked to the loci controlling erucic acid level in rapeseed. Mol. Breed. 2, 61–71.
Kang, H. M., Zaitlen, N. A., Wade, C. M., Kirby, A., Heckerman, D., Daly, M. J., et al. (2008). Efficient control of population structure in model organism association mapping. Genetics 178, 1709–1723. doi: 10.1534/genetics.107.080101
Koornneef, M., Hanhart, C. J., and van der Veen, J. H. (1991). A genetic and physiological analysis of late flowering mutants in Arabidopsis thaliana. Mol. Gen. Genet. 229, 57–66.
Körber, N., Bus, A., Li, J., Higgins, J., Bancroft, I., Higgins, E. E., et al. (2015). Seedling development traits in Brassica napus examined by gene expression analysis and association mapping. BMC Plant Biol 15:136. doi: 10.1186/s12870-015-0496-3
Körber, N., Wittkop, B., Bus, A., Friedt, W., Snowdon, R. J., and Stich, B. (2012). Seedling development in a Brassica napus diversity set and its relationship to agronomic performance. Theor. Appl. Genet. 125, 1275–1287. doi: 10.1007/s00122-012-1912-9
Kroymann, J., Textor, S., Tokuhisa, J. G., Falk, K. L., Bartram, S., Gershenzon, J., et al. (2001). A gene controlling variation in Arabidopsis glucosinolate composition is part of the methionine chain elongation pathway 1. Plant Physiol. 127, 1077–1088. doi: 10.1104/pp.010416
Li, F., Chen, B., Xu, K., Wu, J., Song, W., Bancroft, I., et al. (2014). Genome-wide association study dissects the genetic architecture of seed weight and seed quality in rapeseed (Brassica napus L.). DNA Res. 21, 355–367. doi: 10.1093/dnares/dsu002
Liu, C., Chen, H., Er, H. L., Soo, H. M., Kumar, P. P., Han, J.-H., et al. (2008). Direct interaction of AGL24 and SOC1 integrates flowering signals in Arabidopsis. Development 135, 1481–1491. doi: 10.1242/dev.020255
Luo, X., Ma, C., Yue, Y., Hu, K., Li, Y., Duan, Z., et al. (2015). Unravelling the complex trait of harvest index in rapeseed (Brassica napus L.) with association mapping. BMC Genomics 16:379. doi: 10.1186/s12864-015-1607-0
Mei, D. S., Wang, H. Z., Hu, Q., Li, Y. D., Xu, Y. S., and Li, Y. C. (2009). QTL analysis on plant height and flowering time in Brassica napus. Plant Breed. 128, 458–465. doi: 10.1111/j.1439-0523.2008.01528.x
Mikkelsen, M. D., Hansen, C. H., Wittstock, U., and Halkier, B. A. (2000). Cytochrome P450 CYP79B2 from Arabidopsis catalyzes the conversion of tryptophan to indole-3-acetaldoxime, a precursor of indole glucosinolates and indole-3-acetic acid. J. Biol. Chem. 275, 33712–33717. doi: 10.1074/jbc.M001667200
Mikkelsen, M. D., Naur, P., and Halkier, B. A. (2004). Arabidopsis mutants in the C-S lyase of glucosinolate biosynthesis establish a critical role for indole-3-acetaldoxime in auxin homeostasis. Plant J. 37, 770–777. doi: 10.1111/j.1365-313X.2004.02002.x
Parkin, I. A. P., Sharpe, A. G., and Lydiate, D. J. (2003). Patterns of genome duplication within the Brassica napus genome. Genome 46, 291–303. doi: 10.1139/g03-006
Qian, L., Qian, W., and Snowdon, R. J. (2014). Sub-genomic selection patterns as a signature of breeding in the allopolyploid Brassica napus genome. BMC Genomics 15:1170. doi: 10.1186/1471-2164-15-1170
Qiu, D., Morgan, C., Shi, J., Long, Y., Liu, J., Li, R., et al. (2006). A comparative linkage map of oilseed rape and its use for QTL analysis of seed oil and erucic acid content. Theor. Appl. Genet. 114, 67–80. doi: 10.1007/s00122-006-0411-2
Quijada, P. A., Udall, J. A., Lambert, B., and Osborn, T. C. (2006). Quantitative trait analysis of seed yield and other complex traits in hybrid spring rapeseed (Brassica napus L.): 1. Identification of genomic regions from winter germplasm. Theor. Appl. Genet. 113, 549–561. doi: 10.1007/s00122-006-0323-1
R Development Core Team (2011). R : A Language and Environment for Statistical Computing, Vol. 1. Vienna: R Foundation for Statistical Computing.
Richter, R., Bastakis, E., and Schwechheimer, C. (2013). Cross-repressive interactions between SOC1 and the GATAs GNC and GNL/CGA1 in the control of greening, cold tolerance, and flowering time in Arabidopsis. Plant Physiol. 162, 1992–2004. doi: 10.1104/pp.113.219238
Skirycz, A., Reichelt, M., Burow, M., Birkemeyer, C., Rolcik, J., Kopka, J., et al. (2006). DOF transcription factor AtDof1.1 (OBP2) is part of a regulatory network controlling glucosinolate biosynthesis in Arabidopsis. Plant J. 47, 10–24. doi: 10.1111/j.1365-313X.2006.02767.x
Smooker, A. M., Wells, R., Morgan, C., Beaudoin, F., Cho, K., Fraser, F., et al. (2011). The identification and mapping of candidate genes and QTL involved in the fatty acid desaturation pathway in Brassica napus. Theor. Appl. Genet. 122, 1075–90. doi: 10.1007/s00122-010-1512-5
Stich, B., Möhring, J., Piepho, H.-P., Heckenberger, M., Buckler, E. S., and Melchinger, A. E. (2008). Comparison of mixed-model approaches for association mapping. Genetics 178, 1745–1754. doi: 10.1534/genetics.107.079707
Textor, S., Bartram, S., Kroymann, J., Falk, K. L., Hick, A., Pickett, J. A., et al. (2004). Biosynthesis of methionine-derived glucosinolates in Arabidopsis thaliana: recombinant expression and characterization of methylthioalkylmalate synthase, the condensing enzyme of the chain-elongation cycle. Planta 218, 1026–1035. doi: 10.1007/s00425-003-1184-3
Udall, J. A., Quijada, P. A., Lambert, B., and Osborn, T. C. (2006). Quantitative trait analysis of seed yield and other complex traits in hybrid spring rapeseed (Brassica napus L.): 2. Identification of alleles from unadapted germplasm. Theor. Appl. Genet. 113, 597–609. doi: 10.1007/s00122-006-0324-0
Van Inghelandt, D., Melchinger, A. E., Martinant, J.-P., and Stich, B. (2012). Genome-wide association mapping of flowering time and northern corn leaf blight (Setosphaeria turcica) resistance in a vast commercial maize germplasm set. BMC Plant Biol. 12:56. doi: 10.1186/1471-2229-12-56
Wahl, V., Ponnu, J., Schlereth, A., Arrivault, S., Langenecker, T., Franke, A., et al. (2013). Regulation of flowering by trehalose-6-phosphate signaling in Arabidopsis thaliana. Science 339, 704–707. doi: 10.1126/science.1230406
Wang, N., Qian, W., Suppanz, I., Wei, L., Mao, B., Long, Y., et al. (2011a). Flowering time variation in oilseed rape (Brassica napus L.) is associated with allelic variation in the FRIGIDA homologue BnaA.FRI.a. J. Exp. Biol. 62, 5641–5658. doi: 10.1093/jxb/err249
Wang, X., Wang, H., Wang, J., Sun, R., Wu, J., Liu, S., et al. (2011b). The genome of the mesopolyploid crop species Brassica rapa. Nat. Genet. 43, 1035–1039. doi: 10.1038/ng.919
Wigge, P. A., Kim, M. C., Jaeger, K. E., Busch, W., Schmid, M., Lohmann, J. U., et al. (2005). Integration of spatial and temporal information during floral induction in Arabidopsis. Science 309, 1056–1059. doi: 10.1126/science.1114358
Wittkop, B., Snowdon, R. J., and Friedt, W. (2012). New NIRS calibrations for fibre fractions reveal broad genetic variation in Brassica napus seed quality. J. Agric. Food Chem. 60, 2248–2256. doi: 10.1021/jf204936f
Wright, S. (1978). Evolution and the Genetics of Populations, Vol. IV (Chicago, IL: The University of Chicago Press), 91.
Würschum, T., Liu, W., Maurer, H. P., Abel, S., and Reif, J. C. (2012). Dissecting the genetic architecture of agronomic traits in multiple segregating populations in rapeseed (Brassica napus L.). Theor. Appl. Genet. 124, 153–161. doi: 10.1007/s00122-011-1694-5
Yu, J., Zhao, M., Wang, X., Tong, C., Huang, S., Tehrim, S., et al. (2013). Bolbase: a comprehensive genomics database for Brassica oleracea. BMC Genomics 14:664. doi: 10.1186/1471-2164-14-664
Zang, Y. X., Kim, H. U., Kim, J. A., Lim, M. H., Jin, M., Lee, S. C., et al. (2009). Genome-wide identification of glucosinolate synthesis genes in Brassica rapa. FEBS J. 276, 3559–3574. doi: 10.1111/j.1742-4658.2009.07076.x
Zhao, J., Dimov, Z., Becker, H. C., Ecke, W., and Möllers, C. (2007). Mapping QTL controlling fatty acid composition in a doubled haploid rapeseed population segregating for oil content. Mol. Breed. 21, 115–125. doi: 10.1007/s11032-007-9113-y
Zhao, J., Udall, J. A., Quijada, P. A., Grau, C. R., Meng, J., and Osborn, T. C. (2006). Quantitative trait loci for resistance to Sclerotinia sclerotiorum and its association with a homeologous non-reciprocal transposition in Brassica napus L. Theor. Appl. Genet. 112, 509–516. doi: 10.1007/s00122-005-0154-5
Keywords: Brassica napus, agronomic traits, seed quality, genome-wide association mapping, flowering, erucic acid, marker-assisted selection, candidate genes
Citation: Körber N, Bus A, Li J, Parkin IAP, Wittkop B, Snowdon RJ and Stich B (2016) Agronomic and Seed Quality Traits Dissected by Genome-Wide Association Mapping in Brassica napus. Front. Plant Sci. 7:386. doi: 10.3389/fpls.2016.00386
Received: 03 December 2015; Accepted: 14 March 2016;
Published: 31 March 2016.
Edited by:
Stewart Gillmor, CINVESTAV-IPN, MexicoCopyright © 2016 Körber, Bus, Li, Parkin, Wittkop, Snowdon and Stich. This is an open-access article distributed under the terms of the Creative Commons Attribution License (CC BY). The use, distribution or reproduction in other forums is permitted, provided the original author(s) or licensor are credited and that the original publication in this journal is cited, in accordance with accepted academic practice. No use, distribution or reproduction is permitted which does not comply with these terms.
*Correspondence: Niklas Körber, n.koerber@fz-juelich.de;
Benjamin Stich, stich@mpipz.mpg.de