 Wen-Ying Zhu1†Long Huang2†Long Chen1Jian-Tao Yang1Jia-Ni Wu1Mei-Ling Qu1Dan-Qing Yao3Chun-Li Guo1Hong-Li Lian1Huan-Le He1Jun-Song Pan1*
 Run Cai1*
- 1School of Agriculture and Biology, Shanghai Jiaotong University, Shanghai, China
- 2Biomarker Technologies Corporation, Beijing, China
- 3Shanghai Seed Management Station, Shanghai, China
High-density genetic linkage map plays an important role in genome assembly and quantitative trait loci (QTL) fine mapping. Since the coming of next-generation sequencing, makes the structure of high-density linkage maps much more convenient and practical, which simplifies SNP discovery and high-throughput genotyping. In this research, a high-density linkage map of cucumber was structured using specific length amplified fragment sequencing, using 153 F2 populations of S1000 × S1002. The high-density genetic map composed 3,057 SLAFs, including 4,475 SNP markers on seven chromosomes, and spanned 1061.19 cM. The average genetic distance is 0.35 cM. Based on this high-density genome map, QTL analysis was performed on two cucumber fruit traits, fruit length and fruit diameter. There are 15 QTLs for the two fruit traits were detected.
Introduction
Cucumber (Cucumis sativus L.), a diploid species (2n = 14), which belongs to the family of Cucurbits. The cultivated area of cucumber is second only to tomato in the world. Cucumber has seven chromosomes and 100s of known functional genes (Xie and Wehner, 2001), and the genome size is only 367 Mb, which is smaller than other Cucurbits commercial crops (Ren et al., 2009). Because of its economic importance and nutritional value, the cucumber has been the research model plant of cucurbitaceae plants, and the genetics and molecular biology study of cucumber has progressed rapidly in the latest 20 years. Recent years, the whole genome of cucumber varieties 9930 (‘Chinese long’ inbred line; Huang S. et al., 2009), ‘Gy14’ (North American pickling type; Cavangnaro et al., 2010), and ‘B10’ (European inbred line; Wóycicki et al., 2011) have been sequenced. Cucumber has become model plant for Cucurbits’ genetic research.
Currently, genetic linkage maps commonly include restriction fragment length polymorphisms (RFLP), random amplified polymorphic DNA (RAPD), amplified fragment length polymorphism (AFLP), sequence characterized amplified region (SCAR), simple sequence repeat (SSR), and single-nucleotide polymorphism (SNPs) markers. A genetic map, especially a high-density genetic map provides an important foundation for quantitative trait loci (QTL) mapping (Esteras et al., 2012; Petroli et al., 2012; Song et al., 2012) and anchoring sequence scaffolds (Wang et al., 2011; Ren et al., 2012), and the utility of genetic linkage maps depends on the types and numbers of markers used. Since 1994, several kinds of markers have been used to assess the genetic diversity of cucumber accessions including RAPD, AFLP, SCAR, SRAP, SSR (Dijkhuizen et al., 1994; Kennard and Havey, 1995; Serquen et al., 1997; Park et al., 2000; Bradeen et al., 2001; Fazio et al., 2003; Li et al., 2005; Wang et al., 2005; Sun et al., 2006; Yuan et al., 2008a,b; Ren et al., 2009; Zhang et al., 2012), but no SNP markers were available for cucumber. With the rapid development of the next-generation sequencing (NGS), makes it possible to obtain thousands of SNPs throughout the cucumber genome and construct the high-density SNP genetic maps. There are several methods have been used to discover SNPs markers, for example RAD-seq (restriction site-associated sequencing; Miller et al., 2007), double digest RAD-seq (Peterson et al., 2012) and GBS (two-enzyme genotyping-by-sequencing; Poland et al., 2012). Sun et al. (2013) developed a new technique SLAF-seq (specific length amplified fragment sequencing), and discovered large-scale de novo SNP and genotyping by this method. The efficiency of this method was tested on rice and soybean, in addition, SLAF-seq was used to create a high-density genetic map for common carp (Cyprinus carpio L.). Through the method of SLAF-seq, SNPs marker has been wildly applied for high-density genetic map construction in several crop and animal species, such as sesame (Zhang et al., 2013), soybean (Qi et al., 2014), common carp (Sun et al., 2013). And it is possible to construct a high-density genetic map based on SNPs markers of cucumber. SNPs markers may provide a more saturated genetic linkage map of cucumber. Wei et al. (2014) constructed the first SNP genetic map of cucumber by SLAF-seq, which contained 1,800 SNPs, the average distance between adjacent markers was 0.50 cM. And Xu et al. (2015b) constructed a SNP map of cucumber by SLAF-seq, which contained 1,892 SLAFs with the total length is 845.87 cM and average distance is 0.45 cM. After then, Xu et al. (2015a) constructed anther SNP map using 949 F2 populations, on this basis, QTL analysis on fruit flesh thickness, and find the candidate genes.
There are a lot of important QTLs and horticultural traits associations have been researched in cucumber. Which include sexual expression, lateral branch, disease resistance, parthenocarpy, fruit shape, formation of bisexual flowers, fruit warty and fruit flesh thickness (Kennard and Havey, 1995; Serquen et al., 1997; Dijkuizen and Staub, 2002; Fazio et al., 2003; Pan et al., 2005; Sakata et al., 2005; Sun et al., 2006; Li et al., 2009; Yang et al., 2014; Xu et al., 2015a). And some of these research results have been successfully used in cucumber marker-assisted selection breeding.
In our study, genotype data was generated and SNPs markers were discovered by SLAF-seq for cucumber. Using these SNP markers, we constructed a high-density genetic map of cucumber. This high-density genetic linkage map might have utility in locating QTL associated with economically important traits of cucumber. And we used the new genetic map to define QTLs for several fruit traits of cucumber.
Materials and Methods
Ethical Standards
The authors declare that this study complies with the current laws of the countries in which the experiments were performed.
Plant Materials
Cucumber gynoecious line S1000 was crossed with the monoecious line S1002. The S1000 plants have little leaves and normally produce short fruit (10–15 cm), the diameter size is about 55–60 mm. In contrast, the plants of S1002 have large leaves and longer fruit (40–45 cm), the diameter size is about 30–35 mm. Parent materials provided by Huang Sanwen. The two parental lines S1000 and S1002 were planted in greenhouse in the spring of 2012, the F1 of S1000 × S1002 were grown in August of 2012, and the F2 population were planted in the spring of 2013 and self-pollinated to obtain 150 F2:3 families.
DNA Extraction
Young healthy leaves from the two parents and the 153 F2 plants were compiled and DNA was extracted by the method of CTAB (Doyle and Doyle, 1987). DNA was quantified with an ND-2000 spectrophotometer (NanoDrop, Wilmington, DE, USA) and by electrophoresis in 0.8% agarose gels with a lambda DNA standard.
Phenotypic Data Collection and Genotyping
Phenotypic data were collected in three environments over 3 years (2013 autumn, 2014 spring, and 2015 spring) with F3 families, S1000, S1002 and their F1 were included in all experiments. F3 Families were arranged in a randomized complete block design two replications respectively in 2013 autumn, 2014 spring and 2015 spring with 10 plants in each replication. We collected the data of fruit length (fl, cm, length from the apex of fruit to the pedicel attachment), fruit diameter (fd, mm, at the maximum fruit width). The fruit-related traits were measured according to the standards published by Yuan et al. (2008a). We measured the numbers of fl and fd on individual plants, and averaged within each F3 family. Considering that there might be some diseases and other factors, 12 plants were randomly selected from the F3 families and planted, and three fruits were measured of each plant. Phenotypic data from 10 healthy plants were used to represent each F2 individual.
SLAF Library Construction and High-throughput Sequencing
The method of SLAF-seq was used to genotype 153 F2 plants, and the two parents, as above described (Sun et al., 2013). Genome DNA was digested to completion with RsaI+Hpy166II. A single-nucleotide overhang were added to the digested fragments with Klenow Fragment (3′→5′ exo–; NEB) and dATP at 37°C, and then the Duplex Tag-labeled Sequencing adapters (PAGE purified, Life Technologies) were ligated to the A-tailed DNA with T4 DNA ligase. The PCR reaction was performed using diluted restriction-ligation samples, dNTP, Q5® High-Fidelity DNA Polymerase and PCR primers: AATGATACGGCGACCACCGA and CAAGCAGAAGACGGCATACG (PAGE purified, Life Technologies). The PCR productions were purified using Agencourt AMPure XP beads (Beckman Coulter, High Wycombe, UK) and pooled. The pooled sample was separated by electrophoresis in a 2% agarose gel. Fragments with 244~344 bp (with indexes and adaptors) in size were excised, purified using QIAquick Gel Extraction Kit (QIAGEN). The gel-purified product was sequenced on the Illumina HiSeq 2500 system (Illumina, Inc., San Diego, CA, USA) according to the manufacturer’s recommendations.
SLAF-seq Data Analysis and Genotyping
SLAF-seq data was operated using the software developed by Sun et al. (2013), and the genotyping methods with reference to Sun et al. (2013) and Wei et al. (2014). According to sequence similarity, the generated pair-end reads from SLAF-seq were clustered, and the reads could be inferred from one to one alignment by BLAT (-tileSize = 10 -stepSize = 5). Identical reads were merged, and the reads with over 90% similarity sequences were grouped into one SLAF locus (Sun et al., 2013). In each SLAF locus, minor allele frequency (MAF) evaluation was used to define alleles.
In order to ensure the quality of genetic map, according to the following rules to filter SLAFs: (1) SLAFs with parents sequence depth of less than 10×; (2) SLAFs with complete degree below 30%; (3) SLAFs with serious partial separation (p-value < 0.05); (4) Heterozygous SLAFs in two parents. One SLAF locus can contain no more than four SLAF tags in the mapping populations of cucumber, according to this principle, the groups which contain over four tags were considered as repetitive SLAFs and excluded. Polymorphic SLAFs which contained 2–4 tags were considered as potential markers. Those polymorphic SLAF markers were then assorted into eight segregation patterns as following: ab × cd, ef × eg, hk × hk, lm × ll, nn × np, aa × bb, ab × cc, and cc × ab. Since the F2 mapping populations were derived from two homozygous cucumber inbred lines with a genotype of aa or bb, therefore only the SLAF markers which had segregation patterns of aa × bb were used in map construction.
Linkage Map Construct and QTL Analysis
Based on the locations of SLAF markers on chromosomes, they were assigned into seven linkage groups (LGs). The NGS data may exist some genotyping errors and deletion, which can reduce the quality of the genetic map. These errors were corrected by the High Map Strategy (Liu et al., 2014). All the genotype data from the F2 mapping population was used to perform linkage analysis using JoinMap 4.0 software (Van Ooijen, 2006). The SLAFs can be divided into seven LGs with the position of the reference genome. By computing the MLOD value between two adjacent markers (Vision et al., 2000), to filter out the SLAFs with the MLOD values are less than 5. Using Marker HighMap (Liu et al., 2014) software to analysis the linear array of markers in each LG, and estimate the genetic distances of between two adjacent markers. The method of Internal Mapping and the software of R/qtl were used in QTLs analysis, the confidence intervals of QTLs were calculated according 95% Bayes credible interval method (Sen and Churchill, 2001) with R/qtl. The process of the genetic map construction was shown in Figure 1 (Liu et al., 2014).
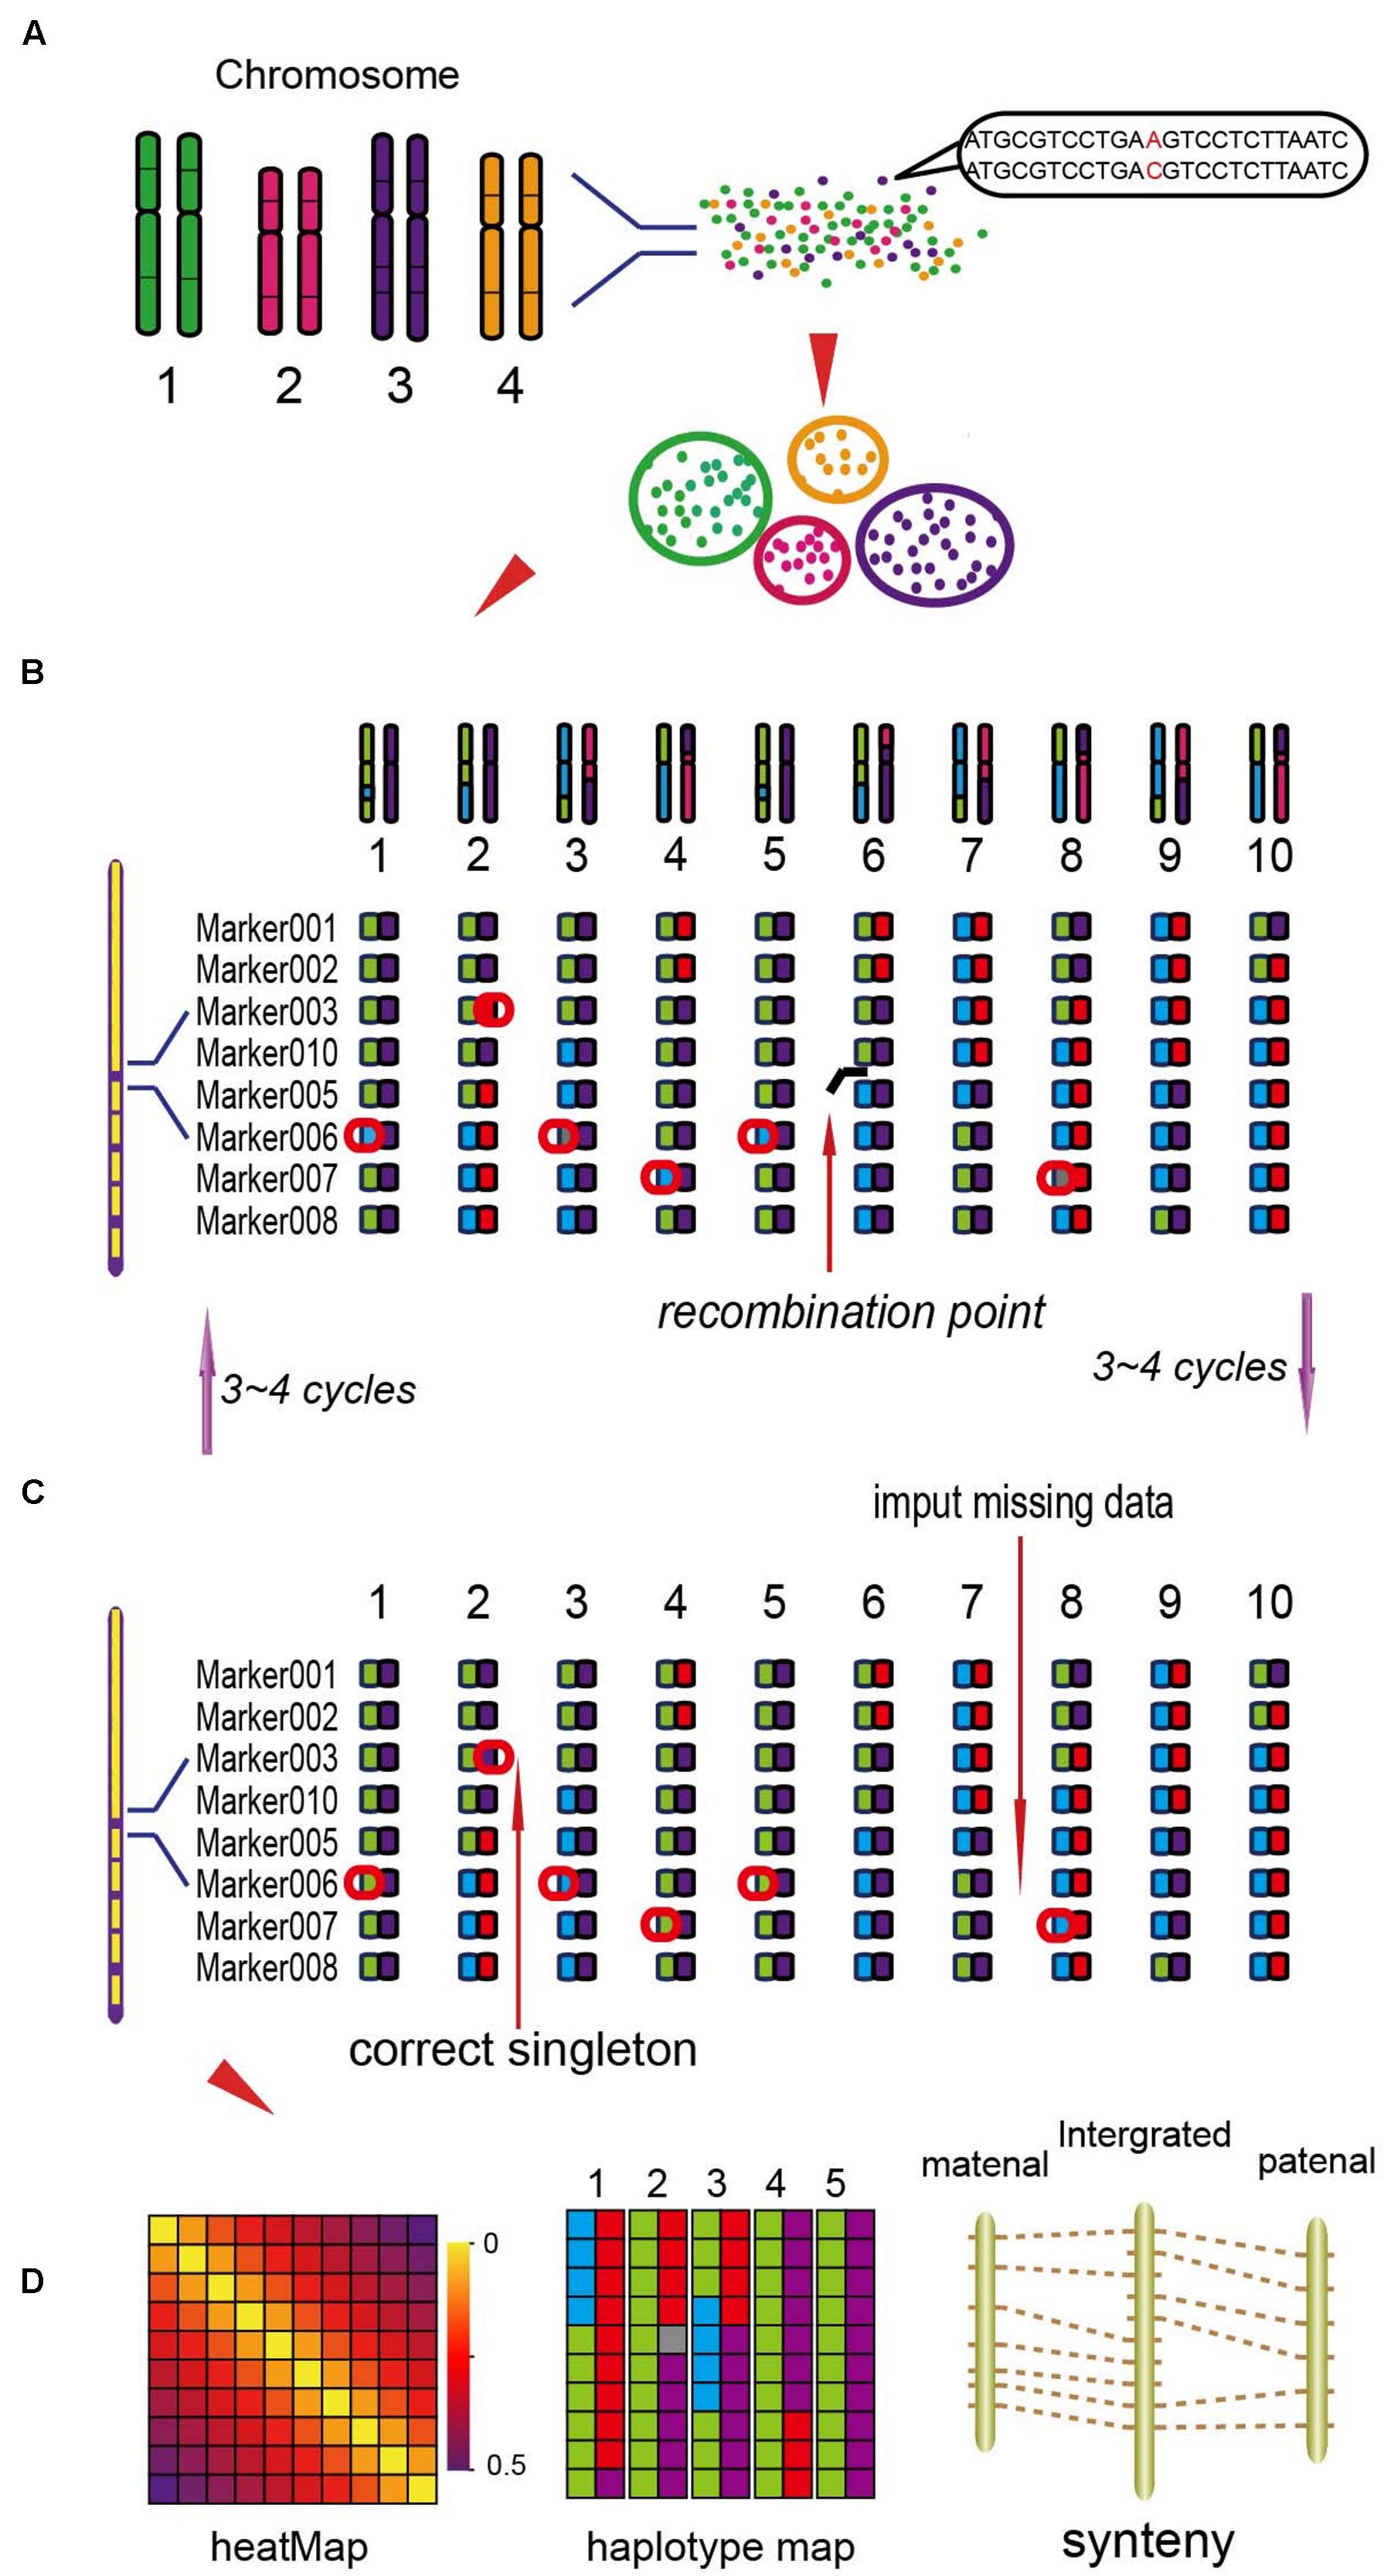
FIGURE 1. The process of the genetic map construction (Liu et al., 2014). (A) Calculate the mLOD value of the high quality molecular tags, using this value to analysis seven linkage groups (LGs). (B) Using the software of HighMap to construct the genetic map for each LG. (C) According to the result of mapping to correct the tags genotyping. (D) Get the high-density genetic map and evaluate the quality of the map.
Results
Analysis of SLAF-sqe Data and SLAF Markers
After DNA high-throughput sequencing, generated a total of 22.98 Gb of raw data, containing 143.63 M reads of ~80 bp in length left over after preprocessing. The Q30 (it is a quality score of 30 which indicating a 0.1% chance of an error and 99.9% confidence) ratio was 81.35% and guanine–cytosine (GC) content was 39.04%. There were 12,417,012 reads from female parent and 8,916,362 reads from male parent, the average number of reads from F2 population is 799,335.
The numbers of SLAFs in the male and female parent were 96,617 and 107,488, respectively. The average sequencing depths of male and female parent were 29.05- and 39.95-fold, respectively. In F2 population, the average number of SLAFs was 80,403, and the coverage ranged with an average of 3.45-fold (Table 1).
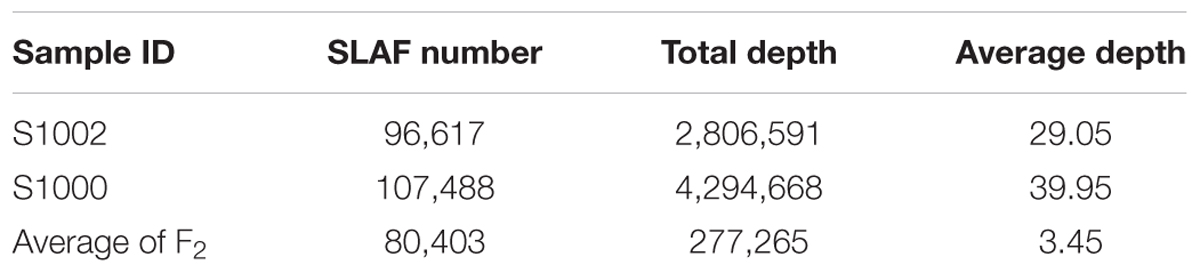
TABLE 1. Summary of marker depth.
Among the 115,789 high-quality SLAFs detected, 15,946 were polymorphic with a rate of 13.77% (Table 2). Of the 15,946 polymorphic SLAFs, 15,196 were classified into eight segregation patterns (Figure 2). F2 population was obtained by selfing the F1 of a cross between two parents with homozygous genotype of aa or bb. So, only the F2 plants with aa × bb segregation pattern were used to construct the high-density genetic linkage map, and there are totally 14,712 markers fell into this type. Among these 14,712 markers, 3,077 markers were used for the high-density genetic map construction, which are homozygous in the two parents, with sequence depth more than 10-fold, and over 70% integrity of SLAF tags.
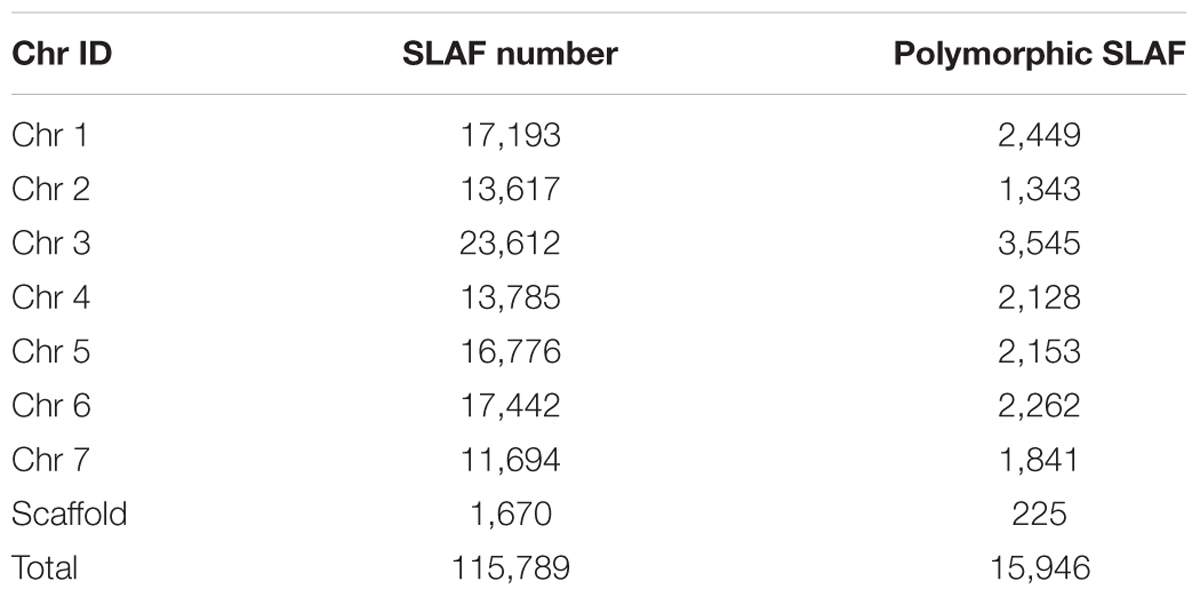
TABLE 2. Specific length amplified fragment (SLAF) markers number on each chromosome.
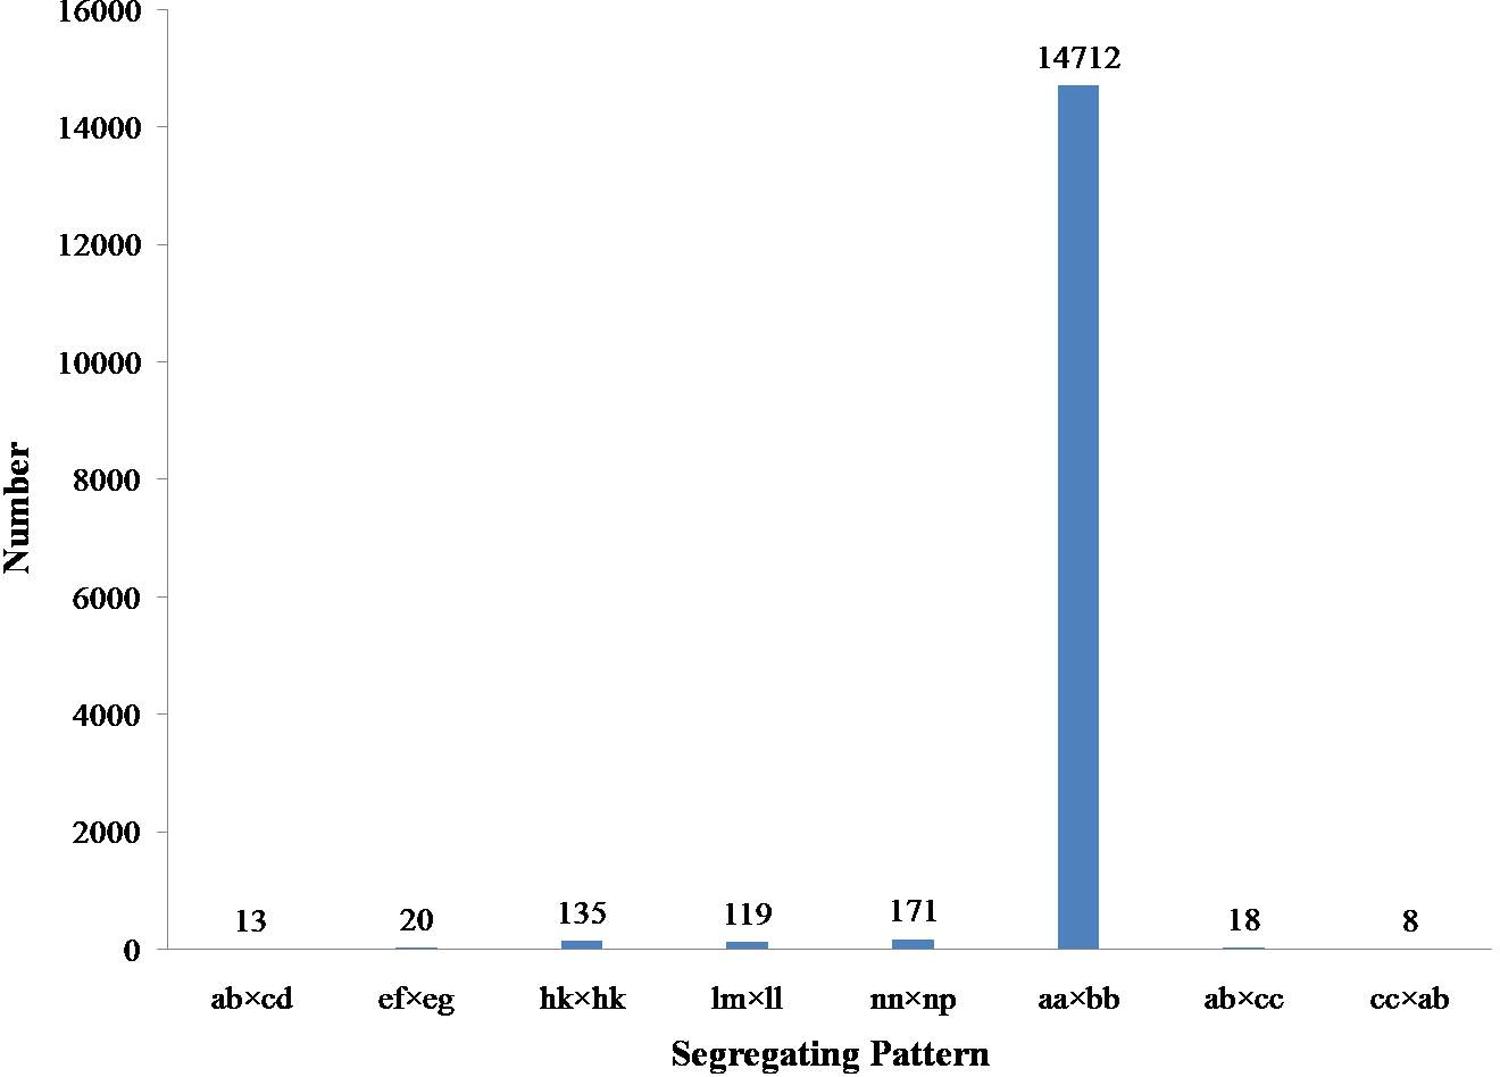
FIGURE 2. Gnotype distribution of SLAF markers. The Y axis is the number of SLAFs, the X axis is the type of SLAFs.
Basic Characteristics of the Genetic Map
After linkage analysis, 3,057 of the 3,077 SLAF markers were mapped on the genetic map, while the other 20 SLAFs were not link to any group. These markers with 52.60-fold sequence depth in S1002 (the male parent), and 76.58-flod in S1000 (the female parent), and 4.97-fold in each F2 population on average.
The final genetic map included 3,057 markers on the seven LGs (Table 3 and Supplementary Figure S1), and was 1,061.19 cM in length with an inter-marker distance of 0.35 cM (Table 3). The largest LG was LG3 with 649 markers, a length of 212.14 cM, and an average distance of only 0.33 cM between adjacent markers. The smallest LG is LG7 which only has 336 markers, with the length of 100.69 cM and an average distance of 0.30 cM. The largest gap on this map was 2.36 cM located in LG5. And this genetic map included 4,475 SNPs (Table 3, Supplementary Tables S1–S3).
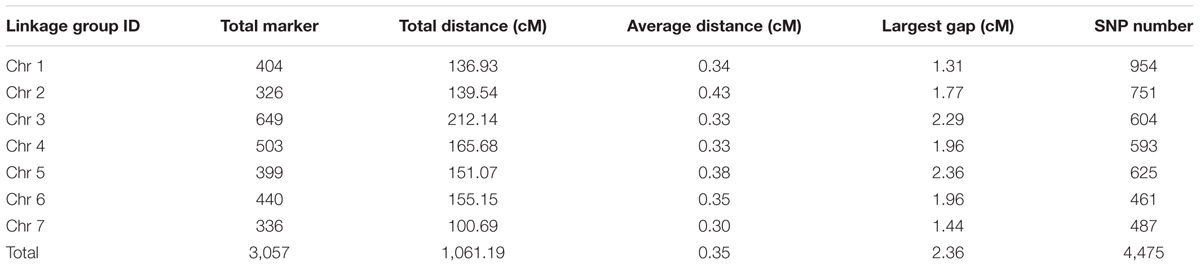
TABLE 3. Description on basic characteristics of seven linkage groups.
Until now, this map might be the most density SNP genetic linkage map to data for cucumber.
QTL Analysis Using the High-Density Genetic Map
Phenotypic data of two parents, F1, F2, and F2:3 families are presented in Figure 3. QTLs for two fruit traits were detected in F3 families (Table 4; Figures 4 and 5), and mapped to unique positions. QTLs were detected for all fruit traits. A total of 15 QTLs were detected with seven and eight QTLs indentified per trait. The proportion of phenotypic variance explained by a single QTL (r2) ranged from 5.7 to 13.6% and LOD scores from 2.05 to 5.49. Seven QTLs were detected for fruit length, which were localized on chromosomes 3, 4, 6 and 7, accounting for 7.6–13.6% of the phenotypic variation. There were eight QTLs were detected for fruit diameter, which were localized on chromosome 1, 3, 5, 6 and 7, and the phenotypic variation was from 5.7 to 13.3%. (Table 4; Figures 4 and 5).
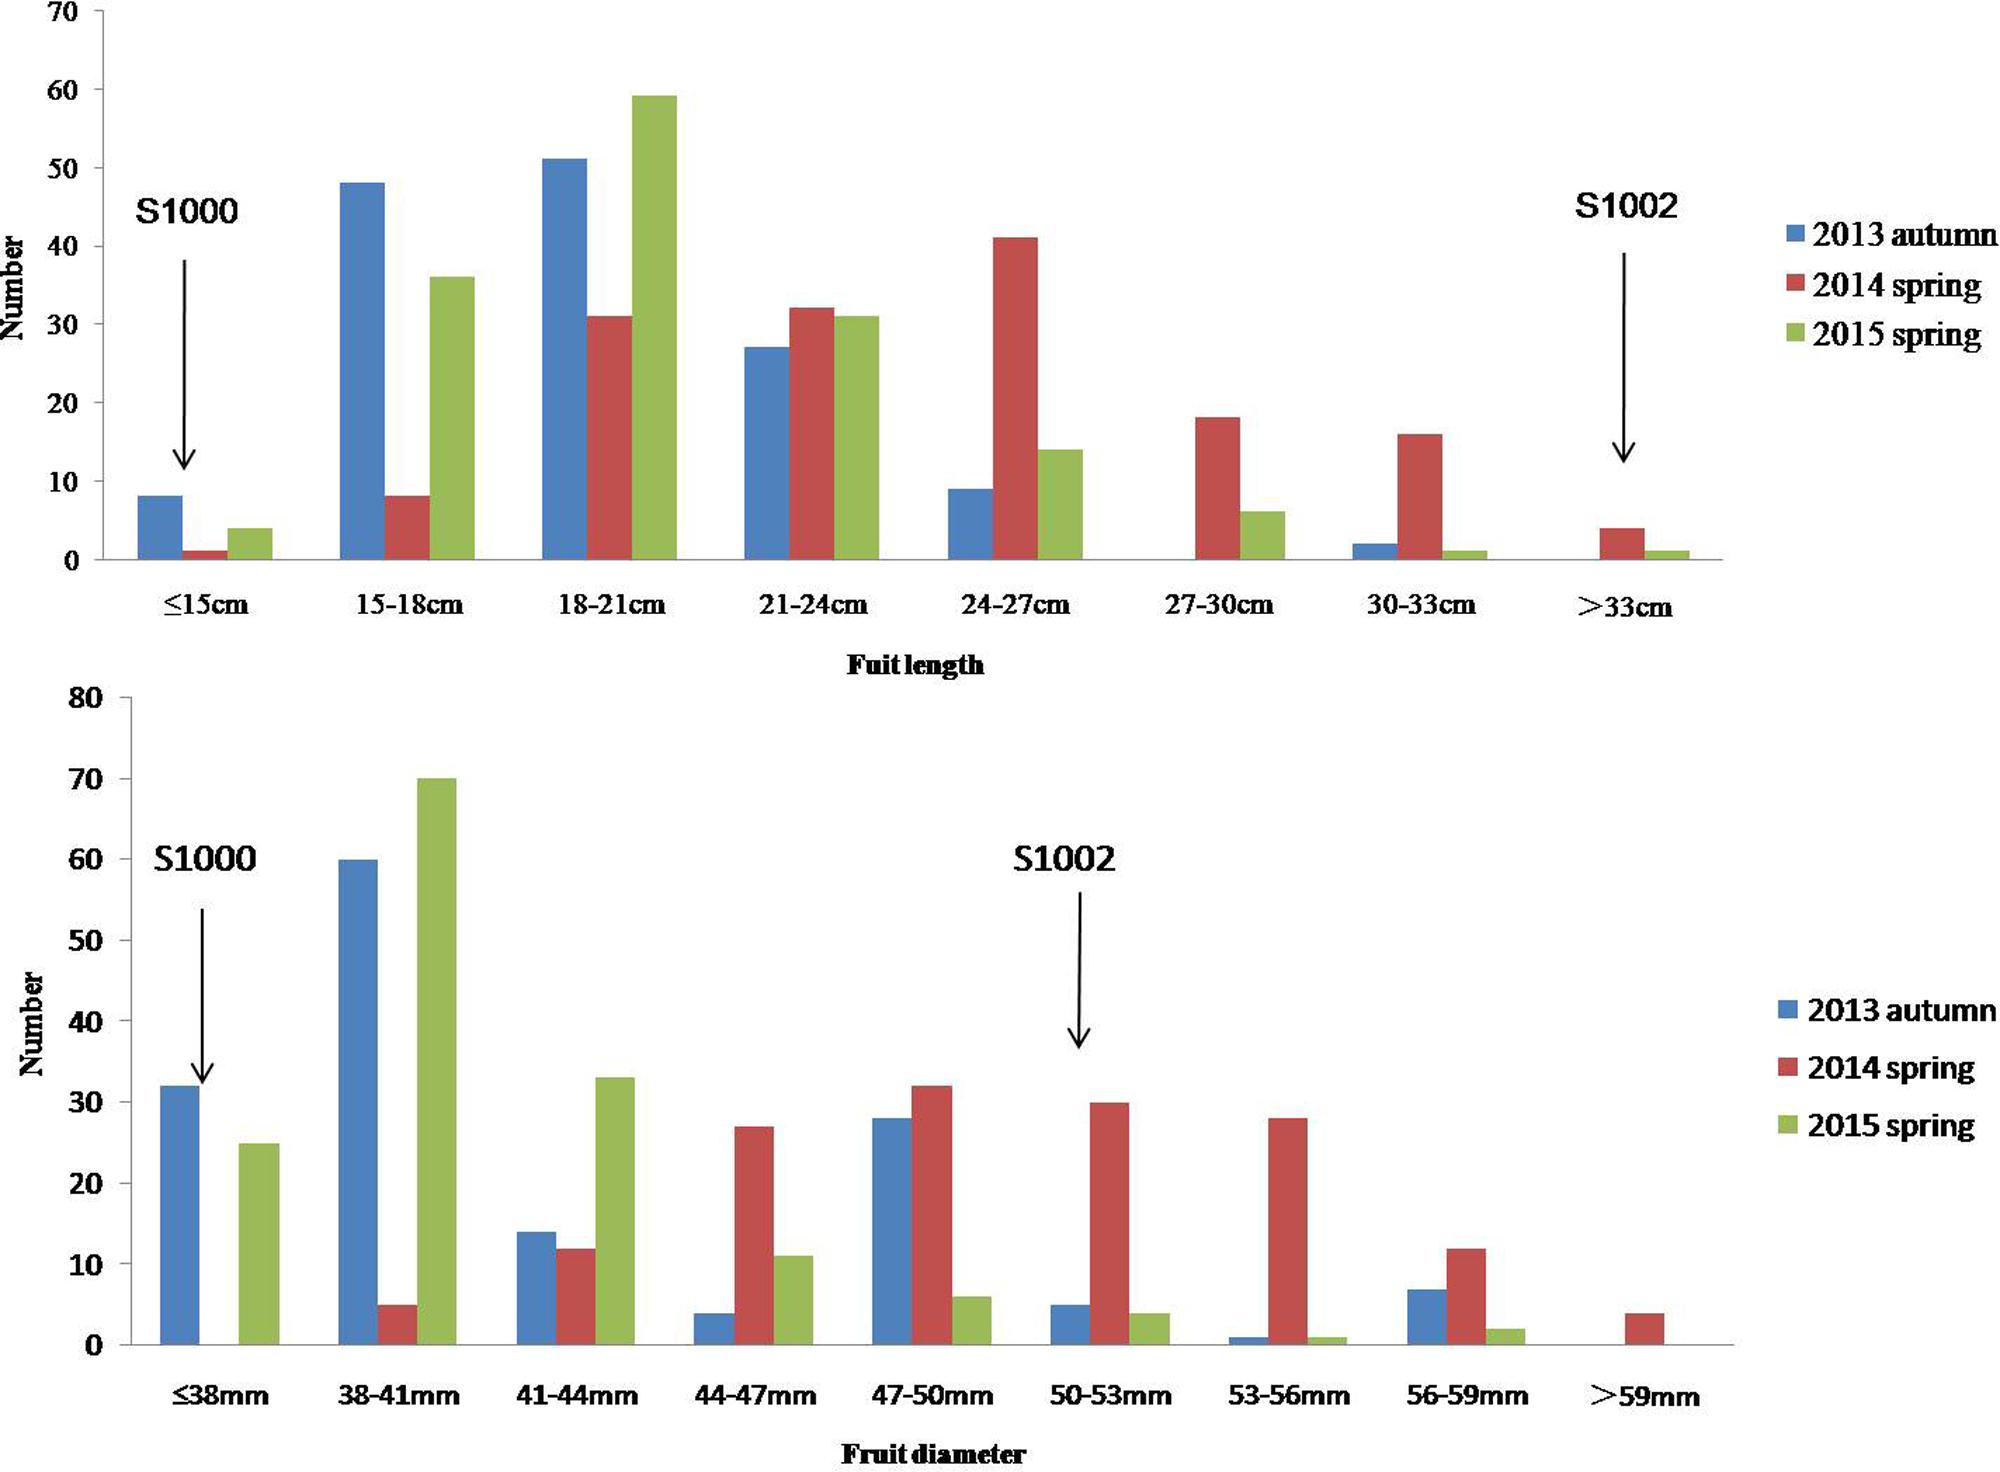
FIGURE 3. Phenotypic evaluation of fruit length and fruit diameter for S1000, S1002, and F3. The Y axis is the number of plant individuals. The X axis is continuous, for the figure fruit length, it means the fruit length (fl) ≤ 15 cm, 15 cm < fl ≤ 18 cm, 18 cm < fl ≤ 21 cm, 21 cm < fl ≤ 24 cm, 24 cm < fl ≤ 27 cm, 27 cm < fl ≤ 30 cm, 30 cm < fl ≤ 33 cm, fl > 33 cm; for the fruit diameter, it means the fruit diameter (fd) ≤ 38 mm, 38 mm < fd ≤ 41 mm, 41 mm < fd ≤ 44 mm, 44 mm < fd ≤ 47 mm, 47 mm < fd ≤ 50 mm, 50 mm < fd ≤ 53 mm, 53 mm < fd ≤ 56 mm, 56 mm < fd ≤ 59 mm, fd > 59.
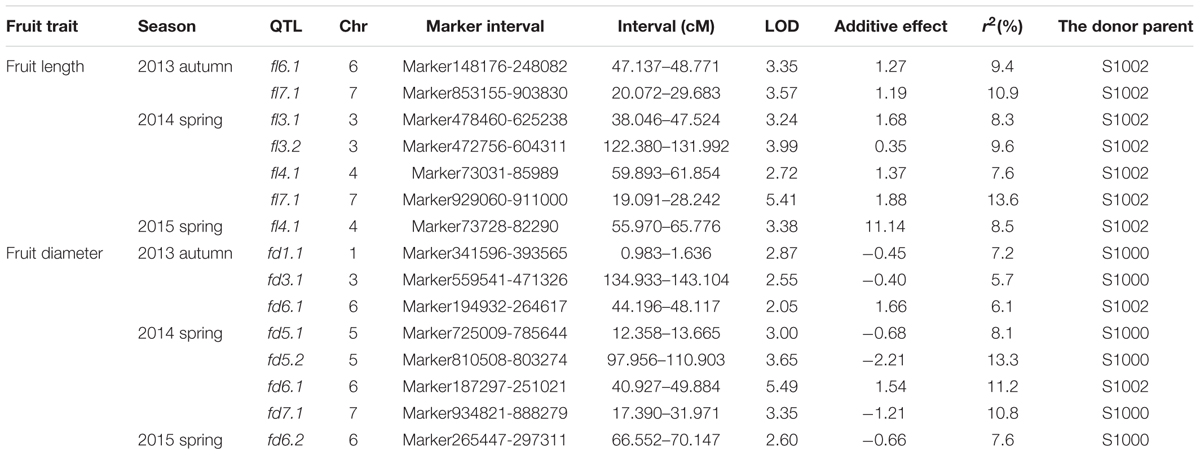
TABLE 4. Quantitative trait loci (QTL) analysis of cucumber fruit length and diameter in F3 families.
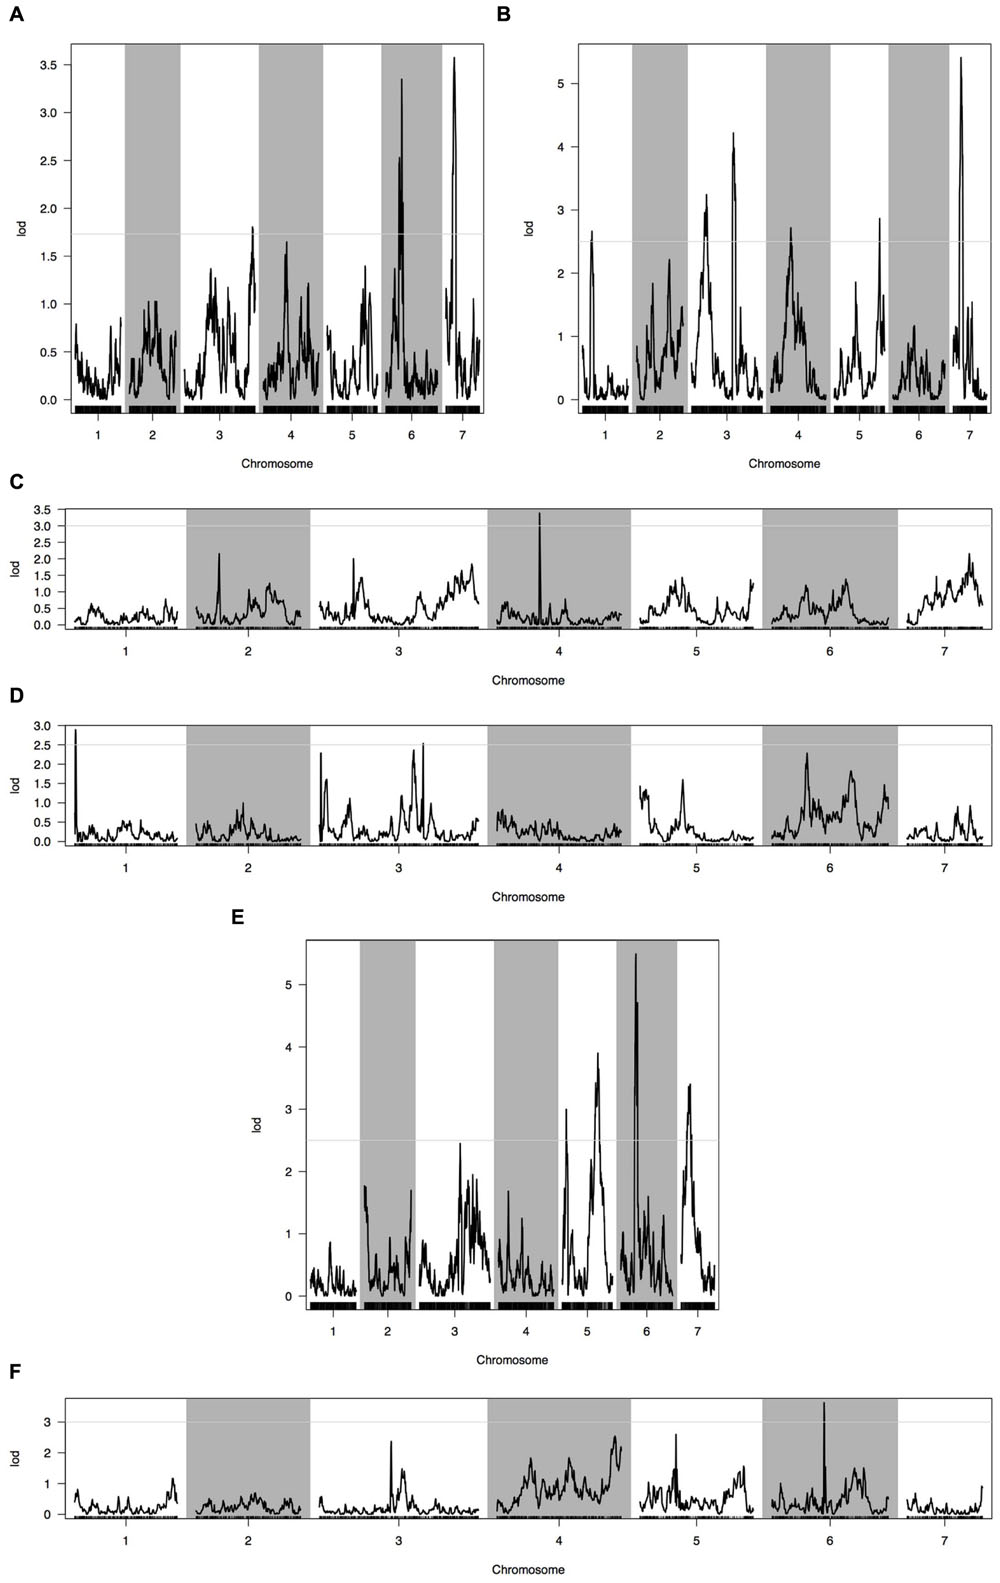
FIGURE 4. Quantitative trait loci (QTL) analysis with two fruit traits using the high-density genetic map. (A) QTL analysis of fruit length in 2013 autumn; (B) QTL analysis of fruit length in 2014 spring; (C) QTL analysis of fruit length in 2015 spring; (D) QTL analysis of fruit diameter in 2013 autumn; (E) QTL analysis of fruit diameter in 2014 spring; (F) QTL analysis of fruit diameter in 2015 spring. Horizontal line on the chart represents LOD threshold.
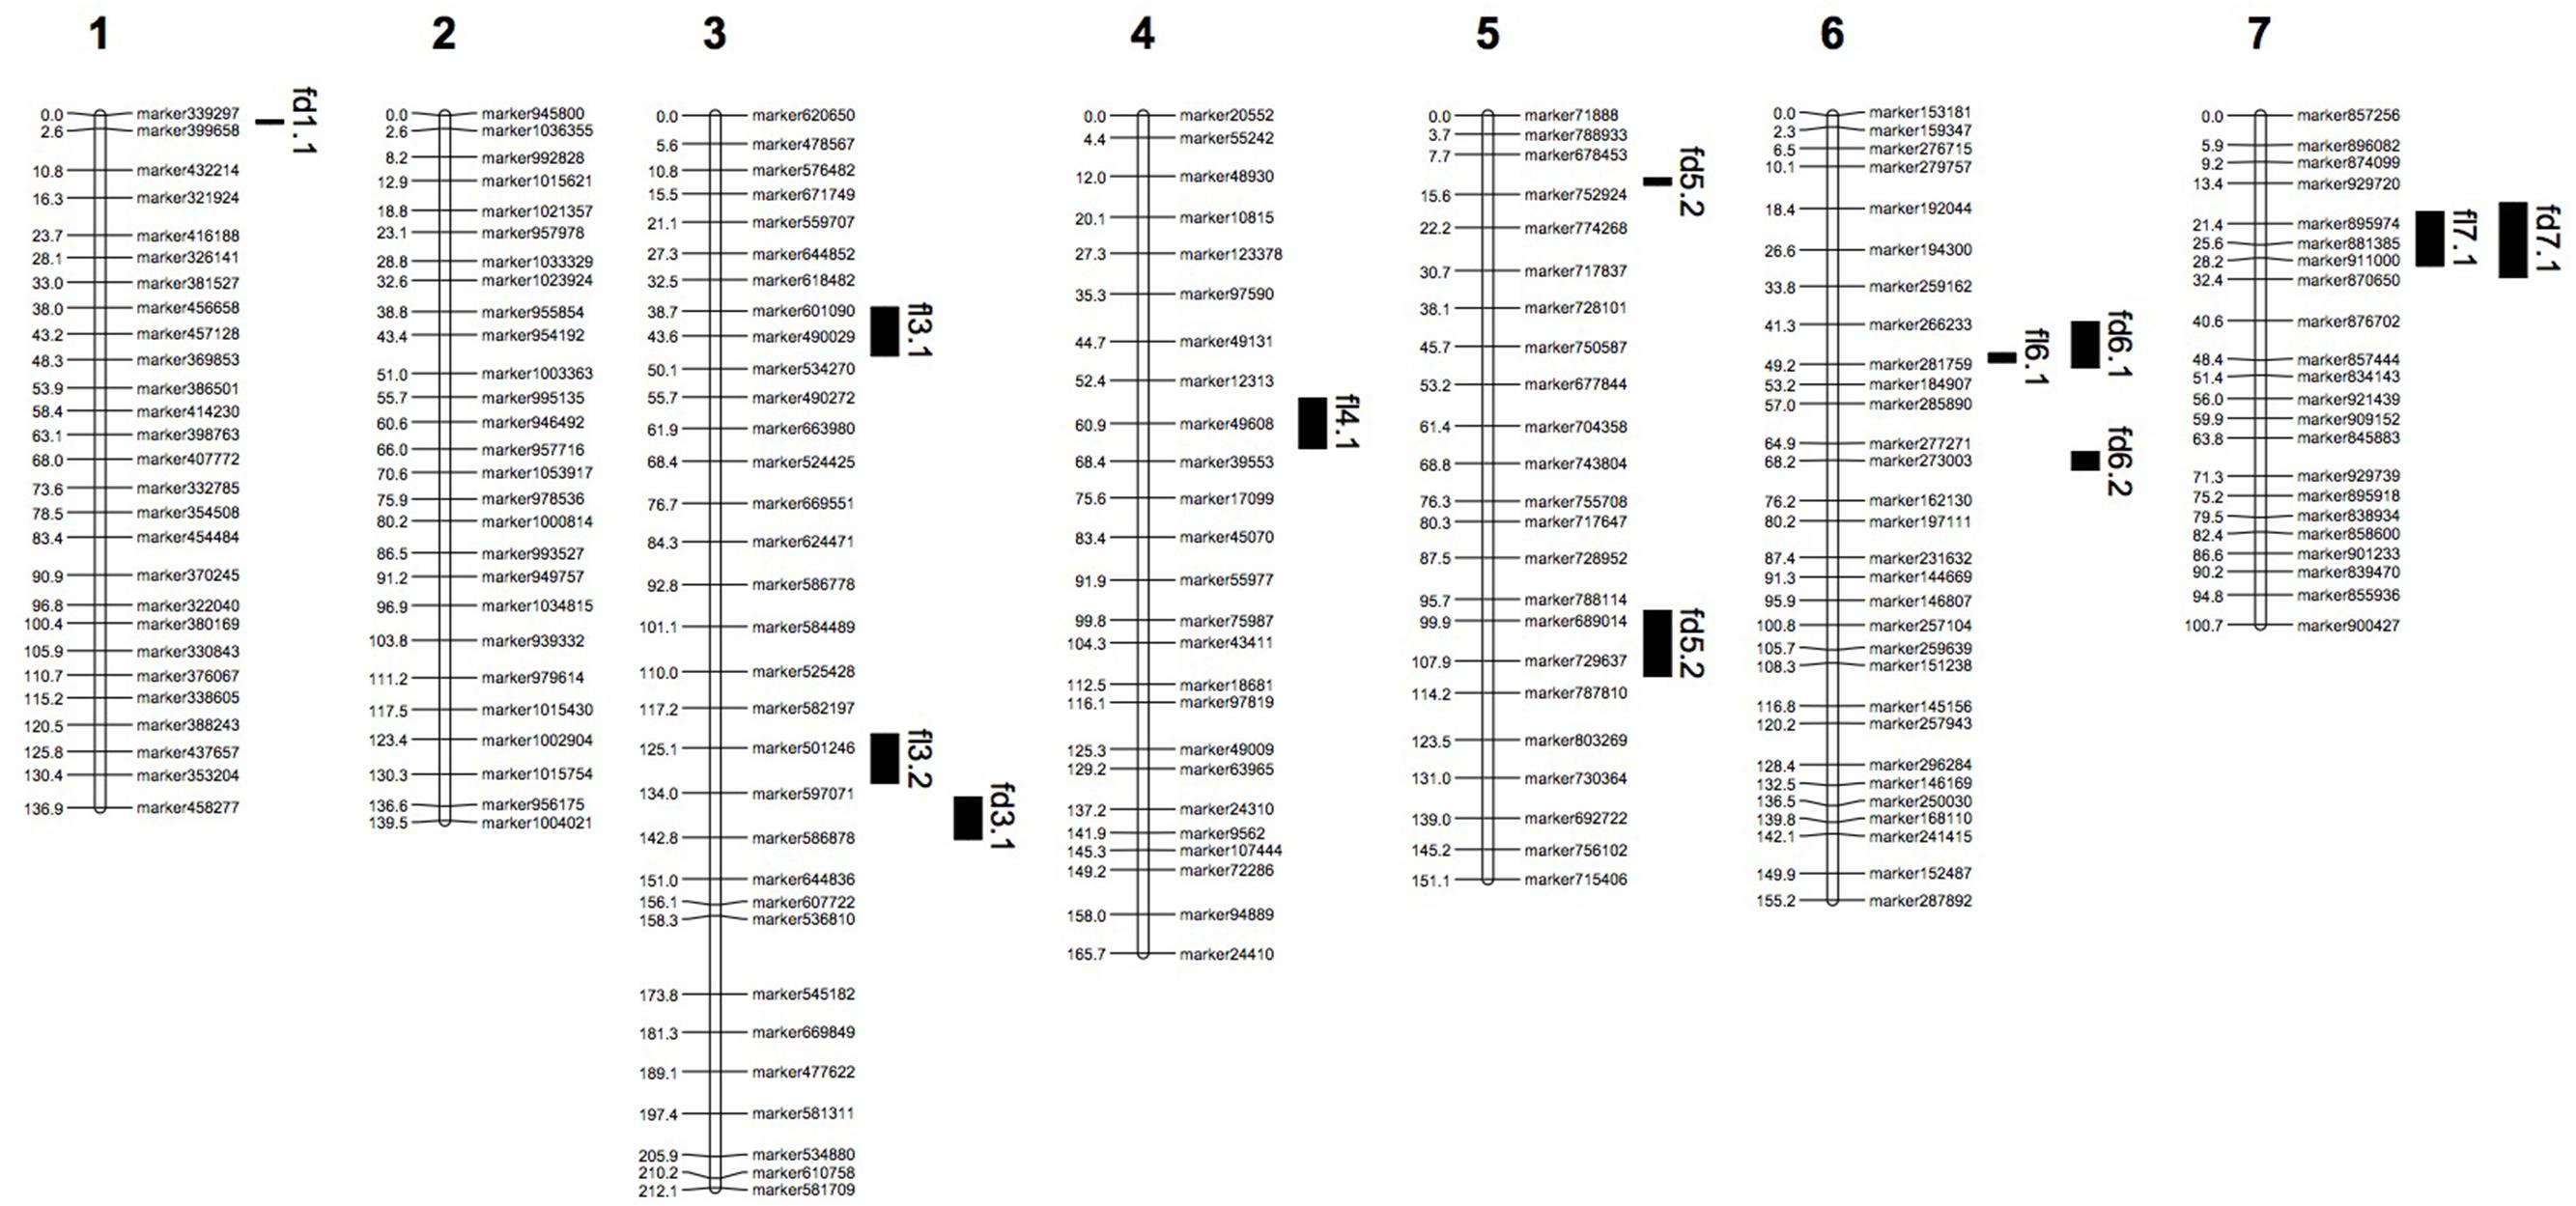
FIGURE 5. Genetic linkage map with QTL locations on seven LGs. fd: QTLs of fruit length; fl: QTLs of fruit diameter.
Discussion
SLAF-seq is not a new but also a highly automated technique, it was developed based on the high-throughput sequencing. Because of the SLAF-seq was measured by sequencing the paired-ends of the sequence-specific restriction fragment length, which makes the repeatability of it is better than other techniques (such as RAD-seq, double digest RAD-seq and GBS). The SLAF-seq method provided significant advantages making it is very suitable for analysis of cucumber which with low polymorphism, such as the development of large numbers of markers having high accuracy with less sequencing. Usually, those conventional methods of developing markers were inefficient, expensive, and time-consuming, (Kennedy et al., 2003; Huang X. et al., 2009; Xie et al., 2010), while SLAF-seq has higher density, uniformity, and efficiency. SLAF-seq has been used in several studies since it was developed, such as Zhang et al. (2013) using this method constructed the first sesame high-density SNP genetic linkage map, Huang et al. (2013) obtained the draft of kiwifruit Actinidia chinensi genome, Chen et al. (2013) researched the development of 7E chromosome-specific molecular markers for Thinopyrum elongatum, Wei et al. (2014) and Xu et al. (2015a,b) constructed the high-density SNP genetic map for cucumber, respectively.
In this research, we developed thousands SNP markers for cucumber. We obtained 22.98 Gbp raw data based on high-throughput sequencing, consisting of 143.63 M reads, including 115,789 high-quality SLAF markers with a polymorphism rate of 12.71%. The obtained markers covered seven cucumber chromosomes, which had from 1,343 to 3,545 polymorphic SLAF markers on each chromosome, and Aa total of 15,946 polymorphic SLAF markers were used to construct the high-density SNP map. The integrity and accuracy of markers were much higher and the quality and quantity of markers met the requirements for construction of a high-density genetic linkage map. Therefore, the technique of SLAF-seq is suitable for discovering plant chromosome-specific molecular markers with higher success rates, specificity, and stability at low cost.
Compared with the other two SNP maps of cucumber (Wei et al., 2014; Xu et al., 2015a), this genetic map reported in this paper is the highest density map and had the smallest average distance (0.35 cM) between adjacent markers for cucumber. The map spans 1,061.19 cM with an average number of 436.71 markers per LG with an average distance of 0.35 cM between adjacent markers. This map had the most number of markers (3,057) and the minimum average distance (0.35 cM) in all of the cucumber genetic maps (Table 5). These markers could be used for different populations. More important, the SNP markers on this map are the most abundant type of genetic variation between different individuals. SNPs are very suitable and favorable for the studies of comparative genomic (Luo et al., 2009) and association mapping (Cogan et al., 2006; Chan et al., 2010).
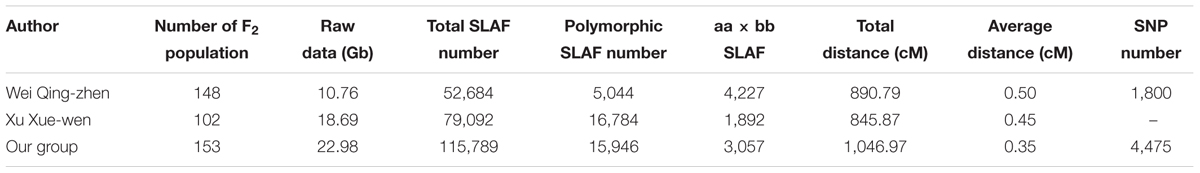
TABLE 5. Comparison of three high-density genetic SNP maps.
This map not only provides large scale SNP markers for cucumber, but also provides useful data for cucumber QTL analysis, gene fine mapping, map-based gene clone and molecular breeding. For this genetic SNP map, all the seven LGs were structured based on the level of whole genome molecular markers, so, it could be served as a reference data for positioning sequence scaffolds on the physical map of cucumber.
Fruit is the most important commodity character of cucumber (Marcelis, 1992). So high fruit yield and quality always are the most important objective for cucumber breeding. Using F3 family plants and BC1 population Kennard and Havey (1995) obtained the QTLs for several important cucumber fruit quality traits, which including fruit length, fruit diameter, seed-cavity diameter, fruit skin color, the ratio of fruit length/diameter, and seed-cavity/fruit diameter ratio. Subsequently, Serquen et al. (1997, using F3 families); Dijkuizen and Staub (2002) using S3 and BC families obtained the QTLs for fruit number, fruit weight, fruit length, fruit diameter, and fruit length/diameter ratio, and Fazio et al. (2003) identified additional QTLs for the same cucumber fruit traits. In the previous studies in our group, Yuan et al. (2008b) identified 38 QTLs for eight yield and quality components (fruit length, weight, pedicel length, flesh thickness, seed-cavity diameter, stalk length, the ratio of fruit length/diameter and fruit length/stalk) using F2 and F3 populations. Weng et al. (2015) identified three QTLs for fruit length which were localized on chromosomes 3, 4, and 6; and three QTLs for fruit diameter localized on chromosomes 2, 5, and 6. Zhou et al. (2015) detected two QTLs for fruit length which were localized on chromosomes 5 and 7.
We identified 15 QTLs for fruit length and fruit diameter in this study. There were seven QTLs for fruit length. In these seven QTLs, there are two couples of repeat QTLs, fl7.1 in 2013 autumn and fl7.1 in 2014 spring, fl4.1 in 2014 spring and fl4.1 in 2015 spring. We search the genes in the repeat regions on the web of http://www.icugi.org/cgi-bin/ICuGI/index.cgi, and we found several genes which were related to auxin response and multi cellular development. Eight QTLs were detected for fruit diameter, including two repeat QTLs fd6.1 in 2013 autumn and fd6.1 in 2014 spring. In this region there are several genes which were related to plant hormone response, many cells, and cell mitosis. So we suspect that the genes associated with fruit length and diameter may be existed in these areas.
In our study, the LOD value varies among most of the QTLs identified for fruit length and diameter of cucumber between 2.0 and 3.5. The LOD value is low to ascertain the accuracy of QTLs identified. In our opinion, there are several reasons for this phenomenon. First of all, the character data might exist a certain error, which is one of the important factors which affecting LOD values. The other reason of the low LOD value might be the different analysis software. In our study, we used the R/qtl to analysis the QTL, the reference coefficient is different from the software MapQTL, which might cause low LOD value of the QTL analysis results.
In this study, none of the QTLs for fruit length and fruit diameter are common across 2013 autumn, 2014 spring and 2015 spring seasons. We speculated that one of the most important reasons may be the fruit length and diameter are easily influenced by environment. Statistical characters results showed that, the results are relatively similar in 2014 spring and 2015 spring, which are different from 2013 autumn. In the process of cucumber growth, the temperature and humidity of 2013 autumn were much higher than that of 2014 spring and 2015 spring. Under the environment of high temperature and high humidity, plant diseases and insect pests such as powdery mildew and root rot occurred frequently. Which leads the QTL analysis also appeared similar phenomenon: in 2014 spring and 2015 spring, there are common QTLs (both fruit length and fruit diameter). The deviation when we collected phenotypic data might be another reason which caused there no common QTL in three seasons. In addition, the detected QTLs are less in each season, this is probably one of the reasons for no common QTL in three seasons.
In our study, some of the 15 QTLs for fruit length and fruit diameter are consistent with the previous reported, such as fl4.1 is the same with the main effect QTL in Yuan’s result, and the fd5.1 are the same with the QTL in Yuan’s report (Yuan et al., 2008a). But some are different from the QTLs for the two fruit traits in previous reports. We suspected that there are two reasons for this result. First of all, the gene of the same trait may be different in different materials; Second, under the influence of environment, climate and other conditions, the fruit characters are different in different season, which caused the different positioning results.
Conclusion
We obtained a high-density SNP genetic linkage map for cucumber. We constructed this map by a F2 family plants, and polymorphic markers developed by using the method of SLAF-seq. We generated a total of 22.98 Gb of raw data, containing 143.63 M reads of ~80 bp in length left over after preprocessing. The final genetic map included 3,057 markers on the seven LGs, and was 1,061.19 cM in length with an inter-marker distance of 0.35 cM. Based on this high-density genetic map, QTL analysis on fruit length and fruit diameter, seven QTLs for fruit length and eight QTLs for fruit diameter were detected. The results of this study will not only provide a platform for gene/QTL fine mapping, map-based gene isolation, and molecular breeding for cucumber, but also provide a reference to help position sequence scaffolds on the physical map and assist in the process of assembling the cucumber genome sequence.
Author Contributions
W-YZ constructed the mapping populations, surveyed fruit traits, performed genetic analysis, marker development, and wrote the paper. LH performed genome sequencing, constructed the map and mapping analysis. J-TY constructed the mapping populations. LC, M-LQ, and D-QY performed some of the field work and assisted with extracted DNA. H-LL and H-LH provided valuable research ideas. J-SP and RC designed and supervised the study.
Conflict of Interest Statement
The authors declare that the research was conducted in the absence of any commercial or financial relationships that could be construed as a potential conflict of interest.
Acknowledgments
We thank Sanwen Huang provide cucumber parent materials, as well as cucumber genome data. This research was partially supported by National Program on Key Basic Research Project of China (2012CB113900); Shanghai Municipal Committee of Science and Technology (Grant No. 13JC1403600); China Innovative Research Team, Ministry of Education, Shanghai Graduate Education and Innovation Program (Horticulture); Shanghai Municipal Agricultural Commission Project (Hu Nong Ke ZhongZi-2015-6); Agri-X Project of Shanghai Jiao Tong University (Agri-X2015002).
Supplementary Material
The Supplementary Material for this article can be found online at: http://journal.frontiersin.org/article/10.3389/fpls.2016.00437
FIGURE S1: | High-density cucumber genetic map composing of SNPs.
TABLE S1: | Sequence information of total SLAFs.
TABLE S2: | Sequence information of mapped SNPs.
TABLE S3: | Physical position of mapped markers.
References
Bradeen, J. M., Staub, J. E., Wye, C., Antonise, R., and Peleman, J. (2001). Towards an expanded and integrated linkage map of cucumber (Cucumis sativus L.). Genome 44, 111–119. doi: 10.1139/gen-44-1-111
Cavangnaro, P. F., Senalik, D. A., Yang, L., Simon, P. W., Harkins, T. T., Kodira, C. D., et al. (2010). Genome-wide characterization of simple sequence repeats in cucumber (Cucumis sativus L.). BMC Genomics 11:569. doi: 10.1186/1471-2164-11-569
Chan, E. K., Rowe, H. C., and Kliebenstein, D. J. (2010). Understanding the evolution of defense metabolites in Arabidopsis thaliana using genome-wide association mapping. Genetics 185, 991–1007. doi: 10.1534/genetics.109.108522
Chen, S., Huang, Z., Dai, Y., Qin, S., Gao, Y., Zhang, L., et al. (2013). The development of 7E chromosome-specific molecular markers for Thinopyrum elongatum based on SLAF-seq technology. PLoS ONE 8:e65122. doi: 10.1371/journal.pone.0065122
Cogan, N. O., Ponting, R. C., Vecchies, A. C., Drayton, M. C., George, J., Dracatos, P. M., et al. (2006). Gene-associated single nucleotide polymorphism discovery in perennial ryegrass (Lolium perenne L.). Mol. Genet. Genomics 276, 101–112. doi: 10.1007/s00438-006-0126-8
Dijkhuizen, A., Meglic, V., Staub, J., and Havey, M. (1994). Linkages among RFLP, RAPD, isozyme, disease-resistance, and morphological markers in narrow and wide crosses of cucumber. Theor. Appl. Genet. 89, 42–48. doi: 10.1007/BF00226980
Dijkuizen, A., and Staub, J. E. (2002). QTL conditioning yield and fruit quality traits in cucumber (Cucumis sativus L.): effects of environment and genetic background. J. New Seeds 4, 1–30. doi: 10.1300/J153v04n04_01
Doyle, J. J., and Doyle, J. L. (1987). A rapid DNA isolation procedure for small quantities of fresh leaf tissue. Phytochem. Bull. 19, 11–15.
Esteras, C., Gomez, P., Monforte, A. J., Blanca, J., Vicente-Dolera, N., Roig, C., et al. (2012). High-throughput SNP genotyping in cucurbita pepo for map construction and quantitative trait loci mapping. BMC Genomics 13:80. doi: 10.1186/1471-2164-13-80
Fazio, G., Staub, J., and Stevens, M. (2003). Genetic mapping and QTL analysis of horticultural traits in cucumber (Cucumis sativus L.) using recombinant inbred lines. Theor. Appl. Genet. 107, 864–874. doi: 10.1007/s00122-003-1277-1
Huang, S., Ding, J., Deng, D., Tang, W., and Sun, H. (2013). Draft genome of the kiwifruit Actinidia chinensis. Nat. Commun. 4, 2640. doi: 10.1038/ncomms3640
Huang, S., Li, R., Zhang, Z., Li, L., Gu, X., Fan, W., et al. (2009). The genome of the cucumber, Cucumis sativus L. Nat. Genet. 41, 1275–1281. doi: 10.1038/ng.475
Huang, X., Feng, Q., Qian, Q., Zhao, Q., Wang, L., Wang, A., et al. (2009). High-throughput genotyping by whole-genome resequencing. Genome Res. 19, 1068–1076. doi: 10.1101/gr.089516.108
Kennard, W. C., and Havey, M. J. (1995). Quantitative trait analysis of fruit quality in cucumber: QTL detection, confirmation, and comparison with mating-design variation. Theor. Appl. Genet. 91, 53–61. doi: 10.1007/BF00220858
Kennedy, G. C., Matsuzaki, H., Dong, S., Liu, W.-M., and Huang, J. (2003). Large scale genotyping of complex DNA. Nat. Biotechnol. 21, 1233–1237. doi: 10.1038/nbt869
Li, X. Z., Pan, J. S., Wang, G., Tian, L. B., Si, L. T., Wu, A. Z., et al. (2005). Localization of genes for lateral branch and female sex expression and construction of a molecular linkage map in cucumber (Cucumis sativus L.) with RAPD markers. Prog. Nat. Sci. 15, 143–148. doi: 10.1080/10020070512331341900
Li, Z., Huang, S., Liu, S., Pan, J., Zhang, Z., Tao, Q., et al. (2009). Molecular isolation of the M gene suggests that a conserved-residue onversion induces the formation of bisexual flowers in cucumber plants. Genetics 182, 1381–1385. doi: 10.1534/genetics.109.104737
Liu, D., Ma, C., Hong, W., Huang, L., Liu, M., Liu, H., et al. (2014). Construction and analysis of high-density linkage map using high-throughput sequencing data. PLoS ONE 9:e98855. doi: 10.1371/journal.pone.0098855
Luo, M. C., Deal, K. R., Akhunov, E. D., Akhunova, A. R., Anderson, O. D., Anderson, J. A., et al. (2009). Genome comparisons reveal a dominant mechanism of chromosome number reduction in grasses and accelerated genome evolution in Triticeae. Proc. Natl. Acad. Sci. U.S.A. 106, 15780–15785. doi: 10.1073/pnas.0908195106
Marcelis, L. F. M. (1992). The dynamics of growth and dry matter distribution in cucumber. Ann. Bot. 69, 487–492. doi: 10.1093/aob/mcr150
Miller, M. R., Dunham, J. P., Amores, A., Cresko, W. A., and Johnson, E. A. (2007). Rapid and cost-effective polymorphism identification and genotyping using restriction site associated DNA (RAD) markers. Genome Res. 17, 240–248. doi: 10.1101/gr.5681207
Pan, J. S., Wang, G., Li, X. Z., He, H. L., Wu, A. Z., and Cai, R. (2005). Construction of a genetic map with SRAP markers and localization of the gene responsible for the first-flower-node trait in cucumber (Cucumis sativus L.). Prog. Nat. Sci. 15, 407–413. doi: 10.1080/10020070512331342310
Park, Y. H., Sensoy, S., Wye, C., Antonise, R., Peleman, J., and Havey, M. J. (2000). A genetic map of cucumber composed of RAPDs, RFLPs, AFLPs, and loci conditioning resistance to papaya ringspot and zucchini yellow mosaic viruses. Genome 43, 1003–1010. doi: 10.1605/01.301-0005130945.2009
Peterson, B. K., Weber, J. N., Kay, E. H., Fisher, H. S., and Hoekstra, H. E. (2012). Double digest RADseq: an inexpensive method for de novo SNP discovery and genotyping in model and non-model species. PLoS ONE 7:e37135. doi: 10.1371/journal.pone.0037135
Petroli, C. D., Sansaloni, C. P., Carling, J., Steane, D. A., Vaillancourt, R. E., Myburg, A. A., et al. (2012). Genomic characterization of DArT markers based on high-density linkage analysis and physical mapping to the eucalyptus genome. PLoS ONE 7:e44684. doi: 10.1371/journal.pone.0044684
Poland, J. A., Brown, P. J., Sorrells, M. E., and Jannink, J. L. (2012). Development of high-density genetic maps for barley and wheat using a novel two-enzyme genotyping-by-sequencing approach. PLoS ONE 7:e32253. doi: 10.1371/journal.pone.0032253
Qi, Z., Huang, L., Zhu, R., Xin, D., Liu, C., Han, X., et al. (2014). A high-density genetic map for soybean on specific length amplified fragment sequencing. PLoS ONE 9:e104871. doi: 10.1371/journal.pone.0104871
Ren, Y., Zhang, Z., Liu, J., Staub, J. E., Han, Y., Cheng, Z., et al. (2009). An integrated genetic and cytogenentic map of the cucumber genome. PLoS ONE 4:e5795. doi: 10.1371/journal.pone.0005795
Ren, Y., Zhao, H., Kou, Q., Jiang, J., Guo, S., Zhang, H., et al. (2012). A high resolution genetic map anchoring scaffolds of the sequenced watermelon genome. PLoS ONE 7:e29453. doi: 10.1371/journal.pone.0029453
Sakata, Y., Kubo, N., Morishita, M., Kitadani, E., Sugiyama, M., and Hirai, M. (2005). QTL analysis of powdery mildew resistance in cucumber (Cucumis sativus L.). Theor. Appl. Genet. 112, 243–250. doi: 10.1007/s00122-005-0121-1
Sen, S., and Churchill, G. A. (2001). A statistical framework for quantitative rait mapping. Genetics 159, 371–387.
Serquen, F. C., Bacher, J., and Staub, J. E. (1997). Mapping and QTL analysis of horticultural traits in a narrow cross in cucumber (Cucumis sativus L.) using random-ampliWed polymorphic DNA markers. Mol. Breed. 3, 257–268. doi: 10.1023/A:1009689002015
Song, W., Pang, R., Niu, Y., Gao, F., Zhao, Y., Zhang, J., et al. (2012). Construction of high-density genetic linkage maps and mapping of growth-related quantitative trail loci in the Japanese flounder (Paralichthys olivaceus). PLoS ONE 7:e50404. doi: 10.1371/journal.pone.0050404
Sun, X., Liu, D., Zhang, X., Li, W., Liu, H., Hong, W., et al. (2013). SLAF-seq: an efficient method of large-scale de novo SNP discovery and genotyping using high-throughput sequencing. PLoS ONE 8:e58700. doi: 10.1371/journal.pone.0058700
Sun, Z., Staub, J. E., Chung, S. M., and Lower, R. L. (2006). Identification and comparative analysis of quantitative trait loci associated with parthenocarpy in processing cucumber. Plant Breed. 125, 281–287. doi: 10.1111/j.1439-0523.2006.01225.x
Van Ooijen, J. (2006). Voorrips R: Joinmap 4.0. Software for the Calculation of Genetic Linkage Maps in Experimental Populations. Wageningen: Kyazma B.V.
Vision, T. J., Brown, D. G., Shmoys, D. B., Durrett, R. T., and Tanksley, S. D. (2000). Selective mapping: a strategy for optimizing the construction of high-density linkage maps. Genetics 155, 407–420.
Wang, G., Pan, J. S., Li, X. Z., He, H. L., Wu, A. Z., and Cai, R. (2005). Construction of a cucumber genetic linkage map with SRAP markers and location of the genes for lateral branch traits. Sci. China C Life Sci. 48, 213–220. doi: 10.1007/BF03183614
Wang, Y., Sun, S., Liu, B., Wang, H., Deng, J., Liao, Y., et al. (2011). A sequence-based genetic linkage map as a reference for Brassica rapa pseudo chromosome assembly. BMC Genomics 12:239. doi: 10.1186/1471-2164-12-239
Wei, Q., Wang, Y., Qin, X., Zhang, Y., Zhang, Z., Wang, J., et al. (2014). An SNP-based saturated genetic map and QTL analysis of fruit-related traits in cucumber using specific-length amplified fragment (SLAF) sequencing. BMC Genomics 15:1158. doi: 10.1186/1471-2164-15-1158
Weng, Y., Colle, M., Wang, Y., Yang, L., Rubinstein, M., Sherman, A., et al. (2015). QTL mapping in multiple populations and development stages reveals dynamic quantitative trait loci for fruit size in cucumbers of different market classes. Theor. Appl. Genet. 128, 1747–1763. doi: 10.1007/s00122-015-2544-7
Wóycicki, R., Witkowicz, J., Gawroñski, P., Dąbrowska, J., Lomsadze, A., Pawełkowicz, M., et al. (2011). The genome sequence of the North-European cucumber (Cucumis sativus L.) unravels evolutionary adaptation mechanisms in plants. PLoS ONE 6:e2272. doi: 10.1371/journal.pone.0022728
Xie, J., and Wehner, C. T. (2001). Gene list 2001 for cucumber. Cucurbit Genet. Coop. Rpt. 24, 110–136.
Xie, W., Feng, Q., Yu, H., Huang, X., and Zhao, Q. (2010). Parent-independent genotyping for constructing an ultra high-density linkage map based on population sequencing. Proc. Natl. Acad. Sci. U.S.A. 107, 10578–10583. doi: 10.1073/pnas.1005931107
Xu, X., Lu, L., Zhu, B., Xu, Q., Qi, X., and Chen, X. (2015a). QTL mapping of cucumber fruit flesh thickness by SLAF-seq. Sci. Rep. 5, 15829. doi: 10.1038/srep15829
Xu, X., Xu, R., Zhu, B., Yu, T., Qu, W., Lu, L., et al. (2015b). A high-density genetic map of cucumber derived from Specific Length Amplified Fragment sequencing (SLAF-seq). Front. Plant Sci. 5:768. doi: 10.3389/fpls.2014.00768
Yang, X. Q., Zhang, W. W., He, H. L., and Nie, J. T. (2014). Tuberculate fruit gene Tu encodes a C2H2 zinc finger protein that is required for the warty fruit phenotype in cucumber (Cucumis sativus L.). Plant J. 78, 1034–1046. doi: 10.1111/tpj.12531
Yuan, X. J., Li, X. Z., Pan, J. S., Wang, G., Jiang, S., Li, X. H., et al. (2008a). Genetic linkage map construction and location of QTLs for fruit-related traits in cucumber. Plant Breed. 127, 180–188. doi: 10.1111/j.1439-0523.2007.01426.x
Yuan, X. J., Pan, J. S., and Cai, R. (2008b). Genetic mapping and QTL analysis of fruit and Xower related traits in cucumber (Cucumis sativus L.) using recombinant inbred lines. Euphytica 164, 473–491. doi: 10.1007/s10681-008-9722-5
Zhang, W. W., Pan, J. S., He, H. L., Li, Z., Zhao, J. L., Yuan, X. J., et al. (2012). Construction of a high density integrated genetic map for cucumber (Cucumis sativus L.). Theor. Appl. Genet. 124, 249–259. doi: 10.1007/s00122-011-1701-x
Zhang, Y., Wang, L., Xin, H., Li, D., Ma, C., Ding, X., et al. (2013). Construction of a high-density genetic map for sesame based on large scale marker development by specific length amplified fragment (SLAF) sequencing. BMC Plant Biol. 13:141. doi: 10.1186/1471-2229-13-141
Keywords: Cucumis sativus L., SLAF-seq, high-density genetic map, SNPs, QTL analysis
Citation: Zhu W-Y, Huang L, Chen L, Yang J-T, Wu J-N, Qu M-L, Yao D-Q, Guo C-L, Lian H-L, He H-L, Pan J-S and Cai R (2016) A High-Density Genetic Linkage Map for Cucumber (Cucumis sativus L.): Based on Specific Length Amplified Fragment (SLAF) Sequencing and QTL Analysis of Fruit Traits in Cucumber. Front. Plant Sci. 7:437. doi: 10.3389/fpls.2016.00437
Received: 30 October 2015; Accepted: 21 March 2016;
Published: 19 April 2016.
Edited by:
Henry T. Nguyen, University of Missouri, USAReviewed by:
Xiaowu Wang, Chinese Academy of Agricultural Sciences, ChinaSwarup Kumar Parida, National Institute of Plant Genome Research, India
Heng Ye, University of Missouri, USA
Copyright © 2016 Zhu, Huang, Chen, Yang, Wu, Qu, Yao, Guo, Lian, He, Pan and Cai. This is an open-access article distributed under the terms of the Creative Commons Attribution License (CC BY). The use, distribution or reproduction in other forums is permitted, provided the original author(s) or licensor are credited and that the original publication in this journal is cited, in accordance with accepted academic practice. No use, distribution or reproduction is permitted which does not comply with these terms.
*Correspondence: Jun-Song Pan, jspan71@sjtu.edu.cn; Run Cai, cairun@sjtu.edu.cn
†These authors have contributed equally to this work.