 John V. Syring1*
 Jacob A. Tennessen2
 Tara N. Jennings3
 Jill Wegrzyn4
 Camille Scelfo-Dalbey5
 Richard Cronn6
- 1Department of Biology, Linfield College, McMinnville, OR, USA
- 2Department of Integrative Biology, Oregon State University, Corvallis, OR, USA
- 3Department of Botany and Plant Pathology, Oregon State University, Corvallis, OR, USA
- 4Department of Ecology and Evolutionary Biology, University of Connecticut, Storrs, CT, USA
- 5Jack Baskin School of Engineering, University of California, Santa Cruz, Santa Cruz, CA, USA
- 6Pacific Northwest Research Station, United States Department of Agriculture, Forest Service, Corvallis, OR, USA
Whitebark pine (Pinus albicaulis) inhabits an expansive range in western North America, and it is a keystone species of subalpine environments. Whitebark is susceptible to multiple threats – climate change, white pine blister rust, mountain pine beetle, and fire exclusion – and it is suffering significant mortality range-wide, prompting the tree to be listed as ‘globally endangered’ by the International Union for Conservation of Nature and ‘endangered’ by the Canadian government. Conservation collections (in situ and ex situ) are being initiated to preserve the genetic legacy of the species. Reliable, transferrable, and highly variable genetic markers are essential for quantifying the genetic profiles of seed collections relative to natural stands, and ensuring the completeness of conservation collections. We evaluated the use of hybridization-based target capture to enrich specific genomic regions from the 27 GB genome of whitebark pine, and to evaluate genetic variation across loci, trees, and geography. Probes were designed to capture 7,849 distinct genes, and screening was performed on 48 trees. Despite the inclusion of repetitive elements in the probe pool, the resulting dataset provided information on 4,452 genes and 32% of targeted positions (528,873 bp), and we were able to identify 12,390 segregating sites from 47 trees. Variations reveal strong geographic trends in heterozygosity and allelic richness, with trees from the southern Cascade and Sierra Range showing the greatest distinctiveness and differentiation. Our results show that even under non-optimal conditions (low enrichment efficiency; inclusion of repetitive elements in baits), targeted enrichment produces high quality, codominant genotypes from large genomes. The resulting data can be readily integrated into management and gene conservation activities for whitebark pine, and have the potential to be applied to other members of 5-needle pine group (Pinus subsect. Quinquefolia) due to their limited genetic divergence.
Introduction
Whitebark pine (Pinus albicaulis) has an expansive range occurring across ∼340,000 square kilometers in the western U.S. and Canada (Figure 1; Wilson, 2007; COSEWIC, 2010). There are an estimated 200 million individuals of whitebark pine in Canada (COSEWIC, 2010), with a potential 300–400 million individuals range-wide. This species has proven susceptible to an interconnected suite of threats that include anthropogenic climate change, white pine blister rust (Cronartium ribicola), mountain pine beetle outbreaks (Dendroctonus ponderosae), and fire exclusion; as a consequence, the species is suffering tremendous mortality across its range (Kendall and Keane, 2001; Warwell et al., 2007; Aubry et al., 2008; Gibson et al., 2008; Bockino and Tinker, 2012). At the ongoing rate of decline of 1.5–3.5%/year in Alberta and British Columbia, population reductions between 78–97% are predicted within the next 100 years (COSEWIC, 2010). Populations in the U.S. are equally threatened, with reported declines over the last several decades ranging between ∼40% (western Cascade Range, Washington; Shoal and Aubry, 2004) to 70% (eastern California; Millar et al., 2012). As a result of these reported declines, whitebark pine is globally assessed as endangered by the IUCN (2015), regionally endangered by the Canadian government (COSEWIC, 2010), and has been determined to be “warranted” for listing under the U.S. Endangered Species Act (currently withheld due to funding limitations; US Fish and Wildlife Service, 2011).
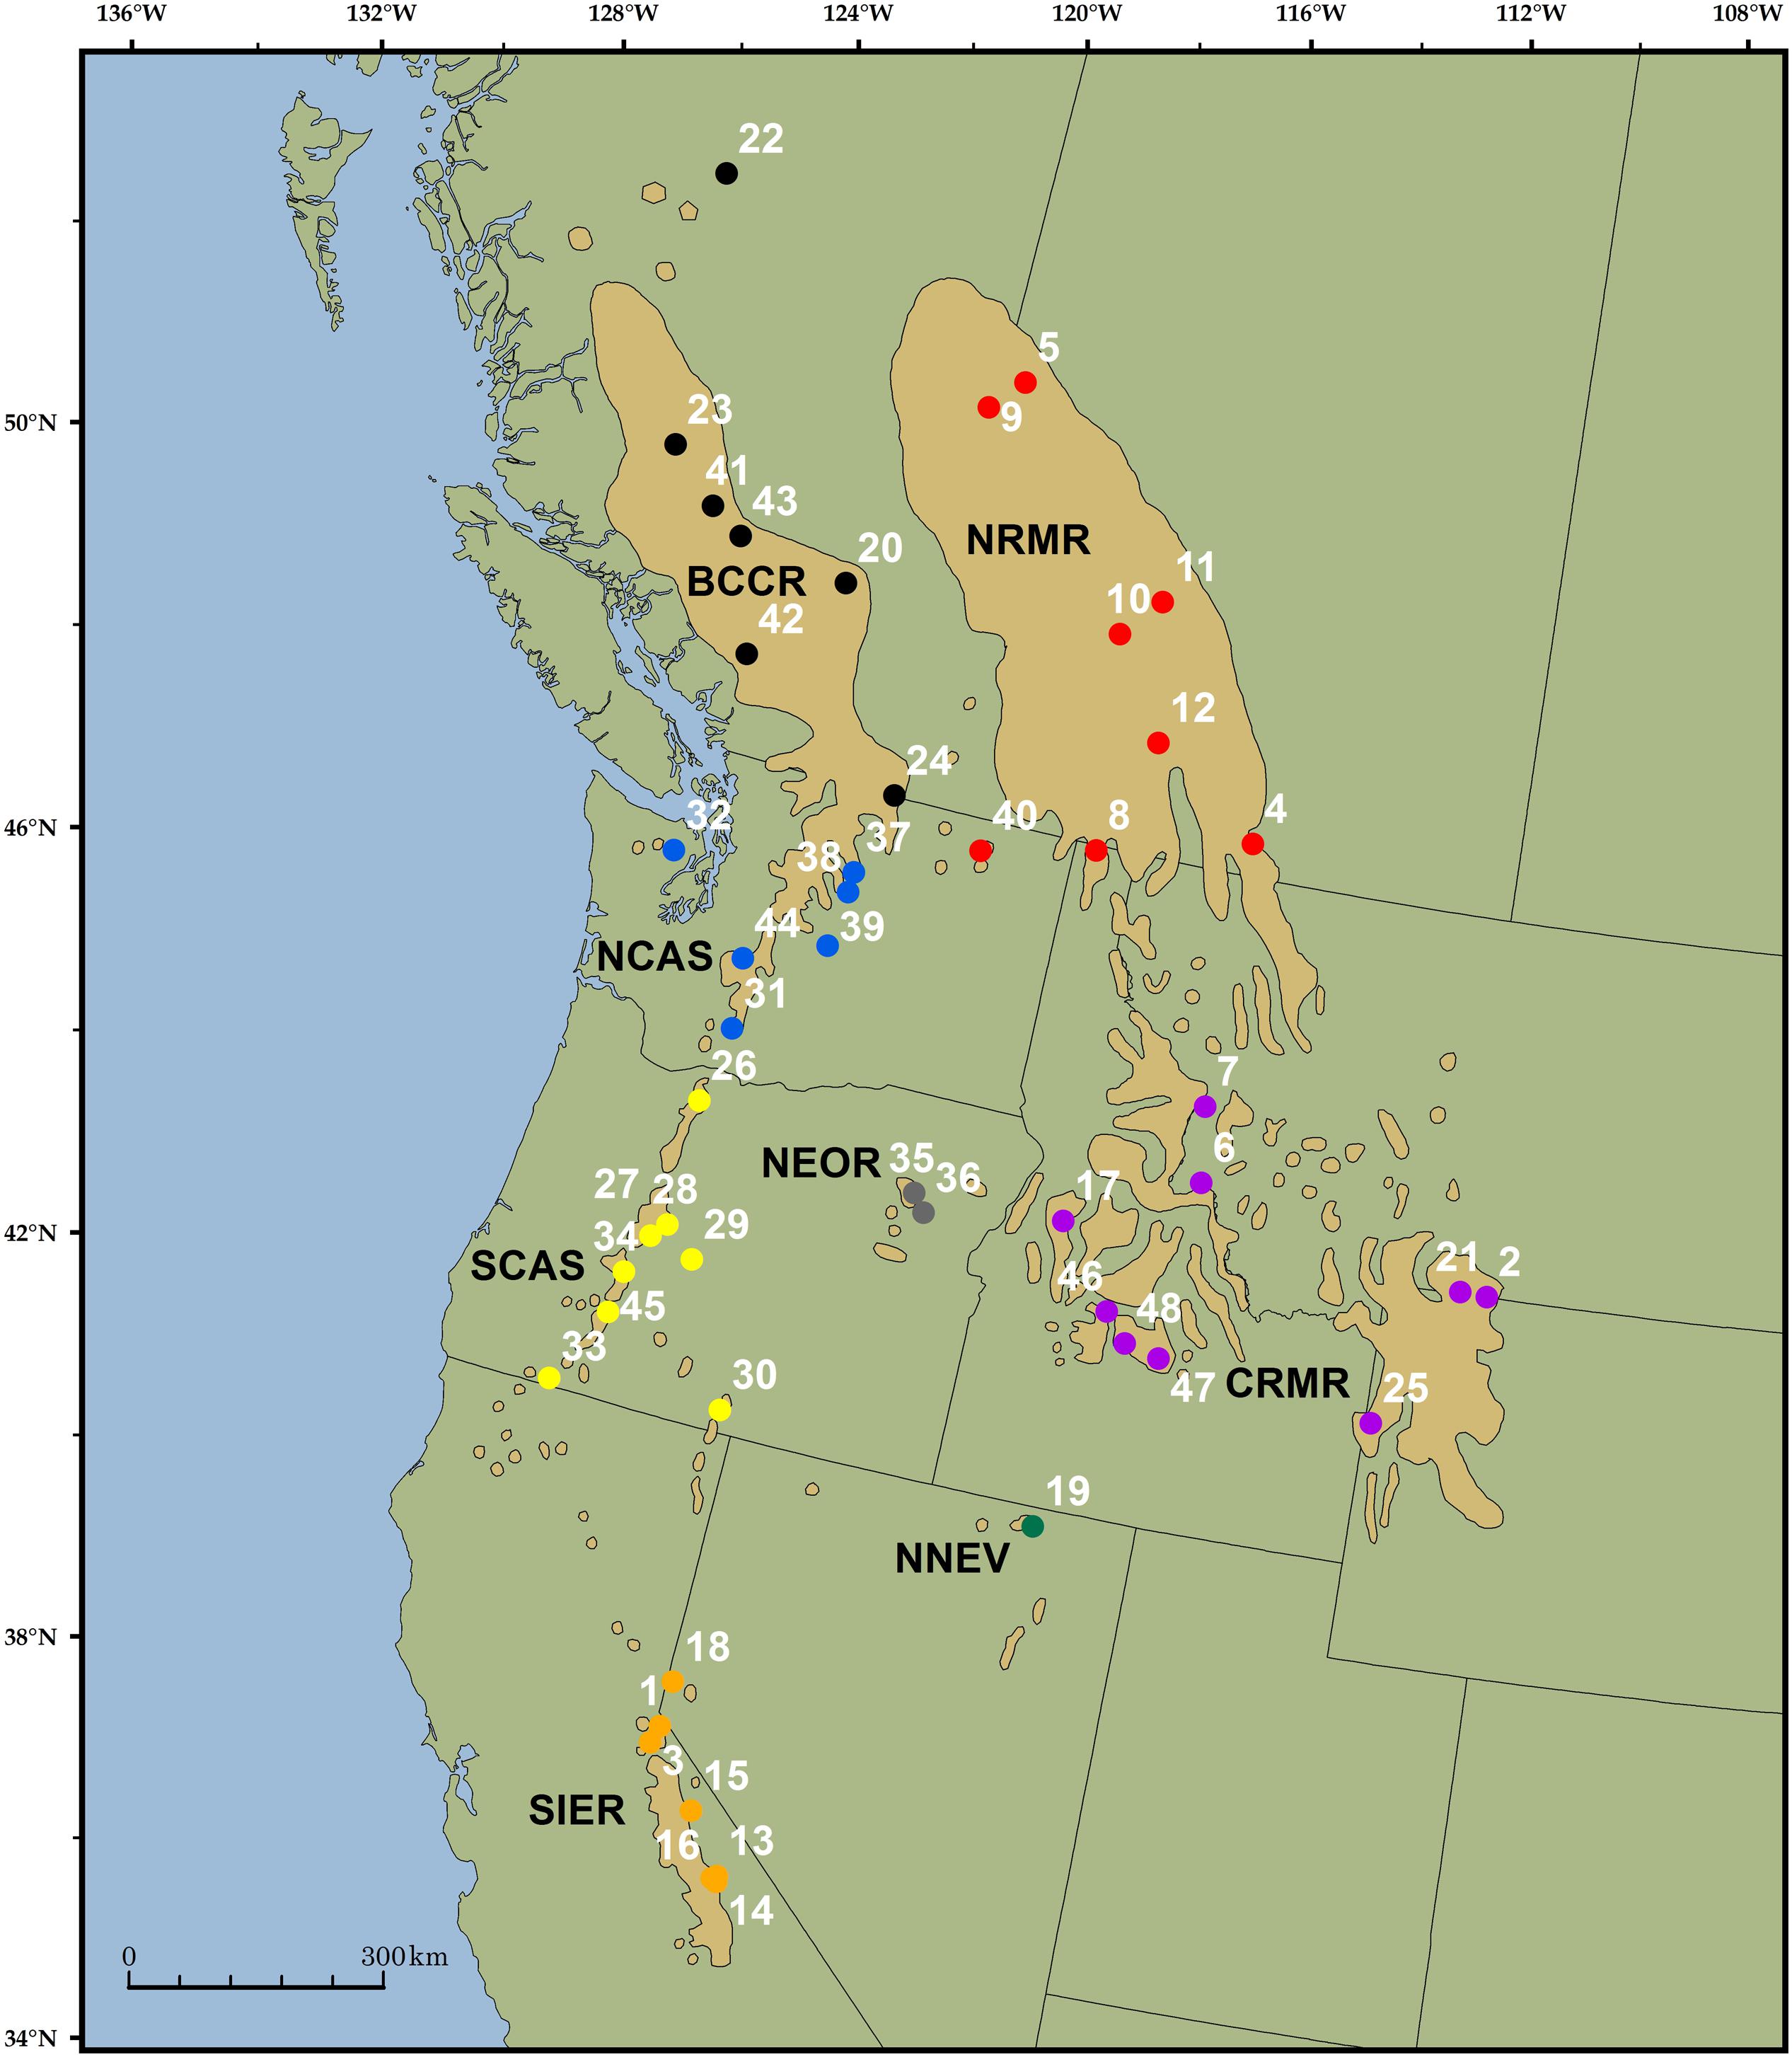
FIGURE 1. Range of whitebark pine (tan polygons; Little, 1971) and the location of the 48 trees included in the analysis. Unique colors and associated four-letter abbreviations represent groups of samples chosen a priori based on previous research (Richardson et al., 2002). Sample 42 was excluded from sample-specific analyses due to poor quality sequencing.
An understanding of the amount and apportionment of spatial genetic diversity is essential for science-based management and restoration, but these needs have not been adequately met for whitebark pine due to historical limitations in available genetic markers for pines, a group that is species-rich (>100; Price et al., 2000) and defined by large (up to 30 Gbp; Morse et al., 2009) and complex genomes. Allozymes and organelle DNA sequences have seen the widest application in pines (Jorgensen and Hamrick, 1997; Rogers et al., 1999; Richardson et al., 2002; Bower and Aitken, 2007; Mahalovich and Hipkins, 2011), but these methods suffer from low power and/or uniparental inheritance. The advent of next-generation genomics technologies has ushered an explosion in methods that can be reliably applied to non-model species (Cronn et al., 2012; Jones and Good, 2016), and this offers new opportunities to develop genetic markers that are ideally suited for addressing gene conservation in whitebark and other imperiled conifers. Even with advancements in DNA sequencing, genomes of this size cannot be affordably sequenced for population-level studies. Instead, methods that reduce the complexity of the genome to a reliably sampled subset of loci are more cost-effective. Hybridization-based capture methods have emerged as one of the most powerful methods for developing codominant genetic markers with high transferability across laboratories and studies, populations, and possibly species (Gnirke et al., 2009; Cronn et al., 2012; Tennessen et al., 2012; Hebert et al., 2013; Neves et al., 2013; Jones and Good, 2016; Müller et al., 2015), and they have recently been successfully applied to evaluate diversity in conifers with large-genomes (Neves et al., 2013; Müller et al., 2015; Pavy et al., 2016).
Whitebark pine is a superb organism in which to test solution hybridization methods for use in conifer conservation because of its large and complex genome, its expansive and highly fragmented range, and the management implications resulting from an understanding of its population structure. The species spans nearly 21° latitude from the southern Sierras to northern British Columbia, and 28° longitude from the Cascade Mountains of the Pacific Northwest to the Rocky Mountains of Alberta and the US (Figure 1). It forms mixed or pure populations in high elevation landscapes, resulting in a highly fragmented distribution across the landscape, with many stands geographically isolated on high elevation ‘tree islands’ (Arno and Hoff, 1989; Jorgensen and Hamrick, 1997; Keane et al., 2011).
Whitebark pine is unusual among conifers in having no commercial value, but it is a keystone species of subalpine environments and it provides vital ecosystem services (Mills et al., 1993; Mattson et al., 2001; Tomback et al., 2001; Aubry et al., 2008). Whitebark’s large wingless seeds are an important food source for mammals and birds (Keane et al., 1990), and trees provide nesting sites, cover, and protection for species associated with alpine ecosystems. The crowns help to accumulate snow during winter, and the canopy provides shade that increases snowpack retention and delays snow melt during the growing season (Farnes, 1990; Tomback et al., 2001). The health of this species directly impacts the ecological health of subalpine environments, as well as downslope ecosystems (Ellison et al., 2005). Population structure in whitebark pine has been heavily influenced by Pleistocene glaciation, which resulted in a pattern of northward and higher elevation recolonization of Canada from multiple lower-elevation refugia following deglaciation (Richardson et al., 2002; Krakowski et al., 2003; Shafer et al., 2010). Whitebark pine is one of a small number of pines that is bird dispersed, with the primary disperser being the Clark’s nutcracker (Nucifraga columbiana). Seed dispersal by nutcrackers has a strong impact on genetic structure (Furnier et al., 1987; Richardson et al., 2002), with birds traveling from several 100 m to >10 km to cache seeds (Tomback, 2005).
Due to their wind pollination syndrome, conifers typically show low among-population variation and very high within-stand variation (Jorgensen and Hamrick, 1997; Rogers et al., 1999; Petit and Hampe, 2006). Whitebark pine shows a similar structure, with low allozyme-based estimates of differentiation (FST ≈ 0.06 (Bruederle et al., 2001; Krakowski et al., 2003; Bower and Aitken, 2008), indicating that most diversity is found within populations, with limited genetic structure except at larger geographic scales (Jorgensen and Hamrick, 1997; Bruederle et al., 2001; Bower and Aitken, 2008). Despite evidence for low neutral marker differentiation, significant differences in quantitative phenotypic traits (height growth, cold hardiness, timing of needle flush) have been shown to exist over smaller geographic scales (Bower and Aitken, 2007, 2008). The nature of this variation is largely clinal and indicative of adaptation to local environments (COSEWIC, 2010). Clinal patterns have also been detected in allozymes, as correlations between observed heterozygosity and geographic variables have been shown to be significant (R2 = 0.36, latitude; R2 = 0.30 longitude) (Krakowski et al., 2003). Evidence for strong population uniqueness (e.g., private alleles or haplotypes) is generally lacking in the species, although Richardson et al. (2002) found that populations from Yellowstone and the Southern Sierras were significantly divergent from the rest of the population with regard to chloroplast and mitochondrial genome haplotypes.
In this paper, we use hybridization-based capture probes to assess sequence variability across enriched targets from whitebark pine across its range. We designed capture probes that targeted 200 contiguous bases from genomic regions encoding 7,849 expressed transcripts, and used these probes to enrich targets from 48 trees spanning the geographic (and presumably genetic) range of whitebark pine. Our results show that the inclusion of repetitive genomic elements in the probe pool hampered the efficiency of even enrichment across targets, but that the resulting dataset still permitted interrogation of 4,452 transcripts and 32% of targeted positions (528,873 sites), revealing 12,390 segregating sites. Analysis of population variation based on this subset of information reveals strong geographic trends in heterozygosity and allelic richness, with trees from the southern Cascade and Sierra Range showing the greatest distinctiveness and differentiation. Our study shows that target enrichment generates high quality codominant genotypes, even when enrichment is low and repetitive loci are included in the bait pool, and that the resulting data are relevant to management and gene conservation activities.
Materials and Methods
Sample Collections and DNA Extraction
Forty-eight samples were collected from across the range of whitebark pine, each representing a unique location (Figure 1, Supplementary Table S1). Sampling was stratified by geographic region to approximately match provinces identified as ‘distinctive’ based on mitochondrial DNA surveys (Richardson et al., 2002). These a priori groupings were used to calculate FST (see below). We included 1 – 9 trees per region: NRMR (Northern Rocky Mountain Range, N = 8), CRMR (Central Rocky Mountain Range, N = 9), BCCR (British Columbia Coast Range, N = 7), NCAS (North Cascades, N = 7), SCAS (Southern Cascades, N = 7), NEOR (Northeastern Oregon, N = 2), NNEV (Northern Nevada, N = 1) and SIER (Sierra Mountain Range, N = 7) (Supplementary Table S1). Diploid genomic DNA was extracted from needles (35 samples) or seed embryos (13 samples) using the FastDNA Kit (Qbiogene, Irvine, CA, USA). A total of 50–100 mg of tissue was used for needle extractions, while entire embryos were dissected and used in extractions.
Probe Design, Library Construction, and DNA Sequencing
Hybridization probes for this study were developed using two sources of information. First, we chose an initial set of target loci that previously showed a high degree of hybridization-enrichment success in loblolly pine (Neves et al., 2013). Briefly, the authors developed hybridization probes for 14,729 loblolly pine transcripts, and reported high-success for 11,552 loci. Homologs of these ‘high-success’ loblolly pine transcripts were identified from a draft needle transcriptome for whitebark pine (Baker et al., in review) using BLASTN (Altschul et al., 1990) and an e-value cutoff of 1 e-50. BLAT (Kent, 2002) was used to identify and remove chloroplast (NCBI sequence FJ899566.1) and mitochondrial (Neale et al., 20141) transcripts, and this resulted in a final list of 7,855 transcripts for probe design. Sequences were masked using RepeatMasker v. 4.0 (Smit et al., 2014) for simple repeats and low complexity DNA, and individual 100-mer probes were localized to the 5′ end of each transcript, with two probes per locus covering 200 contiguous bases (no probe overlap). In a small number of cases, probes were moved 3′ to avoid masked repeats. The final bait pool was synthesized by MycroArray LLC (MyBaits; Ann Arbor, MI, USA) and it included 15,698 probes spanning 1,569,800 bp from 7,849 unique transcripts. The whitebark pine transcriptome reference used in the design of hybridization probes, the sequences of the hybridization probes, and a summary of homologous regions in sugar pine to each pair of hybridization probes are available in the TreeGenes database2.
Genomic DNAs (∼500 – 1,000 ng) were sheared to ∼200 bp fragments by sonication for 15–45 min (Diagenode BioRuptor; Denville, NJ, USA) and converted into standard Illumina sequencing libraries (NEBNext; New England Biolabs, Ipswich, MA, USA) with 24 unique index sequencing adapters, as previously described (Weitemier et al., 2014). Library DNA concentration was determined by fluorometry (Qubit High Sensitivity; Thermo-Fisher, Waltham, MA, USA), and libraries were pooled into equimolar 12-plexes containing 1,000 ng of total DNA. Target enrichment for 48 DNAs was conducted using 12-plexes (four capture reactions) following standard protocols from the manufacturer (MycroArray MyBait v. 2.0). Enriched pools were amplified using eight cycles, DNA concentration was determined by fluorometry, and 12-plexes were pooled to produce two equimolar 24-plexes. These 24-plexes were diluted to 10 pM, and 11 pmol was sequenced on two lanes of the HiSeq 2500 using paired-end 100 bp reads (University of Oregon Genomics Center3). Base calling and sample demultiplexing followed standard Illumina workflows. A flowchart showing the steps involved in probe design, library construction, and data analysis is provided in Supplementary Figure S1.
Sequence Analysis
We determined genotypes from Illumina data following previously described methods (Tennessen et al., 2013). In brief, we first filtered Illumina reads in FASTQ format by converting all base calls with Phred-scaled quality scores less than 20 to missing (N), and removing all reads with fewer than 75 non-missing sites. Samples with fewer than 4 million retained reads were excluded from most analyses. We used BWA aln (Li and Durbin, 2009) to align reads to the original whitebark pine transcript sequences from which baits had been designed, using the default BWA maximum edit distance of 0.04, and converted genotypes to vcf format using SAMtools (Li et al., 2009). We retained genotypes as valid only if depth was between 4 and 50, the Phred-scaled likelihood was 0, and Phred-scaled likelihood for all other potential genotypes was greater than or equal to a threshold that scaled with depth, following -10(log10(1/(2ˆD))), where D = depth, up to a maximum of threshold of 50. Genotypes that failed any of these criteria were considered missing, and sites with more than 10 missing genotypes were discarded. We also discarded all sites from any transcript in which any site violated Hardy–Weinberg equilibrium with p < 0.001 due to an excess of heterozygotes, as these could contain sequence from multiple paralogs; transcripts with homozygote excess were retained as these could be due to population structure. All sites were treated as bi-allelic, with the most common observed allele as the major allele and all other observed alleles binned as the minor allele, with frequency denoted as minor allele frequency (MAF).
In order to examine variation in coverage among targets, we counted the number of reads aligning to each transcript among the 48 samples. In order to find homologous genomic repeats, we ran BLAT for each probe against the draft sugar pine genome (P. lambertiana4), divided into 171 smaller files for computational ease, with minScore = 90 and stepSize = 1. We counted any P. lambertiana sequence matching either of a transcript’s probes as a homologous region for that transcript.
Population Genetic Analysis
We calculated genetic diversity (π) and Tajima’s D, both across the entire dataset and for each transcript separately. We annotated transcripts by searching for open reading frames of at least 300 bp, and classifying variants as synonymous, non-synonymous, nonsense (changing a stop codon), or non-coding. For each transcript, we also calculated the number of variants, the number of sites retained, and the mean depth at retained sites.
We performed principal component analysis (PCA) on genotypes at segregating sites. We first replaced all missing genotypes with the most common genotypes for that site. That is, if MAF < 1/3, then major allele homozygotes (expected frequency > 44%) are more common than heterozygotes (expected frequency < 44%) and missing genotypes were assumed to be major allele homozygotes; otherwise missing genotypes were assumed to be heterozygotes. We calculated FST for all sites among the six geographic groupings that contained at least six samples. We only included variants with MAF at least 10% in our FST calculations, since rare variants have a low maximum FST. We also calculated pairwise composite linkage disequilibrium (LD) as ΔAB among all pairs of variants on different genes with MAF at least 10%, using the Perlymorphism package (Stajich and Hahn, 2005). We considered ΔAB values of at least 0.15 to be meaningful. We excluded exceptionally divergent subpopulations from LD analysis, to minimize the effect of population structure on LD.
To identify variants that may show signatures of adaptation to local environments, we first used the ClimateNA v5.10 software package5 (Hamann et al., 2013) to assign climatic variables to all collection sites based on their latitude and longitude. We chose eight climate variables to examine based on their likely importance to P. albicaulis fitness: mean warmest month temperature (MWMT), mean summer precipitation (MSP), summer heat:moisture index (SHM), mean annual temperature (MAT), DD > 5 (degree days above 5°C), Eref (Atmospheric evaporative demand), mean coldest month temperature (MCMT), and frost free period (FFP). For all variants with MAF at least 10%, we split genotypes into two variables corresponding to the two alleles (i.e., a homozygote for the major allele would be 0,0, a heterozygote would be 0,1, etc.), Then, for each of the eight climate variables, we ran logistic regression with the climate variable as an independent variable and genotype as the response. Because population structure could largely be approximated by latitude (see Results), we included latitude as a second independent variable to account for population structure. We also ran a logistic regression using only latitude, and no climate variables, as the independent variable. To evaluate the significance of p-values, we used a Benjamini and Hochberg (1995) false discovery rate correction for the number of variants examined. Genes showing signs of local adaptation were annotated using BLASTP searches of the translated open reading frame to the NR database.
Results
Targeted Capture Sequencing
We observed 390,910,265 reads among the 48 samples, and all Illumina reads have been submitted to SRA (Bioproject Accession PRJNA300288). Most of these reads (87%) did not align to targeted transcripts. Of those that did align, a majority (54%) aligned to just 9 transcripts (0.1% of all targeted transcripts), and 82% of aligning reads matched 1% of all targeted transcripts. By searching for homology to the recently released draft genome of the closely related congener P. lambertiana, we observed 1,637,029 regions showing homology to one of our probes. This distribution was also highly skewed, with five transcripts representing a majority (52%) of homologous regions. Most (54%) transcripts had exactly two homologous regions, indicating a single-copy gene because all transcripts had two non-overlapping probes. Coverage in P. albicaulis was highly correlated with repetitiveness in P. lambertiana (R2 = 0.16; p < 10-15; Figure 2), indicating that a small set of probes captured an inordinate number of reads because they match highly repetitive sequences.
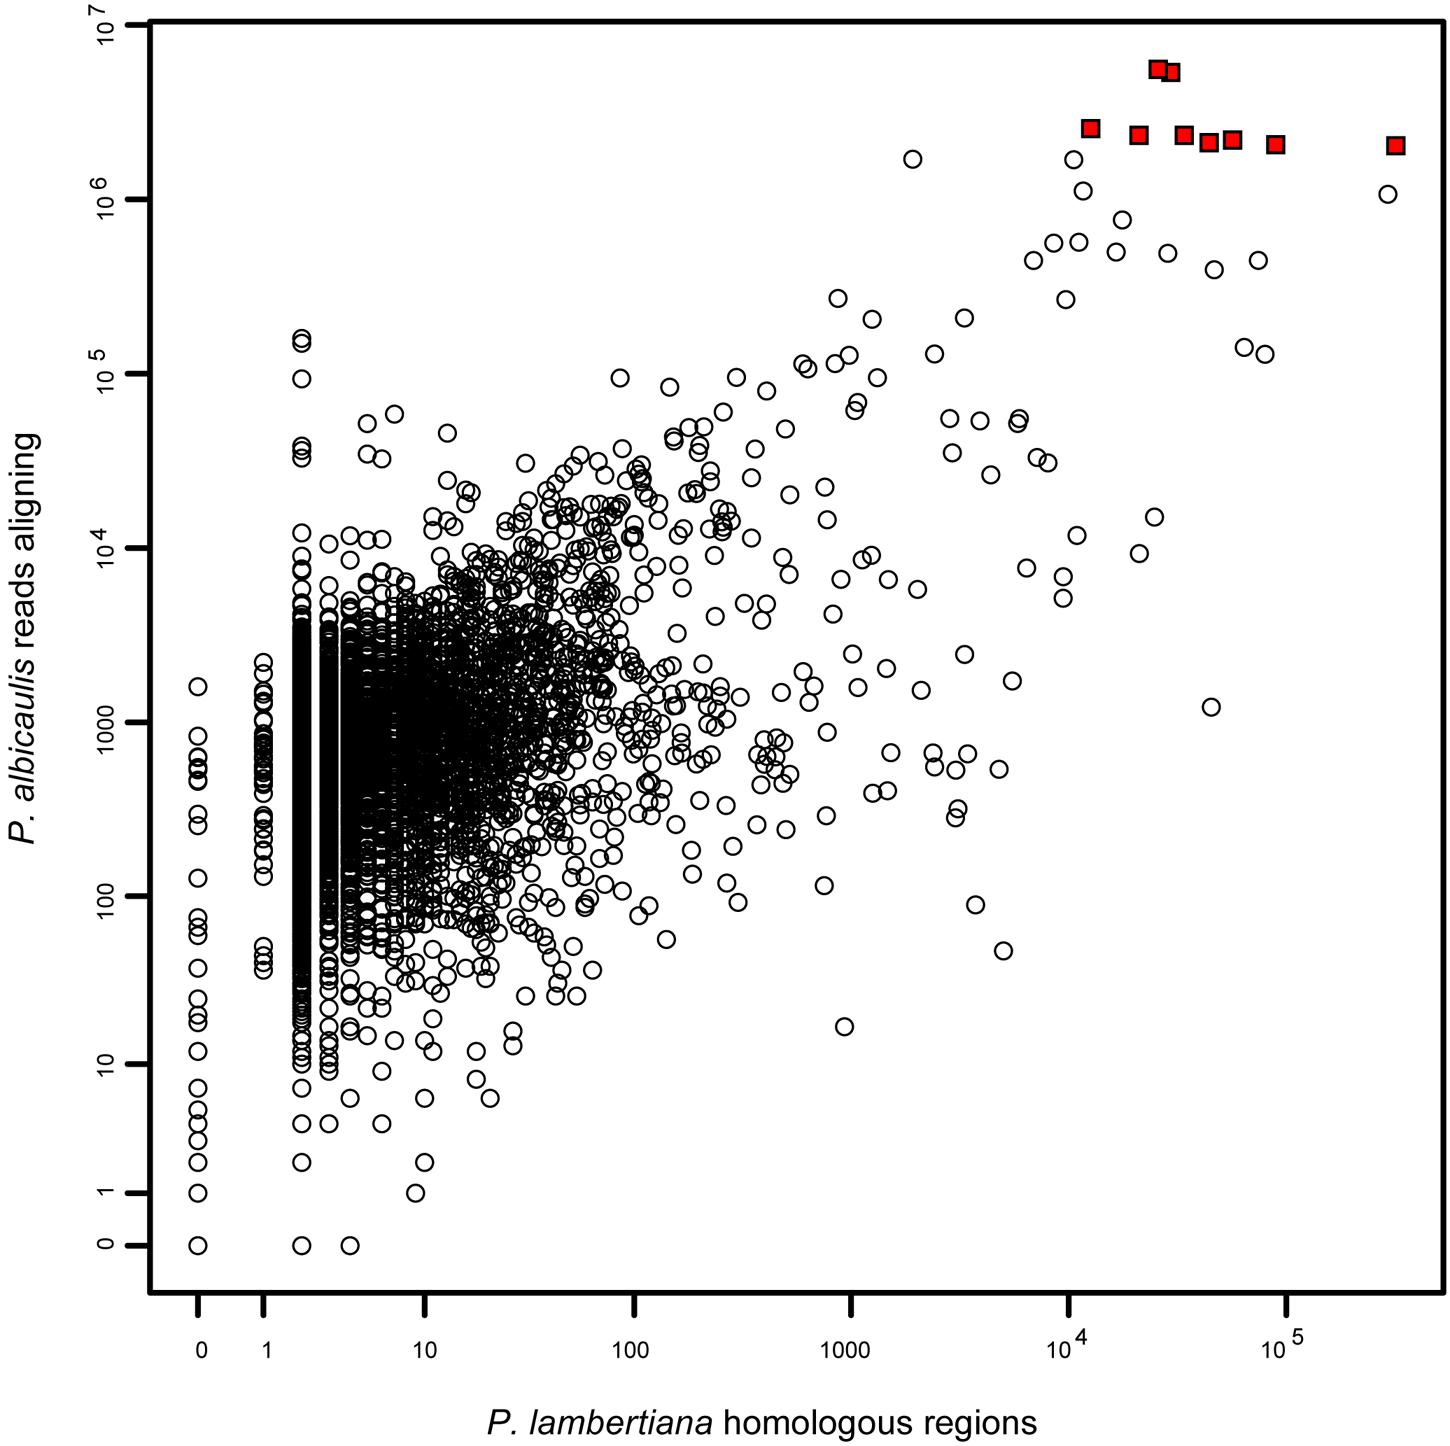
FIGURE 2. Coverage in Pinus albicaulis (aligned reads among all 48 samples) per transcript (median = 735), as a function of homologous regions in the P. lambertiana genome (median = 2) (log-log plot). Representation of transcript sequences was correlated among datasets, indicating that probes matching a large number of P. albicaulis reads are likely highly repetitive in the genome. The nine transcripts indicated by red squares all captured over two million reads each and together represent >50% of all aligning reads. The cause of this overrepresentation is that these regions are among the top 0.25% most repetitive regions in the genome, all with over 10,000 homologous regions found. Removal of a small number of highly repetitive probes in future studies would substantially increase the coverage of all other loci.
Genotype Data
Of 106,011,302 sites (sites with non-zero coverage per individual, summed over all accessions), 46.2% were excluded due to insufficient depth (1–3× coverage), and 3.3% were excluded due to excessive depth (>50× coverage) and therefore increased likelihood of parology. After additional quality filtering, we observed 528,873 high-quality nucleotide positions passing all filters, including 440,670 high-quality sites within targeted regions (of 1,569,800 targeted nucleotides) and 88,203 sites in flanking regions. We observed no high-quality sites for 3,042 of the transcripts, and we excluded 359 transcripts for Hardy–Weinberg violation. For the remaining 4,452 transcripts, the number of high-quality sites was approximately normally distributed with mean 118.8 and standard deviation 60.9 (Figure 3). Among these 4,452 successful transcripts, a majority (2,420) had high-quality sites at 100 or more of the 200 targeted contiguous positions. Across the 528,873 high-quality positions, we observed 12,390 segregating polymorphisms, including 2,163 variants with MAF > = 10%. There were 9,570 non-coding variants, including 719 non-coding indels and 8,851 non-coding single-nucleotide polymorphisms. The remaining 2,820 variants were associated with coding regions, of which 1,739 were non-synonymous, 852 were synonymous, 61 were nonsense, 27 were in-frame indels, 76 were frameshift indels, and 65 could not be unambiguously annotated because they overlapped more than one open reading frame. Genome-wide, π is 0.26% and Tajima’s D is -1.47. Tajima’s D was -1.43 at non-coding single-nucleotide polymorphisms and -1.42 at synonymous sites, reflecting demographic effects without the influence of natural selection. In contrast, Tajima’s D is -1.76 at non-synonymous sites, -1.69 at frameshift indels, and -2.00 at nonsense sites; these lower values likely reflect the effects of purifying selection keeping deleterious alleles rare. Among genes, π ranges from 0.00 to 3.39% (0.00–1.70% for transcripts with ≥100 high quality sites) and Tajima’s D ranges from –2.42 to 2.83 (Supplementary Table S2). One of our samples (accession 42, Figure 1) had fewer high-quality reads than the rest (2.2 million, versus a minimum of 4.5 million for all others); as a result, it had missing genotypes for more than half of all high-quality segregating sites, and for this reason accession 42 was excluded from subsequent sample-specific analyses. Overall, 12.85% of genotypes were missing at segregating sites; after excluding accession 42, 11.96% of genotypes were missing.
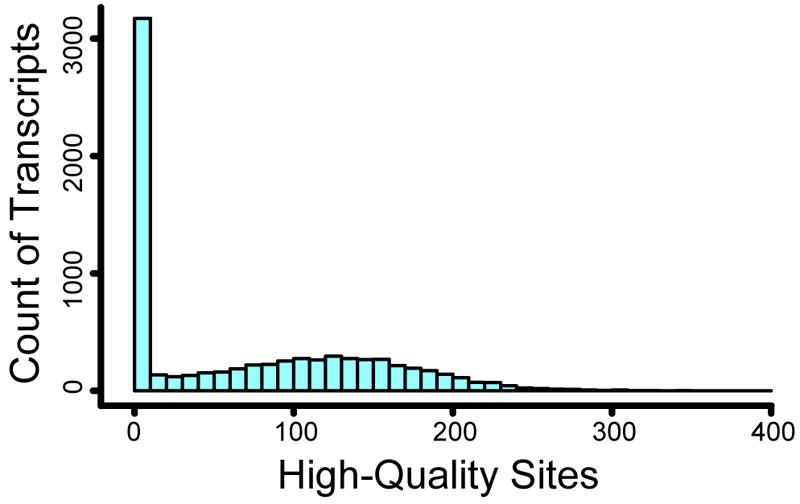
FIGURE 3. Histogram of high-quality sites per transcript. For over 3000 transcripts, we recovered no high-quality sites. For the remaining transcripts, the number of high-quality sites was approximately normally distributed with a mean of 119.
Geographical Partitioning of Genetic Diversity
The PCA largely separates samples in a manner consistent with geographical location (Figure 4). The first principle component (PC), explaining 25.3% of the variance, was strongly correlated with heterozygosity (R2 = 0.57, p < 10-9). Strikingly, three samples stood out as having low heterozygosity (0.099–0.161%, mean = 0.134%) relative to all other samples (0.200–0.245%, mean = 0.222%), and these samples all originated from southwestern Oregon (accessions 33, 34, and 45). The second PC, explaining 3.0% of the variance, was strongly correlated with latitude (R2 = 0.81, p < 10-15). However, its main effect was to separate the seven SIER samples from all other samples (R2 = 0.79, p < 10-15). The third PC, explaining 2.3% of the variation, was strongly correlated with latitude among the non-SIER samples (R2 = 0.84, p < 10-15). The fourth PC, explaining 2.1% of the variation, was correlated with longitude (R2 = 0.42, p < 10-6). All remaining PCs explained less than 2% of the variation and were ignored.
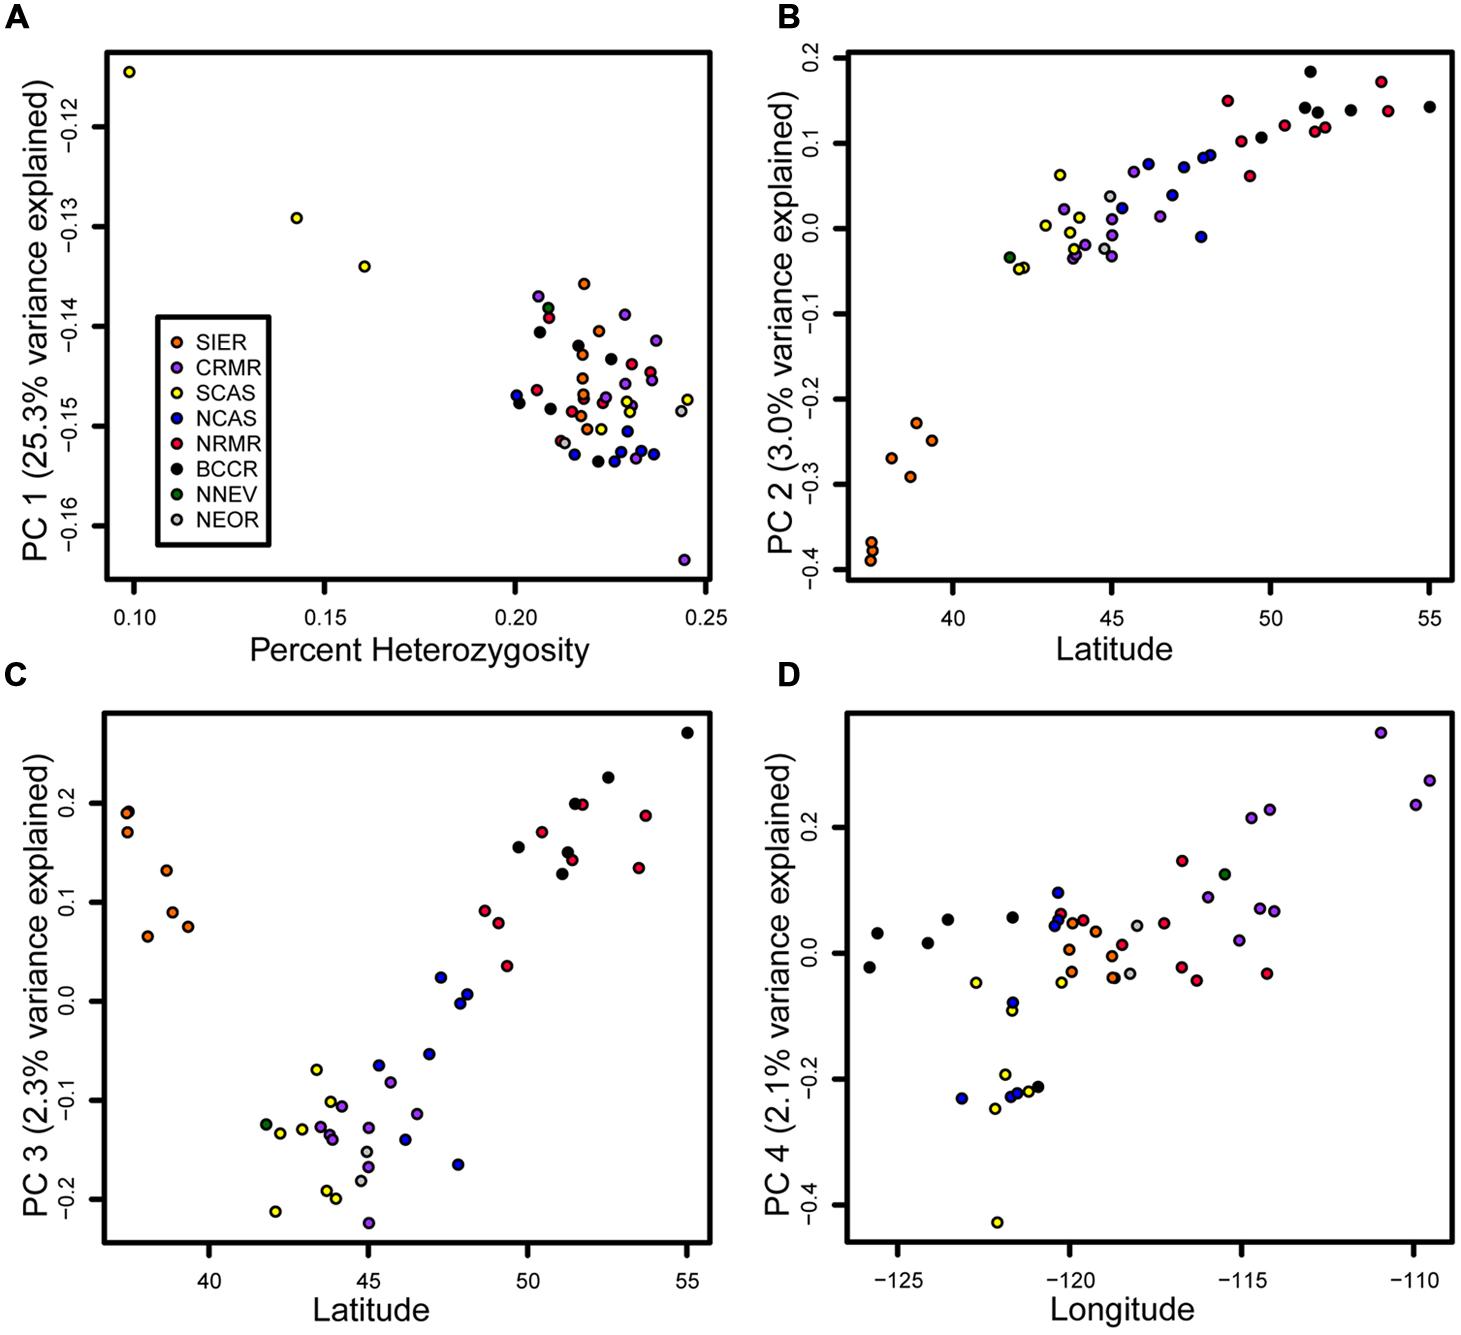
FIGURE 4. Principal components (PCs) tied to heterozygosity, latitude, and longitude. Samples are colored by geographic group as in Figure 1. (A) PC 1 vs. heterozygosity. (B) PC2 vs. latitude. (C) PC3 vs. latitude. (D) PC4 vs. longitude.
Mean heterozygosity within geographic groupings ranged from 0.190% in SCAS to 0.230% in CRMR (Table 1). Pairwise FST values between geographic groupings ranged from 0.001 to 0.056, and the highest values were seen between SIER and other groups (Table 2). These results mirror the PCA results, in which the clearest population division was between SIER and the rest (pairwise FST = 0.033). Nearly all comparisons showed at least one variant with pairwise FST > 0.7, and several comparisons, mostly those including SIER, showed variants with pairwise FST over 0.8 or even 0.9 (Table 2). These high-FST outliers could reflect geographically varying selection.
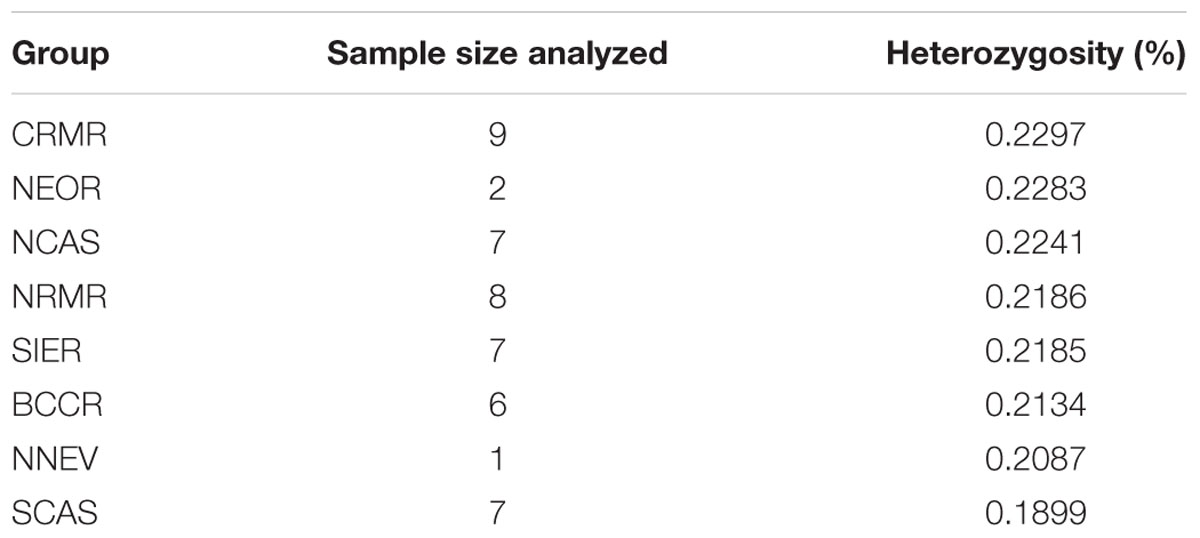
TABLE 1. Mean per-individual observed heterozygosities for the eight designated geographic groups organized from highest to lowest heterozygosity.
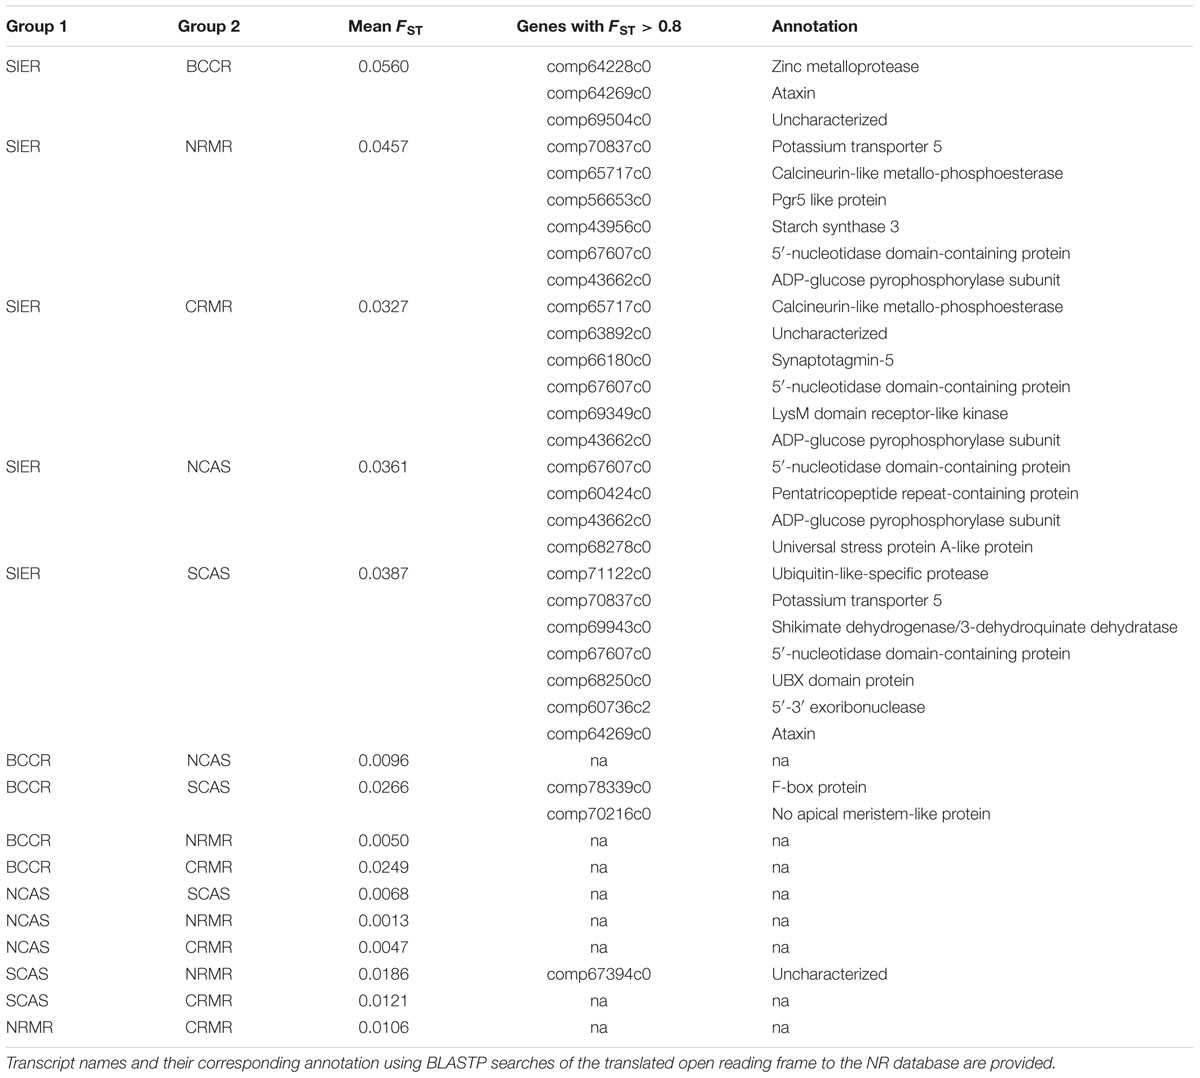
TABLE 2. Pairwise FST among all groups, and outlier genes showing unusually high FST in each comparison.
None of the eight climate variables were significantly correlated with any variant after accounting for latitude under Benjamini–Hochberg correction (α for lowest-ranked SNP = 0.05/2163 = 2.3 × 10⁻⁵). The only p-value less than 10-4 was for the correlation between FFP and a variant in gene comp61071c1, encoding a putative non-lysosomal glucosylceramidase (p = 8.05 × 10⁻⁵; Figure 5). There were 13 SNPs in 12 genes showing a significant correlation with latitude after Benjamini–Hochberg correction (Table 3), with the best correlation seen in gene comp70653c0, encoding a putative GTP diphosphokinase RSH1 (p = 1.5 × 10⁻⁵; Supplementary Figure S2). Four of these genes had been identified as outliers in the FST analysis (Table 2), and three were in known LD blocks (see below; Supplementary Table S2).
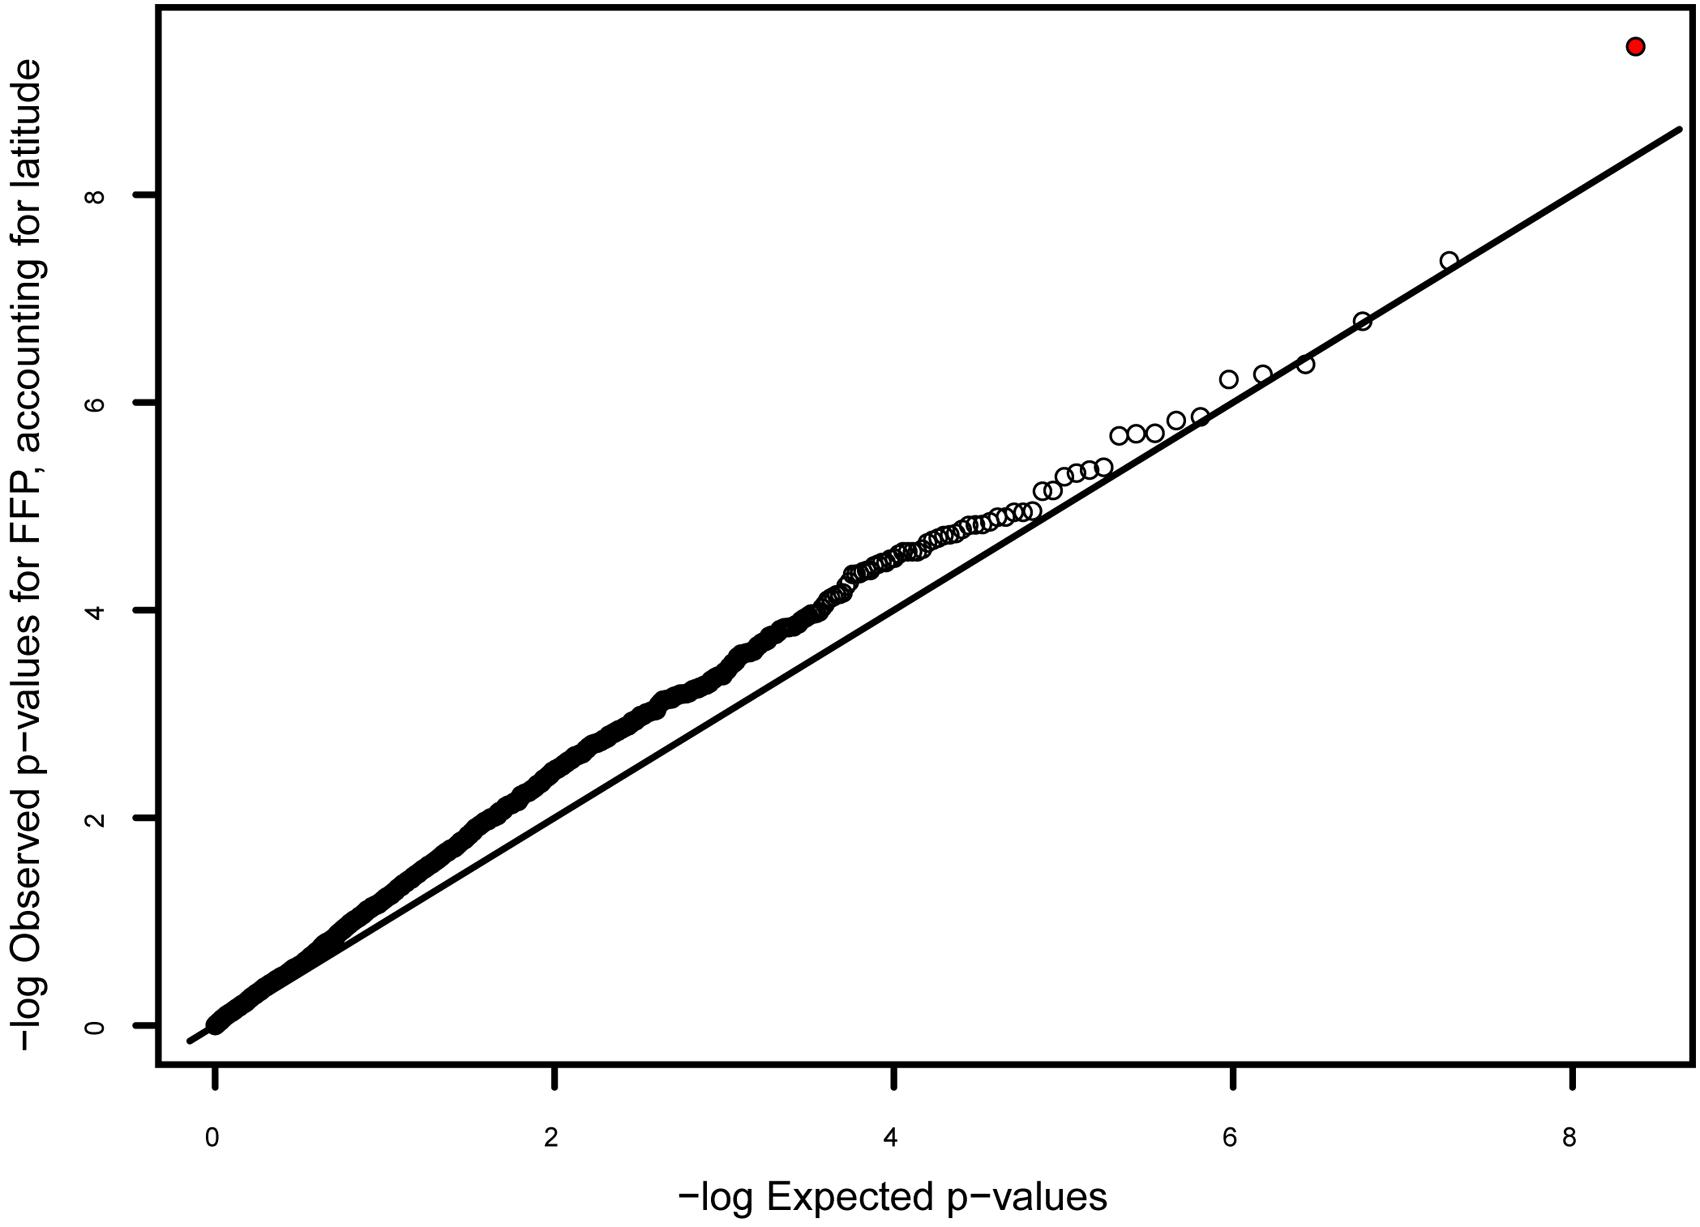
FIGURE 5. Q–Q plot of p-values for the correlation between genotype and frost free period (FFP), after accounting for latitude. The genotype with the best correlation (indicated with red circle) occurs in gene comp61071c1, encoding a putative non-lysosomal glucosylceramidase, and has a low, though not significant, p-value (p = 8 × 10⁻⁵; α = 2 × 10⁻⁵).
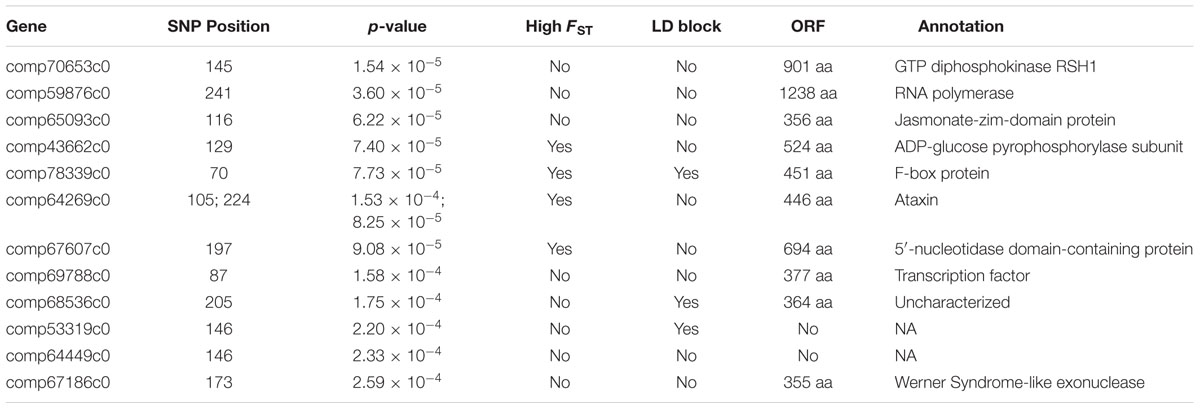
TABLE 3. SNPs showing a significant correlation with latitude after Benjamini–Hochberg correction.
Linkage Disequilibrium
We excluded SIER and NNEV from LD analysis due to divergence from other groups. There were 80 pairs of variants on 106 genes with MAF > = 10% showing high LD with ΔAB at least 0.15. These could be grouped in 43 blocks of 2–9 genes each, with each gene in a block showing high LD with at least one other gene in that block. Genes in the same block are likely to be closely physically linked (Table 4). The highest observed value of ΔAB between different genes was 0.27 (r2 = 0.84), between comp61838c0 and comp68040c0.
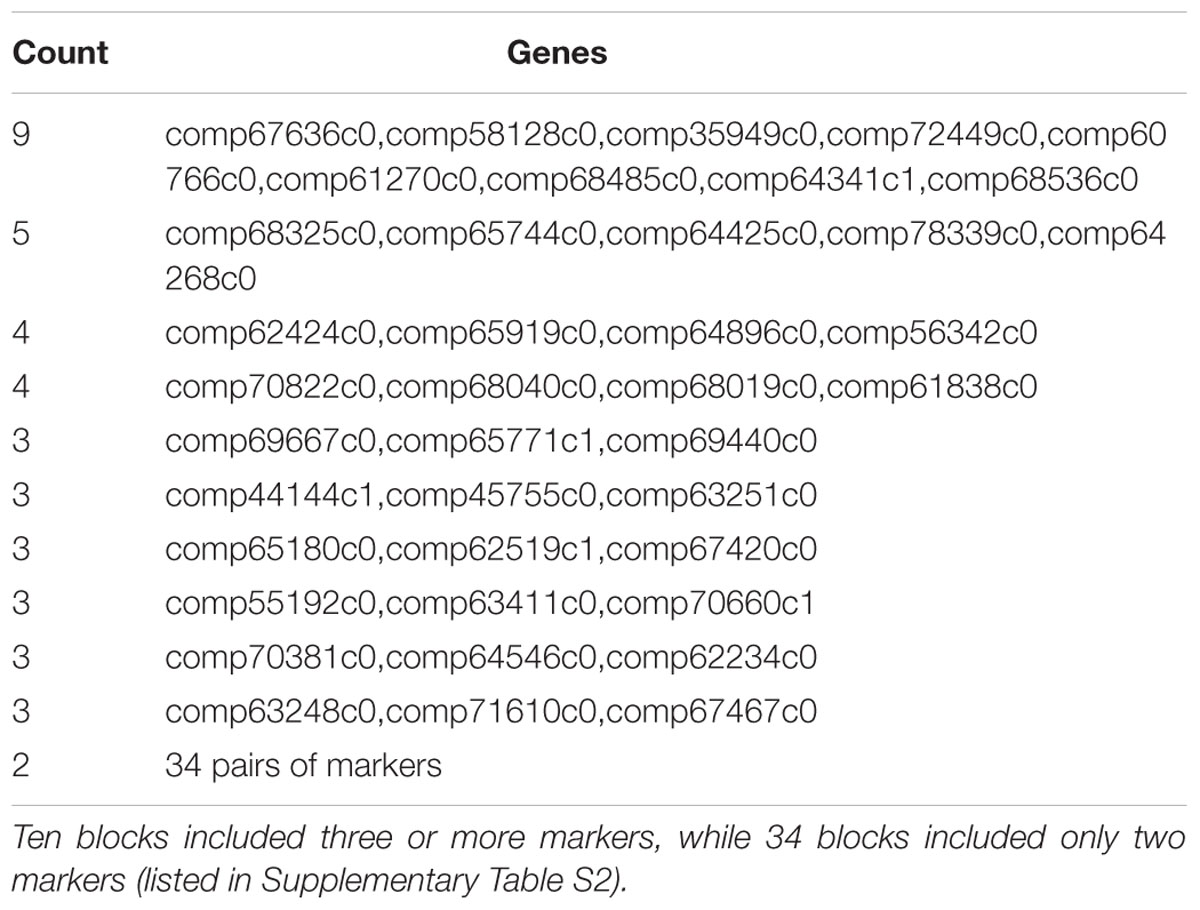
TABLE 4. Blocks of high linkage disequilibrium (LD), in which genes show LD of at least 0.15 with at least one other gene in the block.
Discussion
Development of Genomic Markers for Whitebark Pine
Next-generation sequencing has fostered the development of methods that permit rapid and direct genotyping for large numbers of non-model individuals. At present, these genotyping methods are based on divergent approaches that have been used for decades to reduce the complexity of genomes – reduction via restriction-digestion, and reduction via targeted hybridization. Of the two approaches, restriction-digestion methods are usually less expensive, and so are quickly becoming a method of choice for linkage mapping of defined pedigrees, identifying SNP variation for use on other genotyping platforms, for directly assessing diversity in crop germplasm, and screening natural populations (summarized in Davey et al., 2011; Narum et al., 2013).
While restriction-based approaches are powerful in these kinds of narrow applications, restriction methods have drawbacks that make them less attractive as a marker for gene conservation activities. First, since these methods sample across a large number of potential targets, low genomic coverage sequencing produces data sets that have missing data. This issue can be exacerbated in conifer genomes, where the large numbers of restriction sites decrease the probability of sampling any particular locus across every individual in a study. Additionally, restriction-site methods can impart a selection bias at specific restriction sites that excludes lineage-specific variation (Arnold et al., 2013; Gautier et al., 2013). Simulations have shown that the scale of the problem is proportional to the number of restriction sites used for sampling (Arnold et al., 2013); this means that popular two enzyme methods (e.g., GBS, ddRAD) should show stronger biases than single enzyme methods (e.g., RAD). Even in ideal situations where the genome is sampled without bias, the resulting data sets are primarily composed of genetic elements with no known or presumed function, due to the low proportional representation of genes in large genomes (Karam et al., 2015).
Hybridization-based enrichment methods are more expensive, but they come closest to satisfying requirements of co-dominant, highly transferrable genetic markers within species (Neves et al., 2013; Müller et al., 2015; Pavy et al., 2016) and even among species and closely related genera (Weitemier et al., 2014). Because hybridization methods target known loci, there is an expectation for a nearly complete data set because targets differing at a small number of positions are captured with equal efficiency.
Our study highlights two of the challenges in developing target capture probes from poorly characterized genomes; the inclusion of high-copy targets in bait design, and low capture efficiencies. The first challenge, inclusion of high-copy targets in the bait pool (e.g., Figure 2), appears to be related to the evolutionary divergence within the genus Pinus, and specifically the large genome size variation within Pinus. Our choice of loci for bait design was based on loci that yielded high-quality information from a similarly designed target enrichment study of Loblolly Pine (Neves et al., 2013). Loblolly pine and whitebark pine are congeners, but they are members of separate subgenera that differ substantially in genome size; for example, loblolly pine is a member of Subg. Pinus, a group with an average genome size of 24.5 Gb, while whitebark pine is a member of Subg. Strobus, a group with an average genome size of 29.6 Gb6 (Joyner et al., 2001). By choosing enrichment targets from a smaller genomed organism (Loblolly pine, 22 Gb; Neale et al., 2014), it appears that we inadvertently selected elements that have contributed to the genome expansion in Whitebark pine (27 Gb) and other members of Subg. Strobus. By comparing the bait pool to the recently released draft genome of the close relative sugar pine (Subg. Strobus; genome size = ∼30 Gb), we have identified these specific over-represented sequences as highly repetitive elements (Supplementary Table S3). Simply eliminating the top 100 high-depth repetitive targets from future bait pools would free up an estimated 85% of the total on-target sequencing to low copy targets, and this would produce a more efficient and transferrable assay.
The second challenge, low capture efficiency, is more problematic in our experiment because only 13% of the post-enrichment reads could be aligned to the target transcript sequences. We believe that this low efficiency stems from three different sources that had a large additive effect: (a) probe design from a first-generation transcriptome assembly; (b) enrichment from highly multiplexed reactions with high genomic complexity; and (c) inefficient blocking of adapters. Capture efficiencies from well-curated genomes often range from 50 to 75% (Mamanova et al., 2010), and can approach 90% in the case of small genomes (e.g., the 0.5 Gb genome of Populus; Zhou and Holliday, 2012). In contrast, target capture reactions from less-well characterized genomes (Weitemier et al., 2014) and early transcriptome assemblies (Bi et al., 2012) tend to show significantly lower on-target efficiencies, often as low as 20%. In these instances, poor target capture can be a product of structural errors in the original reference sequence (indels; mis-assembled contigs), or the presence of introns within the coding exons used for probe design (Neves et al., 2013). These types of design errors are likely responsible for the 39% of transcript probes that yielded insufficient sequence data for analysis (Figure 3). The recent availability of the sugar pine genome offers the most efficient approach for pre-screening markers to eliminate high copy sequence motifs and intron-spanning targets from the bait pool. The second possible source – low efficiency from high multiplexing in capture reactions – has been reported as a complicating factor in at least two studies (Bi et al., 2012; Neves et al., 2013), although it has been ruled out as a complication in other studies (Portik et al., 2015). Our capture experiments included 12 pooled libraries per tube, and this may be too high, particularly given the size and complexity of the target genomes. A lower level of multiplexing seems warranted, although this comes at an increased cost that has to be balanced with the sample sizes needed for population-level studies. The third possible source – inefficient blocking of adapters – is maybe an important and underappreciated factor in low on-target efficiency. A recent study by Portik et al. (in review) identifies blocking probes as the most important factor for on-target sequence efficiency, as the ‘universal’ blocking oligonucleotides used in commercial target enrichment kits show lower performance than newer generation blocking oligonucleotides. These authors suggest that blocking efficiency may be most important in organisms with large genomes; if so, whitebark pine and other pines should provide a rigorous test of the impact of different blocking oligonucleotides on enrichment efficiency.
For assessing germplasm diversity, the ‘ideal’ genetic marker should be highly variable, codominant, provide unbiased coverage across the genome, and show a high degree of transferability between studies (Schoen and Brown, 1993; Bataillon et al., 1996; De Beukelaer et al., 2012). This latter aspect is critical for species like whitebark pine, as data gathered from narrowly focused studies need to contribute to larger questions of global diversity and uniqueness. Data sets derived from targeted enrichment often meet expectations of Hardy-Weinberg and linkage equilibrium (Tennessen et al., 2012; Neves et al., 2013; Müller et al., 2015) and genome evolution, and our data set is no exception, even with our poor on-target capture efficiency and non-uniform bait representation. Because probes target a finite number of pre-selected loci, this method is amenable to developing a standardized vocabulary of genes and polymorphic sites for screening conservation collections. The resulting information can be understood in the richer context of genome organization (e.g., variation at known regions) or presumed gene function. Like restriction-based methods, SNPs can be characterized for substitution type (transition; transversion); however, SNPs revealed by target enrichment permit additional inferences to be made of the impact on translation (non-synonymous, silent, and synonymous substitutions), presumed functional consequences (conservative vs. radical replacements), and relationships to additional information on the timing and tissue-specificity of expression. Target-capture approaches build a rich body of information that bears not only on population-level variation, but also potential gene function and relevance to management.
Insights into Variation and Differentiation from Genome-Wide Screening
Our population genetic results are consistent with a demographic history of recent expansion from one or more glacial refugia into a spatially restricted subalpine habitat. Our estimate of π (0.26%) is lower than a previous estimate for whitebark derived from 12 individuals at 167 orthologous gene fragments (π = 0.33%; Eckert et al., 2013), and it is lower than comparable values estimated for other alpine and montane conifers (Mosca et al., 2012; Müller et al., 2015). Our estimate of lower diversity is likely a consequence of different locus selection and sample sizes between studies, as well as the true low diversity reflected in the whitebark genome, which are an outcome of a recent glacial bottleneck and/or the continued rarity of the species even during interglacial periods owing to its specialized habitat.
The strong signature of population expansion is evident in our sample and selection of loci, as indicated by the low (≪-1) Tajima’s D value. Our estimate is much lower than a prior estimate based on a smaller sample of loci and individuals (D = -0.346; Eckert et al., 2013), and estimates of this scale are indicative of a species that has increased effective numbers of individuals by orders of magnitude since the Pleistocene, such as the situation reflected in humans (Tennessen et al., 2012). We observe the greatest genetic diversity in the Central Rocky Mountain Range, Northeastern Oregon, and the Northern Cascades, suggesting that these regions may have harbored the refugia (Table 1). Similarly, the allozyme results of Jorgensen and Hamrick (1997) indicated the greatest genetic diversity in the Rocky Mountains, the Sierras, and the Mount Rainier area. Likewise, Richardson et al. (2002) found three geographically distinct mtDNA haplotypes, with two regions of haplotype co-occurrence (Washington Cascades and Idaho Rockies), suggesting these regions were either refugia or zones of secondary contact. We also observe greatly reduced genetic diversity in three trees from the Southern Oregon Cascades, a trend that was previously noted (Jorgensen and Hamrick, 1997; Richardson et al., 2002), indicating that this region was recolonized from refugia by a limited number of individuals, and/or has experienced a more recent bottleneck.
We observe relatively low genetic divergence among populations, as noted previously in this species (Bruederle et al., 2001; Krakowski et al., 2003; Bower and Aitken, 2008). Wind-born pollen is likely the main component of gene flow (Richardson et al., 2002). The most genetically divergent population, the Sierras, was also the most geographically distant from the other samples. Given the isolation and genetic distinctiveness of the Sierras (Figure 4), this population may harbor unique variation that may be adaptive in its southern, high-elevation habitat. The genetic similarity among the other populations reflects long-distance gene flow via wind-blown pollen as well as the recent shared ancestry of populations in refugia. Our PC analysis shows that genetic differences among samples are correlated with three intuitive metrics: overall heterozygosity, latitude, and longitude (Figure 4). Even accounting for the three low-diversity Oregon Cascades samples (PC 1) and the divergent Sierra samples (PC 2), there was a correlation with both latitude (PC 3) and longitude (PC 4), suggesting that gene flow is spatially constrained and has occurred in both north–south and east–west directions. Several observations underscore the north-south cline in particular: two PCs (2 and 3) were tied to latitude, both showed a stronger correlation than PC 4 did to longitude, and both explained more variance than PC 4. Thus, genetic structure appears to be slightly more substantial in the north–south direction and gene flow may be more common along the east–west axis, perhaps because of prevailing wind directions. In contrast, maternally inherited mtDNA, which is not affected by wind dispersal, shows a stronger east–west divide than a north–south divide (Richardson et al., 2002).
Because our approach involves genotyping thousands of nuclear genes, we can search for the relatively small proportion of genes subject to geographically varying selection (Müller et al., 2015). Although FST was low for most SNPs, a few SNPs showed very high (>0.8) FST values (Table 2), which may reflect selection pressures that differ among geographic groups. We also identified 12 genes with variants showing a significant correlation with latitude (Table 3; Supplementary Figure S1). Although latitude is inexorably confounded with population structure, these markers are intriguing candidates for further validation as underlying local adaptation. In addition, gene comp61071c1 showed an intriguing, though not significant, correlation with frost-free period (Figure 5). If these markers represent functionally relevant variation, it could be in the targeted genes themselves or unknown linked genes. The fact that we observed several genes in LD (Table 4; Supplementary Table S2), despite an approximate genome-wide density of 1 successfully genotyped transcript per 7 Mb, suggests either that large (>100 kb) haplotype blocks in LD are common, or that coding genes are physically clustered. In either case, a marker showing the signature of selection might be reflecting functional diversity at one of several closely linked genes.
Potential Applications to Related Pine Species
Whitebark pine is one of eight North American pine species that are allied with Pinus subsection Strobus, a group commonly referred to as the ‘five-needle pines’ (DeGiorgio et al., 2014). This group includes species that occupy a diversity of habitats, ranging from alpine/high-elevation landscapes (P. albicaulis; P. flexilis; P. strobiformis; P. ayacahuite), lower elevation western (P. lambertiana; P. monticola) and eastern (P. strobus) forests, and narrowly restricted geographic endemics (P. chiapensis). These species share much in common, as all show susceptibility to blister rust infection and the deleterious impacts of insect outbreaks, fire, and changing climates (Keane et al., 2011). Similarly, all eight species are the focus of active conservation efforts to preserve existing diversity, some are the focus of active breeding efforts to improve blister rust resistance, and genetic markers are needed to improve the efficiency of these activities. North American five-needle pines are all remarkably similar at the level of orthologous DNA sequences (Syring et al., 2007; Eckert et al., 2013), as they typically show >96% identity at exonic and intronic regions. Divergence at this scale is not prohibitory for target enrichment (Neves et al., 2013), so we predict that these probes will show a high degree of transferability to other five-needle pine species. Adopting a target enrichment approach would enable the development of common genetic resources across these related species. We are currently examining the efficiency of hybridization in North American five-needle pines, as well as more distantly related species of conservation concern, such as foxtail pine (P. balfouriana) and bristlecone pines (P. aristata, P. longaeva).
Conclusion
Our goal was to test whether hybridization-based targeted enrichment baits designed from loblolly pine could be adapted to enriching targets from the threatened congener P. albicaulis (whitebark pine). Baits were synthesized to cover ∼2 Mbp (0.006% of the genome), and these were hybridized in multiplex pools of genomic DNA and sequenced on the HiSeq 2000. In our study, only a small fraction of the reads (13%) mapped to bait target sequences; also, a small proportion of probes accounted for the vast majority of on-target sequences, indicating that our probe pool included sequences that were homologous to high-copy repeats in the whitebark pine genome. Despite these complications, this effort still provided acceptable coverage for 4,452 loci and >528,800 nucleotide positions, allowed us to identify single nucleotide variants, permitted the direct measurement of heterozogosity, and aided in the identification of regional differentiation and evidence for selection from a test panel of 48 trees. Our results identify trees from the Sierra Range as distinctive within the whitebark pine gene pool, making them high priority targets for germplasm conservation efforts. As shown here and in other studies, hybridization-based target enrichment is a robust method for enriching target genes from the complex ‘giga-genomes’ of conifers, one that provides data that is easily integrated into germplasm management, and has the potential to be extended across related species.
Author Contributions
JS and RC proposed, funded, and collected data for the research. Both authors contributed to data analysis and wrote significant sections of the paper. JT did much of the data analysis and developed most of the figures, as well as wrote significant portions of the manuscript. TJ did most of the lab work including prepping the library sequences and running the hybridization reactions. She also made contribution to the editing of the manuscript. JW provided a pre-publication copy of the whitebark pine transcriptome which was essential for developing the probe sequences as well as provided consultation on probe selection. CS-D aided in the collection of samples and with DNA extractions. She helped develop Figure 1, put together the Literature Cited section, and proofread the manuscript.
Funding
Funding for this study was provided by the MJ Murdock Charitable Trust, Linfield College, and the Forest Health Protection program of the US Forest Service Pacific Northwest Region Six (Portland, OR, USA).
Conflict of Interest Statement
The authors declare that the research was conducted in the absence of any commercial or financial relationships that could be construed as a potential conflict of interest.
Acknowledgments
We thank Katherine Armes, Amanda Cordes, Kylie Nomi, and Dylan Bartholomew for assistance with collections and DNA extractions; Leandro Neves and Mathias Kirst (University of Florida) for advice on probe selection, and Alison Devault (MYcroarry, LLC) for assistance with probe design; and Richard Sniezko and Doug Doust (US Forest Service) for aid in assembling collections and helpful discussion on the project. We also thank Doug Turnbull and the University of Oregon Sequencing Facility for input on library pooling and high-throughput sequencing. For work on the whitebark pine transcriptome we thank Tricia Maloney, Det Vogler, Camille Jensen, Annie Delfino-Mix for collections, Randi Famula for DNA extractions, and the UC Davis Genome Center for high-throughput sequencing.
Supplementary Material
The Supplementary Material for this article can be found online at: http://journal.frontiersin.org/article/10.3389/fpls.2016.00484
Footnotes
- ^ http://dendrome.ucdavis.edu/ftp/Genome_Data/genome/pinerefseq/Pita/mito/
- ^ http://treegenesdb.org/ftp/Transcriptome_Data/transcriptome/Pial/v1.0/
- ^ https://gc3f.uoregon.edu/
- ^ http://pinegenome.org/pinerefseq/
- ^ http://tinyurl.com/ClimateNA
- ^ http://data.kew.org/cvalues/
References
Altschul, S. F., Gish, W., Miller, W., Myers, E. W., and Lipman, D. J. (1990). Basic local alignment search tool. J. Mol. Biol. 215, 403–410. doi: 10.1016/S0022-2836(05)80360-2
Arno, S. F., and Hoff, R. J. (1989). Silvics of Whitebark Pine (Pinus albicaulis). General Technical Report INT-253. Ogden, UT: U.S. Department of Agriculture, Forest Service, Intermountain Research Station, 14.
Arnold, B., Corbett-Detig, R., Hartl, D., and Bomblies, K. (2013). RADseq underestimates diversity and introduces genealogical biases due to nonrandom haplotype sampling. Mol. Ecol. 22, 3179–3190. doi: 10.1111/mec.12276
Aubry, C. A., Goheen, D. J., Shoal, R. Z., Ohlson, T., Lorenz, T. J., Bower, A. D., Mehmel, C., and Sniezko, R.A.et al. (2008). WhitebarkPine restoration Strategy for the Pacific Northwest Region 2009-2013. Washington DC, USA: U.S. Department of Agriculture, Forest Service, 96 p.
Bataillon, T. M., David, J. L., and Schoen, D. J. (1996). Neutral genetic markers and conservation genetics: simulated germplasm collections. Genetics 144, 409–417.
Benjamini, Y., and Hochberg, Y. (1995). Controlling the false discovery rate: a practical and powerful approach to multiple testing. J. R. Statist. Soc. Ser. B. 57, 289–300.
Bi, K., Vanderpool, D., Singhal, S., Linderoth, T., Moritz, C., and Good, J. M. (2012). Transcriptome-based exon capture enables highly cost-effective comparative genomic data collection at moderate evolutionary scales. BMC Genomics 13:403. doi: 10.1186/1471-2164-13-403
Bockino, N. K., and Tinker, D. B. (2012). Interactions of white pine blister rust and mountain pine beetle in whitebark pine ecosystems in the southern Greater Yellowstone Area. Nat. Area. J. 32, 31–40. doi: 10.3375/043.032/0105
Bower, A. D., and Aitken, S. N. (2007). Mating system and inbreeding depression in whitebark pine (Pinus albicaulis Engelm.). Tree Genet. Genomes 3, 379–388. doi: 10.1007/s11295-007-0082-4
Bower, A. D., and Aitken, S. N. (2008). Ecological genetics and seed transfer guidelines for Pinus albicaulis (Pinaceae). Am. J. Bot. 95, 66–76. doi: 10.3732/ajb.95.1.66
Bruederle, L. P., Rogers, D. L., Krutovskii, K. V., and Politov, D. V. (2001). “Population genetics and evolutionary implications,” in Whitebark Pine Communities: Ecology and Restoration, eds D. F. Tomback, S. F. Arno, and R. E. Keane (Washington, DC, USA: Island Press), 137–153.
COSEWIC (2010). “COSEWIC assessment and status report on the Whitebark pine (Pinus albicaulis) in Canada,” ed. Committee on the Status of Endangered Wildlife in Canada (Ottawa: COSEWIC), 44.
Cronn, R., Knaus, B. J., Liston, A., Maughan, P. J., Parks, M., Syring, J. V., et al. (2012). Targeted enrichment strategies for next-generation plant biology. Am. J. Bot. 99, 291-311. doi: 10.3732/ajb.1100356
Davey, J. W., Hohenlohe, P. A., Etter, P. D., Boone, J. Q., Catchen, J. M., and Blaxter, M. L. (2011). Genome-wide genetic marker discovery and genotyping using next-generation sequencing. Nat. Rev. Genet. 12, 499–510. doi: 10.1038/nrg3012
De Beukelaer, H., Smýkal, P., Davenport, G. F., and Fack, V. (2012). Core Hunter II: fast core subset selection based on multiple genetic diversity measures using Mixed Replica search. BMC Bioinformatics 13:312. doi: 10.1186/1471-2105-13-312
DeGiorgio, M., Syring, J., Eckert, A. J., Liston, A., Cronn, R., Neale, D. B., et al. (2014). An empirical evaluation of two-stage species tree inference strategies using a multilocus dataset from North American pines. BMC Evol. Biol. 14:67. doi: 10.1186/1471-2148-14-67
Eckert, A. J., Bower, A. D., Jermstad, K. D., Wegrzyn, J. L., Knaus, B. J., Syring, J. V., et al. (2013). Multilocus analyses reveal little evidence for lineage-wide adaptive evolution within major clades of soft pines (Pinus subgenus Strobus). Mol. Ecol. 22, 5635–5650. doi: 10.1111/mec.12514
Ellison, A. M., Bank, M. S., Clinton, B. D., Colburn, E. A., Elliott, K., Ford, C. R., et al. (2005). Loss of foundation species: consequences for the structure and dynamics of forested ecosystems. Front. Ecol. Environ. 3, 479–486. doi: 10.1890/1540-9295(2005)003
Farnes, P. E. (1990). “SNOTEL and snow course data: describing the hydrology of whitebark pine ecosystems,” in Proceedings of a Symposium on Whitebark Pine Ecosystems: Ecology and Management of a High-Mountain Resource, General Technical Report INT-GTR-270, eds W. C. Schmidt and K. J. McDonald (Ogden, UT: U.S. Department of Agriculture, Forest Service),29–31.
Furnier, G. R., Knowles, P., Clyde, M. A., and Dancik, B. P. (1987). Effects of avian seed dispersal on the genetic structure of whitebark pine populations. Evolution 3, 607–612. doi: 10.2307/2409262
Gautier, M., Gharbi, K., Cezard, T., Foucaud, J., Kerdelhué, C., Pudlo, P., et al. (2013). The effect of RAD allele dropout on the estimation of genetic variation within and between populations. Mol. Ecol. 22, 3165–3178. doi: 10.1111/mec.12089
Gibson, K., Skov, K., Kegley, S., Jorgensen, C., Smith, S., and Witcosky, J. (2008). Mountain Pine Beetle Impacts in High-Elevation Five-Needle Pines: Current Trends and Challenges, Report R1-08-020. Missoula, MT: U.S. Department of Agriculture, Forest Service, Northern Region Forest Health Protection, 40.
Gnirke, A., Melnikov, A., Maguire, J., Rogov, P., LeProust, E. M., Brockman, W., et al. (2009). Solution hybrid selection with ultra-long oligonucleotides for massively parallel targeted sequencing. Nat. Biotechnol. 27, 182–189. doi: 10.1038/nbt.1523
Hamann, A., Wang, T., Spittlehouse, D. L., and Murdock, T. Q. (2013). A comprehensive, high-resolution database of historical and projected climate surfaces for western North America. Bull. Am. Meteorol. Soc. 94, 1307–1309. doi: 10.1175/BAMS-D-12-00145.1
Hebert, F. O., Renaut, S., and Bernatchez, L. (2013). Targeted sequence capture and resequencing implies a predominant role of regulatory regions in the divergence of a sympatric lake whitefish species pair (Coregonus clupeaformis). Mol. Ecol. 22, 4896–4914. doi: 10.1111/mec.12447
IUCN (2015). The IUCN Red List of Threatened Species. Version 2015–2014. Available at: http://www.iucnredlist.org
Jones, M. R., and Good, J. M. (2016). Targeted capture in evolutionary and ecological genomics. Mol. Ecol. 25, 185–202. doi: 10.1111/mec.13304
Jorgensen, S. M., and Hamrick, J. L. (1997). Biogeography and population genetics of whitebark pine, Pinus albicaulis. Can. J. For. Res. 27, 1574–1585. doi: 10.1139/x97-118
Joyner, K. L., Wang, X. R., Johnston, J. S., Price, H. J., and Williams, C. G. (2001). DNA content for Asian pines parallels new world relatives. Can. J. Bot. 79, 192–196. doi: 10.1139/b00-151
Karam, M. J., Lefèvre, F., Dagher-Kharrat, M. B., Pinosio, S., and Vendramin, G. (2015). Genomic exploration and molecular marker development in a large and complex conifer genome using RADseq and mRNAseq. Mol. Ecol. Resour. 15, 601–612. doi: 10.1111/1755-0998.12329
Keane, R. E., Arno, S. F., Brown, J. K., and Tomback, D. F. (1990). Modelling stand dynamics in whitebark pine (Pinus albicaulis) forests. Ecol. Model. 51, 73–95. doi: 10.1016/0304-3800(90)90059-P
Keane, R. E., Tomback, D. F., Murray, M. P., and Smith, Cyndi M., (eds) (2011). “The future of high-elevation, five-needle white pines in Western North America,” in Proceedings of the High Five Symposium RMRS-P-63 (Fort Collins, CO: U.S. Department of Agriculture, Forest Service, Rocky Mountain Research Station), 376.
Kendall, K. C., and Keane, R. E. (2001). “Whitebark pine decline: infection, mortality, and population trends,” in Whitebark Pine Communities: Ecology and Restoration, eds D. F. Tomback, S. F. Arno, and R. E. Keane (Washington, DC: Island Press), 221–242.
Kent, W. J. (2002). BLAT—the BLAST-like alignment tool. Genome Res. 12, 656–664. doi: 10.1101/gr.229202
Krakowski, J., Aitken, S. N., and El-Kassaby, Y. A. (2003). Inbreeding and conservation genetics in whitebark pine. Conserv. Genet. 4, 581–593. doi: 10.1023/A:1025667700479
Li, H., and Durbin, R. (2009). Fast and accurate short read alignment with Burrows–Wheeler transform. Bioinformatics 25, 1754–1760. doi: 10.1093/bioinformatics/btp324
Li, H., Handsaker, B., Wysoker, A., Fennell, T., Ruan, J., Homer, N., et al. (2009). The sequence alignment/map format and SAMtools. Bioinformatics 25, 2078–2079. doi: 10.1093/bioinformatics/btp352
Little, E. L. (1971). Atlas of the United States Trees: Conifers and Important Hardwoods, Vol. 1. Washington, DC: Department of Agriculture, Miscellaneous Publication 1146.
Mahalovich, M. F., and Hipkins, V. D. (2011). “Molecular genetic variation in whitebark pine (Pinus albicaulis Engelm.) in the Inland West,” in Proceedings of the High Five Symposium RMRS-P-63, The Future of High-Elevation Five-Needle White Pines in Western North America. Missoula, MT, eds R. E. Keane, D. F. Tomback, M. P. Murray, C. M Smith (Fort Collins, CO: U.S. Department of Agriculture, Forest Service, Rocky Mountain Research Station), 118–132.
Mamanova, L., Coffey, A. J., Scott, C. E., Kozarewa, I., Turner, E. H., Kumar, A., et al. (2010). Target-enrichment strategies for next-generation sequencing. Nat. Methods 7, 111–118. doi: 10.1038/nmeth.1419
Mattson, D., Kendall, K., and Reinhart, D. (2001). “Whitebark pine, grizzly bears, and red squirrels,” in Whitebark Pine Communities: Ecology and Restoration, eds D. F. Tomback, S. F. Arno, and R. E. Keane (Washington, DC: Island Press), 121–136.
Millar, C. I., Westfall, R. D., Delany, D. L., Bokach, M. J., Flint, A. L., and Flint, L. E. (2012). Forest mortality in high-elevation whitebark pine (Pinus albicaulis) forests of eastern California, USA; influence of environmental context, bark beetles, climatic water deficit, and warming. Can. J. For. Res. 42, 749–765. doi: 10.1139/x2012-031
Mills, L. S., Soulé, M. E., and Doak, D. F. (1993). The keystone-species concept in ecology and conservation. BioScience 43, 219–224. doi: 10.2307/1312122
Morse, A. M., Peterson, D. G., Islam-Faridi, M. N., Smith, K. E., Magbanua, Z., Garcia, S. A., et al. (2009). Evolution of genome size and complexity in Pinus. PLoS ONE 4:e4332. doi: 10.1371/journal.pone.0004332
Mosca, E., Eckert, A. J., Liechty, J. D., Wegrzyn, J. L., La Porta, N., Vendramin, G. G., et al. (2012). Contrasting patterns of nucleotide diversity for four conifers of Alpine European forests. Evol. Appl. 5, 762–775. doi: 10.1111/j.1752-4571.2012.00256.x
Müller, T., Freund, F., Wildhagen, H., and Schmid, K. J. (2015). Targeted re-sequencing of five Douglas-fir provenances reveals population structure and putative target genes of positive selection. Tree Genet. Genomes 11, 1–17. doi: 10.006//s11295-014-0816-z
Narum, S. R., Buerkle, C. A., Davey, J. W., Miller, M. R., and Hohenlohe, P. A. (2013). Genotyping-by-sequencing in ecological and conservation genomics. Mol. Ecol. 22, 2841–2847. doi: 10.1111/mec.12350
Neale, D. B., Wegrzyn, J. L., Stevens, K. A., Zimin, A. V., Puiu, D., Crepeau, M. W., et al. (2014). Decoding the massive genome of loblolly pine using haploid DNA and novel assembly strategies. Genome Biol. 15:R59. doi: 10.1186/gb-2014-15-3-r59
Neves, L. G., Davis, J. M., Barbazuk, W. B., and Kirst, M. (2013). Whole-exome targeted sequencing of the uncharacterized pine genome. Plant J. 75, 146–156. doi: 10.1111/tpj.12193
Pavy, N., Gagnon, F., Deschênes, A., Boyle, B., Beaulieu, J., and Bousquet, J. (2016). Development of highly reliable in silico SNP resource and genotyping assay from exome capture and sequencing: an example from black spruce (Picea mariana). Mol. Ecol. Resour. 16, 588–598. doi: 10.1111/1755-0998.12468
Petit, R. J., and Hampe, A. (2006). Some evolutionary consequences of being a tree. Annu. Rev. Ecol. Evol. Syst. 347, 187–214. doi: 10.2307/annurev.ecolsys.37.091305.110215
Portik, D. M., Smith, L. L., and Bi, K. (2015). An evaluation of transcriptome-based exon capture for frog phylogenomics across multiple scales of divergence (Class: Amphibia, Order: Anura). BioRxiv doi: 10.1101/031468
Price, R., Liston, A., and Strauss, S. (2000). “Phylogeny and systematics of Pinus,” in Ecology and Biogeography of Pinus, ed. D. Richardson (Cambridge: Cambridge University Press), 49–68.
Richardson, B. A., Brunsfeld, S., and Klopfenstein, N. B. (2002). DNA from bird-dispersed seed and wind-disseminated pollen provides insights into postglacial colonization and population genetic structure of whitebark pine (Pinus albicaulis). Mol. Ecol. 11, 215–227. doi: 10.1046/j.1365-294X.2002.01435.x
Rogers, D. L., Millar, C. I., and Westfall, R. D. (1999). Fine-scale genetic structure of whitebark pine (Pinus albicaulis): associations with watershed and growth form. Evolution 53, 74–90. doi: 10.2307/2640921
Schoen, D. J., and Brown, A. (1993). Conservation of allelic richness in wild crop relatives is aided by assessment of genetic markers. Proc. Natl. Acad. Sci. U.S.A. 90, 10623–10627. doi: 10.1073/pnas.90.22.10623
Shafer, A. B. A., Cullingham, C. I., Cote, S. D., and Coltman, D. W. (2010). Of glaciers and refugia: a decade of study sheds new light on phylogeography of northwestern North America. Mol. Ecol. 19, 4589–4621. doi: 10.1111/j.1365-294X.2010.04828.x
Shoal, R., and Aubry, C. (2004). The Status of Whitebark Pine on Four National Forests in Washington State. Olympia, WA: US Department of Agriculture, Forest Service, Pacific Northwest Region, Olympic National Forest.
Smit, A., Hubley, R., and Green, P. (2014). RepeatMasker Open-4.0, 2013–2015. Available at: http://www.repeatmasker.org
Stajich, J. E., and Hahn, M. W. (2005). Disentangling the effects of demography and selection in human history. Mol. Biol. Evol. 22, 63–73. doi: 10.1093/molbev/msh252
Syring, J., Farrell, K., Businský, R., Cronn, R., and Liston, A. (2007). Widespread genealogical nonmonophyly in species of Pinus subgenus Strobus. Syst. Biol. 56, 163–181. doi: 10.1080/10635150701258787
Tennessen, J. A., Bigham, A. W., O’Connor, T. D., Fu, W., Kenny, E. E., Gravel, S., et al. (2012). Evolution and functional impact of rare coding variation from deep sequencing of human exomes. Science 337, 64–69. doi: 10.1126/science.1219240
Tennessen, J. A., Govindarajulu, R., Liston, A., and Ashman, T.-L. (2013). Targeted sequence capture provides insight into genome structure and genetics of male sterility in a gynodioecious diploid strawberry, Fragaria vesca ssp. bracteata (Rosaceae). G3 3, 1341–1351. doi: 10.1534/g3.113.006288
Tomback, D. F. (2005). “The impact of seed dispersal by Clark’s nutcracker on whitebark pine: multi-scale perspective on a high mountain mutualism,” in Mountain Ecosystems: Studies in Treeline Ecology, eds G. Broll and B. Kepline (Berlin: Springer), 181–201.
Tomback, D. F., Arno, S. F., and Keane, R. E. (2001). “The compelling case for management intervention,” in Whitebark Pine Communities: Ecology and Restoration, eds D. F. Tomback, S. F. Arno, and R. E. Keane (Washington, DC: Island Press), 3–28.
US Fish and Wildlife Service (2011). “Endangered and Threatened Wildlife and Plants; 12-Month Finding on A Petition to List Pinus Albicaulis As Endangered Or Threatened With Critical Habitat” Federal Register Docket ID: FWS-R6-ES-2010-0047 Available at: www.fdderalregister.gov/articles/2010/12/14/2010-30573/endangered-and-threatend-wildlife-and-plants 12-months-finding-on-a-petiton-to-list-the-north
Warwell, M. V., Rehfeldt, G. E., and Crookston, N. L. (2007). “Modeling contemporary climate profiles of whitebark pine (Pinus albicaulis) and predicting responses to global warming,” in Proceedings of the Conference Whitebark Pine: A Pacific Coast Perspective (Pacific Northwest Region, NA: U.S. Department of Agriculture, Forest Service), 139–142.
Weitemier, K., Straub, S. C., Cronn, R. C., Fishbein, M., Schmickl, R., McDonnell, A., et al. (2014). Hyb-Seq: combining target enrichment and genome skimming for plant phylogenomics. Appl. Plant Sci. 2:1400042. doi: 10.3732/apps.1400042
Wilson, B. (2007). Status of the Whitebark Pine (Pinus albicaulis) in Alberta. Wildlife Status Report No. 63. Edmonton, AB: Alberta Sustainable Resource Development and Alberta Conservation Association, 22. doi: 10.5962/bhl.title.114087
Keywords: Pinus albicaulis, whitebark pine, gene conservation, target enrichment, SNP, landscape genomics
Citation: Syring JV, Tennessen JA, Jennings TN, Wegrzyn J, Scelfo-Dalbey C and Cronn R (2016) Targeted Capture Sequencing in Whitebark Pine Reveals Range-Wide Demographic and Adaptive Patterns Despite Challenges of a Large, Repetitive Genome. Front. Plant Sci. 7:484. doi: 10.3389/fpls.2016.00484
Received: 05 January 2016; Accepted: 25 March 2016;
Published: 21 April 2016.
Edited by:
Paul Gepts, University of California, Davis, USACopyright © 2016 Syring, Tennessen, Jennings, Wegrzyn, Scelfo-Dalbey and Cronn. This is an open-access article distributed under the terms of the Creative Commons Attribution License (CC BY). The use, distribution or reproduction in other forums is permitted, provided the original author(s) or licensor are credited and that the original publication in this journal is cited, in accordance with accepted academic practice. No use, distribution or reproduction is permitted which does not comply with these terms.
*Correspondence: John V. Syring, jsyring@linfield.edu