 Rui Ma
 Sheng Xu
 Yucheng Zhao
 Bing Xia
 Ren Wang
- 1Institute of Botany, Jiangsu Province and Chinese Academy of Sciences, Nanjing, China
- 2State Key Laboratory of Natural Medicines, Department of Natural Medicinal Chemistry, China Pharmaceutical University, Nanjing, China
Lycoris aurea (L' Hér.) Herb, a perennial grass species, produces a unique variety of pharmacologically active Amaryllidaceae alkaloids. However, the key enzymes and their expression pattern involved in the biosynthesis of Amaryllidaceae alkaloids (especially for galanthamine) are far from being fully understood. Quantitative real-time polymerase chain reaction (qRT-PCR), a commonly used method for quantifying gene expression, requires stable reference genes to normalize its data. In this study, to choose the appropriate reference genes under different experimental conditions, 14 genes including YLS8 (mitosis protein YLS8), CYP2 (Cyclophilin 2), CYP 1 (Cyclophilin 1), TIP41 (TIP41-like protein), EXP2 (Expressed protein 2), PTBP1 (Polypyrimidine tract-binding protein 1), EXP1 (Expressed protein 1), PP2A (Serine/threonine-protein phosphatase 2A), β-TUB (β-tubulin), α-TUB (α-tubulin), EF1-α (Elongation factor 1-α), UBC (Ubiquitin-conjugating enzyme), ACT (Actin) and GAPDH (Glyceraldehyde 3-phosphate dehydrogenase) were selected from the transcriptome datasets of L. aurea. And then, expressions of these genes were assessed by qRT-PCR in various tissues and the roots under different treatments. The expression stability of the 14 candidates was analyzed by three commonly used software programs (geNorm, NormFinder, and BestKeeper), and their results were further integrated into a comprehensive ranking based on the geometric mean. The results show the relatively stable genes for each subset as follows: (1) EXP1 and TIP41 for all samples; (2) UBC and EXP1 for NaCl stress; (3) PTBP1 and EXP1 for heat stress, polyethylene glycol (PEG) stress and ABA treatment; (4) UBC and CYP2 for cold stress; (5) PTBP1 and PP2A for sodium nitroprusside (SNP) treatment; (6) CYP1 and TIP41 for methyl jasmonate (MeJA) treatment; and (7) EXP1 and TIP41 for various tissues. The reliability of these results was further enhanced through comparison between part qRT-PCR result and RNA sequencing (RNA-seq) data. In summary, our results identified appropriate reference genes for qRT-PCR in L. aurea, and will facilitate gene expression studies under these conditions.
Introduction
Lycoris aurea (L' Hér.) Herb, also called Golden Magic Lily, is an ornamentally and medicinally important species of the Amaryllidaceae family. It belonged to the genus Lycoris which composed of approximately 20 species of flowering plants native to the moist warm temperate woodlands of eastern and southern Asia (Hsu et al., 1994; Shi et al., 2006; Unver, 2007). Like other species of genus Lycois, L. aurea is very durable, tolerating the extremes of drought and waterlogging, as well as poor soil conditions (Wang et al., 2013; Xu et al., 2015). It also accumulates Amaryllidaceae alkaloids such as lycorine and galanthamine, which have been reported to exhibit medical values (Bores et al., 1996; Lilienfeld, 2002; Marco and do Carmo Carreiras, 2006; Lamoral-Theys et al., 2010). In general, Amaryllidaceae alkaloids are regarded as derivatives of the common precursor 4′-O-methylnorbelladine (Eichhorn et al., 1998; Bastida et al., 2011). There are three different groups of Amaryllidaceae alkaloids that are biosynthesized by three modes of intramolecular oxidative C–C phenol coupling (para-ortho', para-para' and ortho-para') (Bastida et al., 2011). Although many detailed insights in biosynthetic steps of Amaryllidaceae alkaloids production have been revealed by the biochemical approaches labeling intermediates, the key enzymes involved in the biosynthesis of Amaryllidaceae alkaloids (especially for galanthamine) are far from being fully understood (Wang et al., 2013). In order to better identify the determinants in production of Amaryllidaceae alkaloids, studies on their inducible phenotype have been performed. For example, the improved production of Amaryllidaceae alkaloids was observed in some Amaryllidaceae plants when treated with elicitors including methyl jasmonate (MeJA), sodium nitroprusside (SNP) and ethylene (Colque et al., 2004; Mu et al., 2009; Ptak et al., 2010; Jiang et al., 2011). Known as a derivative of jasmonate metabolism, MeJA was shown to be an important signal molecules detected in a wide spectrum of plant species and function on a lot of biological processes including growth inhibition, senescence, wound response, plant defense and secondary mechanism (Wasternack, 2007; De Geyter et al., 2012; Wasternack and Hause, 2013). For example, three major classes of plant secondary metabolites defined as the terpenoids, alkaloids and phenylpropanoids were induced by jasmonates (De Geyter et al., 2012; Wasternack and Hause, 2013). Nevertheless, the detailed processes of MeJA-stimulated Amaryllidaceae alkaloids production and concomitant transcriptome changes associated with response to MeJA in L. aurea remain poorly understood. Furthermore, the precise regulation mechanisms controlling the biosynthesis of Amaryllidaceae alkaloids highly interconnected at the metabolic level and a possible transcriptional/post-transcriptional regulation still need to be elucidated.
RNA sequencing (RNA-seq) has been applied prevalently on transcriptomes analysis of various species for a wide range of purposes (Wang et al., 2009; Metzker, 2010; Stone and Storchova, 2015). The main outcome of RNA-seq data is to identify the differentially expressed genes, while it was also used to search for reference genes (Zhuang et al., 2015). Meanwhile, quantitative real-time polymerase chain reaction (qRT-PCR) technique, with quantitative accuracy, high sensitivity, low cost, and high-throughput characteristics, has also been widely used to determine gene expression levels and to validate transcriptomic data (Bustin, 2002; Radonic et al., 2004; Caldana et al., 2007; Van Guilder et al., 2008). For accurate qRT-PCR evaluation, it is necessary to select suitable reference genes as internal control under different experimental conditions because several factors including the starting material, RNA integrity, reverse transcription efficiency, cDNA quality, sample amount, and/or extraneous tissue and cell activities can significantly influence the accuracy of gene expression (Bustin, 2002; Huggett et al., 2005). In addition, gene expression can be highly tissue-specific and often varies based on the physiological status of the organism or experimental treatments, and not a single gene can act as a universal reference reported so far (Nicot et al., 2005; Gutierrez et al., 2008a; Gimeno et al., 2014; Zhuang et al., 2015). Hence, the selection of appropriate reference genes is important for obtaining valid results and proper interpretation from the analysis (Bustin, 2002; Bustin et al., 2009). Numerous studies have documented the selection of reference genes in various plants including Arabidopsis (Czechowski et al., 2005; Remans et al., 2008; Hong et al., 2010; Lilly et al., 2011), grasses (Hong et al., 2008; Lee et al., 2010), fruits (Reid et al., 2006; Tong et al., 2009; Clancy et al., 2013; Die and Rowland, 2013; Imai et al., 2014), vegetables (Expósito-Rodríguez et al., 2008; Wan et al., 2010; Xu et al., 2012), some desert plants (Li et al., 2012, 2015; Zhu et al., 2013), and crops such as soybean (Jian et al., 2008; Libault et al., 2008; Hu et al., 2009; Kulcheski et al., 2010), rice (Kim et al., 2003; Jain et al., 2006; Narsai et al., 2010), wheat (Paolacci et al., 2009), barley (Burton et al., 2004), buckwheat (Demidenko et al., 2011), potato (Nicot et al., 2005), and sugarcane (Iskandar et al., 2004). Of some Lycoris species, comparison and selection of reference genes in different tissues and floral development stages has been performed (Cui et al., 2011; Jiang et al., 2015). However, none has been assessed for a systematic selection of reference genes in L. aurea under abnormal condition (especially for abiotic stress and hormone treatments). Beside, one of our major research interests concerns the study of the galanthamine biosynthesis pathways, and we have characterized a number of candidate genes referring to this process in L. aurea (Wang et al., 2013). The need for suitable reference genes is thus urgent for qRT-PCR detection of gene expression especially regarding galanthamine biosynthesis and its regulation processes under various experimental conditions in L. aurea.
In this study, we selected 14 candidate reference genes based on the transcriptome datasets of L. aurea by RNA-seq (Wang et al., 2013; unpublished data). The expression profiles of these candidate reference genes were tested under various treatments and further validated the expression stability by qRT-PCR and evaluated using statistical algorithms including geNorm (Vandesompele et al., 2002), NormFinder (Andersen et al., 2004), and BestKeeper (Pfaffl et al., 2004). The comprehensive stability ranking of these reference genes under each specific experimental condition were also performed. Additionally, one target gene, secologanin synthase (cytochrome P450 CYP72A1), was used to validate the effectiveness of the selected reference genes. Finally, this work provides the basis for further research in exploring gene expression profiling and the regulation mechanism of galanthamine biosynthesis of L. aurea under different experimental conditions.
Material and Methods
Plant Materials and Stress Treatments
The bulbs of Lycoris aurea with the same or similar sizes (1.8–2.2 cm) in diameter were planted and grown in a greenhouse at the research station of Institute of Botany, Jiangsu Province and Chinese Academy of Sciences (118°83′ E; 32°05′ N), Nanjing, China. For various abiotic stress and hormone treatments, seedlings (with 2–3 leaves) were transferred into plastic pot (15.0 cm top diameter and 14.5 cm deep) containing half-strength Hoagland's nutrient solution. Plants were placed in a chamber with a mean temperature of 25.0 ± 1.4°C, a relative humidity of 60.0% ± 10%, and a day/night rhythm of 14/10 h. After 7 days maintenance, L. aurea seedlings were subjected to various experimental treatments following the methods described previously (Tian et al., 2015; Xiao et al., 2015). For drought treatment, 20% PEG-6000 solution (w/v, polyethylene glycol, Sangon, China) was applied to incubate the plants for 0, 1, 6, and 24 h. For cold and heat stress, Plants in the pots were placed at chamber with the temperature of 4°C and 42°C respectively for 0, 1, 6, and 24 h. For salinity treatment, seedlings were transferred to solution with 400 mM NaCl for 0, 1, 6, and 24 h. For sodium nitroprusside (SNP) and hormone treatments, plants were imposed in 500 μM SNP, 100 μM methyl jasmonate (MeJA) or 100 μM abscisic acid (ABA) for 0, 1, 6, and 24 h. MeJA (containing 0.02% (v/v) absolute ethanol and 0.02% (v/v) Tween-20), SNP and ABA were dissolved in distilled water. After that, the roots were sampled separately at different periods for each treatment used for expression analysis. L. aurea is a groundcover plant and typical hysteranthous geophyte appearing in autumn. Its floral stems and flowers start growing from August to September, and the leaves grow from September to October. So for tissue samples subset, six parts: filament, anther, column, petal, ovary and stem were collected when L. aurea is flowering. After the flowers wilted, root, bulb and leaf from the same plant were collected respectively. The detailed information of samples collected from various tissues/experimental conditions were also listed in Table S1. All samples were harvested from three replicate plants, frozen in liquid nitrogen and then stored at −80 °C prior to RNA isolation.
Total RNA Isolation and cDNA Synthesis
The total RNA was extracted from the samples using RNAprep Pure Plant Kit (Tiangen Biotech, Beijing, China). To eliminate DNA contamination, total RNA was digested with DNase I (Ambion, USA) and then purified according to the manufacturer's protocol. The integrity of total RNA samples was verified by performing 1.5% (w/v) agarose gel electrophoresis, and the quantity and quality of RNA samples were measured with the NanoDrop 2000 Spectrophotometer (NanoDrop Technologies, ThermoScientific, USA). Only the RNA samples with absorption ratios of A260/280 = 1.8−2.2 and A260/230 higher than 1.8 were used for cDNA synthesis.
In order to perform qRT-PCR, an aliquot of 1 μg of total RNA was used for cDNA synthesis with a final volume of 20 μL using PrimeScript™ RT reagent Kit with gDNA Eraser (TaKaRa Bio Inc., Dalian, China) following the manufacturer's instructions. The cDNA was diluted 10-fold with nuclease-free water for qRT-PCR.
Selection of Candidate Reference Genes and Primer Design
We performed transcriptome sequencing of L. aurea root samples exposed to 100 μM MeJA at 0 (control) and 6 h (MJ100) using Illumina paired-end sequencing technology on an Illumina Hi-Seq™ 2000 platform. After assembly and annotation, the read counts of unigenes were converted to fragments per kilobase of exon model per millon mapped reads (FPKM values). To estimate expression stability of each gene, the following indices of FPKM values, including mean expression value (MV), standard deviation (SD) and coefficient of variation (CV) value (dividing SD by MV) were calculated according to the methods described previously (de Jonge et al., 2007; Zhuang et al., 2015). Based on previous qRT-PCR reports in the model plants Arabidopsis, 14 corresponding unigenes, which have credible protein annotation (Nr and Swiss-Prot databases), appropriate expression level, and a low CV of FPKM, were screened and selected from the L. aurea transcriptome for candidate reference genes (Table S2). According to the sequences of these unigenes (Data Sheet 1), specific primers were designed using Primer-BLAST in NCBI. The criteria for primer design were set as follows: primer lengths of 20–24 bp, GC contents of 45–55%, melting temperature (Tm) in a range of 55−60°C and amplicon lengths of 100–250 bp.
Quantitative Real-Time PCR Analysis
qRT-PCR was conducted in 96-well plates and performed on the LightCycler 480 (Roche Molecular Biochemicals, Mannheim, Germany). The reaction mix contained 2 μL diluted cDNA, 7.5 μL AceQ qPCR SYBR Green Master Mix (Vazyme, Nanjing, China), 0.4 μM of each primer and ddH2O in a final volume of 15 μL. Two biological replicates for all of the samples and three technical replicates of each biological replicate with a no-template control (NTC) were used. The qRT-PCR protocol was as follows: 95°C for 10 min, 40 cycles of 95°C for 15 s, 60°C for 30 s. To verify the specificity of each primer, a melting-curve analysis was included. The mean amplification efficiency of each primer pair was checked by the LinRegPCR program (Ruijter et al., 2009).
Ranking the Stabilities of Candidate Reference Genes
Three software programs, geNorm (Vandesompele et al., 2002), NormFinder (Andersen et al., 2004) and BestKeeper (Pfaffl et al., 2004) were used statistically to rank the stability of the 14 selected reference genes across all the experimental subsets. All analyses using these packages occurred according to the manufacturers' instructions. For geNorm and NormFinder algorithms, the raw cycle threshold (Ct) value of each gene were transformed into relative expression levels according to the formula 2−ΔCt (ΔCt = Ct value of each sample - the minimum Ct value). Then, the relative expression values were imported into geNorm and NormFinder to analyze gene expression stability. According to the geNorm manual, the average expression stability value (M) and pairwise variation (Vn/n+1) value for each reference gene with all other genes were automatically analyzed and ranked according to their expression stability. As recommended by geNorm, the threshold of M value was set as 1.5; a lower value of M indicated higher gene's expression stability. The Vn/Vn+1 value determines the optimal number of reference genes for accurate normalization. A cut-off value of Vn/n+1 < 0.15 indicates that an additional reference gene makes no significant contribution to the normalization (Vandesompele et al., 2002). The NormFinder program calculates a stability value (SV) for evaluating expression variation when using reference genes for normalization and the lower SV indicates the higher stability (Andersen et al., 2004). The BestKeeper is an Excel-based tool that is similar to geNorm and NormFinder, and it determines the stability ranking of the reference genes based on the coefficient of variance (CV) and the standard deviation (SD) of the average Ct values. The most stable gene exhibits the lowest CV ± SD value, and genes with SD greater than 1 were considered unacceptable and should be excluded (Pfaffl et al., 2004; Chang et al., 2012; Xiao et al., 2015). Three results of the stability rankings were integrated, generating a comprehensive ranking according to the geometric mean of three algorithms corresponding rankings.
Validation of Reference Genes
To validate the reliability of the qRT-PCR data, we analyzed the expression profiles of the 14 candidate reference genes in RNA-seq and ranked them according to the CV of FPKM. The gene with the lowest CV was regarded as the most stable gene, which was double-checked by RNA-seq and qRT-PCR data in the MeJA treatment experiment. Meanwhile, the expression pattern of a target gene, secologanin synthase (CYP72A1) were analyzed using the most stable and least stable reference genes after normalization across all the experimental sets. For MeJA treatment subset, the expression levels of the target gene CYP72A1 in qRT-PCR were also compared with the FPKM values in RNA-seq data. The sequences of these reference genes were obtained from the transcriptome data (Text 1 in Data Sheet 1). The amplification efficiencies of the target genes were also estimated by the LinRegPCR program. The average Ct value was calculated from three biological and technical replicates and used for relative expression analyses. The relative expression data were calculated according to the 2−ΔCt method and presented as fold change (Livak and Schmittgen, 2001).
Results
Selection of Candidate Reference Genes in Lycoris aurea, Evaluation of Amplification Specificity and PCR Efficiency
Fourteen candidate reference genes were chosen according to described Arabidopsis most stable genes and reference genes commonly used in qRT-PCR studies (Czechowski et al., 2005). Orthologous L. aurea sequences were retrieved after performing BLASTX on L. aurea transctiptome datasets (Wang et al., 2013; unpublished data). The qRT-PCR primer sequences and amplicon characteristics of 14 candidate reference genes are described in Table 1. The expression stability of candidate reference genes (GAPDH, ACT, α-TUB, β-TUB, EF1-α, UBC, EXP1, EXP2, CYP1, CYP2, TIP41, PTBP1, YLS8, and PP2A) named according Arabidopsis orthgologs and Nr annotation, was assessed under various conditions, such as abiotic stress (NaCl, PEG, heat, and cold stress), hormone treatment, and different tissues. The primer specificities were confirmed by agarose gel electrophoresis, sequencing and melting curves, which showed the single amplicon of the expected size and the single peak melting curves (Figure S1; Data sheet 1). The qRT-PCR products ranged from 137 to 213 bp. For each gene, the mean PCR efficiency of each primer pair ranged from 1.775 to 1.880, and the linear R2 (correlation coefficients) ranged from 0.9989 to 0.9997 (Table 1).
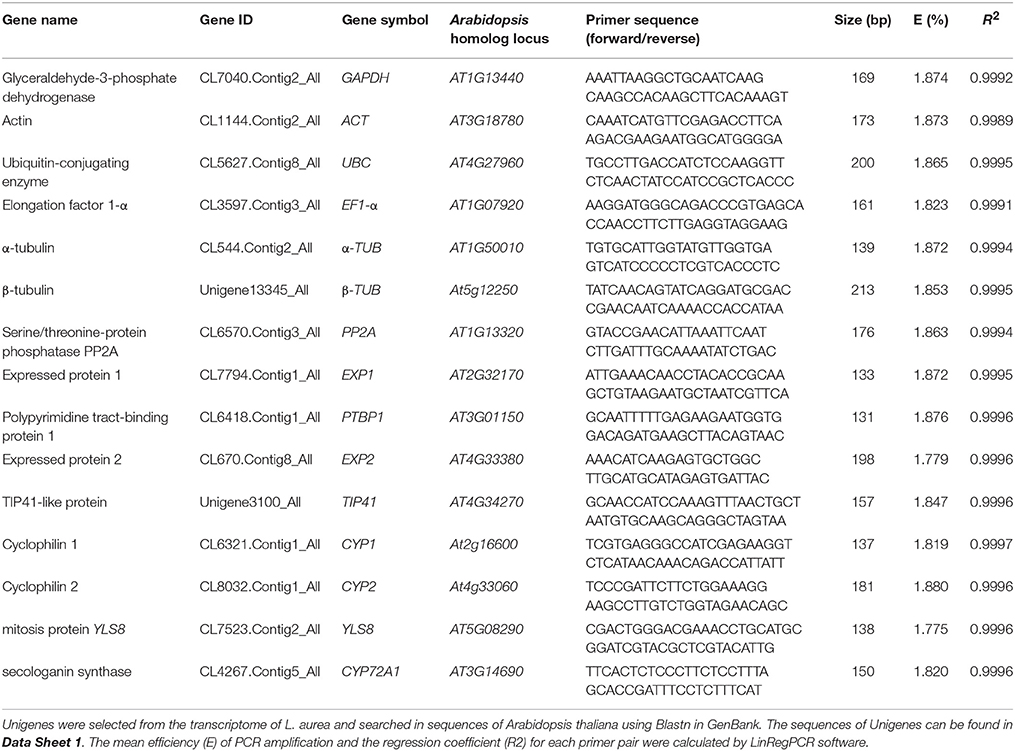
Table 1. Genes and primer sets used for qRT-PCR.
Expression Profiles of the Candidate Reference Genes
To evaluate stability of the reference genes across all experimental samples, the transcript abundances of the 14 candidate reference genes were detected by their mean Ct values. The mean Ct values for the 14 candidate reference genes ranged between 13 and 25, with most lying between 18 and 22 across all tested samples. The average Ct value of all the tested samples was 22.9 cycles. Across all samples, α-TUB was the most abundantly expressed gene, with the lowest average Ct values of 13.44 ± 3.29 (mean ± SD), followed by UBC (17.80 ± 4.37), ACT (18.02 ± 3.34), GAPDH (18.05 ± 4.70), YLS8 (18.49 ± 3.31), EF1-α (18.79 ± 2.90), CYP1 (18.91 ± 3.17), and β-TUB (20.79 ± 2.85). EXP2 was found to have the lowest level of expression of any of the genes tested, with a mean Ct values of 25.01 ± 2.99, followed by CYP2 (22.93 ± 1.88) and PP2A (22.39 ± 3.45) (Figure 1). The genes with higher SD of Ct values indicated more variable expression compared to these with lower SD. CYP2 showed the smallest variation in gene expression (22.93 ± 1.88), while GAPDH with the most variable levels of expression (Figure 1).
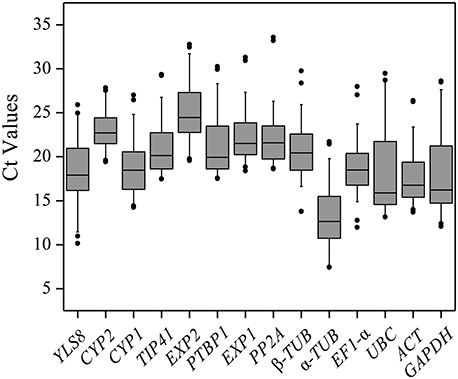
Figure 1. Distribution of Ct values of candidate reference genes across all of the samples. The Box-plot contains the mean, interquartile range, non-outlier range, and outlier.
Expression Stability Analysis of the Candidate Reference Genes
In order to obtain a reliable dataset of the optimal reference genes under our experimental conditions, three of the most popular software programs were used: geNorm, NormFinder, and BestKeeper.
geNorm Analysis
By using geNorm to assess the best reference genes in Lycoris aurea, the Ct values were transformed to relative expression levels and then calculated according to the manual. The M value was calculated at each step during stepwise exclusion of the least stable reference gene until two best genes were obtained (Table S3). In our analysis, a chart of the M value was generated that indicated the stability rank of the tested genes (Figure S2). The top two reference genes for qRT-PCR normalization were CYP1 and TIP41 for NaCl stress, EXP1 and PTBP1 for PEG stress, CYP2 and UBC for cold stress, CYP1 and YLS8 for heat stress, EXP1 and PTBP1 in ABA treatment, CYP2 and TIP41 in MeJA treatment, PP2A and PTBP1 in SNP treatment, and EXP1 and TIP41 in different tissues (Figure S2). Additionally, in the context of the total sample set, EXP1 and TIP41 ranked as the most stable two genes. Therefore, these two reference genes were deemed the most suitable for the widest range of test conditions in the current study.
The Vn/n+1 between normalization factors calculated by the geNorm algorithm also determines the optimal number of reference genes for accurate normalization. A cut-off value of Vn/n+1 < 0.15 indicates that an additional reference gene makes no significant contribution to the normalization (Vandesompele et al., 2002). In the subset of PEG stress, the V2/3 value was below 0.15 (0.149), which suggested that two reference genes should be used for normalization. In the NaCl stress subset, three reference genes were sufficient for accurate normalization, as the V3/4 value was lower than 0.15. In the ABA and MeJA treatment subsets, four reference genes were needed for accurate normalization, as the V4/5 value was lower than 0.15. When the SNP-treated and cold-stressed samples were taken into account, the V5/6 value was lower than the cut-off value of 0.15, which indicated that five genes were suitable for all samples in this study. Additionally, when tissue and total samples were considered, the lowest pairwise variation value was still above 0.15 (Figure 2; Table S4).
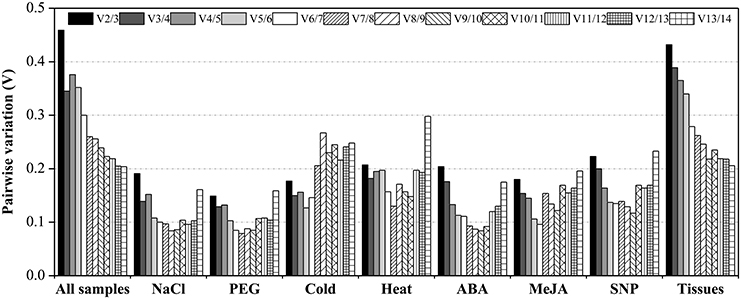
Figure 2. Pairwise variation (Vn/Vn+1) values in nine subsets calculated by using geNorm. The cut-off value to determine the optimal number of reference genes for qRT-PCR normalization is 0.15.
NormFinder Analysis
The results of the candidate reference gene stability ranking constructed by Normfinder are shown in Figure S3 for each subset and the SV is provided in Table S5. For all samples subset, NormFinder demonstrated that EXP1 was the most stable (also ranked first by geNorm) followed by TIP41, CYP1, PTBP1. Similar to geNorm, PP2A was the least stable gene. In the subset of NaCl stress, EXP1 and UBC were the most stable. In the PEG-stressed, cold-stressed and MeJA-treated subsets, UBC was the most stable gene. For ABA-treated subset, NormFinder suggested that EXP1 and PTBP1 were the most stable genes, and α-TUB was the least stable. In heat stress subset, EXP1 and PTBP1 were the most stable. GAPDH was the best gene for the SNP group. For the tissue samples subset, EXP1 was the most stably expressed gene.
BestKeeper Analysis
In both the NaCl stress subset and SNP treatment subset, PTBP1 with the lowest CV ± SD values of 1.80 ± 0.36 and 3.19 ± 0.60, respectively, were identified as the most stable gene. In the PEG stress subset, PTBP1 (2.93 ± 0.57) and EXP1 (2.93 ± 0.60) were identified as the best reference genes for normalization. In the cold stress subset, TIP41 (3.82 ± 0.75) had the lowest CV ± SD values, and showed remarkably stable expression. In the heat stress subset, only ACT showed SD < 1, which were considered as the most stable genes. In the ABA-treated subset, ACT had the lowest CV ± SD values of 2.70 ± 0.43, and showed the most stable expression. In MeJA-treated subset, the BestKeeper analysis suggested that EXP1 was the most stable reference gene followed by TIP41 and CYP1, while α-TUB was the least stable reference gene. Additionally, in both the all samples subset and tissue samples subset, no reference gene showed SD < 1, while CYP2 had the lowest CV ± SD values of 6.62 ± 1.52 and 5.51 ± 1.34, respectively, were considered as the most stable genes (Table S6; Figure S4).
Comprehensive Stability Analysis of Reference Genes
To obtain a consensus result of the most stable reference genes as recommended by the three methods according to the RefFinder approach (Xie et al., 2012; http://fulxie.0fees.us/?type=reference), the geometric mean of three algorithms corresponding rankings for each candidate gene were calculated (Table 2; Figure 3; Table S7). EXP1 and TIP41 were ranked as the top two stable reference genes in the all samples subset and tissue samples subset; EXP1 also comprehensively ranked first in the NaCl stress subset, heat stress subset and ABA treatment subset. In cold stress subset, CYP2 was stably expressed most. For both the heat stress subset and the SNP treatment subset, PTBP1 was the most stable gene. Additionally, under MeJA treatment, TIP41 was the best reference gene. The expression of PP2A was extremely unstable under cold stress and heat stress. α-TUB was unstably expressed in the majority of tested subsets, especially in the NaCl stress subset, PEG stress subset, MeJA treatment subset and SNP treatment subset.
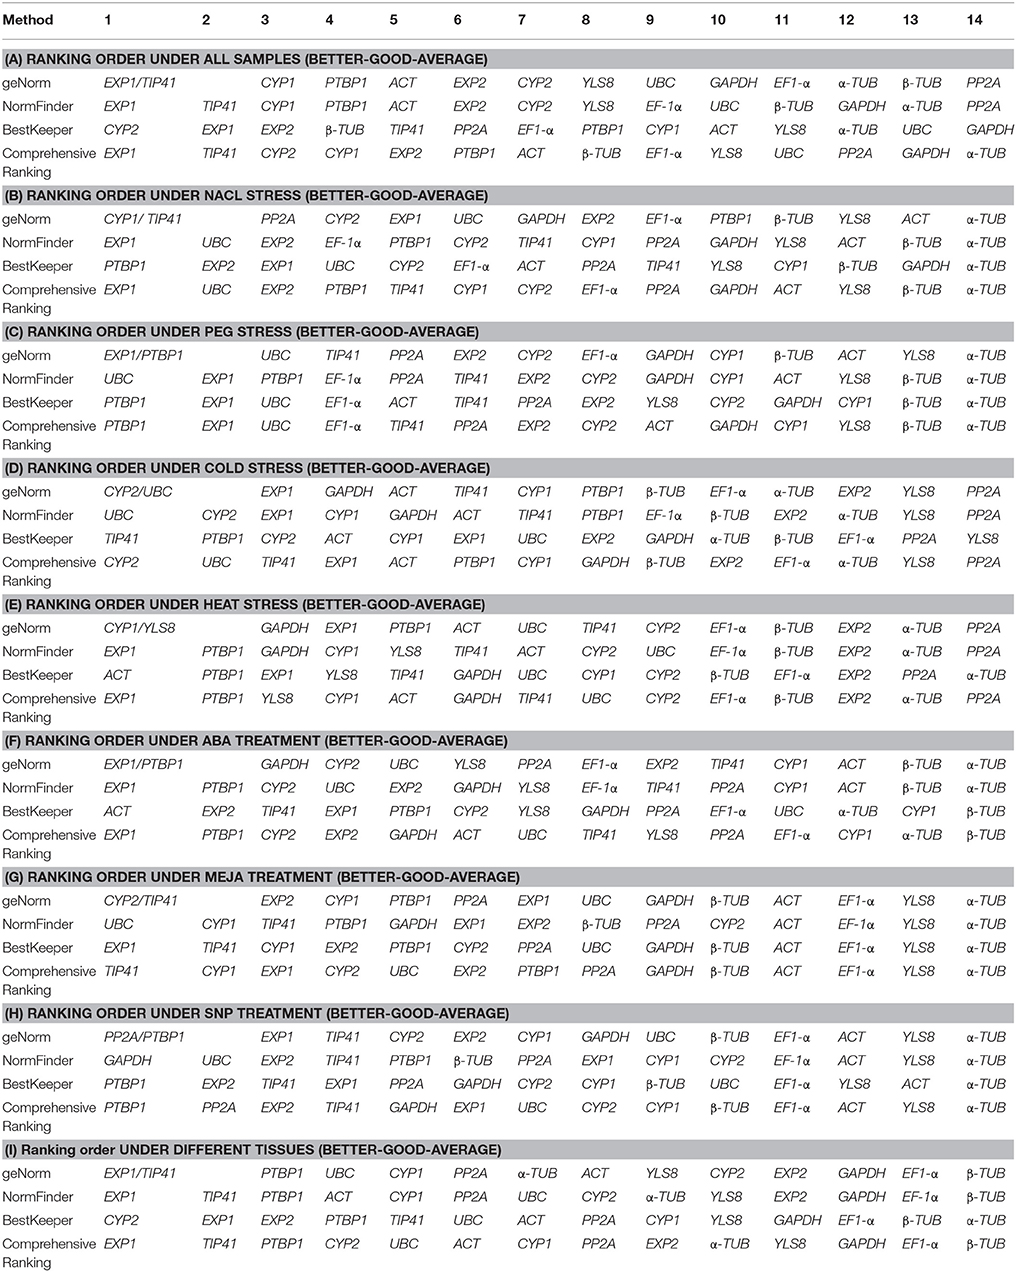
Table 2. Expression stability ranking of the 14 candidate reference genes.
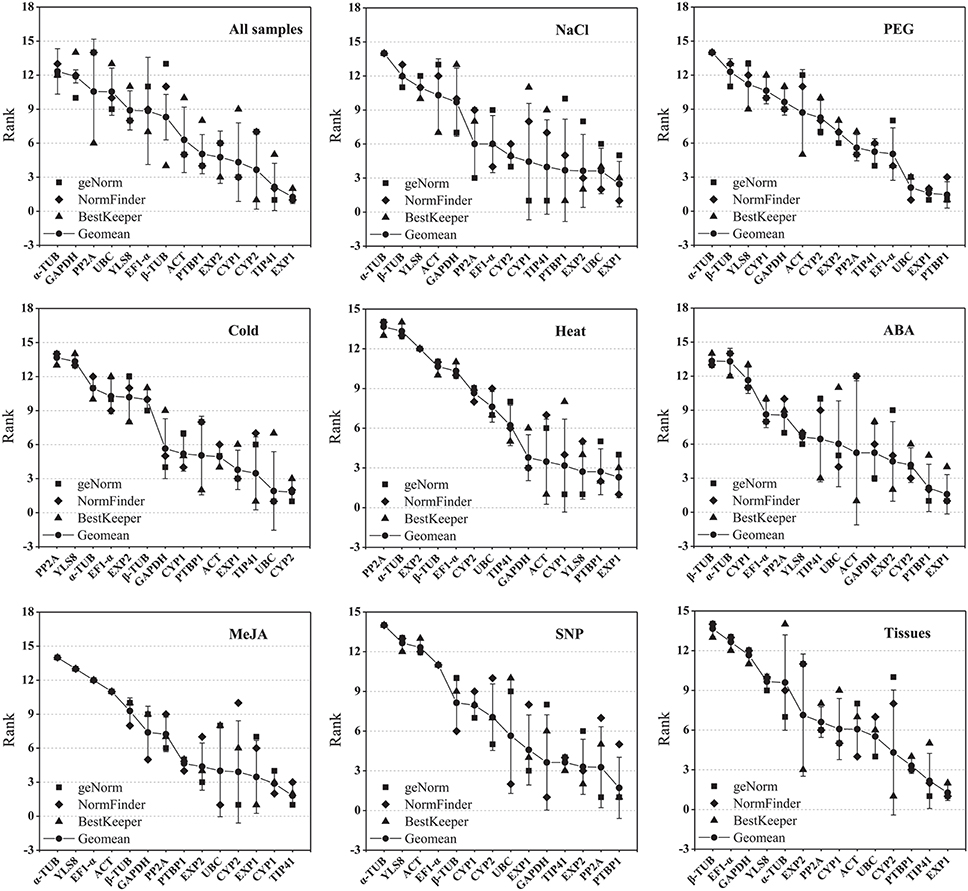
Figure 3. Aggregation of three rankings. The comprehensive ranking of candidate genes was calculated by the geometric mean of three types of rankings (geNorm, NormFinder, and BestKeeper) in each subset.
Reference Genes Validation
To validate the selected reference genes, the stability of the candidate genes in qRT-PCR was compared with RNA-seq-based gene expression profiling. L. aurea samples treated with 100 μM MeJA and control were mapped, and their unigenes were quantified by RNA-seq as in this study (Table S2; unpublished data). FPKM represents the expression quantities of the unigenes, and the CV of FPKM represents the variability in gene expression. As shown in Figure 4A, YLS8, α-TUB, β-TUB, and EXP2 showed a high CV value, indicating they were not stable genes. In contrast, TIP41, PTBP1, and CYP1 had a lower CV, indicating that they were more stable under MeJA treatment. The ranking of gene stability in the MeJA treatment subset and the ranking of these genes in the RNA-seq data was also compared (Figure 4B). To some extent, the two types of rankings were consistent and had a positive correlation coefficient of r = 0.64. CYP1 and TIP41, which were two most stable genes in MeJA treatment were also shown relative stable expression through transcriptome analysis. Unstable genes, such as α-TUB and YLS8 also had similar rank in MeJA treatment subset and transcriptome analysis.
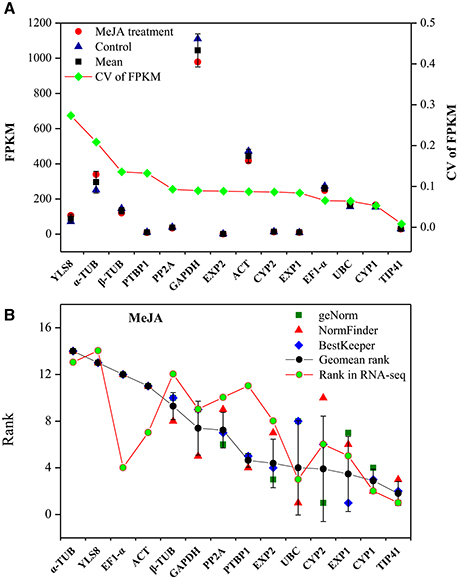
Figure 4. Validation of qRT-PCR results through comparison with RNA-seq expression profiles. (A) Stability ranking of candidate genes by CV of FPKM in RNA-seq. The gene with lower CV indicates more stable expression. (B) Correlation analysis between ranking of MeJA treatment subset by qRT-PCR and the ranking of RNA-seq. CV, coefficient of variation; FPKM, fragments per kilobase of exon model per million mapped reads.
Additionally, to further validate the selected reference genes, the relative expression levels of a target gene, CYP72A1 in L. aurea under different experimental conditions were evaluated using qRT-PCR. It was normalized using the most stable reference genes found in each subset both singly and in combination as well as two least stable reference genes as an internal control (Figure 5). A substantial divergence can occur in the relative transcript abundance of CYP72A1 when normalized to different kinds of reference genes. Under NaCl treatment, the expression level of CYP72A1 was down-regulated first then increased when normalized using the two stable genes (EXP1 and UBC), while the expression level was down-regulated dramatically when normalized using the least stable combination (α-TUB and β-TUB). Under PEG stress, the highest expression level of CYP72A1 appeared at 1 h and was 4.56- and 6.35-fold higher than control (0 h) by using the most stable reference genes (PTBP1 and EXP1) as the internal control. In response to cold stress, CYP72A1 exhibited a clear up-regulation to the highest level by 1 h of treatment and then declined thereafter when the two most stable references genes (UBC and CYP2) were used, while the expression level of CYP72A1 fluctuated dramatically during cold stress when the least stable reference genes (PP2A and YLS8) were used for normalization. We also examined the reference genes in the ABA treatment and heat stress subsets. The results showed that both PTBP1 and EXP1 could serve as stable reference genes for normalization, while the relative expression folds of CYP72A1 normalized by α-TUB were slightly decreased compared to the stable genes PTBP1 and EXP1 under ABA treatment. With SNP treatment, the expression level of CYP72A1 was not affected significantly when normalized using the two stable genes (PTBP1 and PP2A), while the expression level was overestimated and underestimated when normalized using the least stable reference genes α-TUB and YLS8 respectively. In the same way, for the MeJA treatment subset, the expression level of CYP72A1 increased to a peak at 6 h and then decreased when normalized using two most stable genes (TIP41 and CYP1) and an unstable gene α-TUB, but the expression value of CYP72A1 was much higher when normalized by α-TUB. Additionally, the maximum expression level occurred at 24 h when YLS8 was used as a reference. To validate the results, the expression levels of CYP72A1 in qRT-PCR were compared with the FPKM values in RNA-seq data under MeJA treament. When TIP41 and CYP1 were used as the reference genes, the expression level of CYP72A1 was generally identified with the expression profile in RNA-seq (Figure S5). Contrastingly, when the least stable reference gene α-TUB was used as normalization factor, the expression level of CYP72A1 was significantly overestimated (Figure 5). Our tissue type analysis revealed that the transcript abundance of CYP72A1 was the highest in the leaf, followed by the petal when normalized by the most stable genes (EXP1 and TIP41).
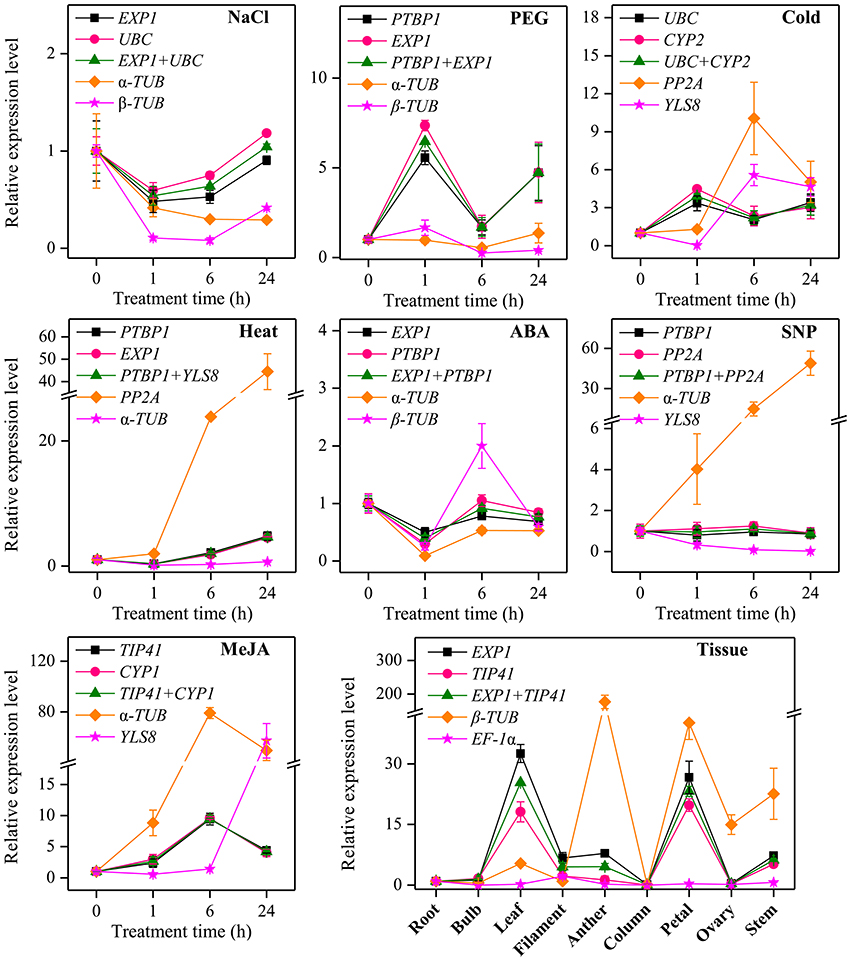
Figure 5. Relative quantification of CYP72A1 expression using the validated reference gene(s). The results are represented as mean fold changes in relative expression when compared to the first sampling stage (0 h). cDNA samples were taken from the same subset used for gene expression stability analysis. Roots were collected from L. aurea seedlings subjected to various treatments after 0, 1, 6, and 24 h. For tissue samples, different tissue types were collected from different development stage of L. aurea.
Discussion
Due to its high sensitivity, specificity, accuracy and reproducibility, qRT-PCR is commonly regarded as the most appropriated method for high-throughput analysis of gene expression profiling (Gutierrez et al., 2008b). However, random selection of reference genes, which may be influenced by different tissue types and experimental treatments, could cause the misinterpretation of results (Dheda et al., 2005). Therefore, validation of suitable reference genes for data normalization is mandatory to obtain reliable results for each experimental condition in different species (Schmittgen and Zakrajsek, 2000).
In this study, we had performed the large-scale transcriptome data of L. aurea (Wang et al., 2013; unpublished data) serving as the source of the reference gene selection. The expression levels and stability of 14 candidate reference genes were measured in L. aurea roots submitted to different conditions as well as in different tissues of L. aurea seedlings. By using three different software programs (geNorm, NormFinder, and BestKeeper), the 14 candidate reference genes exhibited various performance in their stability in L. aurea. Additionally, because of the different algorithms, the rankings generated by the three softwares were not completely identical (Table 2; Figure 3; Table S7). For example, in the cold stress subset, UBC was ranked first by geNorm and NormFinder, while it was ranked seventh by BestKeeper. In the NaCl stress subset and heat stress subset, the most stable gene in geNorm, such as CYP1, was ranked at a medium position or even a bottom position in NormFinder or BestKeeper. This apparent divergence is probably due to the discrepancies in the three statistical algorithms to calculate stability (Niu et al., 2015). geNorm identifies two reference genes with the highest degree of similarity in expression profile and the lowest intra-group variation (Vandesompele et al., 2002; Jian et al., 2008; Cruz et al., 2009). In contrast, NormFinder takes both the inter- and intra-group variations into account, and combines them into a stability value, and finally ranks the top genes with minimal inter- and intra-group variation (Andersen et al., 2004). As for BestKeeper, it determines the stability ranking of the reference genes according to their CV and SD values (Chang et al., 2012; Xiao et al., 2015). It has been recommended more than two algorithms should be used for reference gene stability evaluation (Jacob et al., 2013; Štajner et al., 2013; Xiao et al., 2015). Besides, a comprehensive tool RefFinder was developed to generate the final overall ranking of tested reference genes based on the geometric mean of the weights of every gene calculated by each program (Xie et al., 2012). A lower geometric mean of rankings indicates that the gene is more stable, and more narrow error bars indicate that the result is more reliable (Xiao et al., 2015). Therefore, by calculating the geometric mean of three rankings, a clear comprehensive ranking for each gene was generated (Table 2; Figure 3; Table S7). It showed that the comprehensively ranked first gene EXP1 in all samples subset, NaCl stress subset, heat stress subset, ABA treatment subset, and tissue samples subset has lower geometric mean and narrower error bars because it all ranked top in geNorm, NormFinder, and BestKeeper. It is more reliable that the ranked first gene was the relative most stable gene in corresponding subset. Specifically, we also noticed that β-TUB and GAPDH displayed relatively low expression stability in the tissue samples subset, which is similar to the previous result in Lycoris longituba (Cui et al., 2011).
Traditionally, reference genes are usually cellular maintenance genes, which play housekeeping roles in basic cellular components and functions, such as tubulin (TUB), elongation factor 1-α (EF1-α), glyceraldehyde-3-phosphate dehydrogenase (GAPDH), ubiquitin (UBQ), 18S ribosomal RNA (18S rRNA), and actin (ACT). However, a growing number of studies indicated that the expression levels of most of these classic reference genes are somewhat can vary greatly and are unsuitable for gene normalization in many species under specific conditions (Thellin et al., 1999; Czechowski et al., 2005; Nicot et al., 2005; Jian et al., 2008; Die et al., 2010; Yang et al., 2010; Lilly et al., 2011; Li et al., 2012; Zhu et al., 2013). So housekeeping genes used as internal reference genes in each species should be taken with some caution under a given subset of experimental conditions (Gutierrez et al., 2008a; Ma et al., 2013; Lin et al., 2014). In this study, ACT ranked neither the top three most stable genes nor the least stable genes under tested experimental conditions. EF1-α and GAPDH displayed a less stable expression pattern. α-TUB and β-TUB were always the least stable reference genes under almost all the tested experimental conditions. Additionally, UBC, an ubiquitin-conjugating enzyme gene, was ranked first in both PEG stress subset and cold stress subset. It was also top gene in the all samples subset (Table 2; Figure 3). The strong stability of UBC in L. aurea was consistent with the results in Corchorus olitorius and Platycladus orientalis (Chang et al., 2012; Niu et al., 2015); However, it was not satisfactory for qRT-PCR normalization in different tissues of bamboo (Fan et al., 2013).
Some studies have identified several new reference genes that could be more stably expressed under specific conditions as compared with classic ones (Czechowski et al., 2005; Libault et al., 2008; Løvdal and Lillo, 2009; Zhu et al., 2013). In the present study, four new reference genes YLS8, PP2A, EXP1, and TIP41 were tested. EXP1 was highly stable within developing stages of rice anthers and pollens (Ji et al., 2014). We also observed that EXP1 was ranked first in the tissue samples subset as well as in the all samples subset, NaCl stress subset, heat stress subset, and ABA treatment subset. Meanwhile, it is notable that EXP1 ranked head of EXP2 in our study (Figure 3). The YLS8 gene is also reported to be a stable reference gene (Morgante et al., 2011; Han et al., 2013; Štajner et al., 2013) while it was expressed stably only in the heat stress subset. Similar to chicory (Delporte et al., 2015), our results showed that TIP41 is the most suitable gene among all the reference genes we have tested within samples elicited with MeJA. For the study with different tissues of L. aurea, TIP41 was also identified as a good reference gene which ranked the second. It was also somehow stable in the cold stress subset, NaCl stress subset and SNP treatment subset (Figure 3). Former studies showed that TIP41 was expressed stably at different developmental stages of olive plants and in various tissues of bamboo (Fan et al., 2013; Resetic et al., 2013). Although it was recommended as a reference gene under abiotic stress in Brassica juncea and Salicornia europaea (Chandna et al., 2012; Xiao et al., 2015), TIP41 was suitable for Coffea arabica under nitrogen starvation, salt stress or heat stress (de Carvalho et al., 2013).
RNA-seq has been applied prevalently on analyzing the transcriptomes of various species for a range of purposes (Wang et al., 2009; Li et al., 2015; Stone and Storchova, 2015). A large amount of transcript information as well as expression profiling of thousands of genes could be obtained by RNA-seq. It was also used to search for reference genes. Any gene with a minimal expression level variation in every analyzed sample is considered as candidate reference gene. To validate the results of qRT-PCR, we compared the result with RNA-seq data whose samples were also under the MeJA treatment. The two results (qRT-PCR and RNA-seq) supported each other, as they had a significant positive correlation coefficient (r = 0.64; Figure 4). Therefore, the results of this experiment are credible. Additionally, under chosen experimental conditions, good reference genes are stably expressed and should have a kind of expression level comparable to those of the target genes. In this study, a validation test using the most stable reference genes found in each subset both singly and combined as well as two least stable genes as an internal control in qRT-PCR analysis of target gene expression patterns, CYP72A1, was also performed (Figure 5). Our results showed that expression of CYP72A1 was induced by NaCl, Cold, and PEG stress as well as MeJA treatment. Additionally, when α-TUB and β-TUB was validated as a reference gene for normalization the target gene CYP72A1, the expression pattern was obviously overestimated or underestimated (Figure 5). So the appropriate selection of reference genes is critically important for the normalization of target gene expression with qRT-PCR in Lycoris aurea.
Conclusion
The selection of suitable reference genes is a prerequisite to quantifying gene expression by qRT-PCR. Here, we presented a systematic attempt to validate a set of candidate reference genes for the normalization of gene expression using qRT-PCR in L. aurea subjected to a wide range of experimental conditions as well as across different tissues. The expression stability of the 14 candidates was analyzed by the three commonly used programs (geNorm, NormFinder, and BestKeeper), and their results were further integrated into a comprehensive ranking based on the geometric mean. For the study of gene expression under NaCl stress, we recommend UBC and EXP1 to normalize the qRT-PCR data. For gene expression study under cold stress, UBC and CYP2 are the two most suitable reference genes. We also got the stable reference genes as EXP1 and PTBP1 for heat stress, PEG stress and ABA treatment, PTBP1 and PP2A for SNP treatment, and TIP41 and CYP1 for MeJA treatment, respectively. For gene expression study in the various tissues, EXP1, TIP41, and PTBP1 are recommended as the best reference genes for normalization. In addition, the two least stable reference genes α-TUB and β-TUB should be carefully used for normalization. The reliability of these results was enhanced by comparing part qRT-PCR result with RNA-seq data, and the selected reference genes can significantly reduce errors in genes quantification. Our results demonstrate that transcriptome sequencing data is a useful source for candidate reference genes screening and signify the importance of identification of specific reference genes for specific conditions in L. aurea. Furthermore, the reference genes selected in current study will be helpful for accurate normalization of qRT-PCR data and facilitate the future work on gene expression studies in L. aurea.
Author Contributions
RW and BX designed the research; RM, SX, YZ performed most of the experiments and data analysis; RM, SX, RW wrote the draft of the paper. YZ and BX participated in the preparation of the manuscript. All authors have read and approved the final manuscript.
Conflict of Interest Statement
The authors declare that the research was conducted in the absence of any commercial or financial relationships that could be construed as a potential conflict of interest.
Acknowledgments
This work was funded by the National Natural Science Foundation of China (Grant No. 31270339, 31301798 and 31572151), the Industry-Academy Joint Technological Innovations Foundation of Jiangsu Province (Grant No. BY2014131), Jiangsu Government Scholarship for Overseas Studies (2014), and Jiangsu Provincial Key LAB Foundation for Plant EX SITU Conservation (Grant No. QD201302).
Supplementary Material
The Supplementary Material for this article can be found online at: http://journal.frontiersin.org/article/10.3389/fpls.2016.00536
Figure S1. Melting curves and agarose gel electrophoresis of PCR products. (A) Melting curves of 14 candidate reference genes tested in this study. (B) Agarose gel (1.5%) electrophoresis showing amplification of a single PCR product of the expected size. M represents DNA marker having bands of 2000 bp, 1500 bp, 1000 bp, 750 bp, 500 bp, 250 bp, and 100 bp.
Figure S2. Expression stability values (M) and ranking of the candidate reference genes as calculated by geNorm. A lower M-value indicates more stable expression.
Figure S3. Stability value and ranking of the candidate reference genes based on NormFinder. A lower stability value (SV) indicates more stable expression.
Figure S4. Expression stability and ranking of the candidate reference genes calculated by BestKeeper. CV, coefficient of variation; SD, standard deviation. The gene with lower CV and SD shows more stable expression.
Figure S5. The expression level of the target gene CYP72A1 under control and MeJA treatment in RNA-seq. The samples exposed to control and MeJA at 6 h were used for transcriptome sequencing. FPKM: fragments per kilobase of exon model per million mapped reads.
Table S1. The detailed information of samples collected from various tissues/experimental conditions.
Table S2. Selected unigenes from the transcriptome data of Lycoris aurea. The unigenes with appropriate expression quantities and highly reliable annotation were selected to evaluate the stability of gene expression.
Table S3. geNorm ranking of 14 candidate reference genes. M-value: expression stability value. The stability of genes was ranked according to the M-value.
Table S4. Pairwise variation (Vn/n+1) analysis of 14 candidate reference genes calculated by geNorm to determine the optimal number of reference genes for normalization. The threshold value was proposed to be 0.15, below which the inclusion of an additional reference genes is not necessary.
Table S5. NormFinder ranking of 14 candidate reference genes. SV: stability value. The stability of genes was ranked according to the SV.
Table S6. BestKeeper ranking of 14 candidate reference genes. CV, coefficient of variation; SD, standard deviation. The stability of genes was ranked according to CV and SD.
Table S7. Comprehensive stability ranking of 14 candidate reference genes based on the results of the three software programs. The comprehensive ranking of each gene was calculated by the geometric mean of the rankings in geNorm, NormFinder, and BestKeeper.
Data Sheet 1. Sequences of unigenes in the transcriptome of L. aurea. Specific primers for qRT-PCR were designed based on these sequences in Text S1. Amplification of PCR products were verified by sequencing.
References
Andersen, C. L., Jensen, J. L., and Ørntoft, T. F. (2004). Normalization of real-time quantitative reverse transcription-PCR data: a model-based variance estimation approach to identify genes suited for normalization, applied to bladder and colon cancer data sets. Cancer Res. 64, 5245–5250. doi: 10.1158/0008-5472.CAN-04-0496
Bastida, J., Berkov, S., Torras, L., Pigni, N. B., de Andrade, J. P., Martinez, V., et al. (2011). “Chemical and biological aspects of Amaryllidaceae alkaloids,” in Recent Advances in Pharmaceutical Sciences, ed D. Muñoz-Torrero (Trivandrum: Transworld Research Network), 65–100.
Bores, G. M., Huger, F. P., Petko, W., Mutlib, A. E., Camacho, F., Rush, D. K., et al. (1996). Pharmacological evaluation of novel Alzheimer's disease therapeutics: acetylcholinesterase inhibitors related to galanthamine. J. Pharmacol. Exp. Ther. 277, 728–738.
Burton, R. A., Shirley, N. J., King, B. J., Harvey, A. J., and Fincher, G. B. (2004). The CesA gene family of barley. Quantitative analysis of transcripts reveals two groups of co-expressed genes. Plant Physiol. 134, 224–236. doi: 10.1104/pp.103.032904
Bustin, S. (2002). Quantification of mRNA using real-time reverse transcription PCR (RT-PCR): trends and problems. J. Mol. Endocrinol. 29, 23–39. doi: 10.1677/jme.0.0290023
Bustin, S. A., Benes, V., Garson, J. A., Hellemans, J., Huggett, J., Kubista, M., et al. (2009). The MIQE guidelines: minimum information for publication of quantitative real-time PCR experiments. Clin. Chem. 55, 611–622. doi: 10.1373/clinchem.2008.112797
Caldana, C., Scheible, W. R., Mueller-Roeber, B., and Ruzicic, S. (2007). A quantitative RT-PCR platform for high-throughput expression profiling of 2500 rice transcription factors. Plant Methods 3:7. doi: 10.1186/1746-4811-3-7
Chandna, R., Augustine, R., and Bisht, N. C. (2012). Evaluation of candidate reference genes for gene expression normalization in Brassica juncea using real time quantitative RT-PCR. PLoS ONE 7:e36918. doi: 10.1371/journal.pone.0036918
Chang, E., Shi, S., Liu, J., Cheng, T., Xue, L., Yang, X., et al. (2012). Selection of reference genes for quantitative gene expression studies in Platycladus orientalis (Cupressaceae) using real-time PCR. PLoS ONE 7:e33278. doi: 10.1371/journal.pone.0033278
Clancy, M. A., Rosli, H. G., Chamala, S., Barbazuk, W. B., Civello, P. M., and Folta, K. M. (2013). Validation of reference transcripts in strawberry (Fragaria spp.). Mol. Genet. Genomics 288, 671–681. doi: 10.1007/s00438-013-0780-6
Colque, R., Viladomat, F., Bastida, J., and Codina, C. (2004). Improved production of galanthamine and related alkaloids by methyl jasmonate in Narcissus confuses shoot-clumps. Planta Med. 70, 1180–1188. doi: 10.1055/s-2004-835849
Cruz, F., Kalaoun, S., Nobile, P., Colombo, C., Almeida, J., Barros, L. M. G., et al. (2009). Evaluation of coffee reference genes for relative expression studies by quantitative real-time RT-PCR. Mol. Breed. 23, 607–616. doi: 10.1007/s11032-009-9259-x
Cui, S. J., He, Q. L., Chen, Y., and Huang, M. R. (2011). Evaluation of suitable reference genes for gene expression studies in Lycoris longituba. J. Genet. 90, 503–506. doi: 10.1007/s12041-011-0113-7
Czechowski, T., Stitt, M., Altmann, T., Udvardi, M. K., and Scheible, W. R. (2005). Genome-wide identification and testing of superior reference genes for transcript normalization in Arabidopsis. Plant Physiol. 139, 5–17. doi: 10.1104/pp.105.063743
de Carvalho, K., Bespalhok Filho, J. C., dos Santos, T. B., de Souza, S. G., Vieira, L. G., Pereira, L. F., et al. (2013). Nitrogen starvation, salt and heat stress in coffee (Coffea arabica L.): identification and validation of new genes for qPCR normalization. Mol. Biotechnol. 53, 315–325. doi: 10.1007/s12033-012-9529-4
De Geyter, N., Gholami, A., Goormachtig, S., and Goossens, A. (2012). Transcriptional machineries in jasmonate-elicited plant secondary metabolism. Trends Plant Sci. 17, 349–359. doi: 10.1016/j.tplants.2012.03.001
de Jonge, H. J., Fehrmann, R. S., de Bont, E. S., Hofstra, R. M., Gerbens, F., Kamps, W. A., et al. (2007). Evidence based selection of housekeeping genes. PLoS ONE 2:e898. doi: 10.1371/journal.pone.0000898
Delporte, M., Legrand, G., Hilbert, J. L., and Gagneul, D. (2015). Selection and validation of reference genes for quantitative real-time PCR analysis of gene expression in Cichorium intybus. Front. Plant Sci. 6:651. doi: 10.3389/fpls.2015.00651
Demidenko, N. V., Logacheva, M. D., and Penin, A. A. (2011). Selection and validation of reference genes for quantitative real-time PCR in buckwheat (Fagopyrum esculentum) based on transcriptome sequence data. PLoS ONE 6:e19434. doi: 10.1371/journal.pone.0019434
Dheda, K., Huggett, J. F., Chang, J. S., Kim, L. U., Bustin, S. A., Rook, J. A., et al. (2005). The implications of using an inappropriate reference gene for real-time reverse transcription PCR data normalization. Anal. Biochem. 344, 141–143. doi: 10.1016/j.ab.2005.05.022
Die, J. V., Román, B., Nadal, S., and González-Verdejo, C. I. (2010). Evaluation of candidate reference genes for expression studies in Pisum sativum under different experimental conditions. Planta 232, 145–153. doi: 10.1007/s00425-010-1158-1
Die, J. V., and Rowland, L. J. (2013). Superior cross-species reference genes: a blueberry case study. PLoS ONE 8:e73354. doi: 10.1371/journal.pone.0073354
Eichhorn, J., Takada, T., Kita, Y., and Zenk, M. H. (1998). Biosynthesis of the Amaryllidaceae alkaloid galanthamine. Phytochemistry 49, 1037–1047. doi: 10.1016/S0031-9422(97)01024-8
Expósito-Rodríguez, M., Borges, A. A., Borges-Pérez, A., and Pérez, J. A. (2008). Selection of internal control genes for quantitative real-time RT-PCR studies during tomato development process. BMC Plant Biol. 8:131. doi: 10.1186/1471-2229-8-131
Fan, C. J., Ma, J. M., Guo, Q. R., Li, X. T., Wang, H., and Lu, M. Z. (2013). Selection of reference genes for quantitative real-time PCR in bamboo (Phyllostachys edulis). PLoS ONE 8:e56573. doi: 10.1371/journal.pone.0056573
Gimeno, J., Eattock, N., Van Deynze, A., and Blumwald, E. (2014). Selection and validation of reference genes for gene expression analysis in switchgrass (Panicum virgatum) using quantitative real-time RT-PCR. PLoS ONE 9:e91474. doi: 10.1371/journal.pone.0091474
Gutierrez, L., Mauriat, M., Guénin, S., Pelloux, J., Lefebvre, J. F., Louvet, R., et al. (2008a). The lack of a systematic validation of reference genes: a serious pitfall undervalued in reverse transcription-polymerase chain reaction (RT-PCR) analysis in plants. Plant Biotechnol. J. 6, 609–618. doi: 10.1111/j.1467-7652.2008.00346.x
Gutierrez, L., Mauriat, M., Pelloux, J., Bellini, C., and Van Wuytswinkel, O. (2008b). Towards a systematic validation of references in real-time RT-PCR. Plant Cell 20, 1734–1735. doi: 10.1105/tpc.108.059774
Han, B., Yang, Z., Samma, M. K., Wang, R., and Shen, W. (2013). Systematic validation of candidate reference genes for qRT-PCR normalization under iron deficiency in Arabidopsis. Biometal 26, 403–413. doi: 10.1007/s10534-013-9623-5
Hong, S. M., Bahn, S. C., Lyu, A., Jung, H. S., and Ahn, J. H. (2010). Identification and testing of superior reference genes for a starting pool of transcript normalization in Arabidopsis. Plant Cell Physiol. 51, 1694–1706. doi: 10.1093/pcp/pcq128
Hong, S. Y., Seo, P. J., Yang, M. S., Xiang, F., and Park, C. M. (2008). Exploring valid reference genes for gene expression studies in Brachypodium distachyon by real-time PCR. BMC Plant Biol. 8:112. doi: 10.1186/1471-2229-8-112
Hsu, P. S., Kurita, S., Yu, Z. Z., and Lin, J. Z. (1994). Synopsis of the genus Lycoris (Amaryllidaceae). SIDA 16, 301–331.
Hu, R., Fan, C., Li, H., Zhang, Q., and Fu, Y. F. (2009). Evaluation of putative reference genes for gene expression normalization in soybean by quantitative real-time RT-PCR. BMC Mol. Biol. 10:93. doi: 10.1186/1471-2199-10-93
Huggett, J., Dheda, K., Bustin, S., and Zumla, A. (2005). Real-time RT-PCR normalisation; strategies and considerations. Genes Immun. 6, 279–284. doi: 10.1038/sj.gene.6364190
Imai, T., Ubi, B. E., Saito, T., and Moriguchi, T. (2014). Evaluation of reference genes for accurate normalization of gene expression for real time-quantitative PCR in Pyrus pyrifolia using different tissue samples and seasonal conditions. PLoS ONE 9:e86492. doi: 10.1371/journal.pone.0086492
Iskandar, H. M., Simpson, R. S., Casu, R. E., Bonnett, G. D., Maclean, D. J., and Manners, J. M. (2004). Comparison of reference genes for quantitative real-time polymerase chain reaction analysis of gene expression in sugarcane. Plant Mol. Biol. Rep. 22, 325–337. doi: 10.1007/BF02772676
Jacob, F., Guertler, R., Naim, S., Nixdorf, S., Fedier, A., Hacker, N. F., et al. (2013). Careful selection of reference genes is required for reliable performance of RT-qPCR in human normal and cancer cell lines. PLoS ONE 8:e59180. doi: 10.1371/journal.pone.0059180
Jain, M., Nijhawan, A., Tyagi, A. K., and Khurana, J. P. (2006). Validation of housekeeping genes as internal control for studying gene expression in rice by quantitative real-time PCR. Biochem. Biophys. Res. Commun. 345, 646–651. doi: 10.1016/j.bbrc.2006.04.140
Ji, Y., Tu, P., Wang, K., Gao, F., Yang, W., Zhu, Y., et al. (2014). Defining reference genes for quantitative real-time PCR analysis of anther development in rice. Acta Biochim Biophys Sin. 46, 305–312. doi: 10.1093/abbs/gmu002
Jian, B., Liu, B., Bi, Y., Hou, W., Wu, C., and Han, T. (2008). Validation of internal control for gene expression study in soybean by quantitative real-time PCR. BMC Mol. Biol. 9:59. doi: 10.1186/1471-2199-9-59
Jiang, T., Gao, Y., and Tong, Z. (2015). Selection of reference genes for quantitative real-time PCR in Lycoris. Acta Hort. Sin. 42, 1129–1138. doi: 10.16420/j.issn.0513-353x.2014-0999
Jiang, Y., Xia, N., Li, X., Shen, W., Liang, L., Wang, C., et al. (2011). Molecular cloning and characterization of a phenylalanine ammonia-lyase gene (LrPAL) from Lycoris radiata. Mol. Biol. Rep. 38, 1935–1940. doi: 10.1007/s11033-010-0314-9
Kim, B. R., Nam, H. Y., Kim, S. U., Kim, S. I., and Chang, Y. J. (2003). Normalization of reverse transcription quantitative-PCR with housekeeping genes in rice. Biotechnol. Lett. 25, 1869–1872. doi: 10.1023/A:1026298032009
Kulcheski, F. R., Marcelino Guimaraes, F. C., Nepomuceno, A. L., Abdelnoor, R. V., and Margis, R. (2010). The use of micro RNAs as reference genes for quantitative polymerase chain reaction in soybean. Anal. Biochem. 406, 185–192. doi: 10.1016/j.ab.2010.07.020
Lamoral-Theys, D., Decaestecker, C., Mathieu, V., Dubois, J., Kornienko, A., Kiss, R., et al. (2010). Lycorine and its derivatives for anticancer drug design. Mini. Rev. Med. Chem. 10, 41–50. doi: 10.2174/138955710791112604
Lee, J. M., Roche, J. R., Donaghy, D. J., Thrush, A., and Sathish, P. (2010). Validation of reference genes for quantitative RT-PCR studies of gene expression in perennial ryegrass (Loliumperenne L.). BMC Mol. Biol. 11:8. doi: 10.1186/1471-2199-11-8
Li, X. S., Yang, H. L., Zhang, D. Y., Zhang, Y. M., and Wood, A. J. (2012). Reference gene selection in the desert plant Eremosparton songoricum. Int. J. Mol. Sci. 13, 6944–6963. doi: 10.3390/ijms13066944
Li, X., Zhang, D., Li, H., Gao, B., Yang, H., Zhang, Y., et al. (2015). Characterization of reference genes for RT-qPCR in the desert moss Syntrichia caninervis in response to abiotic stress and desiccation/rehydration. Front. Plant Sci. 6:38. doi: 10.3389/fpls.2015.00038
Libault, M., Bilgin, S., Radwan, D., Benitez, O., Clough, M., and Stacey, S. (2008). Identification of four soybean reference genes for gene expression nnormalization. Plant Genome 1:44. doi: 10.3835/plantgenome2008.02.0091
Lilienfeld, S. (2002). Galanthamine-a novel cholinergic drug with a unique dual mode of action for the treatment of patients with Alzheimer's disease. CNS Drug Rev. 8, 159–176. doi: 10.1111/j.1527-3458.2002.tb00221.x
Lilly, S. T., Drummond, R. S., Pearson, M. N., and Macdiarmid, R. M. (2011). Identification and validation of reference genes for normalization of transcripts from virus-infected Arabidopsis thaliana. Mol. Plant Microbe Interact. 24, 294–304. doi: 10.1094/MPMI-10-10-0236
Lin, Y., Zhang, C., Lan, H., Gao, S., Liu, H., Liu, J., et al. (2014). Validation of potential reference genes for qPCR in Maize across abiotic stresses, hormone treatments, and tissue types. PLoS ONE 9:e95445. doi: 10.1371/journal.pone.0095445
Livak, K. J., and Schmittgen, T. D. (2001). Analysis of relative gene expression data using real-time quantitative PCR and the 2(-Delta Delta C(T)) method. Methods 25, 402–408. doi: 10.1006/meth.2001.1262
Løvdal, T., and Lillo, C. (2009). Reference gene selection for quantitative real-time PCR normalization in tomato subjected to nitrogen, cold, and light stress. Anal. Biochem. 387, 238–242 doi: 10.1016/j.ab.2009.01.024
Ma, S., Niu, H., Liu, C., Zhang, J., Hou, C., and Wang, D. (2013). Expression stabilities of candidate reference genes for RT-qPCR under different stress conditions in soybean. PLoS ONE 8:e75271. doi: 10.1371/journal.pone.0075271
Marco, L., and do Carmo Carreiras, M. (2006). Galanthamine, a natural product for the treatment of Alzheimer's disease. Recent Pat. CNS Drug Discov. 1, 105–111. doi: 10.2174/157488906775245246
Metzker, M. L. (2010). Sequencing technologies-the next generation. Nat. Rev. Genet. 11, 31–46. doi: 10.1038/nrg2626
Morgante, C. V., Guimarães, P. M., Martins, A. C. Q., Araújo, A. C. G., Leal-Bertioli, S. C. M., Bertioli, D. J., et al. (2011). Reference genes for quantitative reverse transcription-polymerase chain reaction expression studies in wild and cultivated peanut. BMC Res. Notes 4:339. doi: 10.1186/1756-0500-4-339
Mu, H. M., Wang, R., Li, X. D., Jiang, Y. M., Wang, C. Y., Quan, J. P., et al. (2009). Effect of abiotic and biotic elicitors on growth and alkaloid accumulation of Lycoris chinensis seedlings. Z. Naturforsch. 64c, 541–550. doi: 10.1515/znc-2009-7-813
Narsai, R., Castleden, I., and Whelan, J. (2010). Common and distinct organ and stress responsive transcriptomic patterns in Oryza sativa and Arabidopsis thaliana. BMC Plant Biol. 10:262. doi: 10.1186/1471-2229-10-262
Štajner, N., Cregeen, S., and Javornik, B. (2013). Evaluation of reference genes for RT-qPCR expression studies in hop (Humulus lupulus L.) during infection with vascular pathogen verticillium albo-atrum. PLoS ONE 8:e68228. doi: 10.1371/journal.pone.0068228
Nicot, N., Hausman, J. F., Hoffmann, L., and Evers, D. (2005). Housekeeping gene selection for real-time RT-PCR normalization in potato during biotic and abiotic stress. J. Exp. Bot. 56, 2907–2914. doi: 10.1093/jxb/eri285
Niu, X. P., Qi, J. M., Zhang, G. Y., Xu, J. T., Tao, A. F., Fang, P. P., et al. (2015). Selection of reliable reference genes for quantitative real-time PCR gene expression analysis in Jute (Corch oruscapsularis) under stress treatments. Front. Plant Sci. 6:848. doi: 10.3389/fpls.2015.00848
Paolacci, A. R., Tanzarella, O. A., Porceddu, E., and Ciaffi, M. (2009). Identification and validation of reference genes for quantitative RT-PCR normalization in wheat. BMC Mol. Biol. 10:11. doi: 10.1186/1471-2199-10-11
Pfaffl, M. W., Tichopad, A., Prgomet, C., and Neuvians, T. P. (2004). Determination of stable housekeeping genes, differentially regulated target genes and sample integrity: BestKeeper – Excel-based tool using pair-wise correlations. Biotechnol. Lett. 26, 509–515. doi: 10.1023/B:BILE.0000019559.84305.47
Ptak, A. E., Tahchy, A., Wyzgolik, G., Henry, M., and Laurain-Mattar, D. (2010). Effects of ethylene on somatic embryogenesis and galanthamine content in Leucojum aestivum L. cultures. Plant Cell Tissue Organ Cult. 102, 61–67. doi: 10.1007/s11240-010-9706-8
Radonic, A., Thulke, S., Mackay, I. M., Landt, O., Siegert, W., and Nitsche, A. (2004). Guideline to reference gene selection for quantitative real-time PCR. Biochem. Biophys. Res. Commun. 313, 856–862. doi: 10.1016/j.bbrc.2003.11.177
Reid, K. E., Olsson, N., Schlosser, J., Peng, F., and Lund, S. T. (2006). An optimized grapevine RNA isolation procedure and statistical determination of reference genes for real-time RT-PCR during berry development. BMC Plant Biol. 6:27. doi: 10.1186/1471-2229-6-27
Remans, T., Smeets, K., Opdenakker, K., Mathijsen, D., Vangronsveld, J., and Cuypers, A. (2008). Normalisation of real-time RT-PCR gene expression measurements in Arabidopsis thaliana exposed to increased metal concentrations. Planta 227, 1343–1349. doi: 10.1007/s00425-008-0706-4
Resetic, T., Stajner, N., Bandelj, D., Javornik, B., and Jakse, J. (2013). Validation of candidate reference genes in RT-qPCR studies of developing olive fruit and expression analysis of four genes involved in fatty acids metabolism. Mol. Breed. 32, 211–222. doi: 10.1007/s11032-013-9863-7
Ruijter, J., Ramakers, C., Hoogaars, W., Karlen, Y., Bakker, O., Moorman, A. F. M., et al. (2009). Amplification efficiency: linking baseline and bias in the analysis of quantitative PCR data. Nucleic Acids Res. 37, e45. doi: 10.1093/nar/gkp045
Schmittgen, T. D., and Zakrajsek, B. A. (2000). Effect of experimental treatment on housekeeping gene expression: validation by real-time, quantitative RT-PCR. J. Biochem. Biophys. Methods 46, 69–81. doi: 10.1016/S0165-022X(00)00129-9
Shi, S., Qiu, Y., Li, E., Wu, L., and Fu, C. (2006). Phylogenetic relationships and possible hybrid origin of Lycoris species (Amaryllidaceae) revealed by its sequences. Biochem. Genet. 44, 198–208. doi: 10.1007/s10528-006-9023-4
Stone, J. D., and Storchova, H. (2015). The application of RNA-seq to the comprehensive analysis of plant mitochondrial transcriptomes. Mol. Genet. Genomics 290, 1–9. doi: 10.1007/s00438-014-0905-6
Thellin, O., Zorzi, W., Lakaye, B., De Borman, B., Coumans, B., Hennen, G., et al. (1999). Housekeeping genes as internal standards use and limits. J. Biotechnol. 75, 291–295. doi: 10.1016/S0168-1656(99)00163-7
Tian, C., Jiang, Q., Wang, F., Wang, G. L., Xu, Z. S., and Xiong, A. S. (2015). Selection of suitable reference genes for qPCR normalization under abiotic stresses and hormone stimuli in carrot leaves. PLoS ONE 10:e0117569. doi: 10.1371/journal.pone.0117569
Tong, Z., Gao, Z., Wang, F., Zhou, J., and Zhang, Z. (2009). Selection of reliable reference genes for gene expression studies in peach using real-time PCR. BMC Mol. Biol. 10:71. doi: 10.1186/1471-2199-10-71
Unver, N. (2007). New skeletons and new concepts in Amaryllidaceae alkaloids. Phytochem. Rev. 6, 125–135. doi: 10.1007/s11101-006-9019-z
Vandesompele, J., De Preter, K., Pattyn, F., Poppe, B., Van Roy, N., De Paepe, A., et al. (2002). Accurate normalization of real-time quantitative RT-PCR data by geometric averaging of multiple internal control genes. Genome Biol. 3, research0034. doi: 10.1186/gb-2002-3-7-research0034
Van Guilder, H. D., Vrana, K. E., and Freeman, W. M. (2008). Twenty-five years of quantitative PCR for gene expression analysis. Biotechniques 44, 619–626. doi: 10.2144/000112776
Wan, H., Zhao, Z., Qian, C., Sui, Y., Malik, A. A., and Chen, J. (2010). Selection of appropriate reference genes for gene expression studies by quantitative real- time polymerase chain reaction in cucumber. Anal. Biochem. 399, 257–261. doi: 10.1016/j.ab.2009.12.008
Wang, R., Xu, S., Jiang, Y. M., Jiang, J. W., Li, X. D., Liang, L. J., et al. (2013). De novo sequence assembly and characterization of Lycoris aurea transcriptome using GS FLX Titanium platform of 454 Pyrosequencing. PLoS ONE 8:e60449. doi: 10.1371/journal.pone.0060449
Wang, Z., Gerstein, M., and Snyder, M. (2009). RNA-Seq: are volutionary tool for transcriptomics. Nat. Rev. Genet. 10, 57–63. doi: 10.1038/nrg2484
Wasternack, C. (2007). Jasmonates: an update on biosynthesis, signal transduction and action in plant stress response, growth and development. Ann. Bot. 100, 681–697. doi: 10.1093/aob/mcm079
Wasternack, C., and Hause, B. (2013). Jasmonates: biosynthesis, perception, signal transduction and action in plant stress response, growth and development. An update to the 2007 review in Annals of Botany. Ann. Bot. 111, 1021–1058. doi: 10.1093/aob/mct067
Xiao, X. L., Ma, J. B., Wang, J. R., Wu, X. M., Li, P. B., and Yao, Y. N. (2015). Validation of suitable reference genes for gene expression analysis in the halophyte Salicorniaeuropaea by real-time quantitative PCR. Front. Plant Sci. 5:788. doi: 10.3389/fpls.2014.00788
Xie, F. L., Xiao, P., Chen, D. L., Xu, L., and Zhang, B. H. (2012). miRDeepFinder: a miRNA analysis tool for deep sequencing of plant small RNAs. Plant Mol. Biol. 80, 75–84. doi: 10.1007/s11103-012-9885-2
Xu, S., Jiang, M., Fu, J., Liang, L., Xia, B., and Wang, R. (2015). Physiological and antioxidant parameters in two Lycoris species as influenced by water deficit stress. HortScience 50, 1702–1708.
Xu, Y. Y., Zhu, X. W., Gong, Y. Q., Xu, L., Wang, Y., and Liu, L. W. (2012). Evaluation of reference genes for gene expression studies in radish (Raphanus sativus L.) using quantitative real-time PCR. Biochem. Biophys. Res. Commun. 424, 398–403. doi: 10.1016/j.bbrc.2012.06.119
Yang, Y., Hou, S., Cui, G., Chen, S., Wei, J., and Huang, L. (2010). Characterization of reference genes for quantitative real-time PCR analysis in various tissues of Salvia miltiorrhiza. Mol. Biol. Rep. 37, 507–513. doi: 10.1007/s11033-009-9703-3
Zhu, J., Zhang, L., Li, W., Han, S., Yang, W., and Qi, L. (2013). Reference gene selection for quantitative real-time PCR normalization in Caragana intermedia under different abiotic stress conditions. PLoS ONE 8:e53196. doi: 10.1371/journal.pone.0053196
Keywords: gene quantification, quantitative real-time PCR (qRT-PCR), reference gene, abiotic stress, Lycoris aurea
Citation: Ma R, Xu S, Zhao Y, Xia B and Wang R (2016) Selection and Validation of Appropriate Reference Genes for Quantitative Real-Time PCR Analysis of Gene Expression in Lycoris aurea. Front. Plant Sci. 7:536. doi: 10.3389/fpls.2016.00536
Received: 23 December 2015; Accepted: 05 April 2016;
Published: 25 April 2016.
Edited by:
Juan Francisco Jimenez Bremont, Instituto Potosino de Investigación Científica y Tecnológica, MexicoReviewed by:
Vikas Kumar Singh, International Crops Research Institute for the Semi-Arid Tropics, IndiaYuchen Qi, Memorial Sloan Kettering Cancer Center, USA
Copyright © 2016 Ma, Xu, Zhao, Xia and Wang. This is an open-access article distributed under the terms of the Creative Commons Attribution License (CC BY). The use, distribution or reproduction in other forums is permitted, provided the original author(s) or licensor are credited and that the original publication in this journal is cited, in accordance with accepted academic practice. No use, distribution or reproduction is permitted which does not comply with these terms.
*Correspondence: Ren Wang, jswangren@aliyun.com
†These authors have contributed equally to this work.