 Erbao Liu1
 Yang Liu1
 Guocan Wu1
 Siyuan Zeng1Thu G. Tran Thi1,2
 Lijun Liang1Yinfeng Liang1
 Zhiyao Dong1
 Dong She1
 Hui Wang1Imdad U. Zaid1
 Delin Hong1*
- 1State Key Laboratory of Crop Genetics and Germplasm Enhancement, Nanjing Agricultural University, Nanjing, China
- 2College of Agronomy, Hue University of Agriculture and Forestry, Hue University, Hue, Vietnam
Panicle length (PL) is an important trait for improving panicle architecture and grain yield in rice (Oryza sativa L.). Three populations were used to identify QTLs and candidate genes associated with PL. Four QTLs for PL were detected on chromosomes 4, 6, and 9 through linkage mapping in the recombinant inbred line population derived from a cross between the cultivars Xiushui79 (short panicle) and C-bao (long panicle). Ten SSR markers associated with PL were detected on chromosomes 2, 3, 5, 6, 8, 9, and 10 in the natural population consisting of 540 accessions collected from East and Southeast Asia. A major locus on chromosome 9 with the largest effect was identified via both linkage and association mapping. LONG PANICLE 1 (LP1) locus was delimited to a 90-kb region of the long arm of chromosome 9 through fine mapping using a single segment segregating F2 population. Two single nucleotide polymorphisms (SNPs) leading to amino acid changes were detected in the third and fifth exons of LP1. LP1 encodes a Remorin_C-containing protein of unknown function with homologs in a variety of species. Sequencing analysis of LP1 in two parents and 103 rice accessions indicated that SNP1 is associated with panicle length. The LP1 allele of Xiushui79 leads to reduced panicle length, whereas the allele of C-bao relieves the suppression of panicle length. LP1 and the elite alleles can be used to improve panicle length in rice.
Introduction
Rice (Oryza sativa L.) is an important staple food that feeds approximately 50% of the world's population. At present, rice is grown globally on approximately 160 million hectares annually and the average yield is 4.4 tons per hectare (GRiSP, 2013). Higher productivity is needed to meet the demands of the rapidly increasing population (Yuan, 1997; Khush, 1999). Panicle length is one aspect of panicle architecture and is usually measured as a yield-related trait. Panicle length, together with spikelet number and density, seed setting rate and grain plumpness, determines the grain number per panicle; hence, yield increases in rice. Studies focusing on traits that are components of grain yield and quality, such as grain number, panicle number and grain weight, have revealed a few genes associated with these traits, such as GS3, GS5, GW2, GW5, GW8, Gn1, GL3, and GIF1 (Ashikari et al., 2005; Fan et al., 2006; Song et al., 2007; Wang et al., 2008, 2012; Weng et al., 2008; Li Y. et al., 2011; Zhang et al., 2012). Panicle length QTL were commonly co-identified with heading date, and some genes were cloned in recent years, such as Hd1, EHD4, Hd6, Ghd7, DTH7, and DTH8 (Yano et al., 2000; Takahashi et al., 2001; Xue et al., 2008; Wei et al., 2010; Gao et al., 2013, 2014). However, panicle length has received relatively less attention. There are two subspecies, i.e., indica and japonica, in Oryza sativa L. In general, subspecies indica has longer panicle length and looser spikelet density than those of japonica. Even within subspecies there is considerable genetic variation of panicle length (range, 12–40 cm; genetic coefficient of variation, 10%; Jambhulkar and Bose, 2014; Zuo et al., 2014). Panicle length is inherited in a quantitative manner and controlled by both major and minor QTLs (Liu et al., 2011). To date, at least 253 QTLs for panicle length have been detected distributed on 12 chromosomes (Xiao et al., 1998; Hittalmani et al., 2002, 2003; Xing et al., 2002; Kobayashi et al., 2003; Thomson et al., 2003; Ashikari et al., 2005; Lee et al., 2005; Mei et al., 2005; Cho et al., 2007; Liu et al., 2011; Marathi et al., 2012; Yao et al., 2015; Zhang et al., 2015). However, only a few genes have been cloned and applied in rice plant architecture breeding. The gene short panicle1 (SP1) encodes a putative polypeptide transporter protein (PTR) family regulating the activity of the spike meristem, resulting in the short-panicle phenotype. SP1 contains a conserved PTR2 domain consisting of 12 transmembrane domains (Li et al., 2009). The dense and erect panicle1 (DEP1) locus is a gain-of-function mutation that results in the truncation of a phosphatidylethanolamine-binding protein-like domain protein. This allele enhances meristematic activity, resulting in a reduced length of the inflorescence internode, an increased number of grains per panicle and a consequent increase in grain yield (Huang et al., 2009). The gene DEP2 encodes a plant-specific protein without any known functional domain is essential for determining panicle outgrowth and elongation (Li et al., 2010). And the gene DEP3, predicted to encode a patatin-like phospholipase A2, plays an important role in high grain yield (Qiao et al., 2011). LARGER PANICLE (LP) encodes a Kelch repeat-containing F-box protein and leads to an increase in spikelets and branches. LP expression is enriched in the branch primordial region, and LP may be involved in modulating cytokinin levels in plant tissues (Li M. et al., 2011).
Linkage mapping using cross-populations is the traditional method for QTL identification due to its high power and simple genetic background (Huang and Han, 2014). However, linkage mapping exploits only those loci with the strongest influence, hindering the detection of phenotypes occurring at lower frequencies in samples of natural populations. As a new approach to the use of natural populations for QTL analysis, genome-wide association (GWA) mapping has been widely applied for the mining of useful alleles in many species (Breseghello and Sorrells, 2006; Agrama et al., 2007; Kump et al., 2011; Morris et al., 2013; Zhang et al., 2014; Liu et al., 2015) due to its greater power to identify variants with weak effects compared with linkage studies (Risch and Merikangas, 1996). However, few studies have verified the loci and candidate genes underlying panicle length via association and linkage mapping. In this study, three populations, including a population of 254 recombinant inbred lines (RILs) derived from a cross between the cultivars Xiushui 79 (short panicle) and C-bao (long panicle), 540 rice accessions covering a wide geographical expanse (from 12.3°N to 47.4°N) and a single segment segregating F2 population, were used to identify QTLs and candidate genes associated with panicle length.
Materials and Methods
Plant Materials, Cultivation, and Measurements
Three mapping populations were used in the present study. A population consisting of 540 rice accessions from the geographical regions of East and Southeast Asia were used for association mapping, including 121 accessions from Vietnam (17°N–23°N), 400 from China and 11 from Japan (20°N–54°N) (Supplementary Table 1). A population consisting of 254 RILs derived from a cross between two japonica rice cultivars, Xiushui79 (female parent, panicle length 15.53 cm) and C-bao (male parent, panicle length 26.63 cm) were used for primary QTL analysis. A single segment segregating F2 population derived by crossing a single segment substitution line with Xiushui79 was used to confirm and finely map the major QTL controlling panicle length. All plants were grown in a paddy field at Jiangpu Experimental Station, Nanjing Agricultural University, Nanjing, China (31°56′N, 119°4′E). The seeds of natural and RILs populations were sown in the seedling nursery on 15 May in 2011 and 2012, and the seedlings were transplanted on 15 June in 2011 and 2012, planting one seedling per hill, with three replicates. The seeds of single segment segregating F2 population were sown in the seedling nursery on 12 May in 2014, and the seedlings were transplanted on 15 June in 2014. Each plot consisted of five rows with eight hills per row, and the hill spacing was 17 × 20 cm. Panicle length was measured as the length from the panicle neck to the panicle tip of the main panicle. The average of three replicates was subjected to association mapping and linkage analysis.
Genotype Analysis
DNA was extracted from fresh leaves of individuals of the 540 rice accessions, 254 RILs and single segment segregating F2 population using the method reported by Monna et al. (2002). A total of 262 SSR markers selected from the rice maps (Temnykh et al., 2000; McCouch et al., 2002) were used to genotype 540 rice accessions. PCR amplification was conducted in a 10-μL reaction mixture containing 1 μL of 20 ng μL−1 template DNA, 0.6 μL of 25 mmol L−1 MgCl2, 0.7 μL of 2 pmol μL−1 forward primers, 0.7 μL of 2 pmol μL−1 reverse primers, 0.2 μL of 2.5 mmol L−1 dNTP, 1 μL of 10 × PCR buffer, 0.1 μL of 5 U μL−1 rTaq DNA polymerase (TaKaRa, Japan) and 5.7 μL of ddH2O. DNA amplification was performed using a PTC-100 Peltier Thermal Cycler (MJ Research Inc., USA). The PCR program included denaturation at 95°C for 5 min, followed by 35 cycles of 95°C for 30 s, 55°C for 30 s, and 72°C for 30 s, and a final extension step at 72°C for 5 min. The PCR products were separated through electrophoresis on 8% non-denaturing polyacrylamide gels at a voltage of 180 V for approximately 100 min and then visualized via silver staining (Creste et al., 2001).
Population Structure and Linkage Disequilibrium
The population structure of 540 rice accessions was analyzed with STRUCTURE 2.2 (Falush et al., 2003). Twenty independent runs were performed for each k (from 2 to 10) using a burn-in length of 50,000, a run length of 100,000 and a model for the admixture and independent allele frequency. The mean log-likelihood value over 20 runs at each K value was used to identify the true number of populations (K), which was determined when the mean log-likelihood value reached the highest value for the model parameter K. The genetic distance was calculated from the 262 molecular markers using Nei's distance (Nei et al., 1983), and phylogenetic reconstruction was based on the Neighbour-joining method implemented in PowerMarker version 3.25 (Liu and Muse, 2005). A principal component analysis (PCA) was performed using the pcaMethods package of R.2.11.1 (Stacklies et al., 2007) to examine the population structure.The decay of LD (with distance in cM) between the SSR loci within the same chromosome was evaluated using 1000 permutations and calculated using TASSEL 2.1 software (Bradbury et al., 2007).
Association Mapping
The general linear model (GLM) and mixed linear model (MLM) in TASSEL 2.1 software were used for association mapping. The population structure (Q) was included as a covariate in the GLM to test for marker-trait associations and the matrices Q and K were used as covariates in the MLM analysis (Dang et al., 2014). The K matrix (kinship matrix) was obtained from the results of the relatedness analysis using SPAGeDi (Hardy and Vekemans, 2002). The allelic effects were estimated compared with the “null allele” (non-amplified alleles) for each locus (Flavio et al., 2006). The formula that was used to calculate the average positive (negative) allelic effects (AAE) within a locus was:
where ac represents the phenotypic value of the cth allele with a positive (negative) effect, and nc represents the number of alleles with positive (negative) effects within the locus.
Genetic Linkage Map and QTL Analysis
A total of 254 RILs derived from a cross between the cultivars Xiushui 79 and C-bao were used to conduct QTL analysis of panicle length using 91 SSR markers. The linkage map was constructed with MapMaker3.0/EXP version 3.0 (Lander et al., 1987). QTL analysis was performed using the inclusive composite interval mapping method in IciMapping, version 3.3 (http://www.isbreeding.net/), based on a stepwise linear regression model (Wang, 2009).
Map-Based Cloning of LP1
Primers were designed around LP1 on chromosome 9 of rice using indels identified between the indica cultivar 93-11 and the japonica cultivar Nipponbare using the software Primer Premier 5.0. Twelve of the 82 selected SSR primers in the preliminary mapping region showed polymorphisms between Xiushui79 and C-bao, which were available from the Rice Annotation Project Database (RAP-DB, http://rapdb.dna.affrc.go.jp/). These primers were used to genotype and identify the recombinants of the single-locus segregating F2 population, which included a total of 8650 individuals (Supplementary Table 2). The number of recombinants was identified based on a combination of genotype and phenotype data.
Expression Analysis of Candidate Genes
Total RNA was extracted from various tissues of Xiushui79 and NIL-LP1 plants using the Ultrapure RNA Kit (CoWin Biotech Co., China). Genomic DNA contamination was removed by treatment with RNase-free DNase I. First-strand cDNA was synthesized using 6 μg of RNA and 4 μg of reverse transcriptase mix (PrimeScript RT Master Mix Perfect Real Time; TaKaRa Bio, Inc.) in a volume of 20 μL. Real-time quantitative RT-PCR was performed in a total volume of 20 μL containing 2 μL of template cDNA, 10 μL of qPCR SYBR Green Master Mix (Vazyme), 0.4 μL of forward and reverse gene-specific primers, 0.4 μL of ROX reference dye1, and 6.8 μL of ddH2O. Gene expression was normalized against 18S rRNA as an internal control. The amplification reaction was performed in a 96-well thermocycler (Roche Applied Science LightCycler 480) using the AceQ qPCR Kit (Vazyme). The cycling program consisted of 5 min at 95°C, followed by 40 cycles of amplification (95°C for 10 s and 60°C for 30 s). The primers are listed in Supplementary Table 2. The relative gene expression of the target gene was calculated using the following equation:
where ΔCt = Cttargetgene−Ct18SrRNA (Livak and Schmittgen, 2001).
Sequencing Analysis of LP1
Gene-specific PCR primers were designed to amplify the full-length DNA sequence of LP1 from Xiushui79 and NIL-LP1 (Supplementary Table 2). The PCR product was gel purified and sequenced by GenScript Corporation Ltd., Nanjing, China. Multiple sequence alignments were performed using DNAMAN.
Phylogenetic Analysis of LP1
The amino acid sequences of LP1 homologs were obtained from NCBI (http://www.ncbi.nlm.nih.gov/). Then, the protein sequences were aligned using CLUSTAL W in MEGA5.0, and the result was used to construct a bootstrap N-J phylogenetic tree. A total of 1000 replicates were conducted to determine the statistical support for each node.
Sequence Polymorphisms of LP1 in Rice Accessions
A total of 103 rice accessions showing abundant diversity in panicle length were selected to sequence a 5.4-kb genomic DNA fragment of LP1. Association analysis of the SNPs and indel markers in the 5.4-kb region of the 103 accessions with panicle length was conducted.
Results
Phenotypic Variation of Panicle Length in Natural and Ril Populations
Panicle length differed significantly among the 540 accessions in both 2011 and 2012, with CVs of 19.45 and 19.56%, respectively (Supplementary Table 3). A high broad-sense heritability value was observed in both years. We selected ten varieties to represent the diversity of panicle length among the 540 rice accessions, including the shortest-panicle accession, Longjing25 (11.91 cm), and the longest-panicle accession, Haonuopie (39.98 cm) (Figure 1A). The frequency distribution of panicle length in the 540 accessions recorded in 2011 and 2012 is presented in Figure 1B. The means of panicle length over 254 RILs were 21.1 and 20.9 cm in 2011 and 2012, with CVs of 15.25% and 15.57%, respectively. RIL242 had the smallest panicle length (14.0 cm in 2011 and 14.9 cm in 2012), and RIL31 had the largest panicle length (29.0 cm in 2011 and 27.1 cm in 2012).
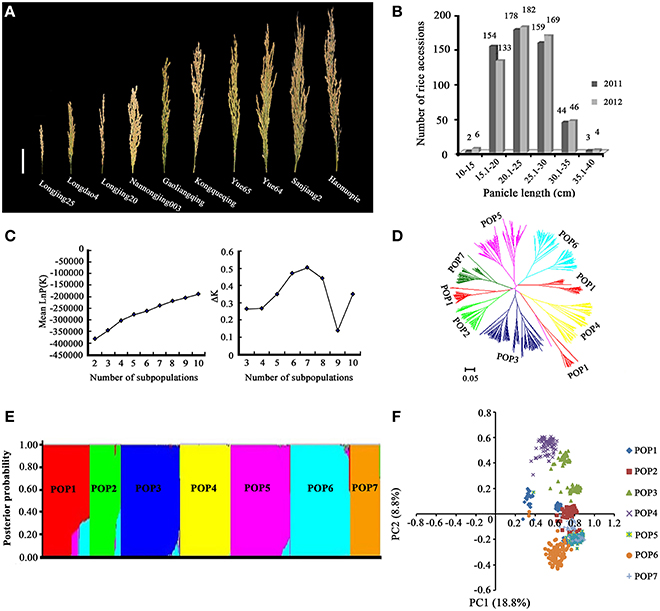
Figure 1. Population structure analysis of 540 rice accessions. (A) Panicle length of 10 rice accessions selected from 540 accessions to represent the diversity of panicle length in the population. Bar = 5 cm. (B) Frequency distribution of the panicle length of the 540 accessions in 2011 and 2012. (C) Changes in mean LnP(K) and ΔK. (D) Neighbor-joining tree for the 540 accessions generated using Nei's genetic distance. (E) Posterior probability of the 540 accessions belonged to seven subpopulations. (F) Principal components analysis (PCoA) for 540 accessions and reference cultivars genotyped with 262 molecular markers.
GWA Mapping and Linkage Analysis for Panicle Length
STRUCTURE analysis using 262 simple sequence repeat (SSR) markers revealed that the log-likelihood increased as the model parameter K increased; thus, the statistic ΔK was used to determine a suitable value for K. The ΔK value was much higher for the model parameter K = 7 than for other values of K (Figure 1C), indicating that the population used in this study was a mixed population consisting of seven subpopulations (Figure 1E). A neighbor-joining tree among the 540 rice accessions was constructed based on Nei's (1983) genetic distance (Nei et al., 1983) (Figure 1D), and the results were consistent with the results of the structure analysis. The results of the PCA were essentially consistent with those from STRUCTURE. The two major PCs from the PCA explained 27.6% (18.8 and 8.8%) of the total variance (Figure 1F).
Regression analysis between the D′ value and the genetic distance of syntenic marker pairs revealed that the genomes of the seven subpopulations fit the equationy = bln x + c (Supplementary Figure 1). The minimum distances of LD decay were 60.2, 13.0, 85.4, 70.8, 29.8, 72.9, and 61.8 cM for the seven subpopulations.
Total fifteen SSR markers associated with panicle length were detected by both GLM and MLM analysis. GLM analysis of marker-trait associations revealed 10 SSR markers associated with panicle length (p < 0.05), located on chromosomes 2, 3, 5, 6, 8, 9, and 10, in both years. PVE ranged from 10.32% to 32.63%. RM5475 on Chr3 explained the maximum percentage of phenotypic variation: 28.38% in 2011 and 32.63% in 2012 (Table 1). RM3600 on Chr9, residing on site of 1.46 Mb, exhibited the second highest PVE values, of 22.19% in 2011 and 22.17% in 2012 (Table 1). MLM analysis revealed seven SSR markers associated with panicle length (p < 0.05), located on chromosomes 2, 6, 7, 9, and 11, in both years. PVE ranged from 2.09 to 25.82%. RM295 on Chr7 exhibited the highest PVE: 24.52% in 2011 and 25.82% in 2012. RM3600 on Chr9 explained 16.97% PVE in 2011 and 19.69% PVE in 2012. Two SSR markers, RM3600 on Chr9 and RM3688 on Chr2, were both detected by GLM and MLM methods (Table 1). In this study, the alleles with positive effects were considered elite alleles for panicle length. The ten best elite alleles and their typical carrier materials are described in Supplementary Table 4. The allele RM3600-130 bp exhibited the largest phenotypic effect (8.69 cm) on panicle length, and the typical carrier accession was Yue 33 (Supplementary Table 4).
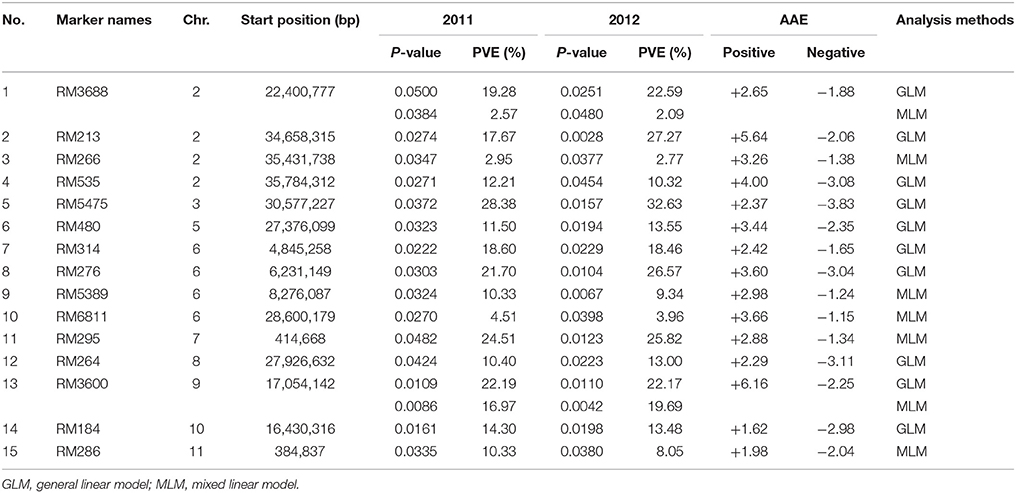
Table 1. Marker-trait associations with P-values of less than 0.05 by GLM and MLM analysis, the proportion of phenotypic variance explained (PVE) and the average positive (negative) allele effects (AAE) in 2011 and 2012.
A total of four additive QTLs were detected for panicle length on chromosomes 4, 6, and 9 in the RILs, including SSR marker RM551 (0 cM) on Chr4 and regions between RM3288 and RM349 (7.0 cM) on Chr4, between RM5314 and RM454 (0.9 cM) on Chr6, and between RM5652 and RM410 (7.0 cM) on Chr9 (Table 2). Each QTL explained 1.2–34.9% of the observed phenotypic variation (Table 2), with LP1 explaining 34.9% of the phenotypic variation, representing the highest value among the four QTLs.
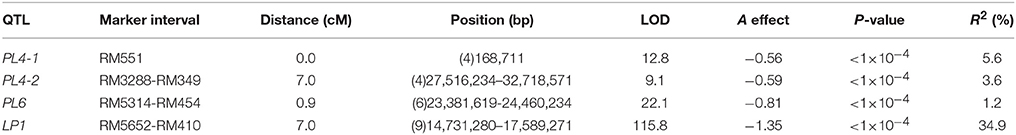
Table 2. Estimated position, flanking markers, additive effects and percentage of phenotypic variation explained (R2) for the QTLs for panicle length in RILs population.
GWA mapping revealed that the SSR marker RM3600 was associated with PL and was located in the region between RM5652 and RM410 of the QTL LP1 detected through linkage analysis in the RILs (Tables 1, 2). The locus explained more than 20% of the variation of panicle length in both the linkage and GWA mapping analyses, indicating that LP1 is a major QTL controlling panicle length in rice.
Phenotypic Performance of Panicle Length in a Fine-Mapping Population
A NIL plant containing C-bao allele at the LP1 in genetic background of Xiushui79 isolated from BC4F2 generation (Figures 2A,B,D) was employed to develop a single segment segregating F2 population to confirm and finely map the major QTL LP1. The panicle length of NIL-LP1 homozygous plant was significantly longer than that of Xiushui79 (i.e., 21.90 ±2.70 cm vs. 15.83 ± 1.90 cm) in 2014, which was consistent with the measurements obtained in 2013 (Table 3, Figure 2C). By contrast, the F1progeny of NIL-LP1/Xiushui79 exhibited a panicle length that was intermediate to those of the two parents (19.26 ± 1.21 cm) in 2014, indicating a semi-dominant pattern of expression of the allele for long panicle length. Among the 1980 plants randomly selected from the single-segment segregating F2population, the phenotypic separation ratio was fitted to 1:2:1 [460 Xiushui79 homozygote type: 1017 heterozygote type: 503 NIL-LP1 homozygote type, = 3.22 < = 5.99], suggesting that panicle length is controlled by a single-gene locus (Supplementary Figure 2B). The other agronomic traits of NIL-LP1 were evaluated under field conditions. Compared with Xiushui79, NIL-LP1 exhibited an increase in yield of 13.73% resulting from increases of 41.02% in panicle length, 10.90% in the number of filled grains per panicle, 2.69% in grain width, and 1.05% in the thousand filled-grain weight (Table 3). No significant differences were observed between Xiushui79 and NIL-LP1 regarding days to heading, the panicle number per plant, seed setting rates, grain length, and grain thickness (Table 3). Therefore, the increase in grain yield observed in NIL-LP1 was mainly due to the improvement of panicle length.
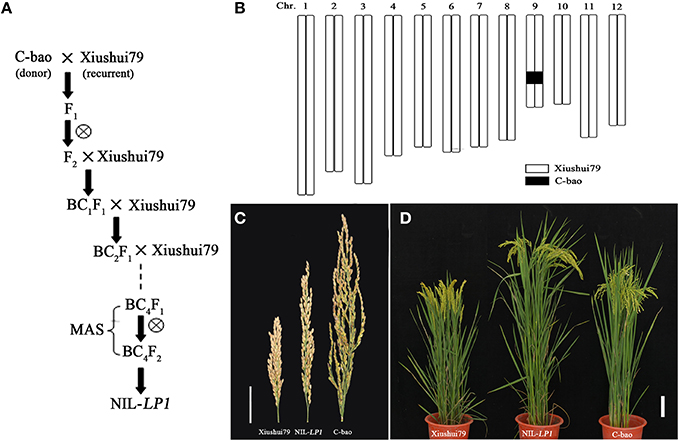
Figure 2. Genotypic and phenotypic performance of the parents. (A) Workflow of the construction of one NIL plant (BC4F2), NIL-LP1. (B) Graphical genotype of NIL-LP1. The black bar indicates the fragment from C-bao, and the remainder was derived from Xiushui79. (C) Panicle morphology of Xiushui79, NIL-LP1 and C-bao. Bar = 5 cm. (D) Xiushui79, NIL-LP1, and C-bao plants. Bar = 10 cm.
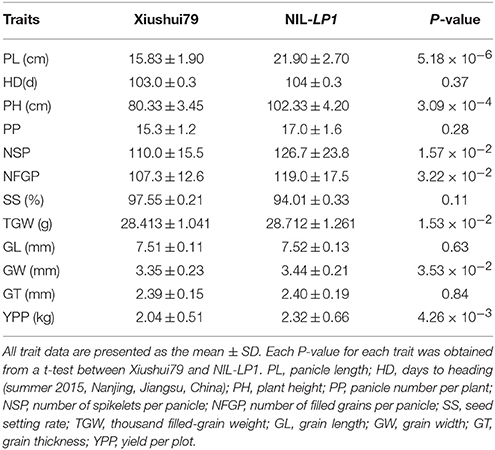
Table 3. Comparison of panicle length and other agronomic traits between Xiushui79 and NIL-LP1.
Map-Based Cloning of LP1
Further QTL analysis was conducted in 176 individuals from the NIL-LP1/Xiushui79 F2 population. The LP1 QTL was delimited to a 1.60-cM region between RM3600 and RM410 with an LOD peak of 101.67 (Supplementary Figure 2A, Figure 3A). A total of 8650 F2 plants were subjected to marker analysis by scanning RM3600 and RM410 (confidence interval markers of LP1 in preliminary mapping). Analysis of RM3600 identified 25 recombination events between the marker and LP1 on one side, whereas an analysis of RM410 detected 156 recombination events between the marker and LP1 on the other side. The insertion/deletion (indel) marker L04 revealed two recombinants, whereas RM24496, RM24489, and RM7289 revealed 84, 24, and 3 recombinants, respectively, on the other side (Figure 3B). Therefore, LP1 was mapped to a 90-kb DNA region between L04 and RM7289 (Figure 3C). This region contains six predicted ORFs according to the Nipponbare genome sequence (annotated by Rice Genome Annotation Project, http://rice.plantbiology.msu.edu/index.shtml), including LOC_Os09g28300, LOC_Os09g28310, LOC_Os09g28340, LOC_Os09g28354, LOC_Os09g28370, and LOC_Os09g28390 (Figure 3C, Supplementary Table 5).
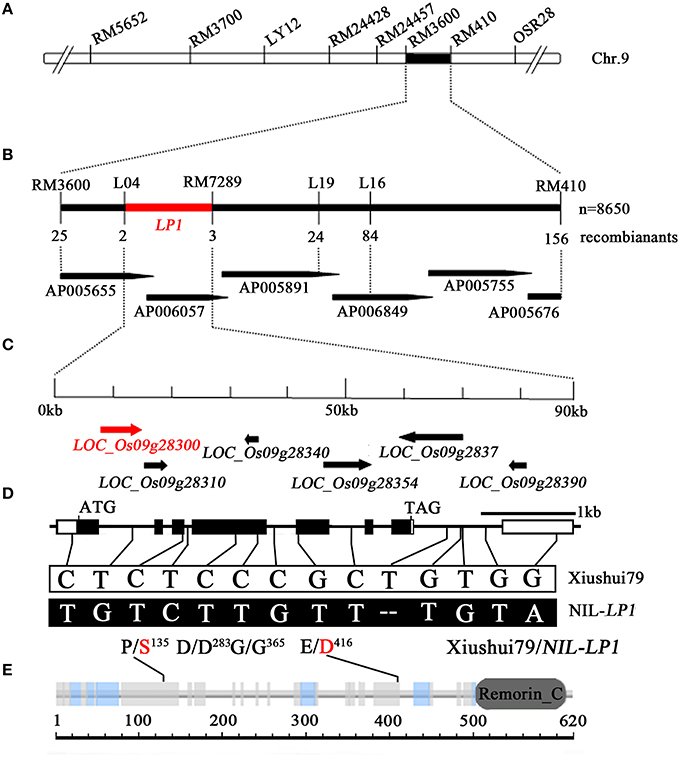
Figure 3. Map-based cloning of LP1. (A) Primary mapping of LP1. LP1 was mapped between the SSR markers RM3600 and RM410. (B) High-resolution mapping of LP1. LP1 was delimited to a 90-kb region between the markers L04 and RM7289 in the BAC clones AP005655 and AP006057, using a total of 8650 plants from the NIL-LP1/Xiushui79 F2 population. (C) Predicted ORFs based on the Nipponbare genome sequence in the Rice Genome Annotation Project database (http://rice.plantbiology.msu.edu/index.shtml). The horizontal arrows indicate the six predicted ORFs. (D) Gene structure of LOC_Os09g28300. The empty boxes refer to the 5′ and 3′ UTRs; the black boxes, to exons; and the lines between the boxes, to introns. The fourteen SNPs in LP1 are indicated by solid lines. (E) The Remorin_C domain predicted in the protein encoded by LOC_Os09g28300. The solid lines indicate the positions of two amino acid transitions.
Real-time quantitative RT-PCR was performed to further analyze the candidate genes by detecting differences in expression between the parents. Only LOC_Os09g28300, LOC_Os09g28340, and LOC_Os09g28370 were expressed. Among these three genes, LOC_Os09g28340 and LOC_Os09g28370 exhibited no differential expression in the roots, stems, flag leaves and young panicles between Xiushui79 and NIL-LP1 (Figures 4B,C,D). The expression of LOC_Os09g28300 was significantly up-regulated (6.08-fold) in the young panicles of Xiushui79 compared with NIL-LP1 (Figures 4A,D).
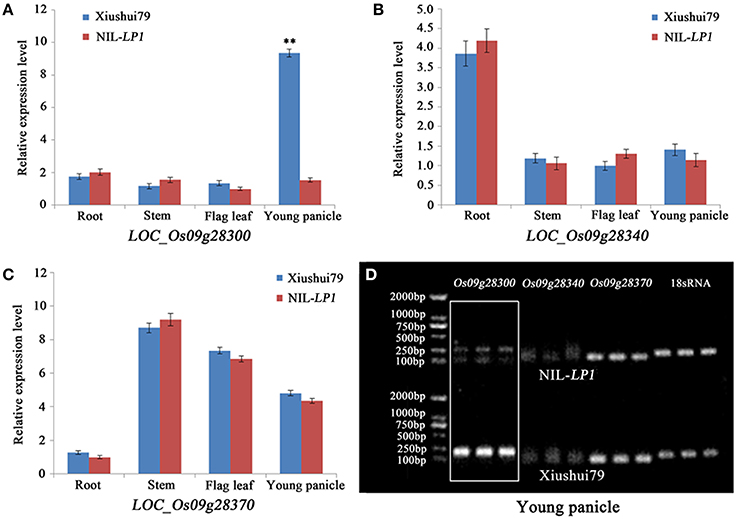
Figure 4. Analysis of the expression of the three expressed candidate genes via real-time quantitative RT-PCR. (A) Relative expression of LOC_Os09g28300 in the roots, stems, flag leaves and young panicles. (B) Relative expression of LOC_Os09g28340 in the roots, stems, flag leaves and young panicles. (C) Relative expression of LOC_Os09g28370 in the roots, stems, flag leaves and young panicles. (D) Real-time quantitative RT-PCR results for the three candidate genes in the young panicles. The 18S rRNA gene was used as a control. ** indicates significance at the α = 0.01 probability level.
Sequence comparison of LOC_Os09g28300 between Xiushui79 and NIL-LP1 revealed 14 SNPs, four of which were located in exons and 10 in introns. SNP1, a single nucleotide transition from C (Xiushui79) to T (NIL-LP1), was identified in the third exon of LOC_Os09g28300, and SNP2, a single nucleotide transversion from G (Xiushui79) to T (NIL-LP1), was found in the fifth exon (Figure 3D). These two polymorphisms cause amino acid residue changes from proline to serine (P/S135) and glutamic acid to aspartic acid (E/D416), respectively (Figure 3D). SNP3 (C → T, in the 4th exon, D/D283) and SNP4 (C → T, in the 4th exon, G/G365) do not cause amino acid substitutions (Figure 3D).
LP1 Encodes a Remorin_C-containing Protein
LOC_Os09g28300 encodes a C-terminal region domain-containing protein (Remorin_C). These proteins are plant-specific plasma membrane-associated proteins of unknown function (Figure 3E). Phylogenetic analysis revealed the presence of Remorin_C in many species, including rice, maize, millet, Bachypodium distachyon, wheat, and Arabidopsis (Figure 5A). Among the identified homologs, the maize homolog exhibits the highest homology with rice, sharing 67.4% amino acid identity with LP1 (Supplementary Figure 3). In addition, LP1 shares 54.2% amino acid identity with Os08g36760, which is encoded on chromosome 8 in rice. The two polymorphisms that lead to amino acid substitutions, P/S135 and E/D416, are located at conserved positions among the homologs (Figure 5B). At the E/D416 locus, only Xiushui79 exhibits glutamic acid, whereas NIL-LP1 and the other species exhibit aspartic acid. These differences in conserved amino acids may affect LP1 function.
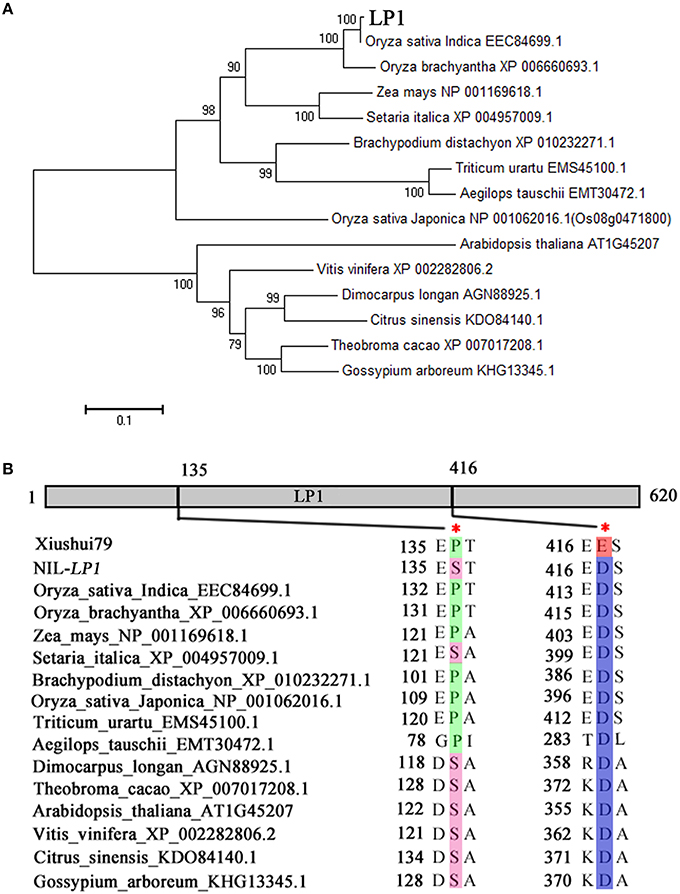
Figure 5. Phylogenetic analysis of the LP1 protein. (A) Phylogenetic tree of the LP1-like proteins in higher plants. The amino acid sequences of 15 LP1 homologs were obtained from NCBI (http://www.ncbi.nlm.nih.gov/) and used to construct a bootstrap N-J phylogenetic tree. A total of 1000 replicates were performed to determine the statistical support for each node. LP1 is denoted in bold. (B) Diagram indicating the two amino acid substitutions in LP1 at positions conserved across LP1-like proteins.
Sequence Polymorphisms of LP1 in Rice Accessions
A total of 103 rice accessions with abundant diversity in panicle length selected from the 540 accessions were used to sequence a 5.4-kb genomic DNA fragment encompassing the mutation sites leading to amino acid substitutions in LP1. A total of 22 SNPs were identified (Supplementary Table 6). Based on the sequencing results, seven accessions carrying the same SNP1 as C-bao were identified, whereas polymorphisms in SNP2, SNP3, and SNP4 were widely distributed in both japonica and indica accessions (Supplementary Table 6). Association analysis of the SNPs and indel markers in the 5.4-kb region with panicle length in the two parents and 103 rice accessions revealed that SNP1 was significantly associated with panicle length at α = 0.01 probability level, whereas other polymorphic sites made no significant contributions to panicle length (Supplementary Table 7). These results indicate that SNP1 identical with Xiushui 79 is a major functional mutation for short panicles.
Discussion
Panicle length is one of the most important traits for rice yields and ideal plant breeding. Previous studies have demonstrated that panicle length is a typical quantitative trait controlled by multiple genes and may be significantly influenced by environmental conditions (Yao et al., 2015). Therefore, the number and effect of QTLs for panicle length detected via linkage mapping may differ among segregating populations, such as F2 populations, RILs or backcrossed inbred lines (Huang and Han, 2014), and these differences may underlie the identification of approximately 253 QTLs for panicle length distributed on 12 chromosomes (Xiao et al., 1998; Hittalmani et al., 2002, 2003; Xing et al., 2002; Kobayashi et al., 2003; Thomson et al., 2003; Ashikari et al., 2005; Lee et al., 2005; Mei et al., 2005; Cho et al., 2007; Liu et al., 2011; Marathi et al., 2012; Yao et al., 2015; Zhang et al., 2015). GWA mapping, a new method that fully exploits ancient recombination events to identify the genetic loci underlying traits, is becoming a powerful tool for detecting natural variation underlying complex traits in crops (Rafalski, 2010). The results obtained using these two types of mapping methods may enable mutual authentication. Consequently, both association mapping using a natural population and linkage mapping using RILs were conducted in this study. The QTL LP1 was detected through both association mapping and linkage analysis and was identified as a major QTL associated with high phenotypic variation for panicle length.
A natural population of 540 rice accessions with abundant phenotypic and genotypic diversity was employed to perform a succession study of panicle length in rice. Population structure and linkage disequilibrium are the basis for association analysis (Pritchard and Rosenberg, 1999; Flint-Garcia et al., 2003). Determining population structure can prevent false-positive results regarding associations between phenotypes and genotypes in association mapping due to the linkage disequilibrium in natural populations (Pritchard and Rosenberg, 1999). The seven subpopulations (POP1–POP7) grouped by structure were essentially consistent with geographic regions. For example, the accessions from Vietnam were basically classified as POP6, and the accessions from northeastern China were mostly classified as POP1. The LD decay distances among the seven subpopulations identified in this study ranged from 13 to 80 cM, which was longer than has been observed in previous studies (Agrama et al., 2007; Jin et al., 2010). These results indicate that the 540 rice accessions underwent artificial hybridization and selection.
By comparing the mapping results of population-based association mapping with those of the linkage mapping of the families, 10 marker-panicle length associations were detected in both 2011 and 2012, whereas only four related QTLs were identified, indicating that GWA mapping has greater power than linkage analyses to identify variants with weak effects. LP1 was detected via the two approaches due to the strong effect of this QTL on panicle length in rice. Therefore, LP1 was selected as a major QTL for further studies, including map-based cloning and candidate gene identification.
NIL development is a useful method for confirming and evaluating the genetic effects of a QTL and provides useful materials for population development during fine mapping of QTLs (Ding et al., 2011). This method has been successfully applied for fine mapping of QTLs in most crop species (Benson et al., 2015; Jang et al., 2015; Wang et al., 2015; Zheng et al., 2015). In the present study, we developed NILs in a backcrossing program using two parents, Xiushui79 (the receipt parent) and C-bao (the donor parent). The NILs exhibited an additive effect similar to that observed in the QTL analysis. Introgression of the LP1 allele into the Xiushui79 background produced the longest panicles among the examined allele combinations, which will be valuable for breeding applications. NIL-LP1 plants will serve as an important parent for the generation of a single-locus segregating F2 population for fine mapping.
In the present study, the chromosome segment containing LP1 was delimited to a 90-kb region for the first time. Within the fine-mapping region, we identified six annotated genes: LOC_Os09g28300, LOC_Os09g28310, LOC_Os09g28340, LOC_Os09g28354, LOC_Os09g28370, and LOC_Os09g28390. Among the six candidate genes, LOC_Os09g28300 was validated as the gene locus controlling panicle length. LP1 is predicted to be a major regulator of panicle length in rice. Furthermore, real-time quantitative RT-PCR analysis revealed significant differences in the expression of LOC_Os09g28300 in young panicles between Xiushui79 and NIL-LP1. The expression of LOC_Os09g28300 was significantly higher in Xiushui79 than in NIL-LP1, indicating that the LP1 allele of Xiushui79 suppresses panicle development in rice. Map-based cloning revealed that LP1 encodes a Remorin_C-containing protein that may be closely related to plant development. The two SNP polymorphisms resulting in amino acid substitutions likely affect the function of the LP1 protein.
Sequence polymorphism analysis of LP1 indicated that SNP1 is a functional mutation leading to short panicles. Most varieties with short panicles exhibit the same amino acid as Xiushui79 at the P/S135 locus, indicating that a change from proline to serine may relieve the suppression of short panicles. Consequently, the C-bao allele at LP1 locus can be used to improve varieties with short panicles. As a major QTL, the NIL-LP1 allele has beneficial effects on panicle length, the number of filled grains per panicle, the thousand filled-grain weight and grain width, and LP1 should be selected in rice breeding.
Compared the QTLs detected in this study for panicle length with other studies, we found that DEP1 (Huang et al., 2009), mapped to the interval between the marker RM3700 and RM7424 on Chr9, was within the region of QTL LP1 detected in this study (Figure 6). However, the results of fine mapping show that the physical distance between LP1 and DEP1 is about 770 kb, which indicated that LP1 was a novel gene within the region of QTL LP1 (Figures 3, 6).Although other genes associated with the panicle phenotype have been cloned, the present study is the first to observe the involvement of LP1. The results of this study provide an opportunity for further functional analysis of LP1 to elucidate the mechanism of rice panicle improvement. LP1 can be used to create new varieties to improve rice yields. Compared the marker-PL associations with previous studies, we found 11 of the 15 SSR markers detected in this study were novel, and the other four SSR markers were located near to the chromosome regions harboring panicle and yield related QTLs or genes which have been reported. Among them, RM5472 on chromosome3 was near to the chromosome regions covering Hd6 of heading-related gene shown in Figure 6 (Takahashi et al., 2001). Marker RM480 on Chr4 associated with panicle length was near to chromosome region harboring the gene GS5 (Li Y. et al., 2011) (Figure 6). The marker RM6811 was near to the region of DEP3 mapped on chromosome 6 (Qiao et al., 2011) (Figure 6). RM264 on chromosome 8 was near to the region containing GW8 (Wang et al., 2012) (Figure 6). Utilization of all of the elite alleles that were detected in this study may improve the panicle length of parents of F1 hybrid rice via pyramiding breeding.
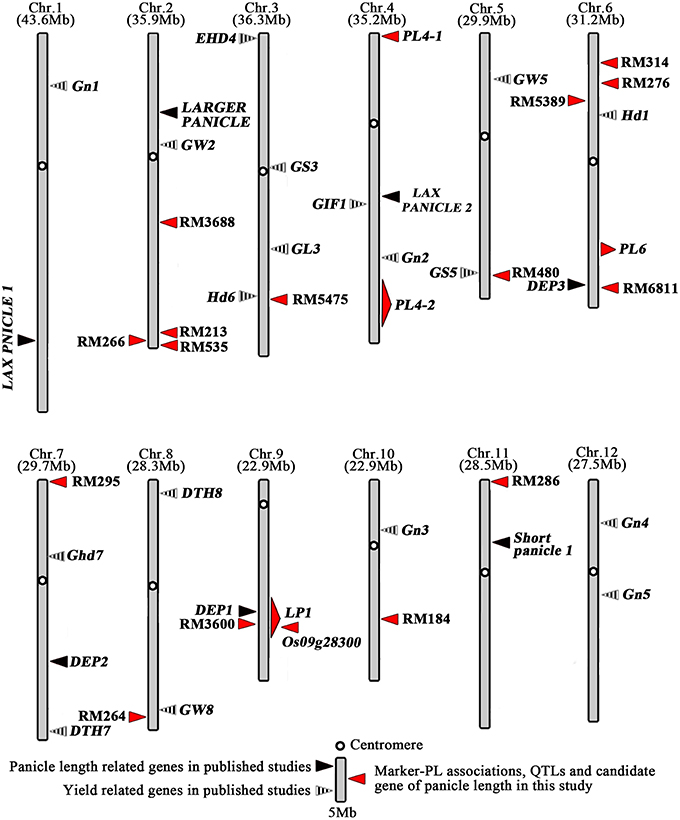
Figure 6. Distribution of marker-PL and QTLs or genes for panicle length and panicle length related on rice chromosome.
Author Contributions
DH designed the research; EL, YL, GW, SZ, and TT carried out the field experiment; EL, YL, LL, YFL, ZD, DS, HW and IZ carried out the molecular experiment; EL analyzed data; and EL wrote the manuscript; DH revised the manuscript.
Funding
This work was supported by the National High-tech R&D Program of China (863 Program) (Grant number: 2010AA101301) and Research Fund for the Doctoral Program of Higher Education of China (Grant numbers B0201100690, B0201300662).
Conflict of Interest Statement
The authors declare that the research was conducted in the absence of any commercial or financial relationships that could be construed as a potential conflict of interest.
The reviewer DG and handling Editor declared their shared affiliation, and the handling Editor states that the process nevertheless met the standards of a fair and objective review.
Supplementary Material
The Supplementary Material for this article can be found online at: http://journal.frontiersin.org/article/10.3389/fpls.2016.00596
Supplementary Figure 1. (A–G) Relationship between the D' value and genetic distance of syntenic marker pairs in subpopulations. (H) Gene diversity and PIC values of the seven subpopulations.
Supplementary Figure 2. Quantitative trait loci analysis using NIL-LP1/Xiushui79 F2 individuals. (A) Molecular linkage map of rice chromosome 9 showing the location of LP1. (B) Distribution of panicle length in the segregating population for the LP1 locus.
Supplementary Figure 3. Alignment of LP1 with the amino acid sequences of LP1-like proteins from other species. Asterisks indicate identical amino acids.
Supplementary Table 1. Panicle length of the 540 rice germplasm accessions, their geographical origin and their membership probabilities corresponding to each subpopulation.
Supplementary Table 2. Primer sequences designed in this study.
Supplementary Table 3. Descriptive statistics for panicle length (cm) in 540 rice accessions in 2011 and 2012.
Supplementary Table 4. Phenotypic effects of top 10 elite alleles at loci significantly associated with panicle length and their carrier variety.
Supplementary Table 5. Six annotated genes and their putative functions in a 90-kb region of the rice genome.
Supplementary Table 6. The SNPs detected at the 5.4-kb region of LP1 among two parents and 103 rice accessions.
Supplementary Table 7. Association analysis of the polymorphic markers in LP1 with panicle length.
References
Agrama, H. A., Eizenga, G. C., and Yan, W. (2007). Association mapping of yield and its components in rice cultivars. Mol Breeding. 19, 341–356. doi: 10.1007/s11032-006-9066-6
Ashikari, M., Sakakibara, H., Lin, S., Yamamoto, T., Takashi, T., Nishimura, A., et al. (2005). Cytokinin oxidase regulates rice grain production. Science 309, 741–745. doi: 10.1126/science.1113373
Benson, J. M., Poland, J. A., Benson, B. M., Stromberg, E. L., and Nelson, R. J. (2015). Resistance to gray leaf spot of maize: genetic architecture and mechanisms elucidated through nested association mapping and near-isogenic line analysis. PLOS Genet. 11:e1005045. doi: 10.1371/journal.pgen.1005045
Bradbury, P. J., Zhang, Z., Kroon, D. E., Casstevens, T. M., Ramdoss, Y., and Buckler, E. S. (2007). TASSEL: software for association mapping of complex traits in diverse samples. Bioinformatics 23, 2633–2635. doi: 10.1093/bioinformatics/btm308
Breseghello, F., and Sorrells, M. E. (2006). Association mapping of kernel size and milling quality in wheat (Triticum aestivum L.) cultivars. Genetics 172, 1165–1177. doi: 10.1534/genetics.105.044586
Cho, Y., Kang, H., Lee, J., Lee, Y., Lim, S., Gauch, H., et al. (2007). Identification of quantitative trait loci in rice for yield, yield components, and agronomic traits across years and locations. Crop Sci. 47, 2403–2417. doi: 10.2135/cropsci2006.08.0509
Creste, S., Neto, A. T., and Figueira, A. (2001). Detection of single sequence repeat polymorphisms in denaturing polyacrylamide sequencing gels by silver staining. Plant Mol Bio Rep. 19, 299–306. doi: 10.1007/BF02772828
Dang, X., Tran Thi, T. G., Dong, G., Wang, H., Edzesi, W. M., and Hong, D. (2014). Genetic diversity and association mapping of seed vigor in rice (Oryza sativa L.). Planta 239, 1309–1319. doi: 10.1007/s00425-014-2060-z
Ding, X., Li, X., and Xiong, L. (2011). Evaluation of near-isogenic lines for drought resistance QTL and fine mapping of a locus affecting flag leaf width, spikelet number, and root volume in rice. Theor. Appl. Genet. 123, 815–826. doi: 10.1007/s00122-011-1629-1
Falush, D., Stephens, M., and Pritchard, J. K. (2003). Inference of population structure using multilocus genotype data: linked loci and correlated allele frequencies. Genetics 164, 1567–1587.
Fan, C., Xing, Y., Mao, H., Lu, T., Han, B., Xu, C., et al. (2006). GS3, a major QTL for grain length and weight and minor QTL for grain width and thickness in rice, encodes a putative transmembrane protein. Theor Appl Genet. 112, 1164–1171. doi: 10.1007/s00122-006-0218-1
Flavio, B., Mark, E., and Sorrells. (2006). Association mapping of kernel size and milling quality in wheat (Triticum aestivum L.) cultivars. Genetics 172, 1165–1177. doi: 10.1534/genetics.105.044586
Flint-Garcia, S. A., Thornsberry, J. M., and Buckler, E. S. (2003). Structure of linkage disequilibrium in plants. Annu Rev Plant Biol. 54, 357–374. doi: 10.1146/annurev.arplant.54.031902.134907
Gao, H., Jin, M. N., Zheng, X. M., Chen, J., Yuan, D. Y., Xin, Y. Y., et al. (2014). Days to heading 7, a major quantitative locus determining photoperiod sensitivity and regional adaptation in rice. Proc. Natl. Acad. Sci. U.S.A. 111, 16337–16342. doi: 10.1073/pnas.1418204111
Gao, H., Zheng, X. M., Fei, G. L., Chen, J., Jin, M. N., Ren, Y. L., et al. (2013). Ehd4 encodes a novel and oryza-genus-specific regulator of photoperiodic flowering in rice. PLoS Genet. 9:e1003281. doi: 10.1371/journal.pgen.1003281
GRiSP (Global Rice Science Partnership). (2013). Rice Almanac, 4th Edn. Los Baños: International Rice Research Institute. 272–275.
Hardy, O., and Vekemans, X. (2002). SPAGeDi: a versatile computer program to analyse spatial genetic structure at the individual or population levels. Mol. Ecol. 2, 618–620. doi: 10.1046/j.1471-8286.2002.00305.x
Hittalmani, S., Huang, N., Courtois, B., Venuprasad, R., Shashidhar, H. E., Zhuang, J. Y., et al. (2003). Identification of QTL for growth- and grain yield-related traits in rice across nine locations of Asia. Theor Appl Genet. 107, 679–690. doi: 10.1007/s00122-003-1269-1
Hittalmani, S., Shashidhar, H. E., Bagali, P. G., Huang, N., Sidhu, J. S., Singh, V. P., et al. (2002). Molecular mapping of quantitative trait loci for plant growth, yield and yield related traits across three diverse locations in a doubled haploid rice population. Euphytica 125, 207–214. doi: 10.1023/A:1015890125247
Huang, X., and Han, B. (2014). Natural variations and genome-wide association studies in crop plants. Annu Rev Plant Biol. 65, 531–551. doi: 10.1146/annurev-arplant-050213-035715
Huang, X., Qian, Q., Liu, Z., Sun, H., He, S., Luo, D., et al. (2009). Natural variation at the DEP1 locus enhances grain yield in rice. Nat Genet. 41, 494–497. doi: 10.1038/ng.352
Jambhulkar, N. N., and Bose, L. K. (2014). Genetic variability and association of yield attributing traits with grain yield in upland rice. Genetika 46, 831–838. doi: 10.2298/GENSR1403831J
Jang, S. J., Sato, M., Sato, K., Jitsuyama, Y., Fujino, K., Mori, H., et al. (2015). A single-nucleotide polymorphism in an endo-1,4-β-glucanase gene controls seed coat permeability in soybean. PLoS ONE 10:e0128527. doi: 10.1371/journal.pone.0128527
Jin, L., Lu, Y., Xiao, P., Sun, M., Corke, H., and Bao, J. (2010). Genetic diversity and population structure of a diverse set of rice germplasm for association mapping. Theor Appl Genet. 121, 475–487. doi: 10.1007/s00122-010-1324-7
Khush, G. S. (1999). Green revolution: preparing for the 21st century. Genome 42, 646–655. doi: 10.1139/g99-044
Kobayashi, S., Fukuta, Y., Sato, T., Osaki, M., and Khush, G. S. (2003). Molecular marker dissection of rice (Oryza sativa L.) plant architecture under temperate and tropical climates. Theor Appl Genet. 107, 1350–1356. doi: 10.1007/s00122-003-1388-8
Kump, K. L., Bradbury, P. J., Wisser, R. J., Buckler, E. S., Belcher, A. R., Oropeza-Rosas, M. A., et al. (2011). Genome-wide association study of quantitative resistance to southern leaf blight in the maize nested association mapping population. Nat Genet. 43, 163–168. doi: 10.1038/ng.747
Lander, E. S., Green, P., Abrahamson, J., Barlow, A., Daly, M. J., Lincoln, S. E., et al. (1987). MAPMAKER: an interactive computer package for constructing primary genetic linkage maps of experimental and natural populations. Genomics 1, 174–181. doi: 10.1016/0888-7543(87)90010-3
Lee, S. J., Oh, C. S., Suh, J. P., McCouch, S. R., and Ahn, S. N. (2005). Identification of QTLs for domestication-related and agronomic traits in an Oryza sativa x O. rufipogon BC1F7 population. Plant Breeding 124, 209–219. doi: 10.1111/j.1439-0523.2005.01092.x
Li, F., Liu, W., Tang, J., Chen, J., Tong, H., Hu, B., et al. (2010). Rice DENSE AND ERECT PANICLE 2 is essential for determining panicle outgrowth and elongation. Cell Res 20, 838–849. doi: 10.1038/cr.2010.69
Li, M., Tang, D., Wang, K., Wu, X., Lu, L., Yu, H., et al. (2011). Mutations in the F-box gene LARGER PANICLE improve the panicle architecture and enhance the grain yield in rice. Plant Biotechnol J. 9, 1002–1013. doi: 10.1111/j.1467-7652.2011.00610.x
Li, S., Qian, Q., Fu, Z., Zeng, D., Meng, X., Kyozuka, J., et al. (2009). Short panicle1 encodes a putative PTR family transporter and determines rice panicle size. Plant J. 58, 592–605. doi: 10.1111/j.1365-313X.2009.03799.x
Li, Y., Fan, C., Xing, Y., Jiang, Y., Luo, L., Sun, L., et al. (2011). Natural variation in GS5 plays an important role in regulating grain size and yield in rice. Nat Genet. 43, 1266–1270. doi: 10.1038/ng.977
Liu, E., Liu, X., Zeng, S., Zhao, K., Zhu, C., Liu, Y., et al. (2015). Time-course association mapping of the grain-filling rate in rice (Oryza sativa L.). PLoS ONE 10:e0119959. doi: 10.1371/journal.pone.0119959
Liu, K., and Muse, S. V. (2005). PowerMarker: integrated analysis environment for genetic marker data. Bioinformatics 21, 2128–2129. doi: 10.1093/bioinformatics/bti282
Liu, T., Li, L., Zhang, Y., Xu, C., Li, X., and Xing, Y. (2011). Comparison of quantitative trait loci for rice yield, panicle length and spikelet density across three connected populations. J Genet. 90, 377–382. doi: 10.1007/s12041-011-0083-9
Livak, K. J., and Schmittgen, T. D. (2001). Analysis of relative gene expression data using realtime quantitative PCR and the 2(−ΔΔC(T)) method. Methods 25, 402–408. doi: 10.1006/meth.2001.1262
Marathi, B., Guleria, S., Mohapatra, T., Parsad, R., Mariappan, N., Kurungara, V. K., et al. (2012). QTL analysis of novel genomic regions associated with yield and yield related traits in new plant type based recombinant inbred lines of rice (Oryza sativa L.). BMC Plant Biol. 12:137. doi: 10.1186/1471-2229-12-137
McCouch, S. R., Teytelman, L., Xu, Y., Lobos, K. B., Clare, K., Walton, M., et al. (2002). Development and mapping of 2240 new SSR markers for rice (Oryza sativa L.). DNA Res. 9, 199–207. doi: 10.1093/dnares/9.6.199
Mei, H. W., Li, Z. K., Shu, Q. Y., Guo, L. B., Wang, Y. P., Yu, X. Q., et al. (2005). Gene actions of QTLs affecting several agronomic traits resolved in a recombinant inbred rice population and two backcross populations. Theor Appl Genet. 110, 649–659. doi: 10.1007/s00122-004-1890-7
Monna, L., Lin, X., Kojima, S., Sasaki, T., and Yano, M. (2002). Genetic dissection of a genomic region for a quantitative trait locus, Hd3, into two loci, Hd3a and Hd3b, controlling heading date in rice. Theor Appl Genet. 104, 772–778. doi: 10.1007/s00122-001-0813-0
Morris, G. P., Ramu, P., Deshpande, S. P., Hash, C. T., Shah, T., Upadhyaya, H. D., et al. (2013). Population genomic and genome-wide association studies of agroclimatic traits in sorghum. Proc. Natl. Acad. Sci. U.S.A. 110, 453–458. doi: 10.1073/pnas.1215985110
Nei, M., Tajima, F., and Tateno, Y. (1983). Accuracy of estimated phylogenetic trees from molecular data. II. Gene frequency data. J. Mol. Evol. 19, 153–170. doi: 10.1007/BF02300753
Pritchard, J. K., and Rosenberg, N. A. (1999). Use of unlinked genetic markers to detect population stratification in association studies. Am. J. Hum. Genet. 65, 220–228. doi: 10.1086/302449
Qiao, Y., Piao, R., Shi, J., Lee, S. I., Jiang, W., Kim, B. K., et al. (2011). Fine mapping and candidate gene analysis of dense and erect panicle 3, DEP3, which confers high grain yield in rice (Oryza sativa L.). Theor Appl Genet. 122, 1439–1449. doi: 10.1007/s00122-011-1543-6
Rafalski, J. A. (2010). Association genetics in crop improvement. Curr Opin Plant Biol. 13, 174–180. doi: 10.1016/j.pbi.2009.12.004
Risch, N., and Merikangas, K. (1996). The future of genetic studies of complex human diseases. Science 273, 1516–1517. doi: 10.1126/science.273.5281.1516
Song, X. J., Huang, W., Shi, M., Zhu, M. Z., and Lin, H. X. (2007). A QTL for rice grain width and weight encodes a previously unknown RING-type E3 ubiquitin ligase. Nat Genet. 39, 623–629. doi: 10.1038/ng2014
Stacklies, W., Redestig, H., Scholz, M., Walther, D., and Selbig, J. (2007). pcaMethods a bioconductor package providing PCA methods for incomplete data. Bioinformatics 23, 1164–1167. doi: 10.1093/bioinformatics/btm069
Takahashi, Y., Shomura, A., Sasaki, T., and Yano, M. (2001). Hd6, a rice quantitative trait locus involved in photoperiod sensitivity, encodes the alpha subunit of protein kinase CK2. Proc. Natl. Acad. Sci. U.S.A. 98, 7922–7927. doi: 10.1073/pnas.111136798
Temnykh, S., Park, W. D., Ayres, N., Cartinhour, S., Hauck, N., Lipovich, L., et al. (2000). Mapping and genome organization of microsatellite sequences in rice (Oryza sativa L.). Theor Appl Genet. 100, 697–712. doi: 10.1007/s001220051342
Thomson, M. J., Tai, T. H., McClung, A. M., Lai, X. H., Hinga, M. E., Lobos, K. B., et al. (2003). Mapping quantitative trait loci for yield, yield components and morphological traits in an advanced backcross population between Oryza rufipogon and the Oryza sativa cultivar Jefferson. Theor Appl Genet. 107, 479–493. doi: 10.1007/s00122-003-1270-8
Wang, E. T., Wang, J. J., Zhu, X. D., Hao, W., Wang, L., Li, Q., et al. (2008). Control of rice grain-filling and yield by a gene with a potential signature of domestication. Nat Genet. 40, 1370–1374. doi: 10.1038/ng.220
Wang, J. (2009). Inclusive composite interval mapping of quantitative trait genes. Acta Agron Sin. 35, 239–245. doi: 10.3724/SP.J.1006.2009.00239
Wang, S., Wu, K., Yuan, Q., Liu, X., Liu, Z., Lin, X., et al. (2012). Control of grain size, shape and quality by OsSPL16 in rice. Nat Genet. 44, 950–955. doi: 10.1038/ng.2327
Wang, Y., Liu, X., Ji, X., Zhang, L., Liu, Y., Lv, X., et al. (2015). Identification and validation of a major QTL controlling the presence/absence of leaf lobes in Brassica rapa L. Euphytica 205, 761–777. doi: 10.1007/s10681-015-1403-6
Wei, X. J., Xu, J. F., Guo, H. N., Jiang, L., Chen, S. H., Yu, C. Y., et al. (2010). DTH8 suppresses flowering in rice, influencing plant height and yield potential simultaneously1[W][OA]. Plant Physiol. 153, 1747–1758. doi: 10.1104/pp.110.156943
Weng, J., Gu, S., Wan, X., Gao, H., Guo, T., Su, N., et al. (2008). Isolation and initial characterization of GW5, a major QTL associated with rice grain width and weight. Cell Res. 18, 1199–1209. doi: 10.1038/cr.2008.307
Xiao, J., Li, J., Grandillo, S., Ahn, S. N., Yuan, L., Tanksley, S. D., et al. (1998). Identification of trait-improving quantitative trait loci alleles from a wild rice relative, Oryza rufipogon. Genetics 150, 899–909
Xing, Z., Tan, F., Hua, P., Sun, L., Xu, G., and Zhang, Q. (2002). Characterization of the main effects, epistatic effects and their environmental interactions of QTLs on the genetic basis of yield traits in rice. Theor Appl Genet. 105, 248–257. doi: 10.1007/s00122-002-0952-y
Xue, W. Y., Xing, Y. Z., Weng, X. Y., Zhao, Y., Tang, W. J., Wang, L., et al. (2008). Natural variation in Ghd7 is an important regulator of heading date and yield potential in rice. Nat Genet. 40, 761–767. doi: 10.1038/ng.143
Yano, M., Katayose, Y., Ashikari, M., Yamanouchi, U., Monna, L., Fuse, T., et al. (2000). Hd1, a major photoperiod sensitivity quantitative trait locus in rice, is closely related to the arabidopsis flowering time gene CONSTANS. Plant Cell. 12, 2473–2483. doi: 10.1105/tpc.12.12.2473
Yao, X. -Y., Li, Q., Liu, J., Jiang, S. -K., Yang, S. -L., Wang, J. -Y., et al. (2015). Dissection of QTLs for plant height and panicle length traits in rice under different environment. Sci. Agr. Sin. 48, 407–414. doi: 10.3864/j.issn.0578-1752.2015.03.01
Zhang, D., Song, H., Cheng, H., Hao, D., Wang, H., Kan, G., et al. (2014). The acid phosphatase-encoding gene GmACP1 contributes to soybean tolerance to low-phosphorus stress. PLoS Genet. 10:e1004061. doi: 10.1371/journal.pgen.1004061
Zhang, L., Wang, J., Wang, J., Wang, L., Ma, B., Zeng, L., et al. (2015). Quantitative trait locus analysis and fine mapping of the qPL6 locus for panicle length in rice. Theor. Appl. Genet. 128, 1151–1161. doi: 10.1007/s00122-015-2496-y
Zhang, X., Wang, J., Huang, J., Lan, H., Wang, C., Yin, C., et al. (2012). Rare allele of OsPPKL1 associated with grain length causes extra-large grain and a significant yield increase in rice. Proc. Natl. Acad. Sci. U.S.A. 109, 21534–21539. doi: 10.1073/pnas.1219776110
Zheng, Z., Ma, J., Stiller, J., Zhao, Q., Feng, Q., Choulet, F., et al. (2015). Fine mapping of a large-effect QTL conferring fusarium crown rot resistance on the long arm of chromosome 3B in hexaploid wheat. BMC Genomics 16:850. doi: 10.1186/s12864-015-2105-0
Zuo, S., Kang, H., Li, Q., Chen, Z., Zhang, Y., Liu, W., et al. (2014). Genome-wide association analysis on genes controlling panicle traits of varieties from international rice core collection bank and its breeding utilization. Chin. J. Rice Sci. 28, 649–658. doi: 10.3969/j.issn.1001-7216.2014.06.011
Keywords: association analysis, gene identification, map-based cloning, panicle length, quantitative trait locus, rice
Citation: Liu E, Liu Y, Wu G, Zeng S, Tran Thi TG, Liang L, Liang Y, Dong Z, She D, Wang H, Zaid IU and Hong D (2016) Identification of a Candidate Gene for Panicle Length in Rice (Oryza sativa L.) Via Association and Linkage Analysis. Front. Plant Sci. 7:596. doi: 10.3389/fpls.2016.00596
Received: 29 February 2016; Accepted: 18 April 2016;
Published: 03 May 2016.
Edited by:
Scott Jackson, University of Georgia, USAReviewed by:
Dongying Gao, University of Gerogia, USAManish Kumar Pandey, International Crops Research Institute for the Semi-Arid Tropics, India
Copyright © 2016 Liu, Liu, Wu, Zeng, Tran Thi, Liang, Liang, Dong, She, Wang, Zaid and Hong. This is an open-access article distributed under the terms of the Creative Commons Attribution License (CC BY). The use, distribution or reproduction in other forums is permitted, provided the original author(s) or licensor are credited and that the original publication in this journal is cited, in accordance with accepted academic practice. No use, distribution or reproduction is permitted which does not comply with these terms.
*Correspondence: Delin Hong, delinhong@njau.edu.cn