 Bingfu Guo1†
 Li-Juan Qiu
- 1The National Key Facility for Crop Gene Resources and Genetic Improvement (NFCRI) and MOA Key Lab of Soybean Biology (Beijing), Institute of Crop Science, Chinese Academy of Agricultural Sciences, Beijing, China
- 2College of Agriculture, Northeast Agricultural University, Harbin, China
Molecular characterization of sequence flanking exogenous fragment insertion is essential for safety assessment and labeling of genetically modified organism (GMO). In this study, the T-DNA insertion sites and flanking sequences were identified in two newly developed transgenic glyphosate-tolerant soybeans GE-J16 and ZH10-6 based on whole genome sequencing (WGS) method. More than 22.4 Gb sequence data (∼21 × coverage) for each line was generated on Illumina HiSeq 2500 platform. The junction reads mapped to boundaries of T-DNA and flanking sequences in these two events were identified by comparing all sequencing reads with soybean reference genome and sequence of transgenic vector. The putative insertion loci and flanking sequences were further confirmed by PCR amplification, Sanger sequencing, and co-segregation analysis. All these analyses supported that exogenous T-DNA fragments were integrated in positions of Chr19: 50543767–50543792 and Chr17: 7980527–7980541 in these two transgenic lines. Identification of genomic insertion sites of G2-EPSPS and GAT transgenes will facilitate the utilization of their glyphosate-tolerant traits in soybean breeding program. These results also demonstrated that WGS was a cost-effective and rapid method for identifying sites of T-DNA insertions and flanking sequences in soybean.
Introduction
Genetically modified crops (GM crops) were first commercialized in 1996 and since then they have been grown and consumed for two decades. During this period, a large number of transgenic plants have been developed and released (Liang et al., 2014). Up to now, the cumulative hectarage of biotech crops has exceeded two billion hectares globally (James, 2015), and more and more foods and feeds derived from GM plants have been entering into supply chains. In addition, a growing number of genes or regulatory elements have still been transferred into crop genomes to improve agronomic traits (Daniela et al., 2013). Once transgenic lines showing excellent agronomic performance are generated, the extensive testing and comprehensive analyses of these lines are necessary for biosafety assessment before being approved and entering into market (Codex Alimentarius Commission, 2003; European Food Safety Authority [EFSA], 2010; Kok et al., 2015). Among these, low copy number integration is the most favorable molecular profile for selecting the best events from putative lines (Kovalic et al., 2012). Furthermore, development of even-specific detection methods is not only useful for breeding program, but also of particular importance for bio-risk management to ensure food, feed, and environmental safety (Arne et al., 2012; Daniela et al., 2013; Fraiture et al., 2015a).
Traditionally, T-DNA flanking sequence of transgenic plant is identified by using PCR-based methods. These methods include thermal asymmetric interlaced PCR (TAIL-PCR; Liu et al., 1995), adapter-ligated PCR (O’Malley and Ecker, 2010), inverse PCR (Ochman et al., 1988), or restriction site extension PCR (Ji and Braam, 2010), which all rely on the sequence information of transgenic elements (Spalinskas et al., 2013). Among these, TAIL-PCR and genome walking are commonly used approaches for isolating and cloning sequences flanking T-DNA (Daniela et al., 2013). Several junction sequences in transgenic soybean, maize, and cotton were successfully characterized using these methods (Windels et al., 2001; Yang et al., 2005; Akritidis et al., 2008; Wang et al., 2010; Fraiture et al., 2015b). However, these approaches are always laborious and expensive, and especially difficult to achieve high throughput. Even more, if the genome of plant species is complex or the transgenic event contains intricate modifications or rearrangements of exogenous fragment, these traditional methods are not powerful enough to identify all insertion loci and their flanking sequences (Daniela et al., 2013).
With the emergence and fast development of NGS technologies, sequence from whole genome can be generated in a short time with a low cost. NGS approaches have been proven to be powerful tools for discovering gene fusions, sequence rearrangements, DNA insertions, and structural variations in different animal and plant species (Campbell et al., 2008; Fullwood et al., 2009; Hormozdiari et al., 2011; Kovalic et al., 2012; DuBose et al., 2013). For the past few years, NGS has also provided an alternative tool in molecular characteristics of GM plants. Several NGS based methods have been developed to identify insertions of exogenous fragments in Arabidopsis thaliana (Lepage et al., 2013; Inagaki et al., 2015), rice (Daniela et al., 2013; Park et al., 2015), and maize (Rosalind et al., 2010). Compared with PCR-based methods, combination of targeted bioinformatics analysis and limited de novo assembly using WGS data has become a much simpler and more effective approach for transgenic analysis.
Soybean is a paleopolyploid species with nearly 75% of genes presented in multiple copies due to the lack of immediate diploidization during the relatively recent whole genome duplication (Kim et al., 2009). Two rounds of genome duplication occurring at approximate 59 and 13 million years ago result in a highly duplicated genome and numerous chromosome rearrangements (Schmutz et al., 2010). Therefore, traditional PCR-based methods are always failed to identify insertion sites in GM soybean. The complete sequence of soybean cultivar Williams 82 provides a reference for whole genome re-sequencing and genomics research of different soybean genotypes (Schmutz et al., 2010). Like other model plants, NGS method has been proved to be successful in examining typical GM soybean lines MON17903 and MON87704 whose insertion sites and flanking sequences had been identified previously (Kovalic et al., 2012). However, whether it can still be efficient for molecular characterization of uncharacterized transgenic lines remains unclear.
Among all commercialized GM crops, herbicide tolerant transgenic soybean has been the most widely grown one all over the world. Recently, we developed two transgenic lines GE-J16 and ZH10-6 by co-expression of glyphosate tolerant gene G2-EPSPS and glyphosate-degrading gene GAT, which conferred high tolerance to the herbicide glyphosate in soybean (Guo et al., 2015a,b). In this study, the integration sites and junction sequences of G2-EPSPS and GAT transgenes were characterized from these two events using WGS method. The reads mapped to junctions of T-DNA and host genomes of them were selected by bioinformatics analysis and putative integration sites were identified. The exact insertion sites and flanking sequences were further determined after validation by PCR amplification and Sanger sequencing. Molecular characterization of these two herbicide tolerant transgenic soybeans at nucleic acid level will provide precise information for regulatory submissions and facilitate utilization of these soybean lines in future breeding program.
Materials and Methods
Plant Materials
The transgenic soybeans GE-J16 and ZH10-6 were produced by Agrobacterium-mediated transformation of soybean cultivars Jack and ZH10 (Guo et al., 2015a,b). The plasmid vector pKT-rGE used for transformation contains glyphosate tolerant gene G2-EPSPS and glyphosate-degrading gene GAT. The transformants co-expressing G2-EPSPS and GAT genes conferred high tolerance to glyphosate. Southern blot analysis indicated that only one copy of exogenous T-DNA was integrated into each host genome (Guo et al., 2015a,b).
Genetic Analysis of GM Soybean Events
T2 progeny derived from heterozygous lines of GE-J16 and F2 populations developed by crossing between homozygous ZH10-6 and non-transgenic soybean cultivars (HH38, HH43, KS1, KF16, KF20 and KF22) were used for genetic analysis. Soybean plants were sprayed with commercial formulation of glyphosate (Roundup, Monsanto Co.) at the labeled rate (1800 g a.e./ha) when first trifoliolate leaves were fully expanded. The number of living and dead plants was investigated two weeks after treatment and segregation ratios were analyzed by χ2 testing. The data was analyzed using SPSS 18.0 and Excel.
Genomic DNA Isolation and Whole Genome Sequencing
Genomic DNA was isolated from fresh leaves of soybean plants using the modified CTAB method (Porebski et al., 1997) and quantified by Quawell Q5000 spectrophotometer (Quawell Technology, Inc., USA). About 5 μg of genomic DNA from GE-J16 and ZH10-6 was sheared to fragments with a length of 400 bp in average to construct libraries using the Nextera DNA Sample Preparation Kit (Illumina, USA). The libraries were then subjected to sequencing on Illumina Hiseq2500 platform and 125-bp paired-end reads were generated.
Transgenic Insertion Analysis
Data obtained from the sequencer was processed for quality control and raw reads were filtered by removal of adapter and low quality reads (Q < 20). Clean reads were individually aligned and mapped to Glycine max Wm82.a2.v1 reference genome from Phytozome and sequence of pKT-rGE vector using BWA with default parameters (Langmead and Salzberg, 2012). The pipeline for data analysis and validation was briefly described in Figure 1. After mapping of all reads against the reference genome and sequence of vector, they were classified into three groups: reads only mapped to the reference genome, reads only mapped to vector sequence and reads mapped to both sequences (junction reads). Physical positions of junction reads were indicated the integration sites and were used for further analysis.
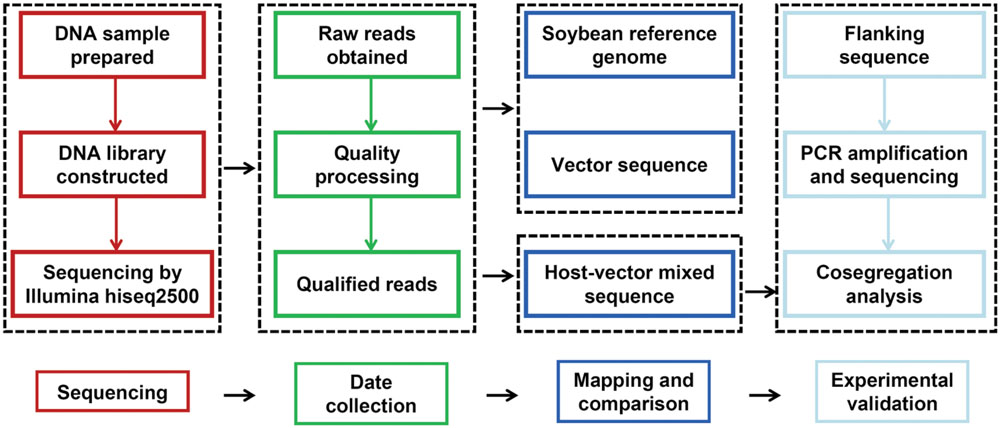
FIGURE 1. Schematic diagram of the work-flow for insertion site identification and validation.
Confirmation of Insert Loci and Flanking Sequences by PCR and Sanger Sequencing
The upstream and downstream sequences flanking putative insertion sites identified by junction reads were extracted from soybean genome database at Phytozome1. For each transgenic soybean line, a total of four primers were designed based on putative flanking sequences and T-DNA sequence. Two primers were annealed within upstream and downstream flanking sequences and the other two annealed to exogenous G2-EPSPS and GAT in T-DNA region. One primer binding putative flanking sequences and the other binding T-DNA region were used in combination to amplify the putative junction sequences. PCR products were checked on 1% agarose gel by electrophoresis and specific bands were sequenced on both strands. Sequence alignment was performed to identify exact insertion positions of exogenous fragments. The primers used for amplification were listed in Table 1.
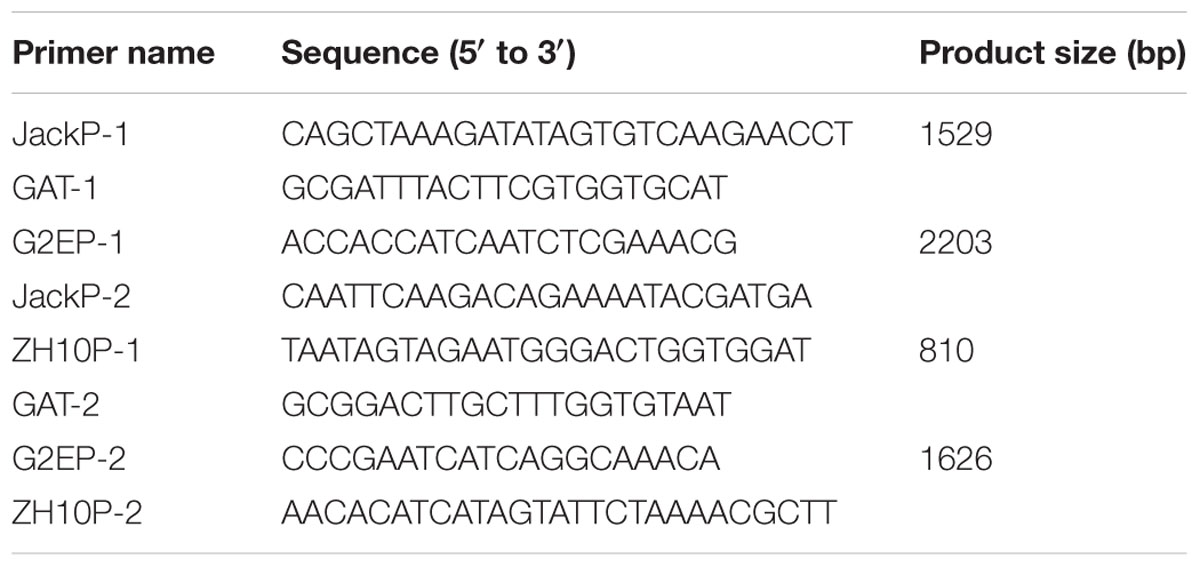
TABLE 1. Event specific primers used in this study.
Validation of Integration Sites in Segregation Populations
The event-specific primer pairs were applied to amplify the progeny of heterozygous lines and segregation populations. PCR amplification was carried out in 20-μl reaction mixture using PTC-200 Thermocycler (MJ Research/Bio-Rad, USA). The PCR procedures were as follows: 1 cycle of 94°C for 4 min; 36 cycles of 94°C for 30 s, 60°C for 30 s, and 72°C for 90 s; with a final extension of 72°C for 10 min. PCR products were analyzed on 1% agarose gel by electrophoresis.
Results
Genetic Analysis of Transgenic Soybean Lines
In order to identify segregation ratios of exogenous genes in GM soybeans, progeny of three heterozygous lines of GE-J16 and six F2 populations derived from ZH10-6 were used for phenotype identification and genetic analysis. After spraying with herbicide Roundup, the number of living and dead plants in each population was counted. The results showed that observed ratios of glyphosate tolerante and sensitive plants in these populations were all well fitted to 3:1 ratio with χ2 values range from 0 to 1.922 (Table 2). PCR amplifications of exogenous genes also suggested the existance of them co-segragated with the tolerance of glyphosate (data not shown). These results further confirmed that one insertion site of exogenous gene was intergrated into the genome of each transgenic event.
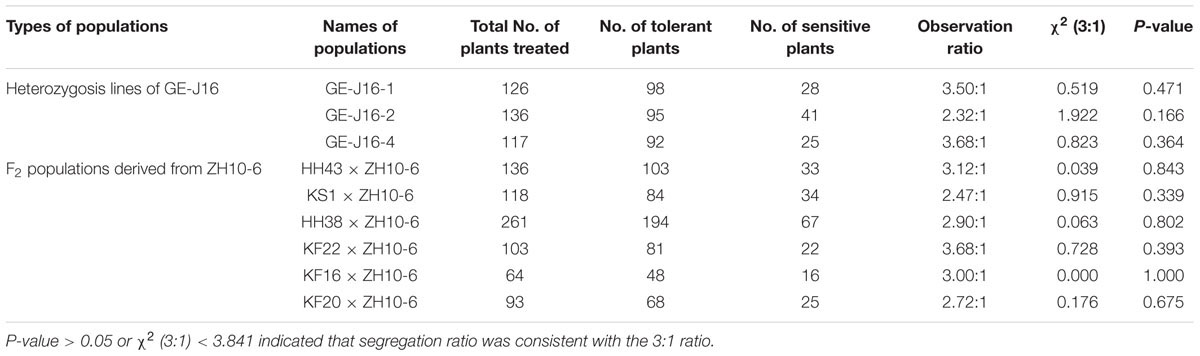
TABLE 2. Genetic analysis of heterozygosis lines of GE-J16 and F2 populations derived from ZH10-6.
Whole Genome Sequencing of GM Soybean Events
Whole Genome Sequencing was used for identifying molecular characterizations of GM soybeans and major steps were described in Figure 1. Sequencing libraries were constructed and sequencing reads in length of 125-bp were generated by paired-end sequencing. After the processing of quality control, a total of 179.3 million clean reads for GE-J16 and 210.0 million clean reads for ZH10-6 were obtained. Among them, 90.11% and 87.96% of sequencing data has Phred-like quality scores ≥30 (Table 3), indicating the high quality of the data. About 95.38% and 93.25% reads could map to soybean reference genome in these two soybean lines, accounting for ∼20 × and ∼22 × coverage of soybean genome, respectively. Among them, about 92.6% of genome had at least one-fold coverage and nearly half of genome had at least ten-fold coverage (Table 3).
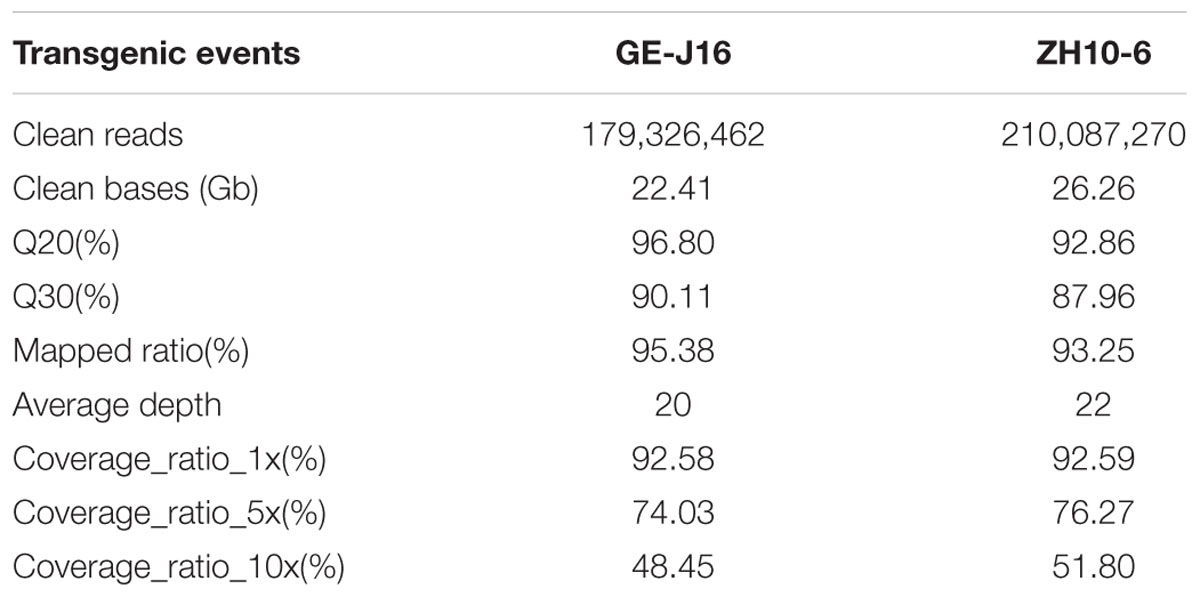
TABLE 3. The summary of sequence data from WGS.
Identification of Putative Integration Sites Using Whole Genome Sequencing Data
In order to identify putative insertion sites of exogenous fragments, all clean reads were mapped to the sequence of pKT-rGE vector and soybean reference genome. The putative integration sites of transgenic events were characterized based on junction reads in which one end was mapped to the sequence of vector and the other end to the host genome. After detailed data analysis, six junction reads on chromosome 19 and 15 reads on chromosome 17 were identified from the sequence data of GE-J16 and ZH10-6 separately (Figure 2). According to physical positions of junction reads, the T-DNA is integrated at position around Chr19: 50,543,500-50,543,900 in GE-J16 and the insertion loci of ZH10-6 was located at position Chr17: 7,980,300-7,980,600. These results further confirmed a single insertion site of exogenous gene in the genome of these each transgenic line.
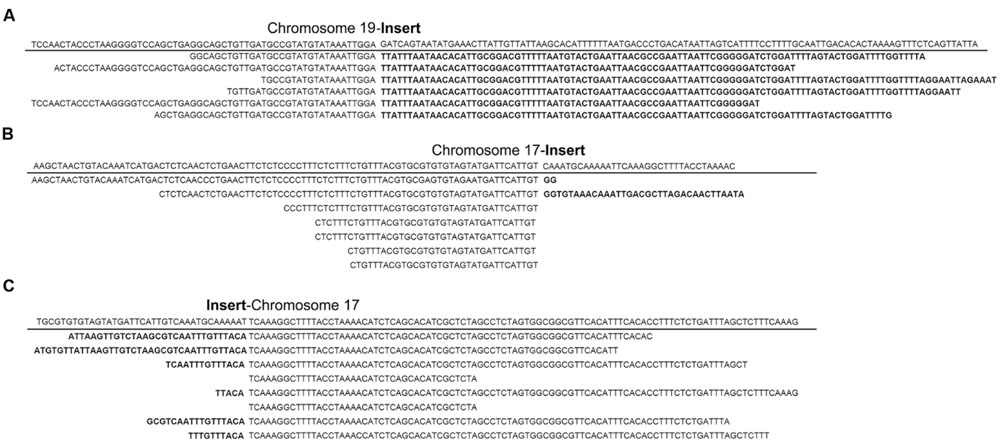
FIGURE 2. Junction reads covering junctions of integrated T-DNA and host genomes in GE-J16 and ZH10-6. Junctions with transition on insert and chromosome 19 in GE-J16 (A) and transition on insert and chromosome 17 in ZH10-6 (B,C). The sequence of reference genome along the insertion site was underlined and the transition between soybean genome and T-DNA insertion was indicated by a gap. The part of each read belonging to the exogenous fragment was indicated in bold.
Confirmation of Insertion Sites and Flanking Sequences by PCR Amplification and Sequencing
In order to characterize exact positions of T-DNA insertions, PCR primers were designed based on speculated upstream and downstream flanking sequences and the T-DNA sequence (Figure 3). When using primer pairs with one primer annealing within putative flanking sequences (JackP-1, JackP-2, ZH10P-1, and ZH10P-2) and the other annealing to the exogenous genes (GAT-1, GAT-2, G2EP-1, and G2EP-2), gel electrophoresis revealed that PCR reactions of primer pairs JackP-1/GAT-1, G2EP-1/JackP-2, ZH10P-1/GAT-2, and G2EP-2/ZH10P-2 had generated products with single band in transgenic lines while no product could be detected from the non-transgenic control (Figure 3). Sanger sequencing of these junction fragments confirmed the putative insertion sites identified by WGS and exact positions of T-DNA insertions were also identified. The T-DNA of GE-J16 was integrated into physical position 50543767–50543792 on chromosome 19 while that of ZH10-6 was inserted into position 7980527–7980541 on chromosome 17 (Figure 4). Both exogenous fragments were all inserted in intergenic regions of the host genome and no functional gene was interrupted by T-DNA insertions. Accordingly, due to the transformation, 24-bp and 13-bp fragments of host genome sequences were replaced by insertions of T-DNA in GE-J16 and ZH10-6, respectively.
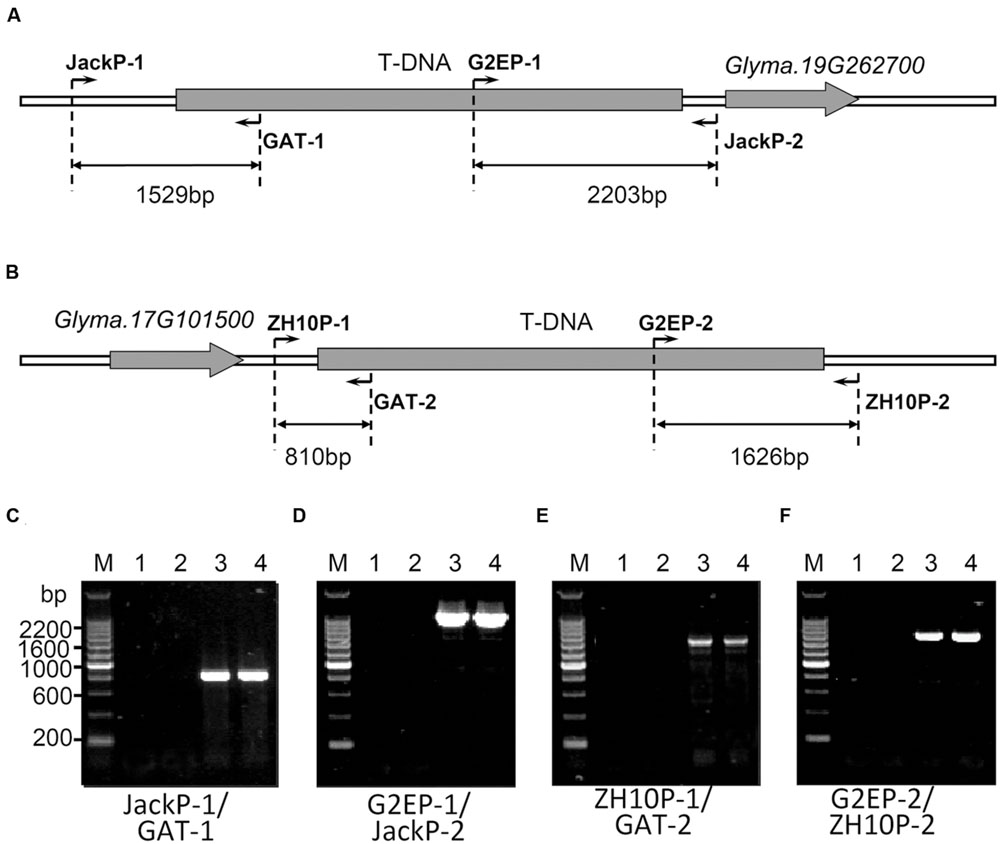
FIGURE 3. Locations of primers and PCR validation of transgenic insertion sites. Schematic diagram of PCR validation primers were designed for GE-J16 (A) and ZH10-6 (B). Glyma.19G262700 and Glyma.17G101500 were genes located near the insertion sites of two transgenic events. PCR amplifications of junction sequences were carried out in GE-J16 (C,D) and ZH10-6 (E,F). M: 200 bp DNA Marker, 1: negative control of water; 2: negative control of non-transgenic soybean Jack (C,D) and ZH10 (E,F); 3, 4: transgenic plants of GE-J16 (C,D) and ZH10-6 (E,F).
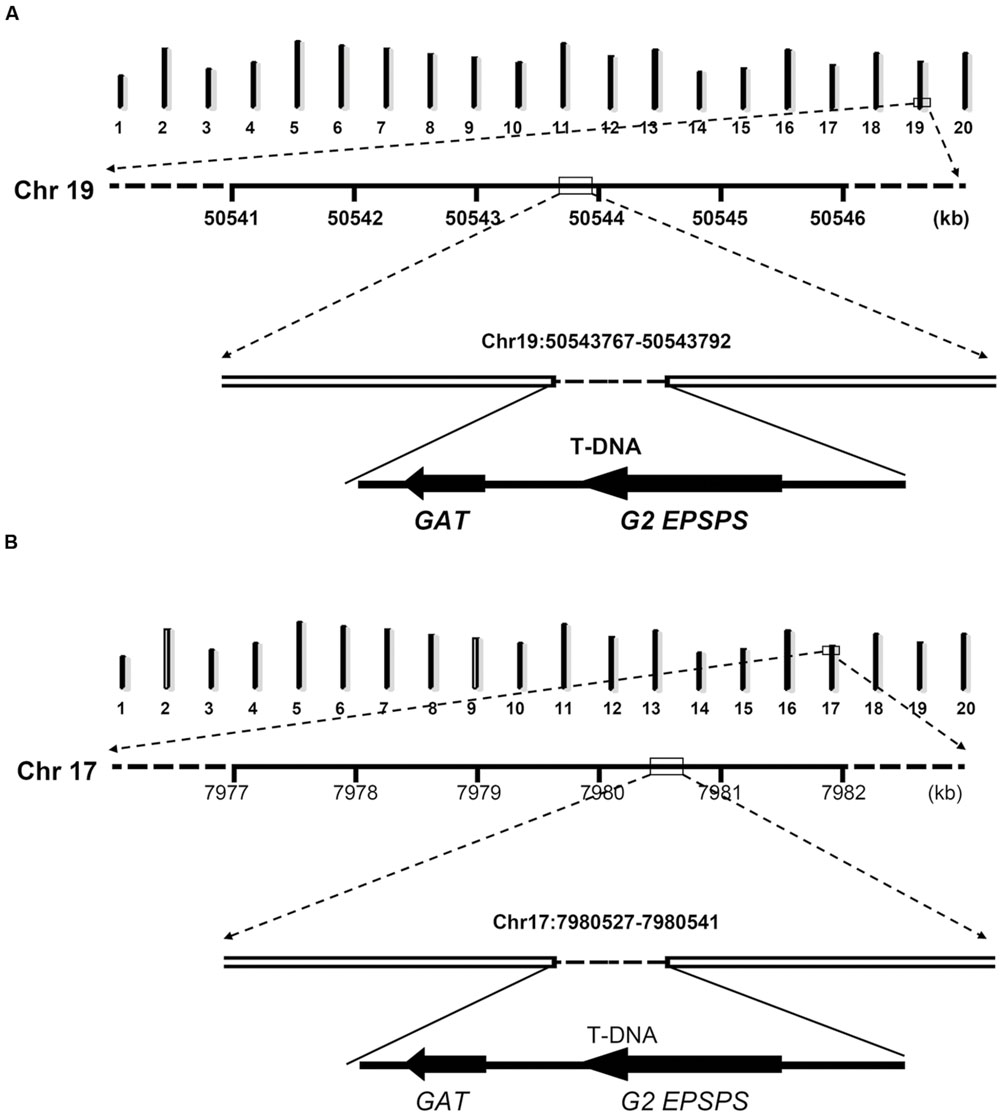
FIGURE 4. Schematic diagram of insertion loci and flanking sequences in GE-J16 (A) and ZH10-6 (B). The upper diagram of each chart indicated 20 chromosomes of soybean with chromosome numbers at the bottom. The numbers under the line of Chr 19 (A) and Chr 17 (B) indicates physical positions of these chromosomes.
Validation of Insertion Sites in Heterozygous Lines and Segregation Populations
In order to further validate the insertion sites, specific primer pairs for each event were applied to identify genotypes of individual plants from T2 and F2 populations. Genomic DNA isolated from random selected glyphosate tolerant and sensitive plants was used as template for PCR amplification. For primer pairs (JackP-1/GAT-1, G2EP-1/JackP-2 for GE-J16 and ZH10P-1/GAT-2, G2EP-2/ZH10P-2 for ZH10-6) amplifying upstream or downstream junction of the plant genome and T-DNA region, expected sizes of PCR products (1529-bp, 2203-bp for GE-J16 and 810-bp, 1626-bp for ZH10-6) were amplified in all glyphosate tolerant plants while no product was detected in all sensitive plants (Figure 5), indicating that glyphosate tolerant phenotype co-segregated with T-DNA insertion either in GE-J16 or ZH10-6. For primer pairs JackP-1/2 and ZH10P-1/2 used for amplifying flanking sequences of host genome, expected 1246-bp and 632-bp products were amplified in 13 progeny of heterozygous GE-J16 and 17 F2 individuals derived from ZH10-6, respectively. These 30 lines contain heterozygous lines if PCR amplification of upstream or downstream junction sequences could be detected and wild type if junction sequences could not be amplified. In addition, no PCR product of host genome could be detected from two and six glyphosate tolerant plants derived from GE-J16 and ZH10-6, respectively (Figure 5). These plants were regarded as homozygous lines since only junctions between T-DNA and host genome could be amplified. Further identification of phenotype in T3 generation and F2:3 populations also confirmed no segregation of glyphosate tolerant phenotype in these eight lines. This result suggested that the insertion of exogenous genes and glyphosate tolerance phenotype were co-segregated in these segregation populations.
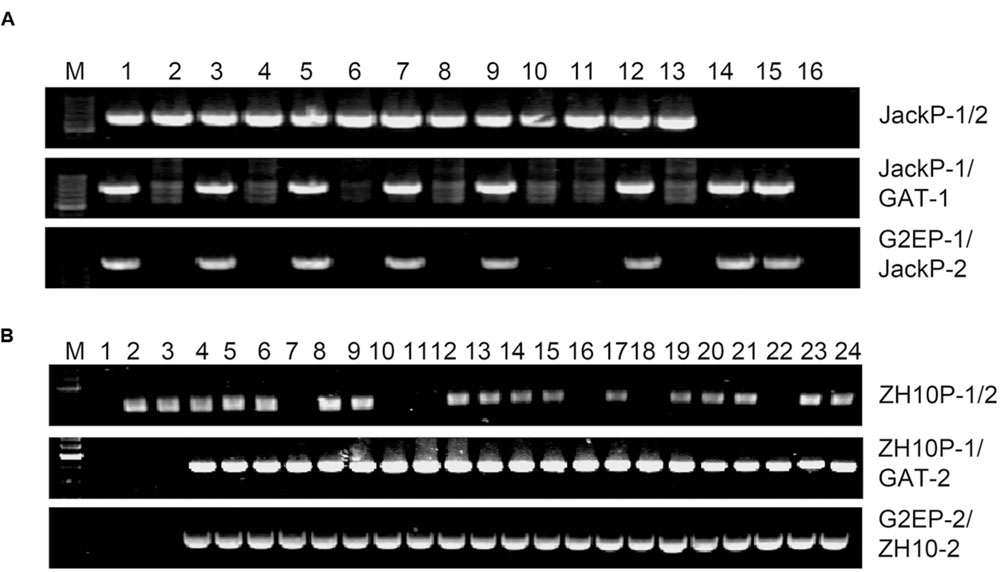
FIGURE 5. Validation of the insertion sites in individuals of heterozygosis lines and segregation populations. (A) Validation of the insertion site in progeny of heterozygosis GE-J16. M: 200-bp DNA marker; 1, 3, 5, 7, 9, 12, 14, 15: glyphosate tolerant individuals; 2, 4, 6, 8, 10, 11, 13: glyphosate sensitive individuals; 16: negative control of water. (B) Validation of the insertion site in segregation populations derived from ZH10-6. M: 200-bp DNA marker; 1: negative control; 2,3: glyphosate sensitive individuals; 4–24: glyphosate tolerant individuals.
Discussion
Detailed molecular characterization of inserted DNA and associated flanking sequences is of particular importance in safety assessment of GM crops and in tracing individual transgenic event (Yang et al., 2013). Traditionally, PCR-based methods including TAIL-PCR and genome walking, combined with Southern blot analysis and Sanger sequencing, were applied to determine locations of integration sites and junction sequences between exogenous sequences and host genome (Codex Alimentarius Commission, 2003). However, these methods usually did not work very well in species with relative complex genome. Due to the high level of duplication in soybean, traditional approaches are usually time consuming and their abilities to identify transgenic events are limited by various factors including complex insertion pattern, T-DNA rearrangement, small insertions/deletions and individual nucleotide substitutions. For example, only one copy of CP4-EPSPS was initially documented when GM event GTS40-3-2 was approved for commercialization (Padgette et al., 1995). Later, the rearrangement of the 3′-NOS terminator junction and one unintended 70-bp DNA fragment were evidenced (Monsanto Company, 2000; Windels et al., 2001; Wang et al., 2010). Therefore, PCR-based method sometimes may not get complete information of exogenous fragment insertion in transgenic soybeans.
With the emergence and development of high throughput next generation sequencing technology, sequences of whole genome can be obtained rapidly at relatively low cost. NGS has proven to be a powerful tool for discovering genome variation including re-arrangements, gene fusions, DNA structural variations in different species (Campbell et al., 2008; Hormozdiari et al., 2011; DuBose et al., 2013). NGS coupled with bioinformatics platform applied in genomics research are widely used in the agricultural biotechnology field (Kovalic et al., 2012; Lepage et al., 2013; Park et al., 2015). Recently, several researches have focused on new approaches in molecular characterization and safety assessment of transgenic events using NGS technology (Urbanski et al., 2012; Daniela et al., 2013; Pauwels et al., 2015). Here we identified the integrity locations of transgenes and characterized the junction sequences in two newly developed glyphosate-tolerant transgenic soybeans using WGS method. The molecular characterization of these two events at DNA level will serve as risk assessment of them with respect to their possible impact on environment and human/animal health. Even more, this data also provides information for development of detection techniques in tracing these transgenic events.
Compared with traditional PCR-based methods, WGS combined targeted bioinformatics analysis emerge as a sensitive and time- and labor-effective approach in molecular characterization of GM plants. NGS-based molecular characterization can overcome some limitations of PCR-based approaches, including high amount of DNA required, multiple manual work interventions, and the impossibility to identify genetic changes (Pauwels et al., 2015). Particularly, it reduces the cost of experiment and the amount of labor since most of steps can be performed with commercially available kits in high throughput manner (Kovalic et al., 2012). In addition, WGS can further reveal nucleic sequence variations including SNPs and small InDels, which could potentially detect small sequence modifications (Pauwels et al., 2015). Even more, accurate sequence information identified by WGS could be directly used in assessment of the potential toxicity or allergenicity in GM plant by verification of potential similarities in databases of toxins, toxin targets, allergenic proteins and anti-nutritional factors.
Although several NGS based approaches have been developed for molecular characterized of GM plants (Kovalic et al., 2012; Yang et al., 2013; Park et al., 2015), these researches all used paired-end reads with one read of a pair mapped to the transgene and its mate mapped to the plant genome to identify the transgenic insertion. Therefore, the insertion site was just identified as a region as the sequence between read pairs was not sequenced completely. In our analysis, we separated paired-end reads and each one was used for mapping, then one read with a portion derived from the transgene and the other portion derived from host genome was selected for identifying the integration site. In addition, although we achieved lower sequencing coverage (∼20×) compared with previous reports using more than 70× coverage (Kovalic et al., 2012; Park et al., 2015), three out of four junctions could be identified from our single read analysis, indicating the power of WGS method even in species such as soybean with complex genome. Due to the uneven coverage of reads across the whole genome, lower coverage of junction reads was obtained compared to the average sequencing depth. In particular, since the downstream junction of GE-J16 on Chromosome 19 has not been identified, increasing the sequence coverage by deep sequencing is recommended. Nevertheless, the implementation of NGS in GMO routine analysis may be less affordable for some laboratories with modest budgets due to relatively high cost, the requirement of adequate computer infrastructures and qualified analysts in bioinformatics for dealing with enormous amount of sequencing data (Buermans and Dunnen, 2014; Liang et al., 2014; Willems et al., 2016).
Author Contributions
L-JQ, YG, and BG conceived and designed the experiments. BG, YG, and HH performed the experiments. YG and BG analyzed and interpreted data. BG, YG, and L-JQ wrote the manuscript. All authors read and approved the manuscript.
Conflict of Interest Statement
The authors declare that the research was conducted in the absence of any commercial or financial relationships that could be construed as a potential conflict of interest.
Acknowledgment
This work was supported by the National Transgenic Major Program of China (2016ZX08004001) and the Agricultural Science and Technology Innovation Program (ASTIP) of Chinese Academy of Agricultural Sciences.
Footnotes
Abbreviations
GMO, genetically modified organism; NGS, next-generation sequencing; PCR, polymerase chain reaction; WGS, whole genome sequencing.
References
Akritidis, P., Pasentsis, K., Tsaftaris, A. S., Mylona, P. V., and Polidoros, A. N. (2008). Identification of unknown genetically modified material admixed in conventional cotton seed and development of an event-specific detection method. Electron. J. Biotechnol. 11, 76–83. doi: 10.2225/vol11-issue2-fulltext-11
Arne, H. J., Yves, B., Marc, D. L., Lutz, G., Sandrine, H., Lotte, H., et al. (2012). Detecting un-authorized genetically modified organisms (GMOs) and derived materials. Biotechnol. Adv. 30, 1318–1335. doi: 10.1016/j.biotechadv.2012.01.024
Buermans, H. P. J., and Dunnen, J. T. D. (2014). Next generation sequencing technology: advances and applications. Biochim. Biophys. Acta 1842, 1932–1941. doi: 10.1016/j.bbadis.2014.06.015
Campbell, P. J., Stephens, P. J., Pleasance, E. D., O’Meara, S., Li, H., Santarius, T., et al. (2008). Identification of somatically acquired rearrangements in cancer using genome-wide massively parallel paired-end sequencing. Nat. Genet. 40, 722–729. doi: 10.1038/ng.128
Codex Alimentarius Commission (2003). Guideline for the conduct of food safety assessment of foods derived from recombinant-DNA plants. CAC/GL 45, 1–18.
Daniela, W., Leif, S., Joachim, B., and Lutz, G. (2013). Next-generation sequencing as a tool for detailed molecular characterization of genomic insertions and flanking regions in genetically modified plants: a pilot study using a rice event unauthorized in the EU. Food Anal. Method 6, 1718–1727. doi: 10.1007/s12161-013-9673-x
DuBose, A. J., Lichtenstein, S. T., Narisu, N., Bonnycastle, L. L., Swift, A. J., Chines, P. S., et al. (2013). Use of microarray hybrid capture and next-generation sequencing to identify the anatomy of a transgene. Nucleic Acids Res. 41:e70. doi: 10.1093/nar/gks1463
European Food Safety Authority [EFSA] (2010). Guidance on the environmental risk assessment of genetically modified plants. EFSA J. 8:1879.
Fraiture, M. A., Herman, P., Lefèvre, L., Taverniers, I., De Loose, M., Deforce, D., et al. (2015a). Integrated DNA walking system to characterize a broad spectrum of GMOs in food/feed matrices. BMC Biotechnol. 15, 1–11. doi: 10.1186/s12896-015-0191-3
Fraiture, M. A., Herman, P., Taverniers, I., De Loose, M., Deforce, D., Roosens, N.H., et al. (2015b). Current and new approaches in GMO detection: challenges and solutions. Biomed. Res. Int. 2015:392872. doi: 10.1155/2015/392872
Fullwood, M. J., Wei, C. L., Liu, E. T., and Ruan, Y. J. (2009). Next-generation DNA sequencing of paired-end tags (PET) for transcription and genome analyses. Genome Res. 19, 521–532. doi: 10.1101/gr.074906.107
Guo, B. F., Guo, Y., Hong, H. L., Jin, L. G., Zhang, L. J., Chang, R. Z., et al. (2015a). Co-expression of G2-EPSPS and glyphosate acetyltransferase GAT genes conferring high tolerance to glyphosate in soybean. Front. Plant Sci. 6:847. doi: 10.3389/fpls.2015.00847
Guo, B. F., Guo, Y., Wang, J., Zhang, L. J., Jin, L. G., Hong, H. L., et al. (2015b). Co-treatment with surfactant and sonication significantly improves Agrobacterium-mediated resistant bud formation and transient expression efficiency in soybean. J. Integr. Agr. 14, 1242–1250. doi: 10.1016/S2095-3119(14)60907-2
Hormozdiari, F., Hajirasouliha, I., Mcpherson, A., Eichler, E., and Sahinalp, S. C. (2011). Simultaneous structural variation discovery among multiple paired-end sequenced genomes. Genome Res. 21, 2203–2212. doi: 10.1101/gr.120501.111
Inagaki, S., Henry, I. M., Lieberman, M. C., and Comai, L. (2015). High-throughput analysis of T-DNA location and structure using sequence capture. PLoS ONE 10:e0139672. doi: 10.1371/journal.pone.0139672
James, C. (2015). 20th Anniversary (1996 to 2015) of the Global Commercialization of Biotech Crops and Biotech Crop Highlights in 2015. ISAAA Brief No. 51. Ithaca, NY: ISAAA.
Ji, J. B., and Braam, J. (2010). Restriction site extension PCR: a novel method for high-throughput characterization of tagged DNA fragments and genome walking. PLoS ONE 5:e10577. doi: 10.1371/journal.pone.0010577
Kim, K. D., Shin, J. H., Van, K., Kim, D. H., and Lee, S. H. (2009). Dynamic rearrangements determine genome organization and useful traits in soybean. Plant Physiol. 151, 1066–1076. doi: 10.1104/pp.109.141739
Kok, E. J., Pedersen, J., Onori, R., Sowa, S., Schauzu, M., Schrijver, S., et al. (2015). Plants with stacked genetically modified events: to assess or not to assess. Trends Biotechnol. 32, 70–73. doi: 10.1016/j.tibtech.2013.12.001
Kovalic, D., Garnaat, C., Guo, L., Yang, Y. P., Groat, J., Silvanovich, A., et al. (2012). The use of next generation sequencing and junction sequence analysis bioinformatics to achieve molecular characterization of crops improved through modern biotechnology. Plant Genome 5, 149–163. doi: 10.3835/plantgenome2012.10.0026
Langmead, B., and Salzberg, S. L. (2012). Fast gapped-read alignment with Bowtie 2. Nat. Methods 9, 357–359. doi: 10.1038/nmeth.1923
Lepage, E., Zampini, E., Boyle, B., and Brisson, N. (2013). Time and cost-efficient identification of T-DNA insertion sites through targeted genomic sequencing. PLoS ONE 8:e70912. doi: 10.1371/journal.pone.0070912
Liang, C. J., Vandijk, J. P., Scholtens, I. M. J., Staats, M., Prins, T. W., Voorhuijzen, M. M., et al. (2014). Detecting authorized and unauthorized genetically modified organisms containing vip3A by real-time PCR and next-generation sequencing. Anal. Bioanal. Chem. 406, 2603–2611. doi: 10.1007/s00216-014-7667-1
Liu, Y. G., Mitsukawa, N., Oosumi, T., and Whittier, R. F. (1995). Efficient isolation and mapping of Arabidopsis thaliana T-DNA insert junctions by thermal asymmetric interlaced PCR. Plant J. 8, 457–463. doi: 10.1046/j.1365-313X.1995.08030457.x
Monsanto Company (2000). Updated Molecular Characterization and Safety Assessment of Roundup Ready® Soybean Event 40-3-2. Confidential Report MSL-16712, St. Louis, MO, 1–20.
Ochman, H., Gerber, A. S., and Hartl, D. L. (1988). Genetic applications of an inverse polymerase chain reaction. Genetics 120, 621–623.
O’Malley, R. C., and Ecker, J. R. (2010). Linking genotype to phenotype using the Arabidopsis unimutant collection. Plant J. 61, 928–940. doi: 10.1111/j.1365-313X.2010.04119.x
Padgette, S. R., Kolace, K. H., Delannay, D. B. R., LaVallee, B. J., Tinius, C. N., Rhodes, W. K., et al. (1995). Development, identification, and characterization of a glyphosate tolerant soybean line. Crop Sci. 35, 1451–1461. doi: 10.2135/cropsci1995.0011183X003500050032x
Park, D., Kim, D. G., Jang, G., Lim, J. S., Shin, Y. J., Kin, J., et al. (2015). Efficiency to discovery transgenic loci in GM rice using next generation sequencing whole genome re-sequencing. Genomics Inform. 13, 81–85. doi: 10.5808/GI.2015.13.3.81
Pauwels, K., DeKeersmaecker, S. C. J., DeSchrijver, A., Jardin, P. D., Roosens, N. H. C., and Herman, P. (2015). Next-generation sequencing as a tool for the molecular characterization and risk assessment of genetically modified plants: add value or not. Trends Food Sci. Technol. 45, 319–326. doi: 10.1016/j.tifs.2015.07.009
Porebski, S., Bailey, L. G., and Baum, B. R. (1997). Modification of a CTAB DNA extraction protocol for plants containing high polysaccharide and polyphenol components. Plant Mol. Biol. Rep. 15, 8–15. doi: 10.1007/BF02772108
Rosalind, W. C., Nicholas, S., Susan, B., Tiffany, K., David, B. S., Rita, A. M., et al. (2010). Use of Illumina sequencing to identify transposon insertion underlying mutant phenotypes in high-copy Mutator lines of maize. Plant J. 63, 167–177.
Schmutz, J., Cannon, S. B., Schlueter, J., Ma, J., Mitros, T., Nelson, W., et al. (2010). Genome sequence of the palaeopolyploid soybean. Nature 463, 178–183. doi: 10.1038/nature08670
Spalinskas, R., Bulcke, M. V. D., Eede, G. V. D., and Milcamps, A. (2013). LT-RADE: an efficient user-friendly genome walking method applied to the molecular characterization of the insertion site of genetically modified maize MON810 and rice LLRICE62. Food Anal. Method 6, 705–713. doi: 10.1007/s12161-012-9438-y
Urbanski, D. F., Malolepszy, A., Stougaard, J., and Andersen, S. U. (2012). Genome wide LORE1 retrotransposon mutagenesis and high throughput insertion detection in Lotus japonicas. Plant J. 69, 731–741. doi: 10.1111/j.1365-313X.2011.04827.x
Wang, X. B., Jiang, L. X., Wei, L., Liu, L., Lu, W., Li, W. X., et al. (2010). Integration and insertion site of EPSPs gene on the soybean genome in genetically modified glyphosate-resistant soybean. Acta. Agron. Sin. 36, 365–375. doi: 10.3724/SP.J.1006.2010.00365
Willems, S., Fraiture, M. A., Deforce, D., DeKeersmaecker, S. C. J., DeLoose, M., Ruttink, T., et al. (2016). Statistical framework for detection of genetically modified organisms based on next generation sequencing. Food Chem. 192, 788–798. doi: 10.1016/j.foodchem.2015.07.074
Windels, P., Taverniers, I., Depicker, A., Van Bockstaele, E., and De Loose, M. (2001). Characterisation of the roundup ready soybean insert. Eur. Food Res. Technol. 213, 107–112. doi: 10.1007/s002170100336
Yang, L., Xu, S., Pan, A., Yin, C., Zhang, K., Wang, Z., et al. (2005). Event specific qualitative and quantitative polymerase chain reaction detection of genetically modified MON863 maize based on the 5′-transgene integration sequence. J. Agric. Food Chem. 53, 9312–9318. doi: 10.1021/jf051782o
Keywords: insertion site, flanking sequence, whole genome sequencing, transgenic soybean, next generation sequencing
Citation: Guo B, Guo Y, Hong H and Qiu L-J (2016) Identification of Genomic Insertion and Flanking Sequence of G2-EPSPS and GAT Transgenes in Soybean Using Whole Genome Sequencing Method. Front. Plant Sci. 7:1009. doi: 10.3389/fpls.2016.01009
Received: 25 March 2016; Accepted: 27 June 2016;
Published: 12 July 2016.
Edited by:
Sagadevan G Mundree, Queensland University of Technology, AustraliaReviewed by:
Graham Bonnett, Commonwealth Scientific and Industrial Research Organisation, AustraliaAlice Hayward, University of Queensland, Australia
Copyright © 2016 Guo, Guo, Hong and Qiu. This is an open-access article distributed under the terms of the Creative Commons Attribution License (CC BY). The use, distribution or reproduction in other forums is permitted, provided the original author(s) or licensor are credited and that the original publication in this journal is cited, in accordance with accepted academic practice. No use, distribution or reproduction is permitted which does not comply with these terms.
*Correspondence: Li-Juan Qiu, qiulijuan@caas.cn
†These authors have contributed equally to this work.