 Mingyang Quan1,2†
 Qingshi Wang1,2†
 Souksamone Phangthavong1,2†Xiaohui Yang1,2Yuepeng Song1,2Qingzhang Du1,2
 Deqiang Zhang1,2*
- 1National Engineering Laboratory for Tree Breeding, College of Biological Sciences and Technology, Beijing Forestry University, Beijing, China
- 2Key Laboratory of Genetics and Breeding in Forest Trees and Ornamental Plants, Ministry of Education, College of Biological Sciences and Technology, Beijing Forestry University, Beijing, China
MicroRNAs (miRNAs) regulate gene expression in many biological processes, but the significance of the interaction between a miRNA and its targets in perennial trees remains largely unknown. Here, we employed transcript profiling and association studies in Populus tomentosa (Pto) to decipher the effect of genetic variation and interactions between Pto-miR156c and its potential targets (Pto-SPL15, Pto-SPL20, and Pto-SPL25) in 435 unrelated individuals from a natural population of P. tomentosa. Single-SNP (single-nucleotide polymorphism) based association studies with analysis of the underlying additive and dominant effects identified 69 significant associations (P < 0.01), representing 51 common SNPs (minor allele frequency > 0.05) from Pto-MIR156c and its three potential targets, with six wood and growth traits, revealing their common roles in wood formation. Epistasis analysis uncovered 129 significant SNP-SNP associations with ten traits, indicating the potential genetic interactions of Pto-MIR156c and its three putative targets. Interestingly, expression analysis in stem (phloem, cambium, and xylem) revealed that Pto-miR156c expression showed strong negative correlations with Pto-SPL20 (r = −0.90, P < 0.01) and Pto-SPL25 (r = −0.65, P < 0.01), and a positive correlation with Pto-SPL15 (r = 0.40, P < 0.01), which also indicated the putative interactions of Pto-miR156c and its potential targets and their common roles in wood formation. Thus, our study provided an alternative approach to decipher the interaction between miRNAs and their targets and to dissect the genetic architecture of complex traits in trees.
Introduction
MicroRNAs (miRNAs)are small non-coding RNAs (20–24 nt) that function in gene regulation as sequence-specific regulators, via post-transcriptional mRNA cleavage or inhibition of gene expression in eukaryotes (Voinnet, 2009). In plants, miRNAs have influential roles in development (Rubio-Somoza and Weigel, 2011) and resistance to stresses such as drought and salinity (Frazier et al., 2011; Kruszka et al., 2012). Thus, studying miRNAs can provide important information on the mechanisms of morphological and physiological changes in response to the changeable environment in plants and for the genetic improvement of crops and forest trees (Kruszka et al., 2012; Zhou and Luo, 2013).
With the development of high-throughput sequencing technologies, many miRNAs have been identified in a range of plant species (Kozomara and Griffiths-Jones, 2014). Of these, microRNA-156 (miR156) has been well characterized in a number of plants, such as Arabidopsis thaliana (Wu and Poethig, 2006) and maize (Zea mays) (Mica et al., 2006). In Arabidopsis and maize, miR156 functions in shoot maturation during the juvenile to adult transition, and is highly expressed in early shoot development but decreases after this stage. Also, the juvenile to adult phase was delayed when miR156 was overexpressed (Wu and Poethig, 2006; Chuck et al., 2007). The prolonged vegetative phase caused by overexpression of miR156 mainly depends on negative regulation of the expression of SQUAMOSA PROMOTER-BINDING PROTEIN-LIKE genes (SPLs). The SPLs encode a plant-specific transcription factor family that plays pivotal roles throughout different stages of plant development (Birkenbihl et al., 2005); for example, AtSPL2, AtSPL10, and AtSPL11 function in morphological regulation of cauline leaves and flowers during the Arabidopsis reproductive phase (Shikata et al., 2009).
In addition to the regulation of phase transition, the miR156-SPL network also functions in root development, nodulation, and stress tolerance in plants (Xie et al., 2012; Cui et al., 2014; Aung et al., 2015). For example, in Arabidopsis and rice (Oryza sativa), miR156 was highly expressed under salt and drought treatment, which reduced the expression of SPL9, thus increasing the expression of DFR (DIHYDROFLAVONOL-4-REDUCTASE) and PAP1 (PRODUCTION OF ANTHOCYANIN PIGMENT 1) to reinforce the accumulation of anthocyanin, leading to enhanced stress tolerance of plants (Cui et al., 2014). Over-expressing miR156 in Populus canadensis also prolonged the vegetative phase of trees by down-regulating the miR156 target genes SPL3 and SPL9, causing phenotypic changes in leaf morphology and internode length (Wang et al., 2011).
Perennial trees have large sizes and long growth cycles; they need to adapt to changeable environmental conditions over many years. Trees also provide timber resources and many ecosystem services (Neale and Kremer, 2011). The dissection of the genetic regulatory networks for traits with complex genetic architecture, such as tree growth and wood properties, may inform efforts to improve economically and ecologically important properties. However, the interactions of the components of this system and the effect of genetic variation of the miR156-SPL regulatory system on tree growth and wood properties remain unclear. P. trichocarpa has 28 SPL genes that show diverse expression patterns in different tissues and organs, indicating that they may function in different biological processes in trees (Li and Lu, 2014). The regulatory mechanisms and expression patterns of the miR156-SPL module in tree growth and wood formation remain unknown.
In perennial woody plants, a few studies have used transgenic methods to examine the roles of miRNAs. For example, Lu et al. (2013) used transgenic P. trichocarpa lines over-expressing miR397 to show that miR397a negatively regulates laccase in lignin biosynthesis. However, trees have long generation times and lack characterized mutants, which hinders transgenic approaches aiming to clarify the functions of miRNA-mRNA interactions. However, single nucleotide polymorphism (SNP)-based association mapping provides an alternative, feasible strategy for deciphering the natural allelic variation of genes responsible for specific traits in trees (Sexton et al., 2012). For example, candidate gene-based association studies have identified several major SNPs within candidate genes associated with tree growth and wood property traits in Eucalyptus nitens and Populus (Thumma et al., 2005; Tian et al., 2012). Moreover, SNP-based association studies in humans identified SNPs in miRNA genes associated with diseases; also, SNPs in miRNA genes could alter miRNA secondary structure and influence miRNA expression levels (Duan et al., 2007; Rawlings-Goss et al., 2014).
Recently, SNP-based association mapping has emerged as a feasible way to exploring the genetic effect of miRNA-mRNA interactions on phenotypic variation. For instance, Yang et al. (2015) identified SNPs in the Pto-MIR530a gene and its target and evaluated their interactions and effects on tree growth and wood properties in P. tomentosa. In addition, epistasis modeling can detect the mutual effects of SNPs in multiple genes, providing the evidence to evaluate the complex relationships among genes (Roguev et al., 2008; Du et al., 2015), thus identifying the miRNA-mRNA interaction network that affects phenotypic variation.
In P. trichocarpa, the miR156 family consists of 12 members, and Ptc-MIR156c exhibited high abundance in xylem (Kozomara and Griffiths-Jones, 2014), indicating that miR156c might function in wood formation in trees. Here, in P. tomentosa (Pto), a genetically close species to P. trichocarpa (Ptc), we first measured the expression levels of 12 members in Pto-MIR156 family, which showed that Pto-MIR156c expressed high in vascular tissue (developing xylem, mature xylem, cambium, and phloem), suggesting that this miRNA might play vital roles in the regulation of wood formation in trees. We further cloned the Pto-MIR156c gene and identified Pto-SPL15, Pto-SPL20, and Pto-SPL25 as the potential targets of Pto-miR156c via bioinformatics prediction and degradome sequencing. We test the expression levels of Pto-MIR156c and mature miR156, which revealed a significant positive correlation. Then, we deciphered the genetic variations and interactions of Pto-miR156c and its putative targets associated with tree growth and wood property traits, using SNP-based association mapping with underlying additive, dominant, and epistasis effects in a natural population of 435 unrelated individuals of P. tomentosa. Single-SNP-based association mapping identified SNPs within Pto-MIR156c and its putative targets significantly associated with tree growth and wood properties. Combined with expression pattern analysis of Pto-MIR156c and its potential targets, this reveals their common roles in wood formation. We also detected the SNPs in the pre-miRNA (precursor miRNA) region of Pto-MIR156c that affected the stability of its secondary structure. In addition, epistasis modeling provided evidence for the interaction of Pto-miR156c and its potential targets. Thus, our study provided a better understanding of miR156-SPL regulatory network in tree growth and wood formation and raised an alternative method for dissecting the genetic variation and interactions of miRNAs and mRNAs in population genetics of trees.
Materials and Methods
Population and Phenotypic Data
The association population was composed of 435 unrelated individuals, selected from 1047 individuals of the P. tomentosa collection established in Guan Xian Country (Shandong province, China, 36°23′N, 115°47′E) in 1982, using a randomized complete block design approach with three clonal replications, covering almost all the natural distribution of P. tomentosa, i.e., the southern, northwestern, and northeastern regions of China (30–40°N, 105–125°E) (Du et al., 2012). In addition, 43 unrelated individuals, representing almost the entire range of native P. tomentosa, selected from the association population were used to identify SNPs within candidate genes.
Three growth traits and seven wood property traits were measured with at least three replications per genotype and these data were used for association analysis. The three growth traits were: tree height (H, m), diameter at breast height (DBH, cm), and stem volume (V, m3). The seven wood properties were: holocellulose content (HC, %), α-cellulose content (CC, %), lignin content (LC, %), hemicellulose content (HEC, %), fiber width (FW, μm), fiber length (FL, mm), and microfibril angle (MFA, °). The detailed measurement methods and correlations of these phenotypic data for 435 genotypes were described previously (Du et al., 2014).
Identification of Pto-MIR156c and Three Potential Targets of Pto-miR156c
The primary sequence of Pto-MIR156c was cloned based on the sequence of Ptc-MIR156c from P. trichocarpa (Kozomara and Griffiths-Jones, 2014), containing the pre-miRNA sequence and 300 bp flanking regions on each side of the pre-miRNA region, using gene-specific primers. Two screening methods, psRNATarget prediction and degradome sequencing, were used to determine the target genes of Pto-miR156c. psRNATarget (http://plantgrn.noble.org/psRNATarget/) was used to predict the targets of Pto-miR156c using 3000 complementary DNA (cDNA) sequences from a mature xylem cDNA library of P. tomentosa. This cDNA library was constructed with the Superscript λ System (Life Technology, Carlsbad, CA, USA) with the manufacturer's instructions and consisted of 5.0 × 10⁶ pfu with an insert size of 1.0–4.0 kb (Li et al., 2009). Then, random end-sequencing of 3000 cDNA clones from this cDNA library were used for further analysis. In addition, we employed P. tomentosa degradome sequencing (described below), a high-throughput sequencing method which is widely used for verifying the regulatory relationship of miRNAs and mRNAs, to identify the miRNA cleavage sites. After filtering by these two screening approaches, the target genes of Pto-miR156c were determined and the full-length cDNAs of target genes were isolated from the 3000 cDNA clones.
Degradome Sequencing
Total RNA of six tissues (leaf, shoot apex, phloem, cambium, developing xylem, and mature xylem) was extracted using the Plant Qiagen RNeasy kit (Qiagen China, Shanghai) following the manufacturer's instructions. Additional, on-column DNase digestions were applied using RNase-Free DNase Set (Qiagen) during the RNA purification and the RNA integrity was confirmed on an agarose gel. The total RNA samples from the six tissues were pooled together in equal amounts, which were used to construct degradome libraries according to the methods described previously (Shamimuzzaman and Vodkin, 2012). Briefly, a 5′ RNA adapter, which possesses a free 5′-monophosphate at the 3′ terminus, was added to the cleavage products using T4 RNA ligase (Ambion). Then the ligated products were purified and reverse transcribed using an oligo dT primer by SuperScript II RT (Invitrogen). The resulting cDNA was amplified for 6 cycles (94°C for 30 s, 60°C for 20 s, and 72°C for 3 min), and then the PCR products were digested with MmeI and ligated to a 3′ double adapter. Finally, the ligation products were amplified, gel-purified, and used for sequencing-by-synthesis with the Illumina HiSeq2000. The CleaveLand pipeline (Addo-Quaye et al., 2009) was used to analyze the miRNA cleavage sites based on the P. trichocarpa genome transcripts (V3.0) (SRX1447192).
Tissue-Specific Expression Analysis
Seven fresh tissues, including young leaf, old leaf, shoot apex, phloem, cambium, developing xylem, and mature xylem, were sampled from 1-year-old P. tomentosa clone “LM50.” Total RNAs from these fresh tissues were extracted using the methods described above. Then, cDNAs for the seven tissues were synthesized with the Plant Qiagen RNasey Kit, and these cDNAs were used for testing the tissue-specific expression of Pto-MIR156c and the three potential targets of miR156c. Small RNAs (< 200 nt) were isolated via the mirVana miRNA Isolation Kit (Ambion, USA) following the manufacturer's instructions, which were used for testing the expression levels of mature miRNA. Then, poly(A) tails were added to 3′ end of the small RNAs via poly(A) polymerase (Ambion), and the polyadenylated small RNAs were revised transcribed with oligo(dT) adapter (Ambion).
Reverse transcription quantitative PCR (RT-qPCR) was performed on a 7500 Fast Real-Time PCR System using the SYBR Premix Ex Taq (TaKaRa, Dalian, China). The gene-specific primers (Table S1) designed by Primer Express 3.0 software (Applied Biosystems) were used to determine the expression levels of 12 members (a-l) in Pto-MIR156 gene family, mature miR156, and its putative targets. All reactions were performed with triplicate technical and triplicate biological repetitions, with Actin (EF145577) as the internal control. The data were analyzed with the Opincon Monitor Analysis software 3.1 tool and the melting curve was used to check the specificity of the amplified fragments. The conditions for PCR were: 94°C for 5 min; 40 cycles of 94°C for 30 s, 58°C for 30 s, and 72°C for 30 s; and a final with 70–95°C for the melting curves, which were used to confirm the specificity of the amplification.
SNP Discovery and Genotyping
To identify SNPs, not including Indels (insertions/deletions), in Pto-MIR156c and its three potential targets (i.e., Pto-SPL15, Pto-SPL20, and Pto-SPL25), the full-length genomic regions of the four genes were sequenced, using gene-specific primers designed based on the cDNA clones of the three genes, and analyzed in 43 unrelated individuals randomly selected from the P. tomentosa association population. The clone and PCR amplification procedures were according to Zhang et al. (2011). The BigDye Terminator Cycle Sequencing kit (version 3.1, Applied Biosystems, Beijing, China) and the 4300 DNA Analyzer (Li-Cor Biosciences, Lincoln, NE, USA) were used for sequencing of candidate genes. Using the DNeasy Plant Mini Kit (Qiagen China, Shanghai), genomic DNA was extracted from fresh leaf tissue of the 43 P. tomentosa individuals and used as DNA amplification templates.
Sequences of Pto-MIR156c, Pto-SPL15, Pto-SPL20, and Pto-SPL25 in the 43 individuals have been deposited in GenBank under the accession numbers KX080106—KX080148, KX079977—KX080019, KX080020—KX080062, and KX080063—KX080105, respectively. MEGA 5.0 (Tamura et al., 2011) was used for sequence alignment and SNP identification, and DnaSP 5.10 (Librado and Rozas, 2009) was employed to evaluate the nucleotide diversity. Then, all the common SNPs (minor allele frequency (MAF) > 0.05) identified were genotyped in the 435 individuals from the association population using the Beckman Coulter (Franklin Lakes, NJ, USA) sequencing system.
Data Analysis
Linkage Disequilibrium (LD) Analysis
The squared correlation of allele frequencies (r2) between each pair of common SNPs (MAF > 0.05) within Pto-MIR156c, Pto-SPL15, Pto-SPL20, and Pto-SPL25, was used to assess the extent of LD using TASSEL v. 5.0 (Bradbury et al., 2007). The decay of LD with distance in base pairs (bp) between SNPs was evaluated by non-linear regression with 105 permutations of the data (Remington et al., 2001), and singletons were excluded in LD analyses.
Single SNP-Based Association Analysis
The mixed linear model (MLM) in TASSEL v.5.0 (Bradbury et al., 2007) was used for single SNP-based association in the association population. The MLM was: y = μ + Qv + Zu + e, with y denoting a vector of phenotypic observations, μ denoting the intercepts vector, v denoting a vector for population effects, u denoting the vector of random polygenic background effects, e denoting random experimental error, Q matrixes defining the population structure, and Z being the matrixes relating y to u. In addition, we used the estimated membership probability (Q) and pairwise kinship (K) to evaluate the population structure and relatedness, respectively, among individuals for marker-trait associations. The K matrix was assessed by SPAGeDi 1.3 (Hardy and Vekemans, 2002) based on 20 species-specific SSR markers (Du et al., 2012), and the Q matrix was evaluated based on significant subpopulations (k = 3) according to the statistical model described by Evanno et al. (2005) via STRUCTURE V.2.3.4 (Patterson et al., 2006). Finally, the positive false discovery rate (FDR) was used for correcting multiple tests, using QVALUE running in R (Storey and Tibshirani, 2003).
Haplotype-Based Association Analysis
Haplotype trend regression (HTR) analysis was conducted to estimate the haplotype frequencies from the genotype data on a three-marker sliding window and test the haplotype-based associations (Zaykin et al., 2002). The significance of haplotype-based associations was based on 104 permutation tests, and singleton alleles and haplotypes with frequencies less than 0.05 were discarded in this analysis.
Multi-SNP Based Epistasis Analysis
A multifactor dimensionality reduction (MDR) algorithm (Hahn et al., 2003), which processed high-dimensionality genetic data into a single dimension so that the interactions could be detected in a relatively small set, was used to dissect the epistatic effects (non-additive interactions) among SNPs. In MDR 3.0.2, the ReliefF algorithm, which improves the reliability of probability approximation, filtered all unlinked SNPs (r2 < 0.1 or different genes), and produced the five most-significant SNPs for each trait. In addition, the genetic effects of significant SNP-SNP pairs were evaluated by information gain (IG), calculated by entropy-based measure (Moore et al., 2006).
Transcript Analysis of SNP Genotypes
RT-qPCR was conducted to test the effect of different genotypes of SNPs from Pto-MIR156c and its potential targets on transcript abundances in mature xylem. Ten individuals for each genotype of every SNP were randomly selected from the association population, and the RT-qPCR was performed as described above. Differential expression across different genotypic pairs was evaluated by ANOVA.
Results
Identification of Pto-MIR156c and Three Potential Targets of Pto-miR156c
To examine the expression patterns of Pto-MIR156 gene family in different tissues and organs, we first measured the expression abundance of 12 members in Pto-MIR156 family, which showed that Pto-MIR156c exhibited high abundance in vascular tissue (developing xylem, mature xylem, cambium, and phloem), indicating that Pto-miR156c might function in wood formation of trees (Figure S1). Then, to identify SNPs in Pto-MIR156c, we cloned the primary sequence of Pto-MIR156c gene based on the sequence of the P. trichocarpa homolog Ptc-MIR156c in miRbase. The sequencing yielded the 700-bp genomic sequence of the Pto-MIR156c primary transcript, including 100 bp of pre-miRNA sequence, the 20-bp mature miRNA, and 300 bp of flanking sequence on each side of the pre-miRNA region. Prediction of the secondary structure for the Pto-MIR156c pre-miRNA sequence by RNAfold analysis revealed a typical hairpin structure, confirming that Pto-miR156c is a miRNA. Comparison of the Pto-MIR156c pre-miRNA sequence with homologous miRNAs in P. trichocarpa, Oryza sativa, Zea mays, and Arabidopsis thaliana revealed that the mature region of these miRNAs were completely conserved, despite the diverse degrees of similarity (52.32–100%) in the pre-miRNA region (Figure 1A).
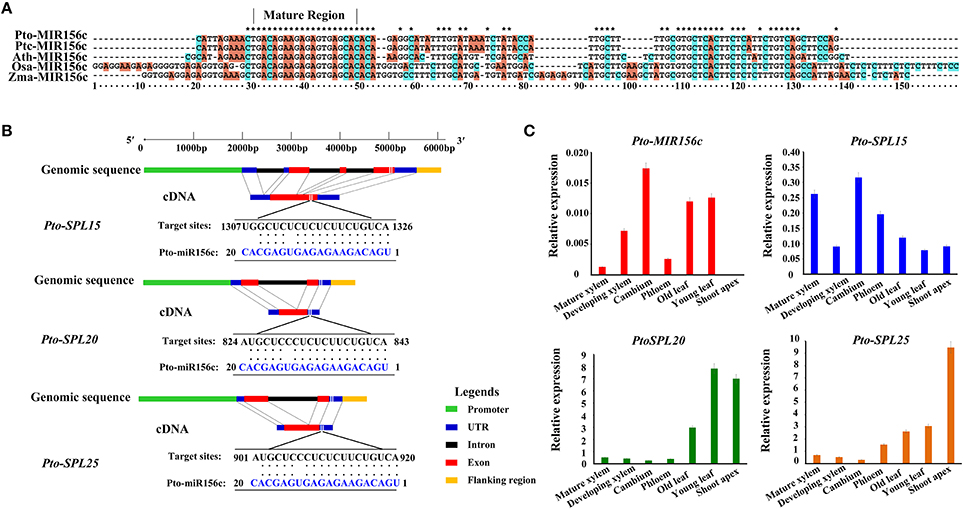
Figure 1. Characterization of Pto-miR156c and its three potential targets and expression analysis of Pto-MIR156c, Pto-SPL15, Pto-SPL20, and Pto-SPL25. (A) The alignment result for pre-miRNA region of MIR156c gene among the species of P. tomentosa (Pto), P. trichocarpa (Ptc), A. thaliana (Ath), O. sativa (Osa), and Z. mays (Zma). The asterisks indicated the nucleotides in the five species are conserved. (B) The gene structures of Pto-SPL15, Pto-SPL20, and Pto-SPL25, and the Pto-miR156c target sites determined by degradome sequencing. (C) The relative expression levels (arbitrary units normalized to control) of Pto-MIR156c and its three potential targets in seven tissues, including mature xylem, developing xylem, cambium, phloem, old leaf, young leaf, and shoot apex, conducted by RT-qPCR with Actin as the internal control.
We further used the 20-nt mature sequence and psRNATarget to identify 56 potential target genes of Pto-miR156c, and degradome sequencing to detect the most likely cleavage sites in the three putative target genes (Figures S2–S4). After filtering with two screening methods, three full-length cDNAs, Pto-SPL15, Pto-SPL20, and Pto-SPL25, were identified as target genes of Pto-miR156c. The cDNA sequences of Pto-SPL15, Pto-SPL20, and Pto-SPL25 isolated from a cDNA library from P. tomentosa mature xylem showed that Pto-SPL15, Pto-SPL20, and Pto-SPL25 were 1850, 1061, and 1159 bp in length encoding proteins of 328, 196, and 242 amino acids, respectively, and these proteins contain the conserved SBP (SQUAMOSA-PROMOTER BINDING PROTEIN) domain. The encoded proteins also showed high amino acid sequence similarity to the proteins encoded by their P. trichocarpa homologs Ptc-SPL15 (84.15%), Ptc-SPL20 (97%), and Ptc-SPL25 (74.26%) (Figure 1B).
Expression Profiles of Pto-MIR156c and the Three Potential Targets of Pto-miR156c
To test the tissue-specific expression and expression patterns of Pto-MIR56c and its three putative targets, we used RT-qPCR to measure transcript abundance in seven different tissues and organs of P. tomentosa. The results revealed that Pto-MIR156c is expressed in all examined tissues except the shoot apex, and the transcripts of Pto-SPL15, Pto-SPL20, and Pto-SPL25 were also present in the seven tissues and organs, with varied abundance (Figure 1C). For Pto-MIR156c, the expression peaked in cambium, followed by young leaf, and the lowest abundance was observed in mature xylem, except for shoot apex. Pto-SPL15, Pto-SPL20, and Pto-SPL25 predominantly expressed in cambium, young leaf, and shoot apex, respectively. By contrast, Pto-SPL15 had lower abundance in young leaf, and Pto-SPL20 and Pto-SPL25 were poorly expressed in cambium. Then, we measured the expression levels of mature miR156 in the seven tissues and organs, which showed a significant positive correlation with Pto-MIR156c (r = 0.90, P < 0.05) (Figure S5). Interestingly, the expression correlation analysis revealed that the expression levels of Pto-MIR156c and the three putative targets (Pto-SPL15, Pto-SPL20, and Pto-SPL25) exhibited weak or no correlation (r = 0.17, −0.04, and −0.42, respectively, P < 0.05) in the seven tissues and organs. However, in stem, including phloem, cambium, developing xylem, and mature xylem, the transcript levels of Pto-MIR156c and Pto-SPL15 (r = 0.40, P < 0.05) showed a significant positive correlation, and Pto-MIR156c and the two other targets showed significant, strong negative correlations [r(Pto-SPL20) = −0.90, r(Pto-SPL25) = −0.65]. These results indicated that the miR156c-SPL network in P. tomentosa may participate in the regulation of wood formation.
Nucleotide Diversity and LD in Pto-MIR156c and the Three Potential Targets of Pto-miR156c
To identify polymorphisms for association studies, we sequenced the genomic regions of the four genes in 43 unrelated individuals from the association population. For Pto-MIR156c, we detected 24 SNPs with an average density of 1/27 bp (π = 0.01139 and θw = 0.00792). The mature region had no SNPs, indicating that the mature region was the most conserved, and the pre-miRNA region had two SNPs, a frequency of 1/50 bp (π = 0.01023 and θw = 0.00468). In addition, we identified 370 SNPs in Pto-SPL15, Pto-SPL20, and Pto-SPL25 with frequencies of 1/37, 1/31, 1/71, respectively (Table 1 and Table S2). Within the coding regions of Pto-SPL15, Pto-SPL20, and Pto-SPL25, the average synonymous diversity (dS) was higher than the non-synonymous diversity (dN) with the dN /dS ratio of < 1 (0.97, 0.92, and 0.35, respectively) for all exons, suggesting that the non-synonymous sites in the exon region experienced purifying selection.
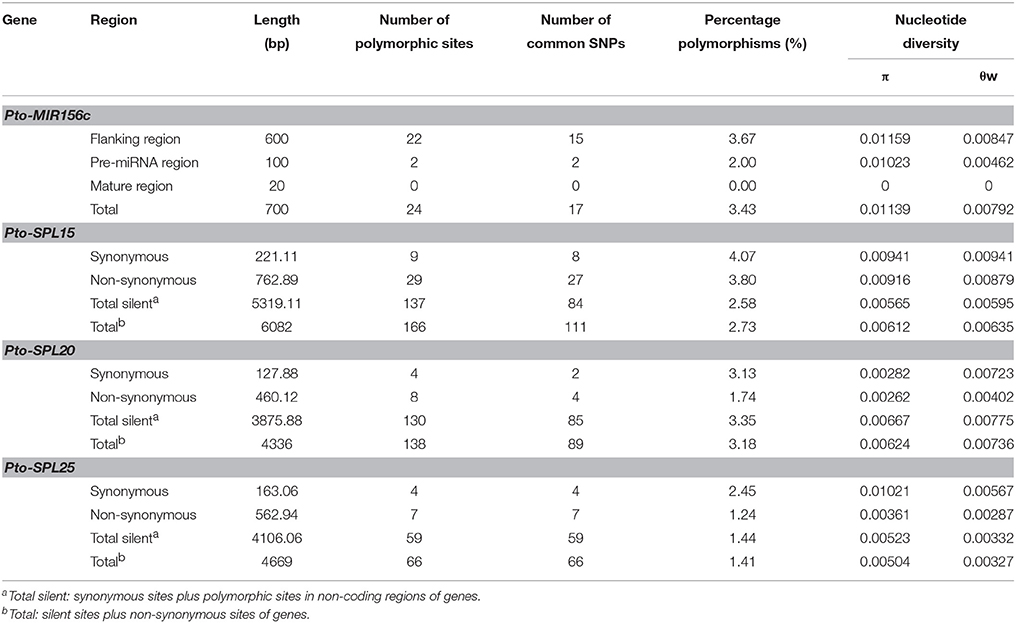
Table 1. Summary of single nucleotide polymorphisms of Pto-MIR156c and the three potential targets of Pto-miR156c.
To perform association studies, a set of 283 common SNPs (MAF > 0.05) from Pto-MIR156c and the three putative targets of Pto-miR156c were genotyped in 435 unrelated individuals of the association population (Table 1 and Table S3), of which 17 common SNPs were found in Pto-MIR156c, including 2 in the pre-miRNA region and 15 in the flanking region. Of the 263 common SNPs in three target genes, 80.52% were found in non-coding regions, including the promoter (41.20%), 5′/3′ UTRs (un-translated regions, 11.61%), intron (20.60%), and flanking region (500 bp downstream of the 3′ UTR, 11.38%) of the genes (Table S2). The remaining SNPs were in coding regions with 14.23% non-synonymous changes and 5.24% synonymous changes. The r2-values of all pairwise combinations, integrated with their physical distances, were used to evaluate the overall patterns of LD for Pto-MIR156c and the miRNA putative targets (Figure 2). We found that LD decayed rapidly with r2, declining to 0.1 within about 100–1500 bp for each gene, indicating that LD of Pto-MIR156c and the potential targets did not extend to the whole genes.
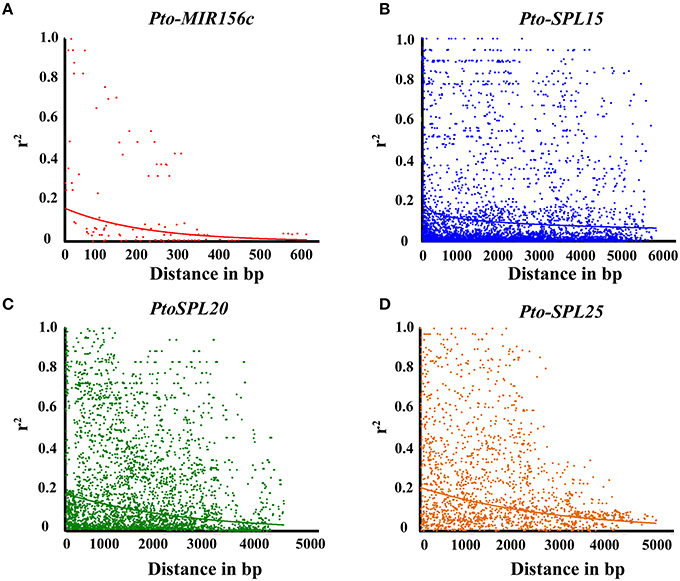
Figure 2. Linkage disequilibrium within Pto-MIR156c (A), Pto-SPL15 (B), Pto-SPL20 (C), and Pto-SPL25 (D). Pairwise correlations between SNPs are plotted against the physical distance between in base pairs. The curves indicate the non-linear regressions of r2 onto the physical distance in base pairs.
Genetic Effect of Allelic Variation in Pto-MIR156c and the Pto-miR156c Potential Targets Revealed by Association Studies
Single SNP-Based Association
To investigate the genetic effects of SNPs in Pto-MIR156c and the three potential targets of Pto-miR156c on tree growth and wood properties, we used MLM in TASSEL 5.0 to conduct 2830 association tests between 283 common SNPs from Pto-MIR156c and the putative targets and 10 traits (H, DBH, V, HC, HEC, CC, LC, FW, FL, and MFA). In total, we detected 69 significant associations (P < 0.01, Q < 0.1) representing 51 unique SNPs in Pto-MIR156c and the three putative targets and six traits with 2.79–19.32% of the phenotype variance (R2) explained by each SNP (Figure 3A, Table 2, and Table S4). For Pto-MIR156c, three SNPs significantly associated with HC and HEC, indicating the pivotal role of Pto-miR156c in wood formation. Pto-MIR156c-SNP9 and Pto-MIR156c-SNP10, located in the pre-miRNA region, associated with HEC with different phenotypic contributions and Pto-MIR156c-SNP4 in the flanking region associated with HC. In addition, 48 SNPs from Pto-SPL15, Pto-SPL20, and Pto-SPL25 significantly associated with six traits (DBH, V, FW, HEC, CC, and HC), and 16.67% of the SNPs showing associations were in coding regions (Table 2). The number of associations varied across trait categories (Table S4), with 51 for growth traits, 4 for wood composition, and 11 for wood physical properties, suggesting the vital roles of Pto-SPL15, Pto-SPL20, and Pto-SPL25 in tree growth and wood formation.
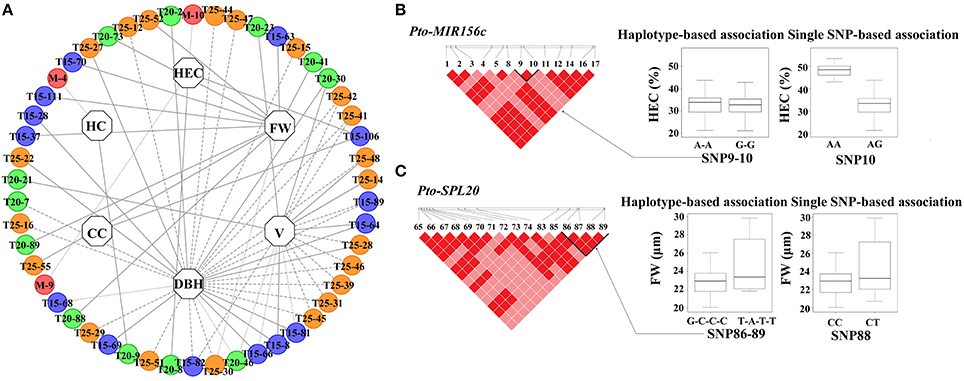
Figure 3. The single SNP-based associations with additive and dominant effects and the haplotype-based associations in the association population of P. tomentosa. (A) The single SNP-based associations between significant SNPs from Pto-MIR156c and its three potential targets and traits. The dashed lines represent the significant associations with additive effects, the dotted lines represent the significant associations with dominant effects, and the solid lines represent the associations with both additive and dominant effects. In addition, the circles with M (red), T15 (blue), T20 (green), and T25 (orange) markers (e.g., T15-63) in the outer lane indicate the associated SNPs from Pto-MIR156c, Pto-SPL15, Pto-SPL20, and Pto-SPL25, respectively. The inner lane represents the associated traits. (B,C) The genotypic effect for the significant haplotypes of Pto-MIR156c-SNP9-10 and Pto-SPL20-SNP86-89, along with the genotypic effect for the single locus of Pto-MIR156c-SNP10 and Pto-SPL20-SNP88, which is consistent with single SNP-based association.
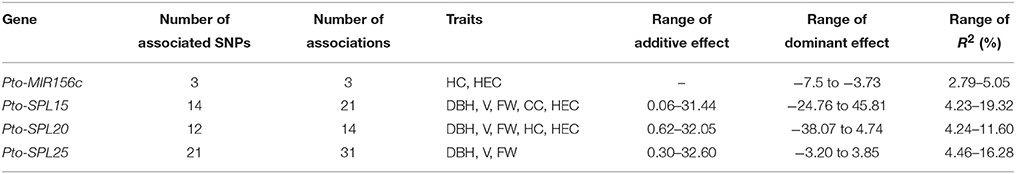
Table 2. Summary of significant SNPs within Pto-MIR156c and the three potential targets of Pto-miR156c associated with growth and wood properties in the association population of P. tomentosa.
Of the 69 SNP-trait associations, 86.96% showed additive effects, 57.97% showed dominant effects, and 44.93% showed combined additive and dominant effects (Figure 3A). In total, 60 significant associations were found to have an additive effect of 0.06–32.60 (Table 2). Among these, Pto-SPL25-SNP41 in the 5′ UTR associated with V and had the largest effect. Also, 32 SNPs within Pto-MIR156c and its potential targets associated with six traits with dominant effects ranging from −38.07 to 45.81, and positive and negative dominant values for half of the effects. Of these associations, Pto-SPL15-SNP64 in the promoter region associated with V had the largest positive dominant effect, and Pto-SPL20-SNP21, in an exon, caused a non-synonymous mutation of Ala to Gly, associated with V, and had the largest negative dominant effect (Table S4). Interestingly, 17 significant SNPs from Pto-MIR156c and the potential targets associated with more than one trait with disparate additive and/or dominant effects and phenotypic contributions to each trait (Figure 3A). In addition, each trait associated with 2-32 significant SNPs from Pto-MIR156c and its putative targets with different contributions to phenotypic variation, indicating that Pto-MIR156c and the three potential targets of Pto-miR156c may affect tree growth and wood properties in the same pathway.
Haplotype-Based Association
We also identified 65 common haplotypes (frequency > 0.05) from 32 high-LD blocks (r2 > 0.7, P < 0.001) within Pto-MIR156c and the target genes (Table 3 and Table S5). The number of LD blocks for each gene varied from 4 to 11, and each block contained 2–3 common haplotypes with an average of two (Table 3). Haplotype-based association, performed by HTR, detected 72 significant associations (P < 0.01) between 44 common haplotypes from 26 blocks within Pto-MIR156c and the putative targets genes, and seven traits (DBH, V, FW, FL, MFA, HEC, and CC) with R2 ranging from 0.14 to 29.47% (Table S5).
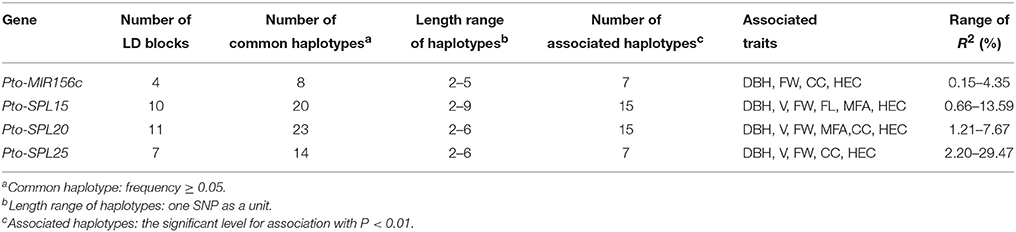
Table 3. Summary of haplotype-based association analysis within Pto-MIR156c and the three potential targets of Pto-miR156c for each trait in the association population of P. tomentosa.
The number of associated haplotypes for each trait ranged from 1 to 24; for example, 24 common haplotypes, including five in Pto-MIR156c, nine in Pto-SPL20, three in Pto-SPL25, and seven in Pto-SPL15, simultaneously associated with FW, with R2 ranging from 0.68 to 21.73% (Table S5). In addition, 50% of the significantly associated haplotypes were shared among traits. For instance, one haplotype (C-G-C-C) from block1 in SNP3-6 of Pto-SPL20 associated with DBH, HEC, MFA, and V, explaining 1.30–4.79% of the phenotypic variance. Examination of haplotype association was also supported by single-SNP-based association. For example, two haplotypes (A-A and G-G) from Pto-MIR156c-SNP9-10 and two haplotypes (G-C-C-C and T-A-T-T) from Pto-SPL20-SNP86-89 associated with HEC and FW, respectively, which were strongly supported by single SNP-based associations for the same traits (Figures 3B,C).
The Interactions of Pto-miR156c and Its Three Potential Targets Revealed by Epistasis Modeling
To characterize the functional roles and interactions of Pto-miR156c and the three putative targets of Pto-miR156c in wood formation, we used MDR 3.0.2 to perform a SNP-SNP association study based on epistasis effects between Pto-MIR156c and the three potential targets of Pto-miR156c, and the 10 traits. In total, we detected 129 significant pairwise associations (P < 0.01, Q < 0.1) representing 47 unique SNPs from Pto-MIR156c (5), Pto-SPL15 (18), Pto-SPL20 (17), and Pto-SPL25 (7) and 10 traits with single effects from 0 to 7.45% and pairwise effects from 0 to 8.7% (Figure 4A, Table 4, and Table S6). The pairwise epistatic effect was assessed by information gain (IG, ranging from −0.87 to 3.26%), of which 85.27% SNP-SNP associations behaved with negative IGs (Table 4). Of the SNP-SNP interactions, 21.71 and 49.61% represented miRNA-mRNA and mRNA-mRNA interactions, respectively, and the remaining (28.68%) consisted of SNPs within the same genes. In addition, one SNP in Pto-MIR156c could have epistatic interactions with more than one SNP in the three potential targets of Pto-miR156c (Figure 4B). For example, SNP9 from Pto-MIR156c formed 12 SNP pairs with SNPs from the three candidate targets, with pairwise effects of 0.33–5.81% on phenotypic traits.
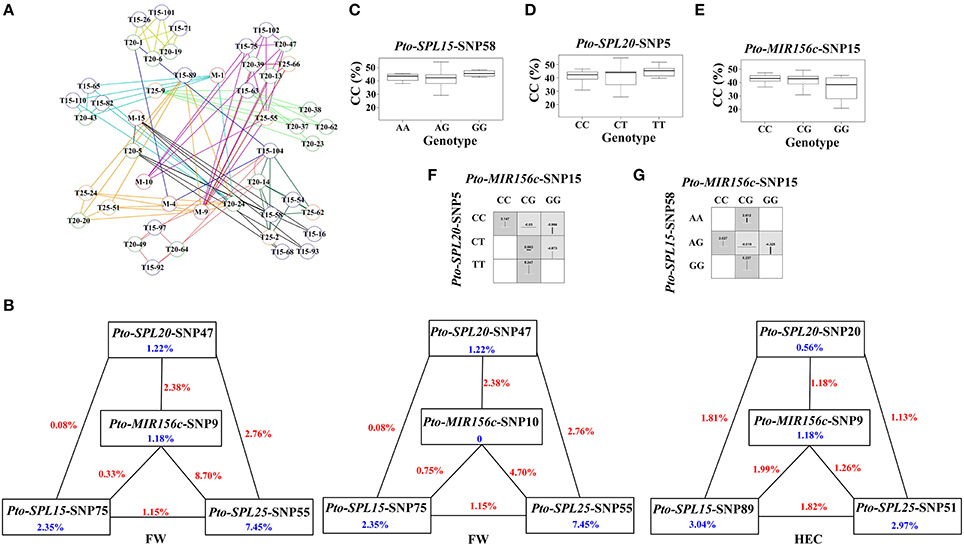
Figure 4. The epistatic network within the SNPs from Pto-MIR156c and the three potential targets of Pto-miR156c, and the phenotypic variations of single-locus genotypes and pairwise genotypic combinations. (A) A structural network revealed the epistatic interactions of different loci in Pto-MIR156c and its three potential targets. Lines with different colors represent the different associated traits of the SNP pairs, with colors representing the different traits: yellow (height, H), red (stem diameter, DBH), pink (stem volume, V), pale green (holocellulose content, HC), orange (hemicellulose content, HEC), pale blue (lignin content, LC), black (α-cellulose content, CC), blue (fiber length, FL), purple (fiber width, FW), and deep green (microfiber angle, MFA). In addition, the circles with M (red), T15 (blue), T20 (green), and T25 (orange) markers (e.g., T15-63) indicate the associated SNPs from Pto-MIR156c, Pto-SPL15, Pto-SPL20, and Pto-SPL25, respectively. (B) Interaction graph for FW and HEC among SNPs in Pto-MIR156c, Pto-SPL15, Pto-SPL20, and Pto-SPL25. The blue values in boxes represent the single-marker effect, and the red values in lines indicate the pairwise epistatic effect. (C–E) Box plots reveale the single-locus phenotypic variation of different genotypes of three SNPs. (F,G) Square boxes show the pairwise phenotypic variation of different genotypic combinations from different SNP pairs.
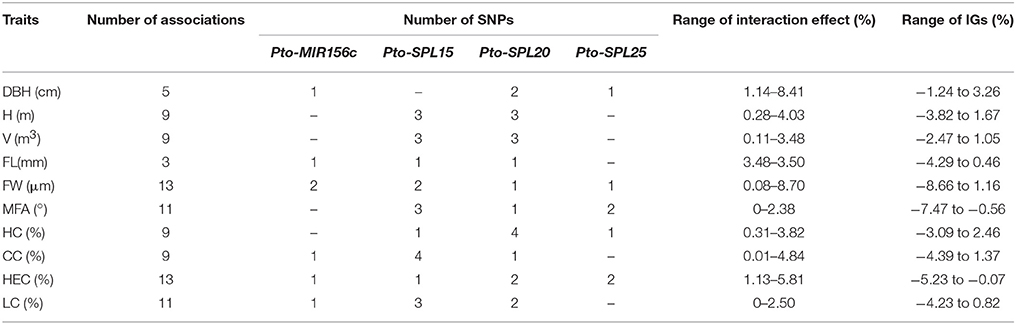
Table 4. Summary of all significant SNP pairs associated with each trait under epistasis model in the association population of P. tomentosa.
To decipher the pairwise effect for tree growth and wood property traits, we constructed three interaction graphs for FW and HEC, and found that each graph revealed two-way interactions between four SNPs in Pto-MIR156c, Pto-SPL15, Pto-SPL20, and Pto-SPL25 (Figure 4B). The nine SNPs had single effects for the associated traits of 0–7.45%. Among the 15 interactions, 13 had negative IGs, indicating redundant information in these SNP pairs. Interestingly, Pto-MIR156c-SNP10 had no effect on FW, while it did have pairwise effects on FW when in combination with Pto-SPL15-SNP75, Pto-SPL20-SNP47, and Pto-SPL25-SNP55 (Figure 4B). In addition, the SNP pair of Pto-MIR156c-SNP15 and Pto-SPL20-SNP5 had epistatic interactions on CC, and the higher and lower values of different genotypic combinations from two SNPs significantly differed from the values of the single-locus genotype (Figures 4C–G). For example, epistasis values of the CG-CT combination (0.563%) in the SNP pair Pto-MIR156c-SNP15 and Pto-SPL20-SNP5 were significantly higher than any of the single-genotype values (0.063% for CG and 0.167% for CT). However, the genotypic combinations of Pto-MIR156c-SNP15 and Pto-SPL15-SNP58 displayed a different situation, in which only CG-AG genotype combination produced epistasis values that differed from the single-locus genotype. All these findings can be used as evidence for dissecting gene-gene epistatic interactions.
Transcript Analysis of Significant SNP Genotypes
To further investigate the roles of SNPs in pre-miRNA region of Pto-MIR156c, we predicted four secondary structures by RNAfold, based on the two SNPs in the pre-miRNA region of Pto-MIR156c (Pto-MIR156c-SNP9 and Pto-MIR156c-SNP10) (Figure 5A). The results showed that the two SNPs slightly altered the minimum free energy (from −50.14 kcal/mol to −49.86 kcal/mol) of the predicted secondary structure of Pto-MIR156c. Then, we used RT-qPCR to measure the transcript abundance of Pto-MIR156c and the effect of SNPs within the pre-miRNA region. The results showed that Pto-MIR156c-SNP9 produced significant differences in Pto-MIR156c transcript abundance in the different genotypes, with the highest expression levels in the AA group (0.056 ± 0.003, arbitrary units normalized to control), and the lowest levels in the AG group (0.032 ± 0.002) (Figure 5B). We also tested the transcript abundance of target genes affected by significant SNPs. For example, three genotypes of Pto-SPL25-SNP12 caused different expression levels of Pto-SPL25 (Figure 5C), with the highest levels in the AA group (0.63 ± 0.03), followed by the GG (0.51 ± 0.02) group, and the lowest in the AG group (0.46 ± 0.02).
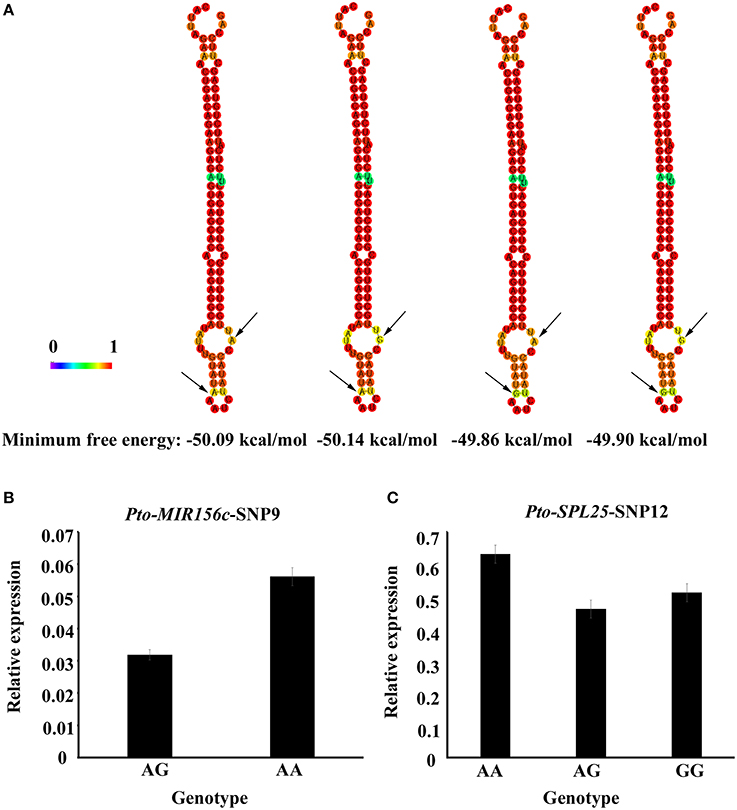
Figure 5. Secondary structures with SNPs in the pre-miRNA region of Pto-MIR156c and transcript abundance of SNP genotypes for Pto-MIR156c and Pto-SPL25. (A) The secondary structures of Pto-MIR156c pre-miRNA sequence affected by two SNPs in the pre-miRNA region, and the minimum free energy of the four secondary structures. (B,C) Transcript levels (arbitrary units normalized to control) of Pto-MIR156c (B) and Pto-SPL25 (C) in different genotypic classes for Pto-MIR156c-SNP9 and Pto-SPL25-SNP12, respectively.
Discussion
Characterization of Pto-MIR156c and Its Complex Regulatory Network with Pto-SPLs in P. tomentosa
In perennial trees, most biological processes, such as tree growth and wood formation, are regulated by coordinated and elaborate networks, including non-coding RNA (ncRNA)-mRNA, mRNA-mRNA, and ncRNA-ncRNA interactions (Lu et al., 2013). Of these, miRNAs, a class of crucial ncRNAs, function as key regulators of gene expression. Moreover, SNPs in miRNA genes may act as functional markers by affecting the pre-miRNA secondary structure, altering miRNA abundance, and modifying the expression of the targets, thus affecting phenotypic variation (Ryan et al., 2010). For example, three SNPs in the pre-miRNA region of Pto-MIR397a strongly affected the stability of the secondary structure, and associate with tree growth and wood properties in P. tomentosa (Chen et al., 2015). Here, we identified two SNPs (Pto-MIR156c-SNP9 and Pto-MIR156c-SNP10) in the pre-miRNA region of Pto-MIR156c, that lead to slight changes of the minimum free energy of its secondary structure (Figure 5A), which could affect the stability of this secondary structure. Furthermore, Pto-MIR156c-SNP9 affected the transcript abundance of Pto-MIR156c (Figure 5B). The altered stability of the secondary structure could affect the transcript accumulation of Pto-MIR156c; beyond that, the two SNPs could also alter transcription factor binding sites or processing signals, which might affect the transcription of the miRNA. This needs to be analyzed in future studies. In addition, the significant positive expression correlation of Pto-MIR156c gene and mature miR156 (Figure S5) revealed that the SNPs in pre-miRNA region may affect the abundance of mature miRNA. In addition to this, the processing efficiency could also be considered as a factor in affecting the maturation of miRNA.
In addition, single SNP-based and haplotype-based association analysis in the natural population found that Pto-MIR156c-SNP9 and Pto-MIR156c-SNP10 significantly associated with CC and HEC. Taken together, our findings support the idea that SNPs in the pre-miRNA could affect the transcript abundance of the miRNA gene and contribute to phenotypic variations. In the flanking region of Pto-MIR156c, 15 common SNPs (MAF > 0.05) were found with nucleotide diversity of π = 0.01159, which was higher than that found in the pre-miRNA region of Pto-MIR156c (π = 0.01023), and no SNPs were detected in the mature region. Alignment results showed the mature sequences of miR156c in P. tomentosa, P. trichocarpa, O. sativa, Z. mays, and A. thaliana were completely conserved, which strongly emphasized that the mature miRNAs are highly conserved (Reinhart et al., 2002). Also, expression analysis failed to detect the expression of Pto-MIR156c in the shoot apex, and the expression levels of other tissues showed a varied pattern, revealing that Pto-MIR156c is expressed in a tissue-specific manner (Puzey et al., 2012). We also found that Pto-MIR156c expression was higher in cambium, indicating that it may have potential regulatory roles in primary cell wall formation. In addition, MIR156h also exhibited high expression levels in xylem (Kozomara and Griffiths-Jones, 2014; Figure S1), suggesting that miR156h might be essential in regulating tree growth and wood formation. However, MIR156h is conserved in our association population of P. tomentosa, which makes it inappropriate to decipher the vital roles of miR156h in tree development by association studies. We can analyze the regulatory roles of miR156h through other strategies in future.
This study identified Pto-SPL15, Pto-SPL20, and Pto-SPL25 as potential targets of Pto-miR156c through psRNATarget prediction and degradome sequencing (Figure 1B). Expression pattern analysis also showed that Pto-MIR156c and its three potential targets might participate in wood formation through a shared pathway (Figure 1C). Previous studies found that miRNAs negatively regulate the expression of their targets, while a few distinctive findings were detected in our studies. For example, the expression of Pto-MIR156c and Pto-SPL15, Pto-SPL20, and Pto-SPL25 exhibited weak or no correlation (r = 0.17, −0.04, and −0.42, respectively, P < 0.05) in seven tested tissues and organs. Also, Pto-SPL20 and Pto-SPL25 showed strong negative correlations with Pto-miR156c in stem tissues (phloem, cambium, developing xylem, and mature xylem), suggesting that the regulation of Pto-SPL20 and Pto-SPL25 by Pto-miR156c occurred in a tissue-specific manner.
By contrast, Pto-miR156c and Pto-SPL15 showed a positive correlation (r = 0.40, P < 0.05) in stem, inconsistent with former studies. Several reasons might explain this phenomenon. For example, the Pto-SPL15 gene might be regulated by more than one miRNA, or other members in the same miRNA family or other miRNA families might contribute more to the regulation of Pto-SPL15 expression (Jens and Rajewsky, 2014). It is the possibility that Pto-miR156c might regulate Pto-SPL15 mainly via translational suppression; therefore, we cannot see a clear expression reduction of Pto-SPL15 in transcriptional level. There is also a possibility that the transcript levels of Pto-SPL15 was mainly affected by its own transcriptional regulation. Due to the specificity of miRNA expression in different developmental stages and tissues, it is probable that the negative regulation of Pto-miR156c and Pto-SPL15 might not be reflected in the tested tissues and developmental stages. For example, RNA-binding proteins, such as Argonaute and Dicer, regulate the accessibility of individual sites in a tissue- and stage-specific manner, which could affect the regulation of miRNA and mRNA (Hausser and Zavolan, 2014). Another possibility is that feedback mechanisms could counteract the effect of the miRNA-mRNA interaction (Hausser and Zavolan, 2014). For example, in humans, Dicer is a key enzyme in miRNA biogenesis and is controlled by the miRNA let-7. Knockdown of let-7 strongly deregulated the production of Dicer, which in turn increased the abundance of other miRNAs, and thus indirectly reduced the expression of the corresponding mRNAs (Selbach et al., 2008). In addition, competing ncRNAs, such as long non-coding RNAs (lncRNAs), could affect this phenomenon, possibly by specifically competing for miRNA binding (Hausser and Zavolan, 2014). For example, in animals, lncRNA H19 acts as a sponge for miRNA let-7, thereby increasing the expression of let-7-regulated genes, promoting muscle differentiation, and the miRNA-mRNA regulatory system was also regulated by the relative concentrations of miRNA, lncRNA, and mRNA (Kallen et al., 2013). Taken together our results indicate that, except for the direct regulation of Pto-miR156c and Pto-SPL15, there might be an alternative pathway, in which Pto-miR156c could indirectly regulate the expression of Pto-SPL15. We can examine this in future studies.
SNPs in Pto-MIR156c and the Three Potential Targets of Pto-miR156c Associated with Tree Growth and Wood Property Traits
Our study detected 69 and 72 significant associations (P < 0.01) via single-SNP-based and haplotype-based association studies, respectively, which illustrated that Pto-miR156c and its three putative targets might function in wood formation through the same pathway (Figure 3A). For Pto-MIR156c, the haplotype of A-A and G-G in Pto-MIR156c-SNP9-10 associated with HEC, which was supported by single-SNP-based association (Figure 3B), and the haplotype A-A also associated with CC, revealing the pleiotropy of this gene and its roles in wood formation. In addition, one SNP from the flanking region of Pto-MIR156c associated with HC, and five haplotypes from SNPs in the flanking region associated with three traits (DBH, FW, and HEC), suggesting that SNPs in flanking regions could also cause phenotypic variation, consistent with the idea that SNPs within flanking regions function in regulating the roles of miRNAs (Zeng and Cullen, 2005). These association studies in Pto-MIR156c illustrate the crucial roles of Pto-miR156c in tree growth and wood formation, and provide evidence for dissecting the functional SNPs in Pto-MIR156c.
Also, 48 common SNPs (MAF > 0.05) in Pto-SPL15, Pto-SPL20, and Pto-SPL25 associated with six traits related to tree growth and wood properties with different R2, indicating the possible roles of SPL genes in tree growth and wood properties. Of the associated SNPs, six were in exons, which could affect phenotypic variation by causing non-synonymous mutations or influencing expression levels (Kimchi-Sarfaty et al., 2007). For example, three genotypes of Pto-SPL20-SNP12 influenced the expression level of Pto-SPL20 (Figure 5C). Also, Pto-SPL20-SNP21, caused a missense mutation of Ala to Gly, associated with V.
In general, 86.96% of the associations showed additive effects, and 57.97% displayed dominant effects, which indicated that additive effects may play relatively major roles in genetic variation (Figure 3A). Both additive and dominant effects offered clues to the common roles of Pto-miR156c and its three putative targets on tree growth and wood formation, and provided significant resources for applications in marker-assisted breeding of trees.
Furthermore, at least one SNP of three target genes associated with the same trait as Pto-MIR156c. For instance, Pto-MIR156c-SNP9, Pto-MIR156c-SNP10, Pto-SPL15-SNP106, and Pto-SPL20-SNP8 simultaneously associated with HEC with different additive and dominant effects and R2. Many haplotypes in the four candidate genes associated with one trait. For example, five haplotypes from Pto-MIR156c, seven haplotypes from Pto-SPL15, nine haplotypes from Pto-SPL20, and three haplotypes from Pto-SPL25 simultaneously associated with FW, explaining 0.68–21.73% of the phenotypic variance. These findings indicate that Pto-miR156c and its three putative targets may co-regulate the phenotypic variation by sharing the same regulatory pathway. In addition, one SNP or one haplotype associated with more than one trait with different contributions; for example, Pto-SPL25-SNP30 associated with FW and DBH with R2 of 13.33 and 13.50%, respectively, revealing the functional roles of the locus and pleiotropy of the gene.
In summary, the association studies, combined with the correlation of expression patterns in stem, illustrate the common roles of miR156c and its three potential targets in tree growth and wood formation, and enlarge our understanding of the potential roles of the miR156c-SPL regulatory system in wood formation in perennial woody plants.
The Interaction of Pto-miR156c and Its Potential Targets on Wood Formation Revealed by Epistasis Effects
Epistasis has been regarded as an essential effect for understanding molecular evolution and a feasible tool for identifying the effects of genetic variation and interactions among multiple genes on quantitative traits in breeding (Mackay, 2014). Also, epistasis provides necessary and complementary information to that gained from single-locus analysis, and few studies have used epistasis analysis to decipher the regulatory networks of multiple genes in trees (Du et al., 2015). Here, we identified 129 significant pairwise associations, and 85.27% of them showed negative IG, indicating the redundant information carried in the two SNPs and their similar roles in the same traits (Figure 4A). The associations with positive IGs indicate that pairwise interactions provide greater contributions to phenotypic variation than the sum of the individual contributions of the two SNPs. Both the positive and negative IGs illustrate the close genetic interactions of the miRNA and its targets.
We found that 21.71% of the SNP pairs were miRNA-mRNA interactions, reflecting the possible genetic interactions of Pto-miR156c and its putative targets on tree growth and wood formation, while 49.61% of the SNP-SNP interactions were from two target genes, revealing the interactions of target genes could also contribute to wood formation.
Interestingly, one SNP in Pto-MIR156c could form multiple SNP pairs with SNPs in the three putative targets. For example, Pto-MIR156c-SNP9 showed epistasis interactions with Pto-SPL15-SNP89, Pto-SPL20-SNP20, and Pto-SPL25-SNP51 (Figure 4B). The six SNP pairs acted on HEC with pairwise effects of 0.08 to 8.70%, suggesting the complexity of the interaction between Pto-miR156c and its three potential targets for wood formation and the predominant roles of Pto-MIR156c in the regulatory network for phenotypic variation.
In the epistasis model, some loci possessed significant roles only when they interacted with other SNPs, such as Pto-SPL20-SNP1 and Pto-MIR156c-SNP10, illustrating the significance of the complicated regulatory network. In addition, epistatic effects of different genotype combinations could also be treated as evidence of the effects of gene interactions on quantitative traits (Figures 4C–G). For example, the epistasis effect of CG-CT combinations (0.563%) from Pto-MIR156c-SNP15 and Pto-SPL20-SNP5 for CC was significantly higher than any of the single genotypes (0.063% for CG and 0.167% for CT) (Figures 4C,D,F), indicating that the genotype combinations had greater phenotypic contributions than single loci. By contrast, the effect of the AG genotype on CC in Pto-MIR156c-SNP15 was masked when the genotype of Pto-SPL15-SNP58 was AA and GG (Figures 4E,G), which indicated the epistasis of the SNP pairs and their interactions for wood formation. However, the detailed regulatory mechanisms and the functional SNPs identified under epistasis models also need to be examined in future studies.
Conclusions
Here, we conducted association studies and expression profiling to examine the roles and interactions of Pto-miR156c and its potential targets in tree growth and wood formation. Single SNP-based association studies with underlying additive and dominant effects and haplotype-based association studies, combined with expression pattern analysis, provided genetic evidence of the potential common roles and correlation of Pto-miR156c and its three putative targets in wood formation. Epistasis analysis, which opened a feasible pathway to uncover genetic variation and define the genetic regulatory networks of miRNA-mRNA interactions in the population genetics of trees, deciphered the epistasis interactions of Pto-MIR156c and the three potential targets and dissected their potential roles in wood formation. In addition, this study revealed the potential roles of the miR156-SPL system in wood formation in trees. Overall, our studies contributed to studying the genetic variations and functions of miRNA-mRNA interactions, and the functional SNPs in our studies could be used in future studies.
Author Contributions
DZ designed the conception and experiment; MQ and QW performed the experiments; SP helped to collect and analyze the data; MQ wrote the manuscript; QW and SP provided valuable suggestions on the manuscript; XY, YS, QD, and DZ revised the manuscript; DZ obtained funding and is responsible for this article. All authors read and approved the manuscript.
Data Archiving Statement
Sequence data in this article have been deposited with the GenBank Data Library under the accession numbers KX079977 –KX080148, and the degradome sequencing data are available in SRA database under the accession number SRX1447192.
Conflict of Interest Statement
The authors declare that the research was conducted in the absence of any commercial or financial relationships that could be construed as a potential conflict of interest.
Acknowledgments
This work was supported by the Fundamental Research Funds for the Central Universities (No. BLYJ201604), and National “863” Plan Project (No. 2013AA102702).
Supplementary Material
The Supplementary Material for this article can be found online at: http://journal.frontiersin.org/article/10.3389/fpls.2016.01159
Figure S1. The expression patterns of Pto-MIR156 gene family in different tissues and organs.
Figure S2. The most likely cleavage sites between Pto-miR156c and Pto-SPL15 identified by degradome sequencing.
Figure S3. The most likely cleavage sites between Pto-miR156c and Pto-SPL20 identified by degradome sequencing.
Figure S4. The most likely cleavage sites between Pto-miR156c and Pto-SPL25 identified by degradome sequencing.
Figure S5. The expression correlation analysis of Pto-MIR156c and mature miR156.
Table S1. The primers used for real-time PCR in this study.
Table S2. Single-nucleotide polymorphisms of Pto-MIR156c and the three potential targets of Pto-miR156c.
Table S3. SNPs in Pto-MIR156c, Pto-SPL15, Pto-SPL20, and Pto-SPL25 identified in our studies.
Table S4. Details of significant SNPs within Pto-MIR156c and the three potential targets of Pto-miR156c associated with growth and wood properties in an association population of P. tomentosa.
Table S5. Significant haplotypes from Pto-MIR156c and its potential targets associated with growth and wood properties in the association population.
Table S6. The SNP pairs and their main effects detected from Pto-MIR156c and the three potential targets of Pto-miR156c under an epistasis model in the association population of P. tomentosa.
References
Addo-Quaye, C., Miller, W., and Axtell, M. J. (2009). CleaveLand: a pipeline for using degradome data to find cleaved small RNA targets. Bioinformatics 25, 130–131. doi: 10.1093/bioinformatics/btn604
Aung, B., Gruber, M. Y., Amyot, L., Omari, K., Bertrand, A., and Hannoufa, A. (2015). MicroRNA156 as a promising tool for alfalfa improvement. Plant Biotechnol. J. 13, 779–790. doi: 10.1111/pbi.12308
Birkenbihl, R. P., Jach, G., Saedler, H., and Huijser, P. (2005). Functional dissection of the plant-specific SBP-domain: overlap of the DNA-binding and nuclear localization domains. J. Mol. Biol. 352, 585–596. doi: 10.1016/j.jmb.2005.07.013
Bradbury, P. J., Zhang, Z., Kroon, D. E., Casstevens, T. M., Ramdoss, Y., and Buckler, E. S. (2007). TASSEL: software for association mapping of complex traits in diverse samples. Bioinformatics 23, 2633–2635. doi: 10.1093/bioinformatics/btm308
Chen, J., Chen, B., Yang, X., Tian, J., Du, Q., and Zhang, D. (2015). Association genetics in Populus reveals the interactions between Pt-miR397a and its target genes. Sci. Rep. 5:11672. doi: 10.1038/srep11672
Chuck, G., Cigan, A. M., Saeteurn, K., and Hake, S. (2007). The heterochronic maize mutant Corngrass1 results from overexpression of a tandem microRNA. Nat. Genet. 39, 544–549. doi: 10.1038/ng2001
Cui, L. G., Shan, J. X., Shi, M., Gao, J. P., and Lin, H. X. (2014). The miR156-SPL9-DFR pathway coordinates the relationship between development and abiotic stress tolerance in plants. Plant J. 80, 1108–1117. doi: 10.1111/tpj.12712
Du, Q., Tian, J., Yang, X., Pan, W., Xu, B., Li, B., et al. (2015). Identification of additive, dominant, and epistatic variation conferred by key genes in cellulose biosynthesis pathway in Populus tomentosa. DNA Res. 22, 53–67. doi: 10.1093/dnares/dsu040
Du, Q., Wang, B., Wei, Z., Zhang, D., and Li, B. (2012). Genetic diversity and population structure of Chinese White poplar (Populus tomentosa) revealed by SSR markers. J. Hered. 103, 853–862. doi: 10.1093/jhered/ess061
Du, Q., Xu, B., Gong, C., Yang, X., Pan, W., Tian, J., et al. (2014). Variation in growth, leaf, and wood property traits of Chinese white poplar (Populus tomentosa), a major industrial tree species in Northern China. Can. J. Forest. Res. 44, 326–339. doi: 10.1139/cjfr-2013-0416
Duan, R., Pak, C., and Jin, P. (2007). Single nucleotide polymorphism associated with mature miR-125a alters the processing of pri-miRNA. Hum. Mol. Genet. 16, 1124–1131. doi: 10.1093/hmg/ddm062
Evanno, G., Regnaut, S., and Goudet, J. (2005). Detecting the number of clusters of individuals using the software STRUCTURE: a simulation study. Mol. Ecol. 14, 2611–2620. doi: 10.1111/j.1365-294X.2005.02553.x
Frazier, T. P., Sun, G., Burklew, C. E., and Zhang, B. (2011). Salt and drought stresses induce the aberrant expression of microRNA genes in tobacco. Mol. Biotechnol. 49, 159–165. doi: 10.1007/s12033-011-9387-5
Hahn, L. W., Ritchie, M. D., and Moore, J. H. (2003). Multifactor dimensionality reduction software for detecting gene-gene and gene-environment interactions. Bioinformatics 19, 376–382. doi: 10.1093/bioinformatics/btf869
Hardy, O., and Vekemans, X. (2002). SPAGeDi: a versatile computer program to analyse spatial genetic structure at the individual or population levels. Molecular ecology notes. Mol. Ecol. Notes 2, 618–620. doi: 10.1046/j.1471-8286.2002.00305.x
Hausser, J., and Zavolan, M. (2014). Identification and consequences of miRNA-target interactions-beyond repression of gene expression. Nat. Rev. Genet. 15, 599–612. doi: 10.1038/nrg3765
Jens, M., and Rajewsky, N. (2014). Competition between target sites of regulators shapes post-transcriptional gene regulation. Nat. Rev. Genet. 16, 113–126. doi: 10.1038/nrg3853
Kallen, A. N., Zhou, X. B., Xu, J., Qiao, C., Ma, J., Yan, L., et al. (2013). The imprinted H19 lncRNA antagonizes let-7 microRNAs. Mol. Cell 52, 101–112. doi: 10.1016/j.molcel.2013.08.027
Kimchi-Sarfaty, C., Oh, J. M., Kim, I. W., Sauna, Z. E., Calcagno, A. M., Ambudkar, S. V., et al. (2007). A “silent” polymorphism in the MDR1 gene changes substrate specificity. Science 315, 525–528. doi: 10.1126/science.1135308
Kozomara, A., and Griffiths-Jones, S. (2014). miRBase: annotating high confidence microRNAs using deep sequencing data. Nucleic Acids Res. 42, D68–D73. doi: 10.1093/nar/gkt1181
Kruszka, K., Pieczynski, M., Windels, D., Bielewicz, D., Jarmolowski, A., Szweykowska-Kulinska, Z., et al. (2012). Role of microRNAs and other sRNAs of plants in their changing environments. J. Plant Physiol. 169, 1664–1672. doi: 10.1016/j.jplph.2012.03.009
Li, C., and Lu, S. (2014). Molecular characterization of the SPL gene family in Populus trichocarpa. BMC Plant Biol. 14:131. doi: 10.1186/1471-2229-14-131
Li, X., Wu, H. X., Dillon, S. K., and Southerton, S. G. (2009). Generation and analysis of expressed sequence tags from six developing xylem libraries in Pinus radiata D. Don. BMC Genomics 10:41. doi: 10.1186/1471-2164-10-41
Librado, P., and Rozas, J. (2009). DnaSP v5: a software for comprehensive analysis of DNA polymorphism data. Bioinformatics 25, 1451–1452. doi: 10.1093/bioinformatics/btp187
Lu, S., Li, Q., Wei, H., Chang, M. J., Tunlaya-Anukit, S., Kim, H., et al. (2013). Ptr-miR397a is a negative regulator of laccase genes affecting lignin content in Populus trichocarpa. Proc. Natl. Acad. Sci. U.S.A. 110, 10848–10853. doi: 10.1073/pnas.1308936110
Mackay, T. F. (2014). Epistasis and quantitative traits: using model organisms to study gene-gene interactions. Nat. Rev. Genet. 15, 22-33. doi: 10.1038/nrg3627
Mica, E., Gianfranceschi, L., and Pe, M. E. (2006). Characterization of five microRNA families in maize. J. Exp. Bot. 57, 2601–2612. doi: 10.1093/jxb/erl013
Moore, J. H., Gilbert, J. C., Tsai, C. T., Chiang, F. T., Holden, T., Barney, N., et al. (2006). A flexible computational framework for detecting, characterizing, and interpreting statistical patterns of epistasis in genetic studies of human disease susceptibility. J. Theor. Biol. 241, 252–261. doi: 10.1016/j.jtbi.2005.11.036
Neale, D. B., and Kremer, A. (2011). Forest tree genomics: growing resources and applications. Nat. Rev. Genet. 12, 111–122. doi: 10.1038/nrg2931
Patterson, N., Price, A. L., and Reich, D. (2006). Population structure and eigenanalysis. PLoS Genet. 2:e190. doi: 10.1371/journal.pgen.0020190
Puzey, J. R., Karger, A., Axtell, M., and Kramer, E. M. (2012). Deep annotation of Populus trichocarpa microRNAs from diverse tissue sets. PLoS ONE 7:e33034. doi: 10.1371/journal.pone.0033034
Rawlings-Goss, R. A., Campbell, M. C., and Tishkoff, S. A. (2014). Global population-specific variation in miRNA associated with cancer risk and clinical biomarkers. BMC Med. Genomics 7:53. doi: 10.1186/1755-8794-7-53
Reinhart, B. J., Weinstein, E. G., Rhoades, M. W., Bartel, B., and Bartel, D. P. (2002). MicroRNAs in plants. Genes Dev. 16, 1616–1626. doi: 10.1101/gad.1004402
Remington, D. L., Thornsberry, J. M., Matsuoka, Y., Wilson, L. M., Whitt, S. R., Doebley, J., et al. (2001). Structure of linkage disequilibrium and phenotypic associations in the maize genome. Proc. Natl. Acad. Sci. U.S.A. 98, 11479–11484. doi: 10.1073/pnas.201394398
Roguev, A., Bandyopadhyay, S., Zofall, M., Zhang, K., Fischer, T., Collins, S. R., et al. (2008). Conservation and rewiring of functional modules revealed by an epistasis map in fission yeast. Science 322, 405–410. doi: 10.1126/science.1162609
Rubio-Somoza, I., and Weigel, D. (2011). MicroRNA networks and developmental plasticity in plants. Trends Plant Sci. 16, 258–264. doi: 10.1016/j.tplants.2011.03.001
Ryan, B. M., Robles, A. I., and Harris, C. C. (2010). Genetic variation in microRNA networks: the implications for cancer research. Nat. Rev. Cancer 10, 389–402. doi: 10.1038/nrc2867
Selbach, M., Schwanhäusser, B., Thierfelder, N., Fang, Z., Khanin, R., and Rajewsky, N. (2008). Widespread changes in protein synthesis induced by microRNAs. Nature 455, 58–63. doi: 10.1038/nature07228
Sexton, T. R., Henry, R. J., Harwood, C. E., Thomas, D. S., McManus, L. J., Raymond, C., et al. (2012). Pectin Methylesterase genes influence solid wood properties of Eucalyptus pilularis. Plant Physiol. 158, 531–541. doi: 10.1104/pp.111.181602
Shamimuzzaman, M., and Vodkin, L. (2012). Identification of soybean seed developmental stage-specific and tissue-specific miRNA targets by degradome sequencing. BMC Genomics 13:310. doi: 10.1186/1471-2164-13-310
Shikata, M., Koyama, T., Mitsuda, N., and Ohme-Takagi, M. (2009). Arabidopsis SBP-box genes SPL10, SPL11 and SPL2 control morphological change in association with shoot maturation in the reproductive phase. Plant Cell Physiol. 50, 2133–2145. doi: 10.1093/pcp/pcp148
Storey, J. D., and Tibshirani, R. (2003). Statistical significance for genomewide studies. Proc. Natl. Acad. Sci. U.S.A. 100, 9440–9445. doi: 10.1073/pnas.1530509100
Tamura, K., Peterson, D., Peterson, N., Stecher, G., Nei, M., and Kumar, S. (2011). MEGA5: molecular evolutionary genetics analysis using maximum likelihood, evolutionary distance, and maximum parsimony methods. Mol. Biol. Evol. 28, 2731–2739. doi: 10.1093/molbev/msr121
Thumma, B. R., Nolan, M. F., Evans, R., and Moran, G. F. (2005). Polymorphisms in cinnamoyl CoA reductase (CCR) are associated with variation in microfibril angle in Eucalyptus spp. Genetics 171, 1257–1265. doi: 10.1534/genetics.105.042028
Tian, J., Du, Q., Chang, M., and Zhang, D. (2012). Allelic variation in PtGA20Ox associates with growth and wood properties in Populus spp. PLoS ONE 7:e53116. doi: 10.1371/journal.pone.0053116
Voinnet, O. (2009). Origin, biogenesis, and activity of plant microRNAs. Cell 136, 669–687. doi: 10.1016/j.cell.2009.01.046
Wang, J., Park, M. Y., Wang, L., Koo, Y., Chen, X., Weigel, D., et al. (2011). MiRNA control of vegetative phase change in trees. PLoS Genet. 7:e1002012. doi: 10.1371/journal.pgen.1002012
Wu, G., and Poethig, R. S. (2006). Temporal regulation of shoot development in Arabidopsis thaliana by miR156 and its target SPL3. Development 133, 3539–3547. doi: 10.1242/dev.02521
Xie, K., Shen, J., Hou, X., Yao, J., Li, X., Xiao, J., et al. (2012). Gradual increase of miR156 regulates temporal expression changes of numerous genes during leaf development in rice. Plant Physiol. 158, 1382–1394. doi: 10.1104/pp.111.190488
Yang, X., Du, Q., Chen, J., Wang, B., and Zhang, D. (2015). Association mapping in Populus reveals the interaction between Pto-miR530a and its target Pto-KNAT1. Planta 242, 77–95. doi: 10.1007/s00425-015-2287-3
Zaykin, D. V., Westfall, P. H., Young, S. S., Karnoub, M. A., Wagner, M. J., and Ehm, M. G. (2002). Testing association of statistically inferred haplotypes with discrete and continuous traits in samples of unrelated individuals. Hum. Hered. 53, 79–91. doi: 10.1159/000057986
Zeng, Y., and Cullen, B. R. (2005). Efficient processing of primary microRNA hairpins by Drosha requires flanking nonstructured RNA sequences. J. Biol. Chem. 280, 27595–27603. doi: 10.1074/jbc.M504714200
Zhang, D., Xu, B., Yang, X., Zhang, Z., and Li, B. (2011). The sucrose synthase gene family in Populus: structure, expression, and evolution. Tree Genet Genomes 7, 443–456. doi: 10.1007/s11295-010-0346-2
Keywords: association genetics, Pto-miR156c, miRNA-mRNA, interaction, epistasis, wood formation
Citation: Quan M, Wang Q, Phangthavong S, Yang X, Song Y, Du Q and Zhang D (2016) Association Studies in Populus tomentosa Reveal the Genetic Interactions of Pto-MIR156c and Its Targets in Wood Formation. Front. Plant Sci. 7:1159. doi: 10.3389/fpls.2016.01159
Received: 22 April 2016; Accepted: 19 July 2016;
Published: 03 August 2016.
Edited by:
Stewart Gillmor, CINVESTAV, MexicoReviewed by:
Tony Millar, Australian National University, AustraliaJianfei Zhao, University of Pennsylvania, USA
Copyright © 2016 Quan, Wang, Phangthavong, Yang, Song, Du and Zhang. This is an open-access article distributed under the terms of the Creative Commons Attribution License (CC BY). The use, distribution or reproduction in other forums is permitted, provided the original author(s) or licensor are credited and that the original publication in this journal is cited, in accordance with accepted academic practice. No use, distribution or reproduction is permitted which does not comply with these terms.
*Correspondence: Deqiang Zhang, deqiangzhang@bjfu.edu.cn
†These authors have contributed equally to this work.