 Jee Hoon Kim
 Joon Woo Lee
 Tae In Ahn
 Jong Hwa Shin
 Kyung Sub Park
 Jung Eek Son
- 1Department of Plant Science and Research Institute of Agriculture and Life Sciences, Seoul National University, Seoul, South Korea
- 2Department of Horticulture and Breeding, Andong National University, Andong, South Korea
- 3Protected Horticulture Research Institute, National Institute of Horticultural and Herbal Science, Haman, South Korea
Canopy photosynthesis has typically been estimated using mathematical models that have the following assumptions: the light interception inside the canopy exponentially declines with the canopy depth, and the photosynthetic capacity is affected by light interception as a result of acclimation. However, in actual situations, light interception in the canopy is quite heterogenous depending on environmental factors such as the location, microclimate, leaf area index, and canopy architecture. It is important to apply these factors in an analysis. The objective of the current study is to estimate the canopy photosynthesis of paprika (Capsicum annuum L.) with an analysis of by simulating the intercepted irradiation of the canopy using a 3D ray-tracing and photosynthetic capacity in each layer. By inputting the structural data of an actual plant, the 3D architecture of paprika was reconstructed using graphic software (Houdini FX, FX, Canada). The light curves and A/Ci curve of each layer were measured to parameterize the Farquhar, von Caemmerer, and Berry (FvCB) model. The difference in photosynthetic capacity within the canopy was observed. With the intercepted irradiation data and photosynthetic parameters of each layer, the values of an entire plant's photosynthesis rate were estimated by integrating the calculated photosynthesis rate at each layer. The estimated photosynthesis rate of an entire plant showed good agreement with the measured plant using a closed chamber for validation. From the results, this method was considered as a reliable tool to predict canopy photosynthesis using light interception, and can be extended to analyze the canopy photosynthesis in actual greenhouse conditions.
Introduction
Canopy photosynthesis is one of the important factors for estimating crop growth and establishing the strategy of CO2 fertilization inside a greenhouse. Because crop yield is closely related to the seasonal integral of the total canopy photosynthesis, it can be used as base data to predict the crop production in a greenhouse (Monteith, 1965). Additionally, by estimating the attenuation of CO2 concentration with time, supply rates of CO2 fertilization in a cultivation system could be determined. In general, canopy photosynthesis is primarily determined by the light regime inside the greenhouse, and several factors such as meteorological and greenhouse structural factors, must be considered. Scaling up from the leaf to the canopy, the vertical pattern of the intercepted irradiation can be affected by the vertical structure of the whole plant and additional shading effects would occur from neighboring plants in the canopy (Caldwell et al., 1986; Chen et al., 1999). Other variances such as the direction of the sunlight, the ratio of the diffuse light, the greenhouse structure, the plant growth stage, and the plant density also affect the intercepted irradiation inside the canopy (Elifis et al., 1989; Lieth and Pasian, 1990; Stirling et al., 1994; Buck-Sorlin et al., 2011). Therefore, in estimating the canopy photosynthesis, it is important to investigate the light interception of the plant caused by these variances.
It is difficult to measure the actual light interception of the plant surface because of technical limitations. Therefore, previous research has estimated the canopy photosynthesis by various modeling approaches. Among the various approaches, the single leaf models, such as the FvCB model (Farquhar et al., 1980), represent the leaf level biochemical mechanism, and the whole canopy models, including the sunlit-shaded model (de Pury and Farquhar, 1997), are the most well-known models for photosynthesis (Zhu et al., 2012). Although these models are useful, they have been seldom used in greenhouse crop species (Gonzalez-Real and Baille, 2000; Yin and Struik, 2009; excepting cucumber Chen et al., 2014a; tomato de Visser et al., 2014; and rose Buck-Sorlin et al., 2011). Primary assumptions are that the absorbed photosynthetic active radiation affects the photosynthetic capacity of each canopy layer and contributes to the entire canopy photosynthesis (Field, 1983; de Pury and Farquhar, 1997; Roux et al., 1998; Dreccer et al., 2000; Johnson et al., 2010). Additionally, to simplify the calculation procedures, models have assumed that the vertical distribution of light interception has a negative exponential pattern from the top to the bottom of the canopy (Monsi and Saeki, 1953; Norman, 1980). The high level of spatial and temporal heterogeneity of the light interception is not considered in these models, for example, the shading by upper leaves on the lower part of the canopy, diffuse radiation which penetrates deep into the canopy (de Pury and Farquhar, 1997; Hikosaka, 2014), and the plant architecture affected by the leaf shape and angle in the light interception (Kim et al., 2010; Tang et al., 2015).
For analysis of the canopy photosynthesis rate, precise light distribution, and leaf photosynthesis are prerequisites (Chen et al., 2015). From this perspective, the construction of a 3D graphic plant is necessary to reflect the precise physical properties of the plant structure. Ray-tracing technique is a reasonable solution to incorporate optical properties such as the reflectance and transmittance of a leaf and other structures into the light simulation. Recently, there are increasing amount of studies where the light interceptions of crops have been estimated by using 3D plant models and light ray-tracing methods (Mabrouk et al., 1997; Buck-Sorlin et al., 2011; Sarlikioti et al., 2011; der Zande et al., 2011; Chen et al., 2014a,b; de Visser et al., 2014; Tang et al., 2015; Kang et al., 2016). To estimate canopy photosynthetic rates by combining above methods and photosynthetic models would be helpful for designing greenhouse crop production system. Thus, the objectives of the current study are to analyze accurate light interceptions using a 3D ray-tracing method, determine the vertical distributions of photosynthetic parameters, calculate the photosynthesis rate of each layer, and validate the canopy photosynthesis of paprika.
Materials and Methods
Cultivation Conditions
This experiment was conducted in a Venlo-type glasshouse located at the experimental farm of the Seoul National University in Suwon, Korea (37.3°N, 127°E). Paprika plants (Capsicum annuum L.) were transplanted after 3 months (20 July–15 October 2014) in rock wool cubes with a plant density of 3 plants/m2 and the distance between rows was 80 cm. Air conditioners were installed in each wall of the glasshouse to maintain a temperature between 25° and 35°C inside the greenhouse during the summer season and the relative humidity was controlled to be within a range of 60–80% using fogging systems. Nutrient solutions were irrigated 4 times a day at 10:00, 12:00, 14:00, and 16:00. To prevent a deficit of N related to the biosynthesis of chlorophylls, the total N concentration in the nutrient solution was NO3-N 1.45 mM. The other concentrations of macro-elements in the nutrient solution included P 1.61, K 3.59, Ca 4.00, Mg 1.88, and S 1.88 mM. The EC and pH ranges of the nutrient solutions were 2.6–3.0 dS m−1 and 5.5–6.5, respectively. The plants were pruned to form two main stems, which were vertically trellised to a “V” canopy system (Jovicich et al., 2004).
Leaf Photosynthesis and Leaf Nitrogen Measurements
Eight layers were determined within each plant to investigate the vertical pattern of the leaf photosynthetic capacity. Each layer consists of four leaves and layer number was counted acropetally.
The leaf photosynthesis was measured with a portable photosynthesis system (LI-6400, LI-COR, USA). A closed chamber on the photosynthesis system was set at 25°C for the leaf temperature and 60–70% for the relative humidity to obtain the photosynthetic parameters on the standard temperature condition. Additionally, a red 8:blue 2 light quality of an LED light source similar to the sun spectrum was used inside the closed chamber. By using the auto program of the light curve and an A/Ci curve that measures 20 points for each program, photosynthesis were measured at (1) photosynthetic photon flux density (PPFD) = 1000 μmol m−2 s−1 under varying external CO2 partial pressure (pa = 0–120 Pa) and (2) external CO2 partial pressure (Pa) = 100 Pa with varying PPFD (50–1000 μmol m−2 s−1). The calculated values of the internal CO2 partial pressure (Ci) were provided by the LI-COR system inside the device.
After the photosynthesis measurement, each sample leaf was collected to determine the leaf nitrogen content. An average value of the leaf nitrogen content per layer was investigated after the Kjeldahl digestion of the leaves, which were oven-dried at 80°C for 5 days and then grounded (Kjeldahl, 1883).
Entire-Plant Photosynthesis Measurements
To measure the daily CO2 consumption of an entire plant, a closed chamber (1 × 1 × 2 m) was designed and constructed using transparent polycarbonate. A closed chamber on the photosynthesis system was set at 25°C for the leaf temperature and 60–70% for the relative humidity (Figure 1); this is referred to as an open chamber system (Garcia et al., 1990). The CO2 concentration inside the chamber was set to range between 80 and 200 Pa to measure the photosynthesis rate of the entire plant while maintaining a CO2 level above the saturation points (Shin et al., 2011). An additional supply of CO2 gas was implemented when the CO2 concentration in the chamber was ~80 Pa. The CO2 concentrations inside the chamber were detected using a CO2 analyser (LI-820, LI-COR, USA). CO2 leakage of the chamber was about 0.2–0.3 μmol CO2 s−1 under the experimental CO2 condition (Figure S1). Irradiance inside the chamber was measured using an irradiation sensor (BF5, Delta-T Devices, UK) and the diffuse ratio was also determined. To maintain the temperature and CO2 concentration inside the chamber, two radiators circulating cool water were placed along each sidewall. A fan was passed through the radiators and blown toward the chamber wall to maintain equal ventilation. The temperature inside the chamber was maintained at 25°C by circulating cooled water controlled by a condenser (DH-003A, Daeho-condenser, Korea). The CO2 concentration, irradiance, and temperature inside the chamber were stored in a data logger every 10 s. Silica gel was used in the air circulation process to control increased humidity from the transpiration of the plant. A plant was selected from among five samples and was placed in the chamber from 9:00 to 18:00. Whenever the CO2 concentration reached approximately 100 Pa, additional CO2 was supplied to retain a saturated CO2 condition (Figure 2).
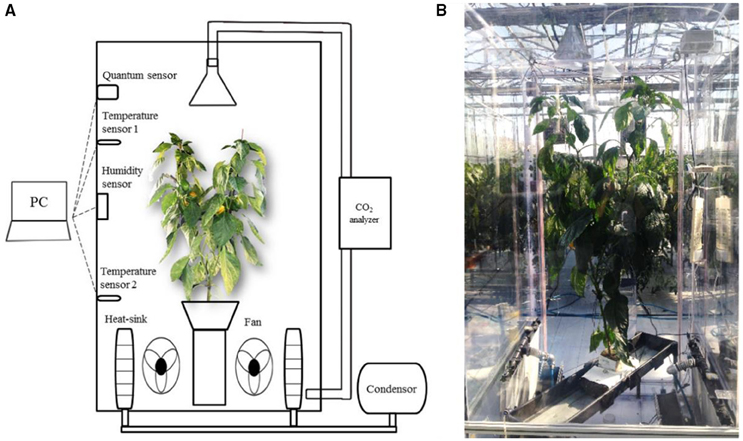
Figure 1. A schematic diagram (A), and actual installation (B) of a closed growth chamber for measuring CO2 consumption of paprika plant.
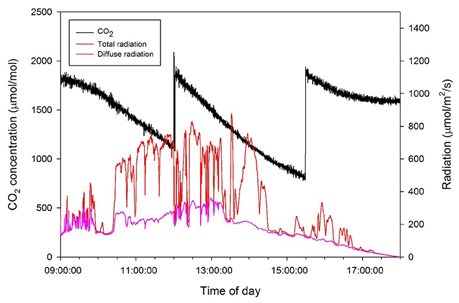
Figure 2. Daily changes in CO2 concentration in the closed chamber with light intensity above the plant on 15 October 2014.
Construction of the 3D Virtual Plant
Before sealing the chamber for measuring the entire plant's photosynthesis, a sample plant free from disorders was chosen to design the 3D virtual plant. The structure of the sample plant was measured using a ruler and protractor to transpose the real structure of the plant to a 3D graphic. The architect parameters consisted of three major parts (leaf, petiole, and stem) and the detailed measurements included the following: (1) leaf area and leaf angle; (2) petiole length and petiole angle; and (3) stem length, stem diameter, and stem angle. The area of each leaf within the sample plant was measured using a leaf area meter (LI-3100, LI-COR, USA). Structural characteristics of leaves and stems by layer were measured as Table 1.
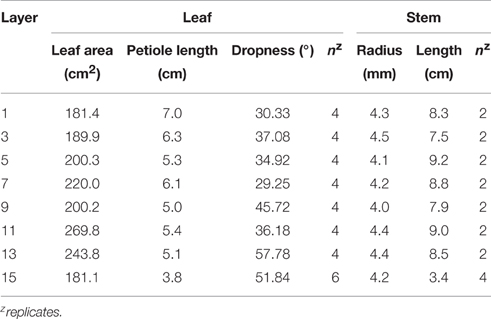
Table 1. Structural characteristics of leaves and stems by layer.
A 3D plant model was developed using graphic software (Houdini FX, FX, Canada), as shown in Figure 3. Using an L-system formalism, which is useful in the construction of a plant's growth pattern, the plant structure could be built up from the bottom to the top in the tree window (Figure 3D) by applying structure values for each part of the plant. For the validation procedure, the actual plant inside the closed chamber was virtualized as a 3D graphic plant that referred to the measured values of the plant structure and the digitized data using a 3D digitizer (Sense, 3D systems, Inc., USA). The virtual plant consisted of two primary stems having 15 nodes each. The calculation of the leaf area (LA) is determined using the length (L) and width (W). The leaf area equation is embedded inside the graphic tool, LA = 0.6034 LW + 0.0732 (R2 = 0.994, p < 0.001; Tai et al., 2009). The leaves with an accurate leaf area were simultaneously shown on the graphic window when the users input the values of L and W (Figure 3D). The petiole and leaf angles were also applied by inputting the angles (x, y, z) of the directions (Figures 3A,B).
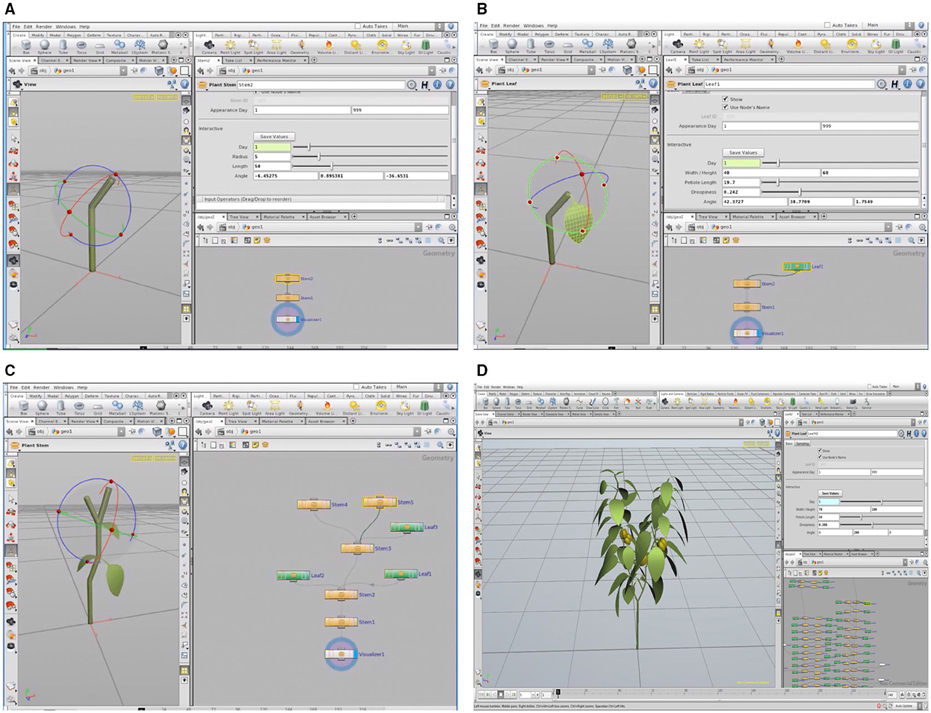
Figure 3. A 3D virtual plant constructed in the L-system using the Houdini FX graphic software: construction of paprika stem (A) and leaf (B), the process of modeling the paprika (C), and tree window of L-system formalism and graphic window of the completed paprika structure (D).
Simulation of the Intercepted Irradiation
Redesigning the 3D plant was accomplished using 3D CAD software (SOLIDWORKS, Dassault Systemes, FRANCE), and light interception analysis was simulated using ray-tracing software (OPTISWORKS, OPTIS Inc., FRANCE). Light illuminance on the surface of the leaves of the 3D plant model was calculated to investigate the intercepted irradiance in specific conditions and values of light intensity were obtained on the 3D leaf surface. The growth chamber was modeled with the 3D CAD software and assembled with the 3D plant model. With the simulation software it was possible to input microclimate parameters: sun directions (coordinates, date, time, zenith, north direction), and sunlight properties (ratio of direct light and diffuse light); and material parameters: optical properties of the leaf, chamber, and glasshouse structure. Optical properties (transmittance and reflectance) were measured using an integrating sphere (IC2, StellarNet Inc., CANADA) with a spectrometer (BLUE-Wave, StellarNet Inc., CANADA) and a light source (SL1 Tungsten Halogen, StellarNet Inc., CANADA) and entered in the preferences section for the leaves in the simulation program (Figure 4). In the leaf optical measurements, the optical properties of the leaves have little differences in the vertical position within the plant. The reflectance and transmittance of both sides of leaf were used as 0.1 and 0.07, respectively, in our simulation; Ray-tracing simulations were conducted with 10 giga rays and the number of max impacts was set to be 10 for all conditions. Identifying the applicability for expanding to a canopy situation, plant arrays of 1 × 1 and 3 × 3 with a distance of 0.8 m between plants were set to investigate the different patterns of intercepted radiation. Detectors were placed on the surface of a single plant located in the center of the canopy. Four cases were simulated at 9:00, 12:00, 15:00, and 18:00 and the intercepted irradiance was analyzed for each layer.
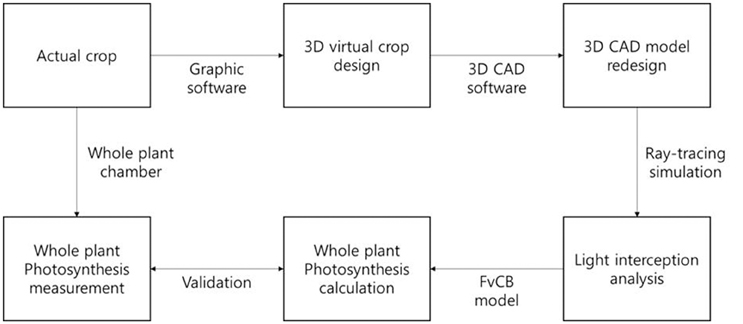
Figure 4. A work flow for construction of 3D plant model, calculation, and validation of a whole plant photosynthesis rate.
Calculation of the Photosynthetic Parameters
A/Ci curve fitting utility was used to calculate the photosynthetic parameters (Sharkey et al., 2007). The prediction of the leaf photosynthesis rate was based on the FvCB model (Equation 1).
where Al is the rate of the leaf's net assimilation, and Av and Aj indicate the rates of the leaf gross assimilation limited by ribulose biphosphate-carboxylase-oxygenase (Rubisco) activity and ribulose biphosphate (RuBP) regeneration, respectively. Al is determined by the minimum value of the two rates (Equation 1). Each rate can be expressed as various leaf characteristics (the maximum photosynthetic Rubisco capacity, Vlm, and the maximum rate of electron transport, Jm). All of the temperature conditions in the current experiment were fixed at 25°C to neglect the effect of temperature on the parameters and, therefore, on the temperature-related functions in the model.
The maximum photosynthesis rate (Amax) was calculated from the light curve at each layer by using a non-rectangular hyperbolic function. The photosynthetic Rubisco capacity (Vl) was also obtained from the A/Ci curve by using a non-linear regression. Assuming that the CO2 fixation rate is limited only by Rubisco activity in a low CO2 condition, and Vl value of each layer was estimated from the A/Ci curve of each layer within the range Ci < 30 Pa (Equation 2). Similarly, the potential rate of the electron transport (Jm) values was determined from the A/Ci curve at a range above 40 Pa for Ci (Equations 3, 4).
where Ile is the photosynthetic active radiation (PAR) effectively absorbed by PSII, and J is the rate of electron transport. Detailed model equations and constants are shown in Tables 2, 3. Il is the total absorbed PAR per unit leaf area. Calculation of all the parameters were followed by de Pury and Farquhar (1997) and Kim and Lieth (2003).
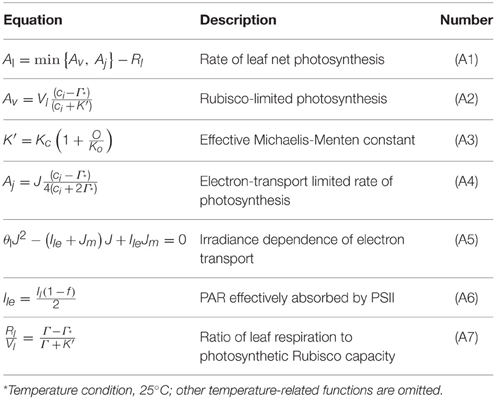
Table 2. Equations of the FvCB model.
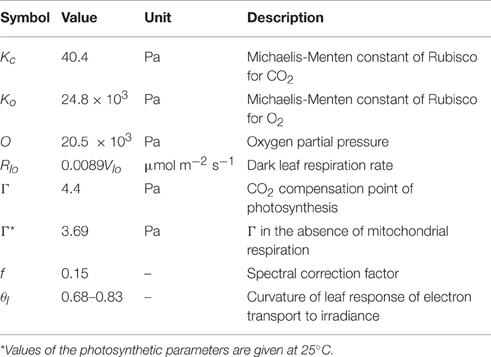
Table 3. Photosynthetic parameters and constants of the FvCB model at 25°C.
Validation of Whole Plant Photosynthetic Rate
With an average value of intercepted irradiation from the simulation and photosynthetic parameters from the measurements at each layer, the leaf photosynthesis rate was calculated for each layer. To apply the actual light intensity from the logged data to an estimate, the average values of light intensity and the diffuse ratio for 30 min were used. By integrating the photosynthesis rate at each layer, the photosynthesis rate of the entire plant was calculated using the sum of Al in each layer.
According to this method, the estimated data were calculated every half hour and these data of the entire plant's photosynthesis rate were compared with actual data from 9:00 to 18:00 on October 15, 2014, for validation. From an actual measurement of the CO2 concentration in a sealed chamber, the reduction of the CO2 concentration was converted to a photosynthesis rate assuming that the slope of the CO2 concentration is the same as the photosynthesis rate. A work flow for construction of 3D plant model, calculation, and validation of a whole plant photosynthesis rate was described as Figure 4.
Results
Distribution of the Maximum Photosynthesis Rate and Leaf Nitrogen Content within the Entire Plant
The maximum photosynthesis rate, Amax, at each layer was measured to be within 1000 μmol m−2 s−1 of the light intensity and 100 Pa of the CO2 saturation condition as shown in Figure 5. The mean values of Amax decreased from the top (layer 15) to the bottom (layer 1), from 37.04 to 12.41 μmol m−2 s−1, respectively. The standard variations of Amax were somewhat higher in the upper part than the bottom, indicating that the range of Amax appeared broader in the younger leaves compared to the older leaves at the bottom. Unlike the exponential patterns generally assumed in many photosynthesis models, the distribution of Amax for an individual plant showed a linear pattern on all of the five sample plants.
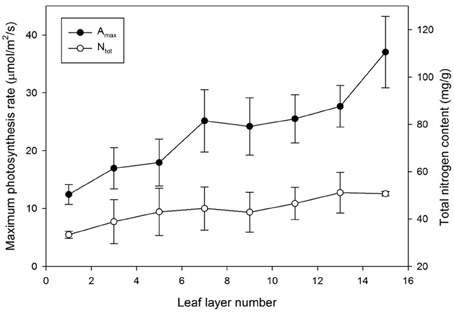
Figure 5. Maximum photosynthesis rate (Amax) and total nitrogen content (Ntot) by leaf layer number. Vertical bars represent the Mean ± SE (n = 5).
In the case of nitrogen distribution, the total nitrogen content in each leaf increased with an increase in the leaf layer number. Although the standard deviation in the middle layer was greater, the total nitrogen content in the uppermost layer was more than double that in the bottom layer, similar to Amax, and it was apparent that most of the nitrogen was allocated to the upper layer, which retained higher light use efficiency (Figure 5). Decreasing patterns of Amax and Ntot were very similar in the vertical distribution, indicating that the nitrogen content is strongly correlated with the photosynthetic capacity. Converting a leaf nitrogen content on a dry mass basis (mg g−1) to a leaf nitrogen concentration on a leaf area basis (g m−2), the spatial distribution of the nitrogen content on a leaf area basis was not significantly meaningful.
Distribution of Photosynthetic Parameters, Vlo and Jmo, within an Entire Plant
Comparing the light curves and A/Ci curves at each layer, the photosynthetic capacity in a certain position varied considerably among the layers, resulting in different light use efficiencies. Changes in Vlo and Jmo were identified by the leaf position using the measured value of Al for each layer at 25°C (Table 4). The range of θ is a between 0.68 and 0.83 regardless of the leaf layer number. By increasing the leaf layer number, both the average values of Vlo and Jmo decreased from 88.62 and 175.42 (layer 15) to 20.31 and 50.83 μmol m−2 s−1 (layer 1), respectively. Despite significant variations, both average values of the parameters showed linear patterns in the vertical distribution rather than exponential patterns within the plant, similar to Amax and Ntot. Average values of photosynthetic parameters were selected to use in the calculation of the photosynthesis rate at each layer.
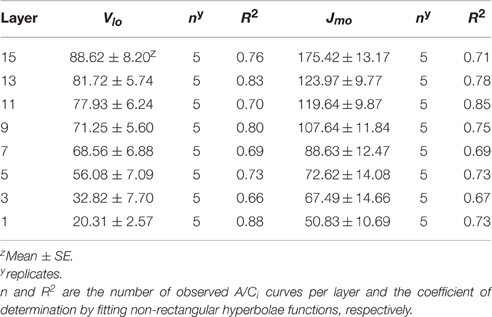
Table 4. Estimation of the photosynthetic parameters Vlo (= value of Vl at 25°C) and Jmo (= value of Jm at 25°C).
Validation of an Entire Plant's Photosynthesis and Expansion to the Canopy Situation
Half hour-photosynthesis rates of the sample plant were compared with estimated rates and showed good agreement with a coefficient of determination (R2) of 0.85 and a root mean square error (RMSE) of 0.47 (Figure 6). The estimation values were slightly lower than actual values at 9:00 to 10:30 and upper at 11:30 to 15:00. Daily variations in the photosynthesis rates were clearly shown in the estimated data. For the canopy situation, the 3D simulated data explicitly shows the shading effect of the neighboring plants, which mostly appeared in the middle and bottom layers (Figure 7). From an overhead view the intercepted irradiance within the plant was primarily affected by the plant, which was oriented toward the sun. The total intercepted radiation of the center plant surrounded by eight plants did not decrease significantly regardless of the number of neighboring plants and the shade time determined by the height of the neighboring plants. In estimating the intercepted irradiation at each layer, linear decay appeared at the top and middle layers, and the variations in the intercepted irradiation occurred as a result of the changes in sun direction (Figure 8).
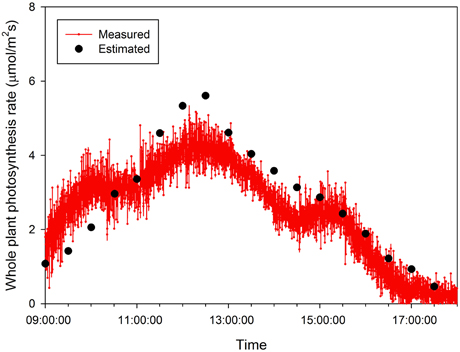
Figure 6. A comparison of measured and estimated photosynthesis rates of the entire plant on 15 October 2014.
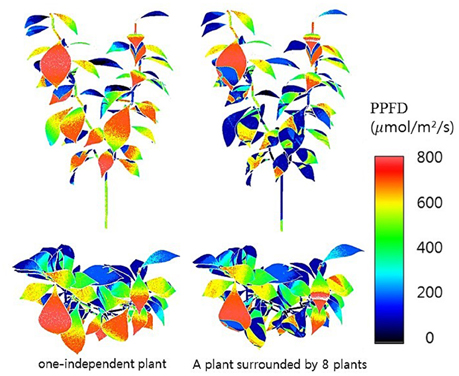
Figure 7. 3D simulated results of intercepted irradiances of a single plant at 12:00 not surrounded (left) and surrounded (right) by eight plants.
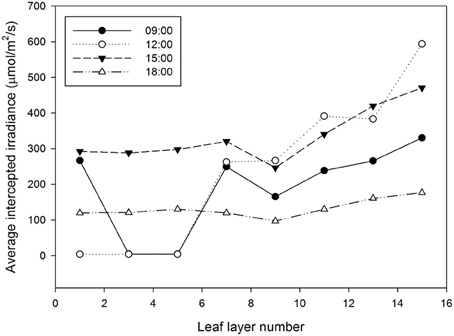
Figure 8. Estimation of the average intercepted irradiation by leaf layer number from the ray-tracing simulation. The detected sample was a center plant inside a 3 × 3 canopy cultivation condition.
Discussion
Canopy photosynthesis is such a complex mechanism that the correlation of various environmental factors engaged in the photosynthesis process should be considered. Furthermore, scaling up from leaf to canopy, intercepted radiation and the optical and physiological properties related to the photosynthetic capacity should be considered, including leaf age, leaf acclimation to light, and nitrogen distribution within the canopy. However, it is necessary to clarify the relationship between light acclimation and nitrogen distribution, which is also heterogeneous within the canopy. Intercepted radiation is sensitively affected by leaf shape, leaf angle, and plant position inside the canopy architecture (Gonzalez-Real and Baille, 2000; Sarlikioti et al., 2011); therefore, precise measurement of intercepted radiation on the plant surface is not easy because of technical limitations.
Accordingly, 3D model is necessary for analysis of intercepted irradiation (Figure 3). To obtain the precise architecture for a plant in a 3D model, advanced technology for scanning the material is required to simulate the intercepted radiation on the plant surface, and the supporting hardware should be accompanied by an increased number of rays in the optical simulation. In actual canopy conditions, the heterogeneity of plant architecture still exists such that the compromise between precision and simplicity is inevitable in analyzing canopy photosynthesis. A simplified analysis method with guarantee of its accuracy is strongly required to perceive dynamic changes of the canopy photosynthesis rate in real-time.
There are still many possibilities to improve the analysis by (1) parameterization by using chlorophyll fluorescence as input (Bellasio et al., 2016), (2) development of dynamic architectural models related with physiological events (Chen et al., 2014b, 2015), (3) analysis of horticultural practices on the model behavior (de Visser et al., 2014), (4) specification of the relationships between nitrogen content and photosynthetic parameters, (5) analysis of photosynthesis as influenced by stomatal conductance and CO2 concentration (Kim and Lieth, 2003), and (6) reduction of CO2 leakage and inhomogeneous air mixing in the chamber.
Especially, the spatial distribution of nitrogen allocation provides another method for estimating canopy photosynthesis with regards to the photosynthetic capacity. Standard deviations of the nitrogen content exist primarily in the middle layers, indicating that the heterogeneity of the light environment in the canopy primarily occurred as a result of additional influences such as a sun fleck or shading effect by neighboring plants. Although many researchers determined the optimal distribution of nitrogen in nature to be a method for maximizing canopy photosynthesis (Hirose and Werger, 1987; Schieving et al., 1992), the detailed mechanism of leaf acclimation to the light environment remains under investigation including the quantitative analyzes of photosynthetic capacity (Ellsworth and Reich, 1993; Iio et al., 2005; Anten and During, 2011). The spatial distribution of nitrogen within the canopy is greatly simplified by models to calculate the canopy photosynthesis, and fixing the pattern of the photosynthetic parameters may cause errors in the precise estimation of canopy photosynthesis. In the current study, the leaf layer criteria of paprika were simplistically established because of the plant architecture pattern. However, additional criteria might be required for other species such as leafy vegetables that have a horizontal structure rather than a vertical structure.
In addition, other environmental factors such as the external CO2 concentration, temperature, and leaf age also affect the leaf properties of photosynthesis (Thornley, 2002; Escudero and Mediavilla, 2003). It was assumed in this research that the spatial distributions of the external CO2 concentration and temperature are identical within the canopy. Paprika transplanted after 3 months were chosen in the current analysis because of the closed chamber's size limitations. In applying later growth stages, the conditions for the analysis should be modified because the intercepted radiation is changed by neighboring plants whose heights are greater. Furthermore, leaf age functions should be incorporated into the FvCB model (Irving and Robinson, 2006) to estimate the photosynthesis of each leaf for different growth stages within the canopy.
By measuring the actual photosynthetic rates of a whole plant in the growth chamber, we could validate the canopy photosynthetic results estimated with the 3D plant model and light ray-tracing method. Interestingly, the measured canopy photosynthesis (Figure 6) did not simultaneously reflect the fluctuating light condition (Figure 2). This might be due to that, technically, the air in the chamber could not be homogeneously mixed. Estimated values were around 5–10% different from measured. In spite of several existing limitations in estimating the canopy's photosynthesis, the simulation method developed is quite suitable for precisely predicting the canopy's photosynthesis rate by applying microclimatic factors such as the location, date, time, diffuse ratio, and optical properties of the materials. From the simulated data, the sun fleck inside the canopy was found to change with time and the average light intensity of a certain layer depends on the amount of direct sunlight. Furthermore, fractions of sunlit and shaded areas changed through time (Figure 2), with the result that the vertical distributions of intercepted radiation did not always follow the pattern of the Lambert-Beer's law that irradiation is exponentially decayed (Figure 8). An increase in the diffuse ratio of sunlight reduces light variations among the leaves at different locations in the canopy. The current simulation results identified that the pattern of intercepted irradiation within the entire plant was strongly determined by sun direction and its optical properties.
In the current study, an analysis method to determine the canopy photosynthesis was developed using graphic software based on a 3D model and ray-tracing simulation (Figure 7). The photosynthetic capacity within the plant was significantly different among the vertical positions (Table 4). With the intercepted irradiation data and photosynthetic parameters of each layer, the values of an entire plant's photosynthesis rate were estimated by integrating the calculated photosynthesis rate at each layer. The estimated photosynthesis rate of an entire plant showed good agreement with the measured plant using a closed chamber for validation (Figure 6). The advantages of this method are the availability of precise analysis of canopy photosynthesis considering various environmental factors and the expendability to a greenhouse cultivation condition. By expanding this approach to canopy conditions, it is possible to analyze the canopy's photosynthesis as a key factor in a cultivation system. By supplementing plant physiological aspects, the method could be a powerful tool to predict the mass production of horticultural crops in greenhouses.
Author Contributions
JK and JL developed the 3D model, conducted the measurement and simulation. TA, JHS, and KP constructed the growth chamber and controlled the environments. JES designed the experiment, developed the 3D model, and conducted the total analysis.
Conflict of Interest Statement
The authors declare that the research was conducted in the absence of any commercial or financial relationships that could be construed as a potential conflict of interest.
Acknowledgments
This research was supported by the MSIP (Ministry of Science, ICT and Future Planning), Korea, under the ITRC (Information Technology Research Center) support program (IITP-2016-H8601-16-1007) supervised by the IITP (Institute for Information and Communications Technology Promotion).
Supplementary Material
The Supplementary Material for this article can be found online at: http://journal.frontiersin.org/article/10.3389/fpls.2016.01321
Figure S1. Change in CO2 concentration in the closed chamber without plant for 9 h.
References
Anten, N. P. R., and During, H. J. (2011). Is analyzing the nitrogen use at the plant canopy level a matter of choosing the right optimization criterion? Oecologia 16, 293–303. doi: 10.1007/s00442-011-2011-3
Bellasio, C., Beerling, D. J., and Griffiths, H. (2016). An Excel tool for deriving key photosynthetic parameters from combined gas exchange and chlorophyll fluorescence:theory and practice. Plant Cell Environ. 39, 1180–1197. doi: 10.1111/pce.12560
Buck-Sorlin, G., de Visser, P. H. B., Henke, M., Sarlikioti, V., van der Heijden, G. W. A. M., Marcelis, L. F. M., et al. (2011). Towards a functional-structural plant model of cut-rose: simulation of light environment, light absorption, photosynthesis and interference with the plant structure. Ann. Bot. 108, 1121–1134. doi: 10.1093/aob/mcr190
Caldwell, M. M., Meister, H. P., Tenhunen, J. D., and Lange, O. L. (1986). Canopy structure, light microclimate and leaf gas exchange of Quercus coccifera L. in a Portuguese macchia: measurements in different canopy layers and simulations with a canopy model. Trees 1, 25–41. doi: 10.1007/BF00197022
Chen, J. M., Liu, J., Cihlar, J., and Goulden, M. L. (1999). Daily canopy photosynthesis model through temporal and spatial scaling for remote sensing applications. Ecol. Model. 124, 99–119. doi: 10.1016/S0304-3800(99)00156-8
Chen, T. W., Henke, M., de Visser, P. H. B., Buck-Sorlin, G., Wiechers, D., Kahlen, K., et al. (2014a). What is the most prominent factor limiting photosynthesis in different layers of a greenhouse cucumber canopy? Ann. Bot. 114, 677–688. doi: 10.1093/aob/mcu100
Chen, T. W., Nguyen, T. M., Kahlen, K., and Stützel, H. (2015). High temperature and vapor pressure deficit aggravate architectural effects but ameliorate non-architectural effects of salinity on dry mass production of tomato. Front. Plant Sci. 6:887. doi: 10.3389/fpls.2015.00887
Chen, T. W., Nguyen, T. M. N., Kahlen, K., and Stützel, H. (2014b). Quantification of the effects of architectural traits on dry mass production and light interception of tomato canopy under different temperature regimes using a dynamic functional–structural plant model. J. Exp. Bot. 65, 6399–6410. doi: 10.1093/jxb/eru356
de Pury, D. G. G., and Farquhar, G. D. (1997). Simple scaling of photosynthesis from leaves to canopies without the errors of big-leaf models. Plant Cell Environ. 20, 537–557. doi: 10.1111/j.1365-3040.1997.00094.x
der Zande, D. V., Struckens, J., Verstraeten, W. W., Mereu, S., Muys, B., and Coppin, P. (2011). 3D modeling of light interception in heterogeneous forest canopies using ground-based LiDAR data. Int. J. Appl. Earth Observ. Geoinf. 13, 792–800. doi: 10.1016/j.jag.2011.05.005
de Visser, P. H., Buck-Sorlin, G. H., and Van Der Heijden, G. W. (2014). Optimizing illumination in the greenhouse using a 3D model of tomato and a ray tracer. Front. Plant Sci. 5:48. doi: 10.3389/fpls.2014.00048
Dreccer, M. F., Oijen, M. V., Schapendonk, A. H. C. M., Pot, C. S., and Rabbinge, R. (2000). Dynamics of vertical leaf nitrogen distribution in a vegetative wheat canopy, impact on canopy photosynthesis. Ann. Bot. 86, 821–831. doi: 10.1006/anbo.2000.1244
Elifis, P., Kratochvilovfi, I., Janous, D., Marek, M., and Masarovicovfi, E. (1989). Stand microclimate and physiological activity of tree leaves in an oak-hornbeam forest I. Stand microclimate. Trees 4, 227–233.
Ellsworth, D. S., and Reich, P. B. (1993). Canopy structure and vertical patterns of photosynthesis and related leaf traits in a deciduous forest. Oecologia 96, 169–178. doi: 10.1007/BF00317729
Escudero, A., and Mediavilla, S. (2003). Decline in photosynthetic nitrogen use efficiency with leaf age and nitrogen resorption as determinants of leaf life span. J. Ecol. 91, 880–889. doi: 10.1046/j.1365-2745.2003.00818.x
Farquhar, G. V., von Caemmerer, S. V., and Berry, J. A. (1980). A biochemical model of photosynthetic CO2 assimilation in leaves of C3 species. Planta 149, 78–90. doi: 10.1007/BF00386231
Field, C. (1983). Allocating leaf nitrogen for the maximization of carbon gain: leaf age as a control on the allocation program. Oecologia 56, 341–347. doi: 10.1007/BF00379710
Garcia, R. L., Norman, J. M., and Mcdermitt, D. K. (1990). Measurements of canopy gas exchange using an open chamber system. Remote Sens. Rev. 5, 141–162. doi: 10.1080/02757259009532126
Gonzalez-Real, M. M., and Baille, A. (2000). Changes in leaf photosynthetic parameters with leaf position and nitrogen content within a rose plant canopy (Rosa hybrid). Plant Cell Environ. 23, 351–363. doi: 10.1046/j.1365-3040.2000.00559.x
Hikosaka, K. (2014). Optimal nitrogen distribution within a leaf canopy under direct and diffuse light. Plant Cell Environ. 37, 2077–2085. doi: 10.1111/pce.12291
Hirose, T., and Werger, M. J. A. (1987). Maximizing daily canopy photosynthesis with respect to the leaf nitrogen allocation pattern in the canopy. Oecologia 72, 520–526. doi: 10.1007/BF00378977
Iio, A., Fukasawa, H., Nose, Y., Kato, S., and Kakubari, Y. (2005). Vertical, horizontal and azimuthal variations in leaf photosynthetic characteristics within a Fagus crenata crown in relation to light acclimation. Tree Physiol. 25, 533–544. doi: 10.1093/treephys/25.5.533
Irving, L. J., and Robinson, D. (2006). A dynamic model of Rubisco turnover in cereal leaves. New Phytol. 169, 493–504. doi: 10.1111/j.1469-8137.2005.01584.x
Johnson, I. R., Thornley, J. H. M., Frantz, J. M., and Bugbee, B. (2010). A model of canopy photosynthesis incorporating protein distribution through the canopy and its acclimation to light, temperature and CO2. Ann. Bot. 106, 735–749. doi: 10.1093/aob/mcq183
Jovicich, E., Cantliffe, D. J., and Stoffella, P. J. (2004). Fruit yield and quality of greenhouse-grown bell pepper as influenced by density, container, and trellis system. Horttechnology 14, 507–513.
Kang, W. H., Zhang, F., Lee, J. W., and Son, J. E. (2016). Improvement of canopy light distribution, photosynthesis, and growth of lettuce (Lactuca Sativa L.) in plant factory conditions by using filters to diffuse light from LEDs. Korean J. Hortic. Sci. Technol. 34, 84–93. doi: 10.12972/kjhst.20160015
Kim, H. S., Palmroth, S., Thérezién, M., Stenberg, P., and Oren, R. (2010). Analysis of the sensitivity of absorbed light and incident light profile to various canopy architecture and stand conditions. Tree Physiol. 31, 30–47. doi: 10.1093/treephys/tpq098
Kim, S. H., and Lieth, J. H. (2003). A coupled model of photosynthesis, stomatal conductance and traspiration for a rose leaf (Rosa hybrida L.). Ann. Bot. 91, 771–781. doi: 10.1093/aob/mcg080
Kjeldahl, J. (1883). A new method for the determination of nitrogen in organic matter. Z. Anal. Chem. 22, 366–382. doi: 10.1007/BF01338151
Lieth, J. H., and Pasian, C. C. (1990). A model of net photosynthesis of rose leaves as a function of photosynthetically active radiation, leaf temperature, and leaf age. J. Amer. Soc. Hort. Sci. 115, 486–491.
Mabrouk, H., Sinoquet, H., and Carbonneau, A. (1997). Canopy structure and radiation regime in grapevine. II. Modeling radiation interception and distribution inside the canopy. Vitis 36, 125–132.
Monsi, M., and Saeki, T. (1953). The light factor in plant communities and its significance for dry matter production. J. Bot. 14, 22–52.
Norman, J. M. (1980). Interfacing leaf and canopy light interception models in predicting photosynthesis for ecosystem models. CRC Press 2, 49–67.
Le Roux, X., Sinoquet, H., and Vandame, M. (1998). Spatial distribution of leaf dry weight per area and leaf nitrogen concentration in relation to local radiation regime within an isolated tree crown. Tree Physiol. 19, 181–188. doi: 10.1093/treephys/19.3.181
Sarlikioti, V., de Visser, P. H. B., Buck-Sorlin, G. H., and Marcelis, L. F. M. (2011). How plant architecture affects light absorption and photosynthesis in tomato: towards an ideotype for plant architecture using a functional-structural plant model. Ann. Bot. 108, 1065–1073. doi: 10.1093/aob/mcr221
Schieving, F., Pons, T. L., Werger, M. J. A., and Hirose, T. (1992). The vertical distribution of nitrogen and photosynthetic activity at different plant densities in Carex acutiformis. Plant Soil 14, 9–17.
Sharkey, T. D., Bernacchi, C. J., Farquhar, G. D., and Singsaas, E. L. (2007). Fitting photosynthetic carbon dioxide response curves for C3 leaves. Plant Cell Environ. 30, 1035–1040. doi: 10.1111/j.1365-3040.2007.01710.x
Shin, J. W., Ahn, T. I., and Son, J. E. (2011). Quantitative measurement of carbon dioxide consumption of a whole Paprika plant (Capsicum annumm L.) using a large sealed chamber. Korean J. Hortic. Sci. Technol. 29, 211–216.
Stirling, C. M., Aguilera, C., Baker, N. R., and Long, S. P. (1994). Changes in the photosynthetic light response curve during leaf development of field grown maize with implications for modelling canopy photosynthesis. Photosyn. Res. 42, 217–225. doi: 10.1007/BF00018264
Tai, N. G., Hung, T. T., Ahn, T. I., Park, J. S., and Son, J. E. (2009). Estimation of leaf area, fresh weight, and dry weight of Paprika (Capsicum annuum L.) using leaf length and width in rockwool-based soilless culture. Hortic. Environ. Biotechnol. 50, 422–426.
Tang, L., Hou, C., Huang, H., Chen, C., Zou, J., and Lin, D. (2015). Light interception efficiency analysis based on three-dimensional peach canopy models. Ecol. Inform. 30, 60–67. doi: 10.1016/j.ecoinf.2015.09.012
Thornley, J. H. M. (2002). Instantaneous canopy photosynthesis: analytical expressions for sun and shade leaves based on exponential light decay down the canopy and an acclimated non-rectangular hyperbola for leaf photosynthesis. Ann. Bot. 89, 451–458. doi: 10.1093/aob/mcf071
Yin, X., and Struik, P. C. (2009). C3 and C4 photosynthesis models: An overview from the perspective of crop modelling. NJAS Wageningen J. Life Sci. 57, 27–38. doi: 10.1016/j.njas.2009.07.001
Keywords: FvCB model, light interception, paprika, photosynthetic rate, vertical position
Citation: Kim JH, Lee JW, Ahn TI, Shin JH, Park KS and Son JE (2016) Sweet Pepper (Capsicum annuum L.) Canopy Photosynthesis Modeling Using 3D Plant Architecture and Light Ray-Tracing. Front. Plant Sci. 7:1321. doi: 10.3389/fpls.2016.01321
Received: 17 March 2016; Accepted: 18 August 2016;
Published: 09 September 2016.
Edited by:
Alexander Bucksch, University of Georgia, USAReviewed by:
Tsu-Wei Chen, Leibniz University of Hanover, GermanyMalia Gehan, Donald Danforth Plant Science Center, USA
Copyright © 2016 Kim, Lee, Ahn, Shin, Park and Son. This is an open-access article distributed under the terms of the Creative Commons Attribution License (CC BY). The use, distribution or reproduction in other forums is permitted, provided the original author(s) or licensor are credited and that the original publication in this journal is cited, in accordance with accepted academic practice. No use, distribution or reproduction is permitted which does not comply with these terms.
*Correspondence: Jung Eek Son, sjeenv@snu.ac.kr
†These authors have contributed equally to this work.