 Jun Tang
 Jing Lin1*
 Zong-Ming Cheng
- 1Jiangsu Key Laboratory for Horticultural Crop Genetic Improvement, Institute of Horticulture, Jiangsu Academy of Agricultural Sciences, Nanjing, China
- 2Department of Plant Sciences, University of Tennessee at Knoxville, Knoxville, TN, USA
Asian pear (Pyrus bretschneideri) is one of the most important fruit crops in the world, and its growth and productivity are frequently affected by abiotic stresses. Calcineurin B-like interacting protein kinases (CIPKs) as caladium-sensor protein kinases interact with Ca2+-binding CBLs to extensively mediate abiotic stress responses in plants. Although the pear genome sequence has been released, little information is available about the CIPK genes in pear, especially in response to salt and osmotic stresses. In this study, we systematically identified 28 CIPK family members from the sequenced pear genome and analyzed their organization, phylogeny, gene structure, protein motif, and synteny duplication divergences. Most duplicated PbCIPKs underwent purifying selection, and their evolutionary divergences accompanied with the pear whole genome duplication. We also investigated stress -responsive expression patterns and co-expression networks of CIPK family under salt and osmotic stresses, and the distribution of stress-related cis-regulatory elements in promoter regions. Our results suggest that most PbCIPKs could play important roles in the abiotic stress responses. Some PbCIPKs, such as PbCIPK22, -19, -18, -15, -8, and -6 can serve as core regulators in response to salt and osmotic stresses based on co-expression networks of PbCIPKs. Some sets of genes that were involved in response to salt did not overlap with those in response to osmotic responses, suggesting the sub-functionalization of CIPK genes in stress responses. This study revealed some candidate genes that play roles in early responses to salt and osmotic stress for further characterization of abiotic stress responses medicated by CIPKs in pear.
Introduction
Plants often encounter abiotic stresses, such as high salinity, drought, and low temperatures, which can adversely affect their growth, development, and productivity during their life cycles. To cope with these stresses, plants have evolved complex strategies to perceive, transduce, and respond to stresses at the molecular, cellular, and physiological levels (Zhu, 2002; Yamaguchi-Shinozaki and Shinozaki, 2006; Manik et al., 2015). During response and adaptation to stresses, calcineurin B-like (CBL) interacting protein kinases (CIPKs) have been reported to be involved in the stress responses (Kim et al., 2003; Kolukisaoglu et al., 2004). CIPK proteins, also known as SnRK3 proteins, are an important category of serine/threonine protein kinases in plants. The CIPK genes consist of an N-terminal protein kinase domain similar to those found in other plant protein kinases and a unique C-terminal regulatory domain (Luan, 2009; Chaves-Sanjuan et al., 2014; Kleist et al., 2014). The C-terminal regulatory domain of CIPKs contain the conserved NAF domain (Pfam no. PF03822) that acts as a self-inhibitory motif by interacting with Ca2+-binding CBLs to activate the kinase catalytic activity of CIPK, which decodes calcium signals elicited during stress stimuli (Albrecht et al., 2001; Weinl and Kudla, 2009; Chaves-Sanjuan et al., 2014; Pandey et al., 2015).
Calcineurin B-like interacting protein kinases are extensively involve in plant stress responses. The salt overly sensitive (SOS) pathway was the first identified CBL-CIPK pathway for maintaining ion homeostasis in plant cells (Qiu et al., 2002). The SOS pathway contains three components, SOS3 (a Ca2+ sensor of the CBL family), SOS2 (a CIPK protein), and SOS1 (a Na+/H+ antiporter activated by SOS2), that have been well characterized for their roles in maintaining ion homeostasis during salt stress (Xiong et al., 2002; Qiu et al., 2004; Ji et al., 2013). Overexpression of single or common SOS pathway genes can enhance salt tolerance in transgenic plants (Qiu et al., 2002; Guo et al., 2004; Batelli et al., 2007; Ma et al., 2014). Additionally, the SOS pathway, in response to salinity stress, is also functionally conserved in plants (Martinez-Atienza et al., 2007; Tang et al., 2010). Moreover, some CIPK genes in Rosaceae species function similarly to AtCIPK24/AtSOS2 in salt tolerance (Hu et al., 2012; Wang R.K. et al., 2012).
Asian pear (Pyrus bretschneideri) is one of the most important fruit crops in the family of Rosaceae, and is widely cultivated in world. Pear is frequently affected by abiotic stress, such as salinity, drought or osmotic stress, which affect growth, development, and productivity. Although the pear genome sequence has been released (Wu et al., 2013), up to now, the CIPK family has not been fully characterized specifically. How CIPK genes respond to salt or osmotic stress is still unclear. In this study, we performed a genome-wide identification and analysis of CIPK family in pear, and 28 PbCIPK genes were analyzed for family organization, gene structure and conserved motif, genomic location, gene duplication, evolutionary divergence, stress-related cis-elements, and expression patterns, and co-expression networks under salt and osmotic stresses. Systematic analyses indicated that most duplicated PbCIPKs underwent the purifying selection and evolutionary divergences accompanied with pear whole genome duplications. Moreover, stress-responsive cis-element analysis revealed the possible roles of PbCIPK genes to respond to abiotic stresses. Expression analysis of PbCIPKs under salt and osmotic stresses indicated that some CIPKs are involved in the co-response of salt and osmotic stresses, whereas others were sub-functionalized in response to salt stress and osmotic stress, respectively. Additionally, based on gene co-expression analysis of PbCIPKs, we identified PbCIPK22, -19, -18, -15, -8, and -6 as core regulators in response to salt and osmotic stresses. This work indicates the roles of CIPK genes in pear in response to abiotic stress and provides some basic information for stress-resistance studies of CIPKs.
Materials and Methods
Database Searches and Identification of CIPK Genes in Asian Pear
Whole genome annotation sequences of Asian pear (P. bretschneideri) were collected from the pear genome project1 (Wu et al., 2013). The CIPK sequences of the Arabidopsis (Hrabak et al., 2003) and rice (Xiang et al., 2007) were downloaded from The Arabidopsis Information Resource (TAIR)2 and Rice Genome Annotation Project (RGAP)3, respectively. The hidden Markov model based profiles (HMM-profiles) of Pkinase (PF00069) and NAF (PF03106) were downloaded from the Pfam database4 (Finn et al., 2014), and used to search against all proteins sequences of pear using HMMER3.05. In addition, all retrieved CIPKs from Arabidopsis as queries were used to search against pear proteome by local BLAST (McGinnis and Madden, 2004) with identity >50% according to the previously described (Jimenez et al., 2015). The results of the combined searches, and all non-redundant sequences were subjected to the Pfam 4 and SMART6 database for domain analysis. The sequences were only accepted if they simultaneously contained the conserved Pkinase domain and the NAF domain as putative PbCIPK gene models. As a result, 28 PbCIPK family genes were identified and analyzed from pear genome, and the genes were named according to their corresponding genomic locations. Another five CIPKs were located in three scaffolds, but they were considered incomplete due to lack of chromosomal information (Table 1).
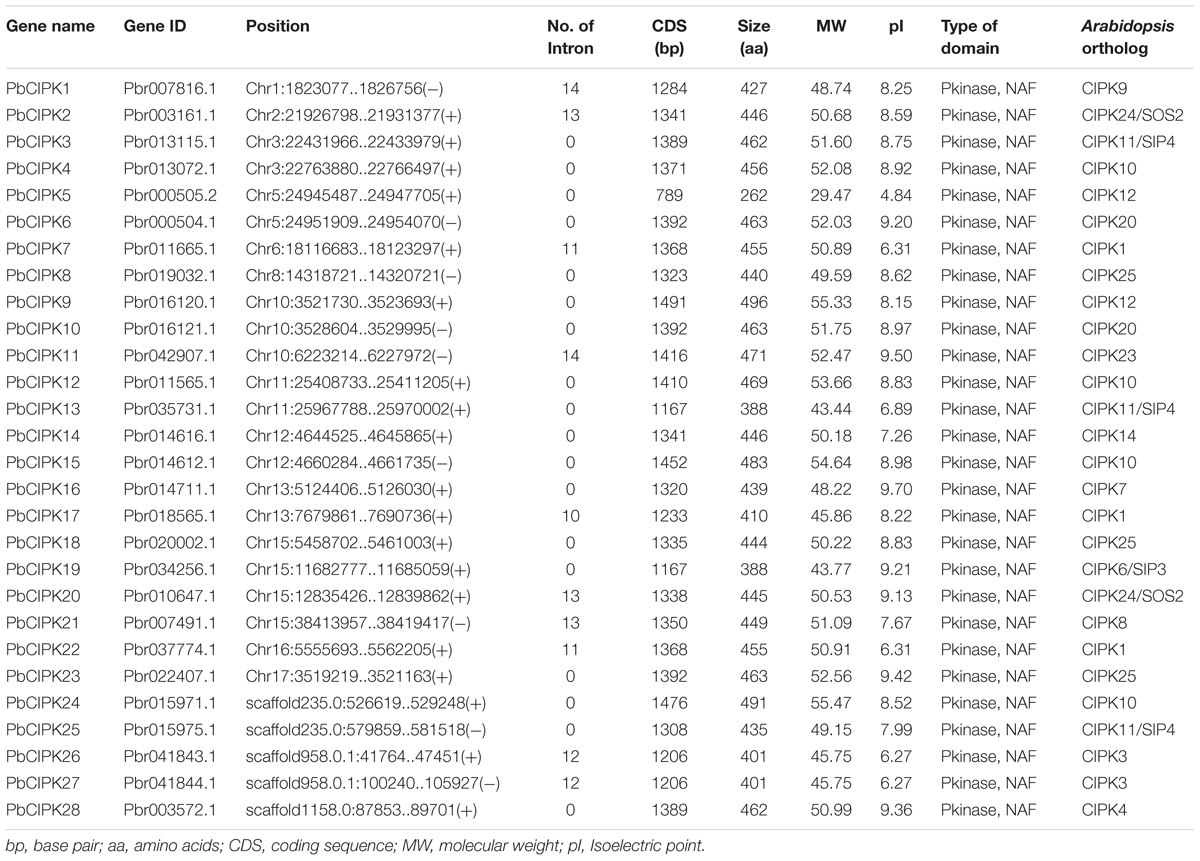
TABLE 1. The characteristics of CIPK family members in pear (P. bretschneideri).
Protein Properties and Sequence Analyses
Protein properties, including molecular weight (MW) and isoelectric point (pI) of PbCIPK, were predicted using the online tool Compute pI/Mw7. The motif analyses of PbCIPKs were detected using MEME software8 with default parameter settings, except the width of motifs was set from 6 to 60, the maximum number of motifs was 15. Identified motifs were annotated by the PROSITE9. Gene structure was analyzed using the GSDS 2.010 based on alignments of genomic and CDS sequences of PbCIPKs that were retrieved from the pear genome database.
Multiple Sequences Alignment and Phylogenetic Analysis
Multiple sequence alignments of CIPK proteins from pear, Arabidopsis, rice, and other species were performed using ClustalW 2.0 (Larkin et al., 2007). Phylogenetic trees were constructed using neighbor-joining (NJ) and maximum-likelihood (ML) method with bootstrap values 1000 replicates in MEGA 6.0 (Tamura et al., 2013). Data for CIPK proteins from Brachypodium distachyon, soybean (Glycine max), peach (Prunus persica), poplar (Populus trichocarpa), grape (Vitis vinifera) were obtained from Kleist et al. (2014).
Chromosomal Locations and Synteny Analyses
To locate PbCIPK genes on chromosomes, the information of chromosomal position of each PbCIPK gene was obtained from the pear genome, and then used to construct a physical map by an in-house Perl script. Synteny analysis was carried out using the method described by (Tang et al., 2014). Briefly, BLASTP was performed to search for potential homologous gene pairs (E-value < 1e - 20, top five matches) in all protein sequences of pear. Then, the blast hits and gene locations were used as the inputs for MCScanX (Wang Y. et al., 2012) to investigate all potential paralogous duplication events in P. bretschneideri with the default settings. The paralogous duplicated pairs of PbCIPK family (Table 2) were identified and extracted and the synteny relationships of PbCIPK duplicated pairs shown using Circos (Krzywinski et al., 2009).
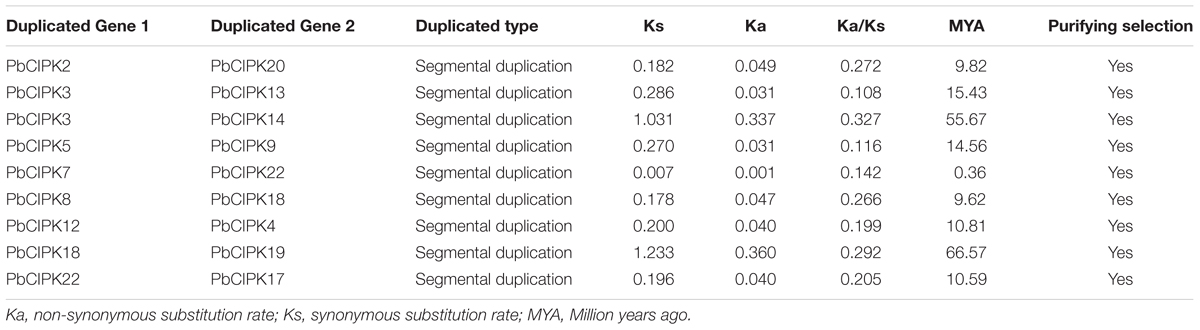
TABLE 2. Colinearity gene pairs and evolutionary selection in the pear CIPK family.
Selection Modes and Ks Calculation
The ratio of non-synonymous substitutions (Ka)/synonymous substitutions (Ks) were evaluated to detect the modes of selection of PbCIPK genes. Coding sequences without stop codon of PbCIPK genes were aligned using ClustalW 2.0 (Larkin et al., 2007). Subsequently, Ka, Ks, and the ratio of Ka/Ks of the PbCIPK duplicated gene pairs were calculated using MEGA 6.0 (Tamura et al., 2013). The approximate divergence time (T) of the PbCIPK duplicated gene pairs were calculated based on the formula T = Ks/2λ assuming clock-like rate (λ) of 9.26 synonymous substitutions per 109 years (Lynch and Conery, 2000; Wu et al., 2013).
Cis-Regulatory Elements in the Promoters of PbCIPK Genes
Based on the preliminary analysis of promoter region up to 2500 bp, we chose to analyze the -1000bp region due to concentrated stress-related cis-elements in the region and the upstream region greater than 1000 bp showed greater diversity with less consensus cis-elements. The 1000 bp upstream genomic sequences of PbCIPKs collected from the pear genome were analyzed for stress-responsive cis-acting elements, including ABRE (involved in the abscisic acid responsiveness), CE3 (involved in ABA and VP1 responsiveness), HSE (involved in heat and oxidative stress responsiveness), LTR (involved in the low-temperature responsiveness), MBR (MYB binding site involved in ABA and drought responsiveness), W-box (WRKY binding site involved in abiotic stress and defense response), and WUN-motif (involved in the wound responsiveness) in the promoters regions using PlantCARE11 and PLACE12 databases. The stress-related cis-elements in the 1000 bp upstream regions of PbCIPKs were collected and visualized by an in-house Perl script since our preliminary analysis showed most cis-elements were located in 1000 bp upstream region (data not shown).
Plant Materials, Growth Conditions, and Stress Treatments
One-year-old shoots with young leaves from adult pear tree ‘Dangshansuli’ collected from the national germplasm orchard of the Institute of Horticulture, Jiangsu Academy of Agricultural Sciences (Nanjing, China, 32°02′16.2″N 118°52′16.1″E), were placed in the hydroponic containers containing 1/2 MS (Murashige and Skoog, 1962) solution (pH 5.8) and incubated in an artificial growth chamber at 22 ± 2°C with a photoperiod of 16-h light and 8-h dark, 60–70% humidity daily cycle. After 14 days, the robust shoots with young leaves were used for the experiments. For salt and osmotic treatments, shoots with young leaves of six individuals were treated using 1/2 MS solution (pH 5.8) containing 200 mM NaCl or 15% (w/v) polyethylene glycol (PEG6000). Control shoots were placed under the same growth conditions, but grown in 1/2 MS solution (pH 5.8) only. Young leaves were sampled according to (Li et al., 2013) under series treated time courses (0, 12, 24, and 48 h) in three biological replicates, flash frozen in liquid nitrogen, and stored at -80°C for RNA preparation.
Real-Time Quantitative PCR (RT-qPCR)
Total RNA was isolated from samples using the RNAiso reagent (TaKaRa, Dalian, China) according to the manufacturer’s instructions. cDNA fragments were synthesized from total RNA using the TransScriptTM One-step gDNA Removal and cDNA Synthesis SuperMix (TaKaRa). RT-qPCR was performed using 7500 Fast Real-Time PCR System (Applied Biosystems, Carlsbad, CA, USA) instrument as described by (Tang et al., 2013). Each 20 μL amplification reaction contained 10 μL of SYBR premix Ex TaqTM II (TaKaRa), 0.4 μL of each primer (10 μM), 7.2 μL of sterile, distilled water, and 2 μL of cDNA template. The PCR reaction contained an initial denaturation (95°C/2 min) followed by 40 cycles of 95°C denaturation for 10 s, 58°C annealing for 20 s and 72°C extension for 10 s. Gene specific primers were designed according to non-conserved region sequences of each PbCIPK gene using the program Beacon Designer 8.1013, and then the hit primer pairs of each gene were subjected to realign with the coding sequences of the whole pear genome using BLASTn. Finally, the primer pair was collected for RT-qPCR only when they both matched the same PbCIPK gene. Gene-specific primers are listed in Supplementary Table S1 and three technical replicates for each biological replicate were carried out. PbACT2/7 and PbUBQ10 genes of pear were used as internal controls for normalization according to Xu et al. (2015). The relative expression of PbCIPKs under salt and osmotic stress were calculated via the 2-ΔΔCT method (Livak and Schmittgen, 2001).
Co-expression Network Analysis
The topological relationships of stress responsive PbCIPK genes, a co-expression network analysis of PbCIPKs was performed and displayed based on Pearson correlation coefficient (PCC) of PbCIPKs’ expressions under salt and osmotic stresses. The PCC of PbCIPK gene pairs were calculated following the method of Tang et al. (2013). All of the gene-pairs of PbCIPKs with PCC at 0.05 significant level (p-value) were collected, and used to construct the co-expression networks using Cytoscape 3.314. The nodes represent genes and the edges between nodes represent co-expression correlations of gene pairs. The different edge line types indicate different correlation levels, which designate different interaction strengths of co-regulated gene pairs. In addition, we compared protein physical interactional relationships of PbCIPK orthologs in Arabidopsis using STRING15 with the default program parameter settings.
Results and Discussion
Genome-Wide Identification of CIPK Gene Family in Pear
Calcineurin B-like interacting protein kinases are evolutionarily conserved (Luan, 2009). Most flowering plants typically encodes around 30 CIPK homologs that harbor a protein domain in N-terminal and a NAF domain in C-terminal (Yu et al., 2014; Manik et al., 2015). In previous reports, 26 CIPK member in Arabidopsis (Weinl and Kudla, 2009), 30 in rice (Xiang et al., 2007), 27 in poplar (Yu et al., 2007), 23 in canola (Zhang et al., 2014), and 25 in cassava (Hu et al., 2015) were characterized. Most CIPK genes in higher plants have been reported in response to complex environmental conditions (Xiang et al., 2007; Chaves-Sanjuan et al., 2014; Tang et al., 2015). In this report, we identified putative CIPK genes in pear genome (Wu et al., 2013). Thirty CIPK genes were predicted to contain both the Pkinase-domain and NAF domain, and 33 protein sequences were found based on CIPK protein sequences from Arabidopsis and rice using BLASTP program with identity >50% (Supplementary Table S2). Finally, 28 gene models were overlapped by two separate searches and considered as putative CIPK genes (Supplementary Table S2). Their corresponding protein sequences, coding sequences and genomic sequences were collected from the pear genome for further analysis. The 28 genes of CIPKs from the pear genome are uniformly designated as PbCIPK followed by an Arabic number 1–28 according to the position of their corresponding genes on chromosomes 1–17 (Figure 1) and in the order of the scaffolds (Table 1). Subsequently, the related characteristics and multiple sequence alignments of the 28 putative PbCIPK genes in this study were analyzed (Supplementary Figures S1 and S2; Table 1). All of the identified CIPK proteins from pear and Arabidopsis were aligned and most harbored similarly conserved architectures (Supplementary Figures S1 and S2). Each PbCIPK protein contained both Pkinase domain and NAF domain, which is a core characteristics of CIPK (Luan, 2009; Chaves-Sanjuan et al., 2014), except that PbCIPK8, which has an incomplete Pkinase domain in its N-terminal (Supplementary Figure S1). The coding sequence length of CIPKs ranged from 789 to 1491 bp, and their encoded proteins varied from 262 to 496 amino acids in length. Their corresponding molecular weight (MW) varied from 48.73 to 50.99 kDa with isoelectric point (pI) values from 4.84 to 9.70 (Table 1). In addition, orthologous analysis of CIPKs across P. bretschneideri and A. thaliana indicated that 28 PbCIPK were linked to their corresponding 13 orthologs in Arabidopsis (Table 1), which suggested that gene duplications events occurred in the pear CIPK family.
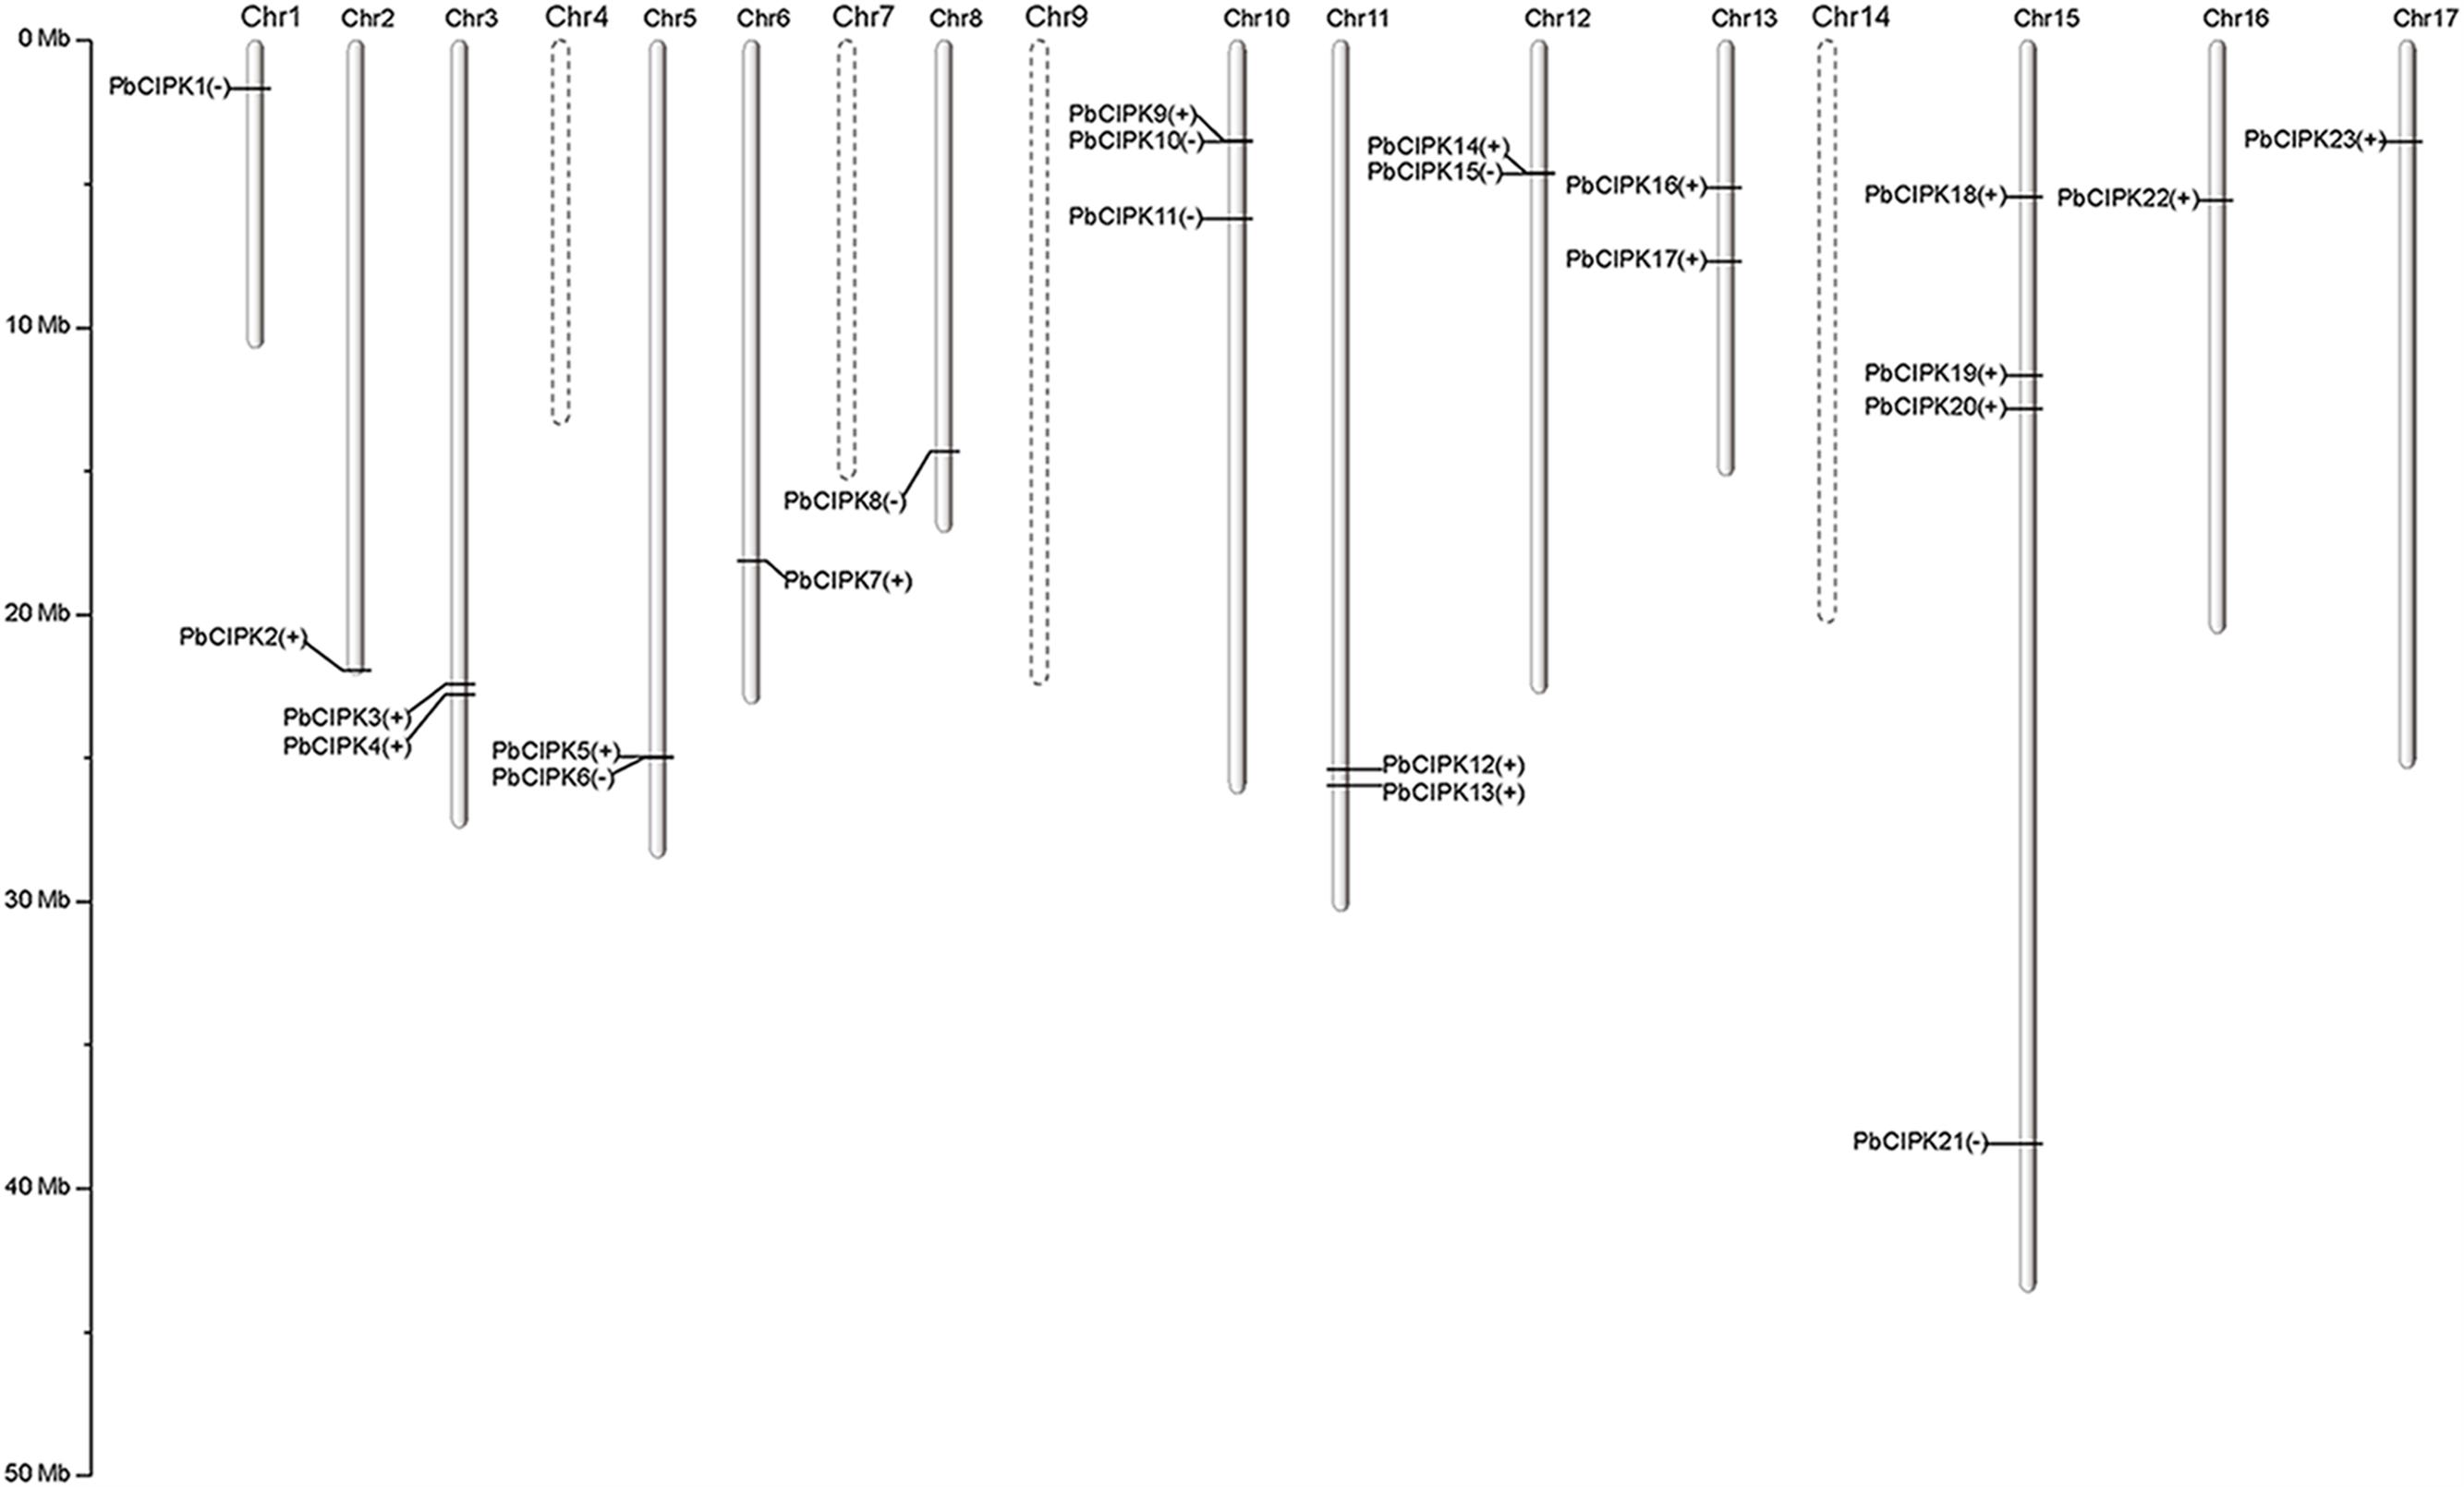
FIGURE 1. Distribution of PbCIPK genes on pear chromosomes. The roman numerals on top of each chromosome represent the number of the chromosome. The plus or minus accompanied with each PbCIPK gene indicates the stand direction of gene encoding. The dashed line of chromosome represents no distribution of PbCIPK gene.
Genomic Location, Organization, and Phylogeny of PbCIPK Gene Family
The PbCIPK genes were mapped onto all chromosomes except chromosomes 4, 7, 9, and 14 in the pear (Figure 1). Twenty-three of 28 CIPK genes, were distributed unevenly on 13 of 17 chromosomes in pear, and each of these chromosomes contained at least one PbCIPK gene (Figure 1). Chromosome 15 contained four, or ∼18%, the greatest number, of CIPK family genes (Figure 1). The remaining five PbCIPK genes were also located on three scaffolds (scaffold235.0, scaffold958.0.1, and scaffold1158.0; Table 1). Scaffold235.0 and scaffold958.0.1 both contained two CIPK genes, corresponding to PbCIPK24, -25 and PbCIPK26, -27, whereas scaffold1158.0 only contained one CIPK gene (PbCIPK28; Table 1).
In order to classify the CIPK family in pear, full-length protein sequences of all identified PbCIPKs were used to construct phylogenetic trees. Dues to the tree topologies produced by ML and NJ methods have largely consistent, the NJ phylogenetic tree was selected to show in Figure 2A. The 28 PbCIPKs were divided into four groups I, II, III, and IV on the basis of their phylogeny, gene structure, and conserved motif distributions (Figure 2). Simultaneously, we compared the phylogenetic groups and gene structures among Arabidopsis and pear (Supplementary Figure S3), and PbCIPKs had similar distributions in the phylogenetic clades and intron–exon structures of these genes in both species. Orthologous genes from Arabidopsis and pear were closely converged in the same subclusters (Supplementary Figure S3), which supported the organization of CIPK family in pear. Among four phylogenetic groups in pear, Group I and IV contained more genes than other groups. For example, group I included PbCIPK3, -4, -5, -6, -9, -10, -12, -13, -14, -15, -19, -24, -25, whereas Group IV included PbCIPK1, -2, -7, -11, -17, -20, -21, -22, -26, -27. The PbCIPKs classified in Groups III and IV were consistent with previous reports of the phylogeny of CIPKs contained in clades III and IV from Arabidopsis, Populus, and cassava (Yu et al., 2007; Hu et al., 2015).
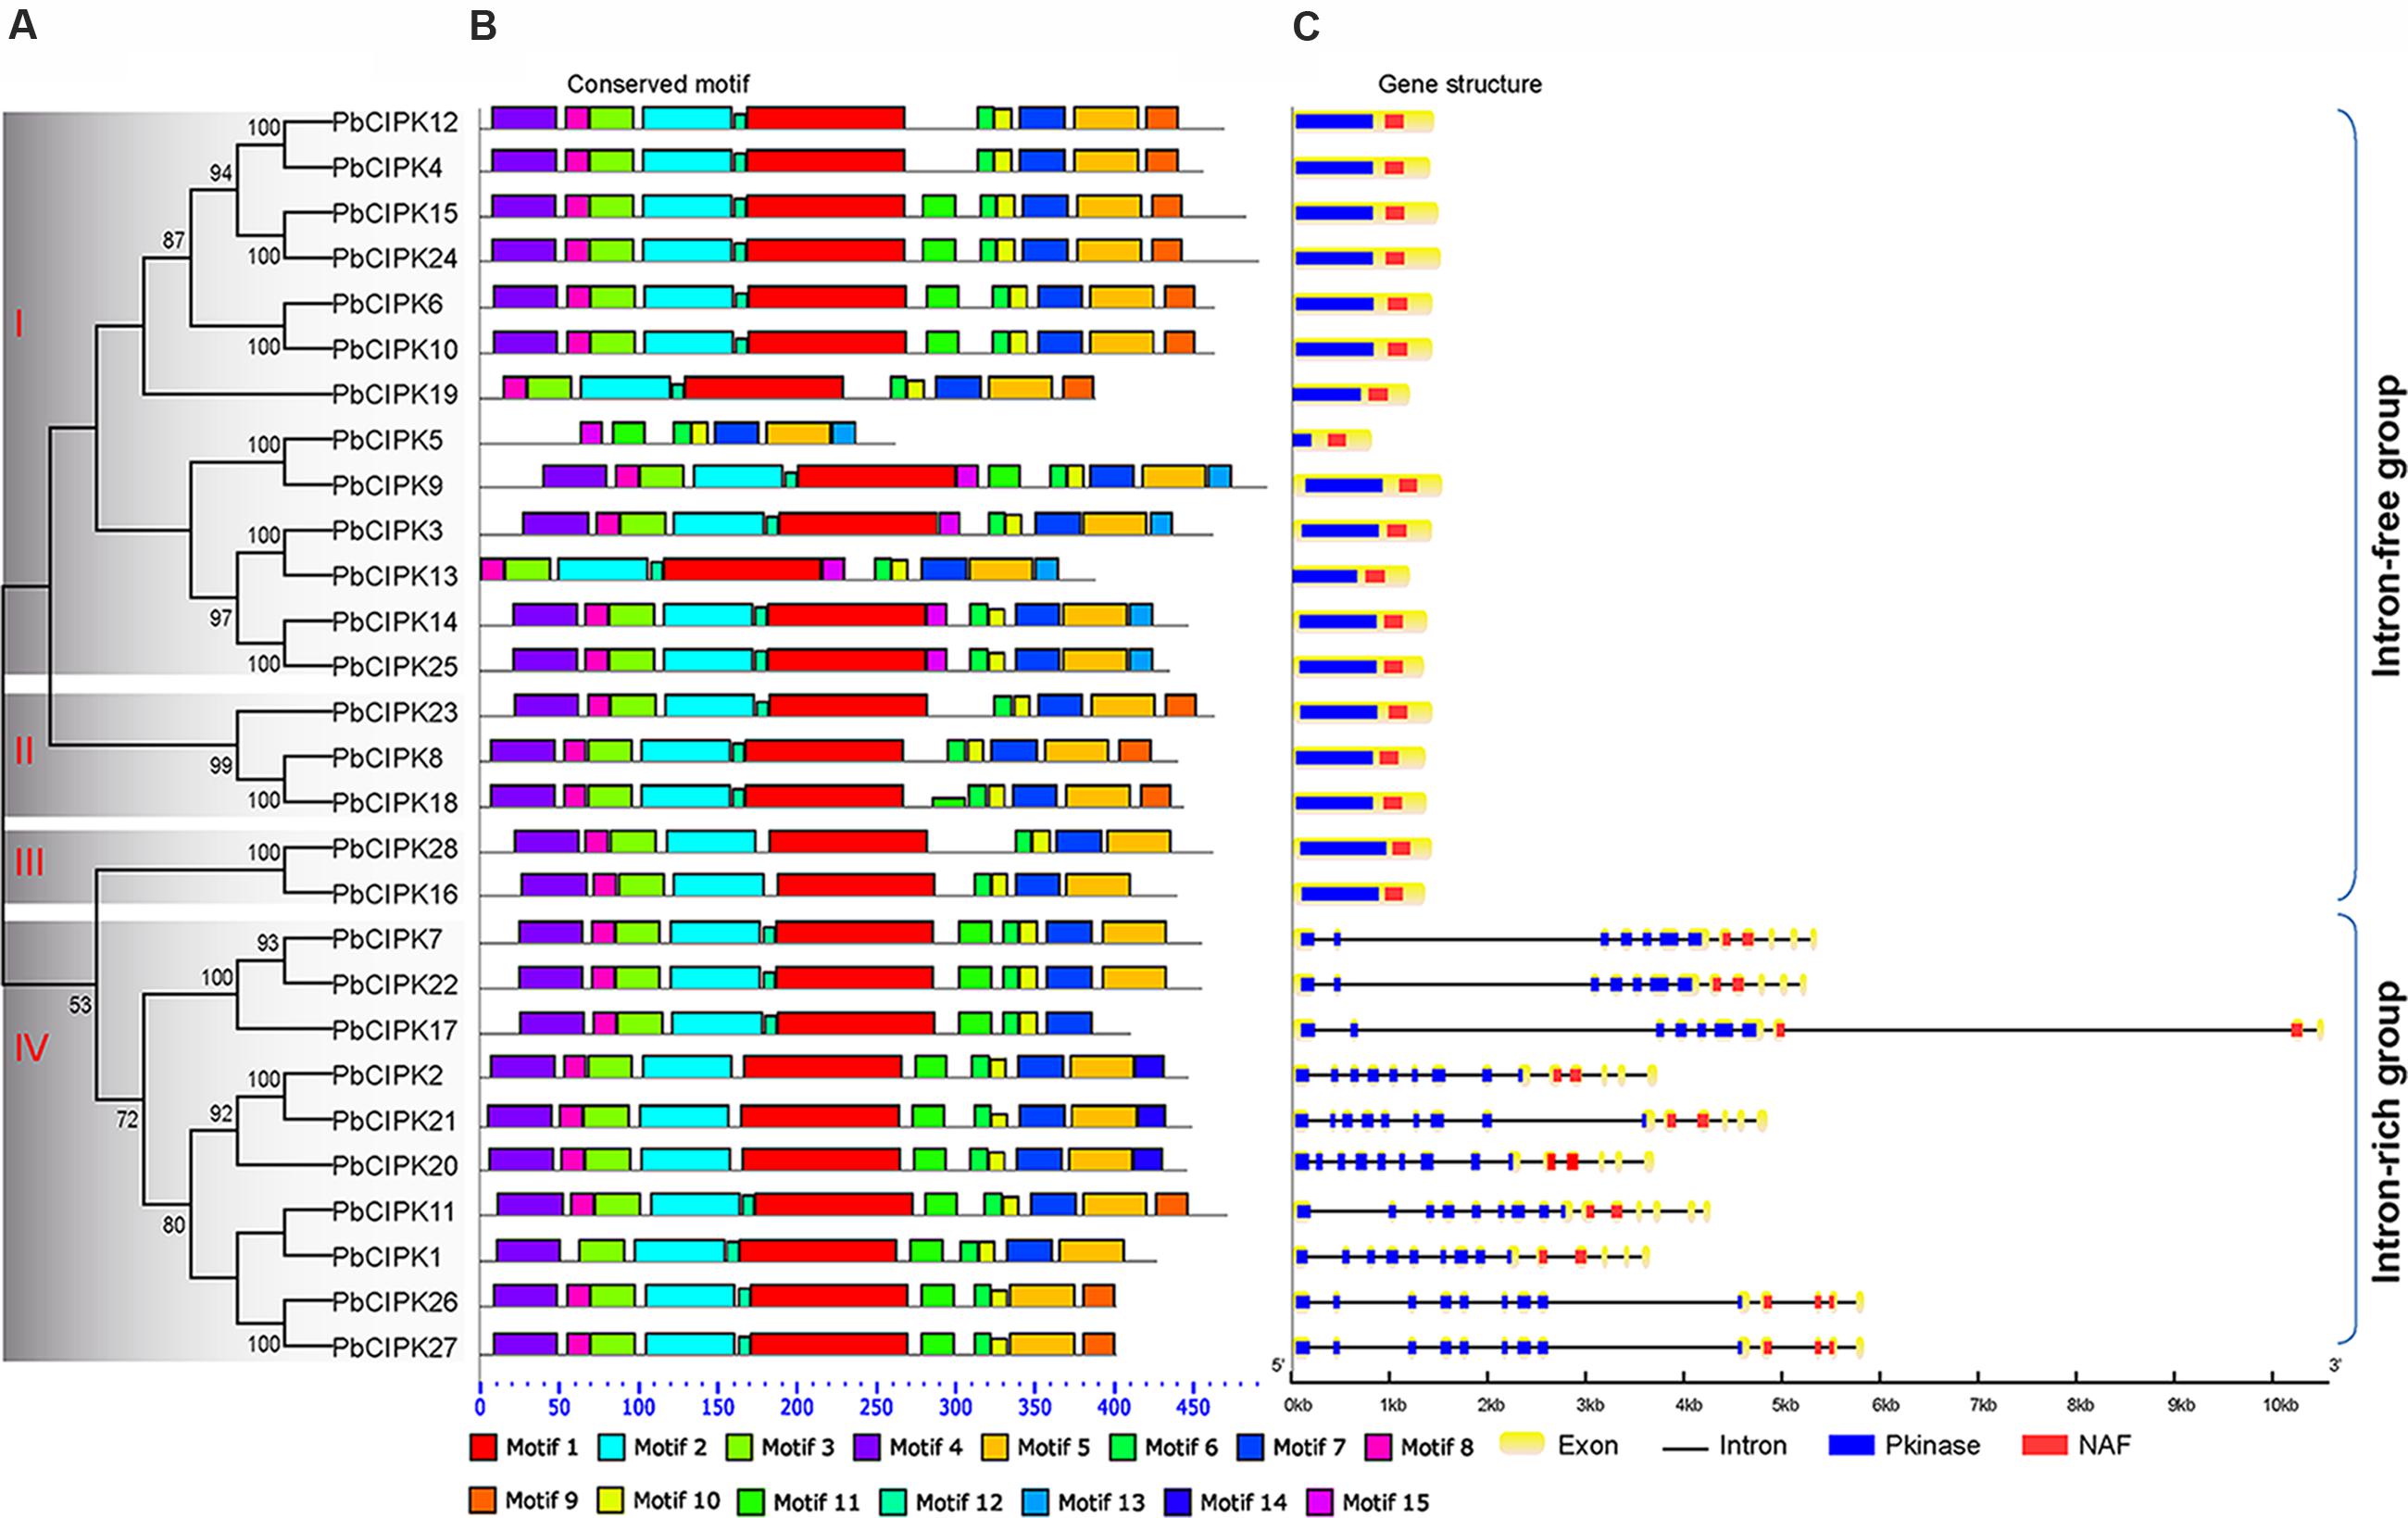
FIGURE 2. Phylogenetic and structural analysis of PbCIPK family. Phylogenetic tree of the PbCIPK family in scientific name of pear was generated using neighbor-joining with 1000 bootstrap in MEGA 6.0. Motif analysis was performed by MEME software (http://meme-suite.org/tools/meme), and gene structure was detected by GSDS 2.0 ((http://gsds.cbi.pku.edu.cn/).
Based on full protein sequences of CIPKs, we also investigated the phylogenetic relationship between pear and other species (Arabidopsis, rice, B. distachyon, soybean, peach, poplar, and grape; Supplementary Figure S4). All of the CIPKs from eight species grouped into the same four distinct groups (I to IV), which is consistent with the organization of CIPK family in pear (Supplementary Figure S4). This is in agreement with the current understanding of plant CIPKs expanded within four subgroups along with evolutionary relationships among these organisms (Adams and Wendel, 2005; Kleist et al., 2014; Zhu et al., 2016). Among eight plant species, the phylogenetic reconstruction of CIPKs further supported that the expansion patterns of pear CIPK gene family originated from groups I and IV in its evolutionary history, implying that they derived from duplications that occurred during recent genome duplication. In addition, the CIPKs from different species that have sequence similarity or conservation suggest that they could have similar functions in adaption or evolution.
Gene Structure and Conserved Motif Analysis of PbCIPK Genes
The conserved motifs and intron–exon distribution of PbCIPKs were analyzed to better understand the structural features of pear CIPKs (Figures 2B,C). The conserved motif analysis of PbCIPKs supported the indicated phylogenetic relationship and classification of pear CIPKs (Figures 2A,B). Fifteen conserved motifs in pear CIPKs were detected and all pear CIPK proteins contained motifs 6 and 10 (Figure 2C; Supplementary Table S3). Motifs 1, 2, 3, and 4 were annotated as Pkinase domain (Supplementary Table S3). Motif 6 and 10 that are closely related to NAF domain (Pfam no. PF03822). Motif 6 contained the core NAF residues that are similar to the NAF domain in the PbCIPK family (Figure 2C; Supplementary Table S3). The motif distribution demonstrated the conserved structure of PbCIPK family. Among 28 PbCIPK proteins, almost all PbCIPK, except PbCIPK5, proteins contained the complete protein kinase and NAF domains, and the NAF domain. PbCIPK5 has an incomplete kinase domain (Supplementary Figure S1), but has the complete regulatory domain, the N-terminal, and NAF domain that is harbored in motifs 6 and 10. In additional, the conserved NAF domain is the key motif component to mediate CBL-CIPK physical interactions (Kolukisaoglu et al., 2004; Luan, 2009; Weinl and Kudla, 2009; Yu et al., 2014; Manik et al., 2015; Tang et al., 2015). The formation of stable CIPK and CBL complexes is necessary to regulate various ion transporters and abiotic stress responses in plants (Albrecht et al., 2001; Kolukisaoglu et al., 2004; Luan, 2009; Chaves-Sanjuan et al., 2014). Moreover, PbCIPKs had similar distributions of exons and architecture of the conserved domains within the same group. The phylogenetic relationship and the classification of PbCIPKs is supported by similarities in structures, and suggests that the roles of CIPKs with the characteristic conserved Pkinase and NAF domains genes in pear are involved in CBL-CIPK networks.
Gene structure analysis of PbCIPKs supported the phylogenetic groups and conserved motif distributions of PbCIPK family. The similar conserved motif distributions existed among members of PbCIPKs in the same phylogenetic group (Figures 2A,C). Intron–exon organization of the 28 PbCIPK genes indicated that PbCIPK genes could be classified into two clusters. The exon-rich cluster included only phylogenetic group IV (contained PbCIPK1, -7, -11, -17, -20, -21, -22, -26, and -27) with each gene containing 10–14 exons, and the exon-free subgroup included 19 genes in phylogenetic groups I, II, and III with no introns for most of them (Figure 2C). The conserved Pkinase and NAF domains, were interrupted by multiple introns at similar positions for the intron-rich cluster (Figure 2C), whereas members from groups I, II, and III in intron-free cluster were only had one complete exon. The similar intron rich/poor pattern of CIPK family members was also observed in both monocots and dicots species, such as Arabidopsis, rice, poplar, soybean, canola, and cassava (Kolukisaoglu et al., 2004; Yu et al., 2014; Zhang et al., 2014; Hu et al., 2015; Zhu et al., 2016). Because of high intron gain rates in earlier eukaryotic evolution, reduction of intron number in recent eukaryotic evolution is a common feature (Roy and Penny, 2007). Additionally, comparing with the intron distributions of PbCIPKs within different groups further reveals that the derivative forms of PbCIPKs are associated with the products of gene duplications, which are based on intron losses from the earlier multiple intron homologs. Thus, the expansion of CIPK family is dependent on the intron losses from the ancient multiple intron CIPK lineages along gene duplication.
Gene Duplications and Divergence of PbCIPK Gene Family
To investigate gene duplication of the CIPK gene family in pear, all possible paralogous gene pairs in all protein sequences of gene models (41019) of P. bretschneideri were searched. Blast hits and gene locations were used as the inputs for MCScanX (Wang Y. et al., 2012) to analyze all potential duplication events in the pear genome and to identify paralogous duplicated pairs of PbCIPK family (Table 2). Among PbCIPK family genes, nine duplicated pairs included 15 PbCIPK genes (PbCIPK2, -3, -5, -7, -8, -12, -18, -22, -20, -13, -14, -9, -4, -19, and -17) in Table 2 with synteny (Figure 3). The synteny relationships of PbCIPK duplicated pairs were collected and visualized in Figure 3 using Circos (Krzywinski et al., 2009). All duplicated events of PbCIPK gene pairs were derived from segmental duplication. The duplicated gene pairs mainly congregated on 11 chromosomes (2, 3, 5, 7, 8, 10, 11, 12, 13, 15, and 16). Moreover, the selection types and divergence dates of duplicated genes were investigated by calculating the synonymous (Ks) and non-synonymous substitutions (Ka) per site between duplicated pairs. Ka/Ks = 1 indicates neutral selection, Ka/Ks < 1 indicates purifying selection, and Ka/Ks > 1 indicates accelerated evolution with positive selection (Yang and Bielawski, 2000; Zhang et al., 2006). The Ks, Ka, and Ka/Ks of 11 duplicated gene pairs of PbCIPKs (Table 2) showed that all of the segmentally duplicated gene pairs in the PbCIPK family, whose Ks ranged 0.007–1.233, and the Ka/Ks ratios of nine PbCIPK duplicated gene pairs ranged 0.142–0.292, suggesting that all duplicated genes of PbCIPK family had undergone purifying selection on the whole genome duplication (WGD). The recent WGD event in pear probably occurred 30–45 MYA (Velasco et al., 2010;Wu et al., 2013), whereas the divergence of pear and apple must have occurred 5.4–21.5 MYA (Wu et al., 2013). The divergence dates of the duplicated PbCIPK genes were also calculated, and ranged from 0.36 to 66.57 MYA (Table 2). The duplicated events of the CIPK family genes in pear is associated with the whole processes of the pear WGD, and the differentiation of apple and pear. Furthermore, the duplicated events were not synchronous in pear, and implicated their occurrences could be accompanied with the diverse functional differentiation to respond environments.
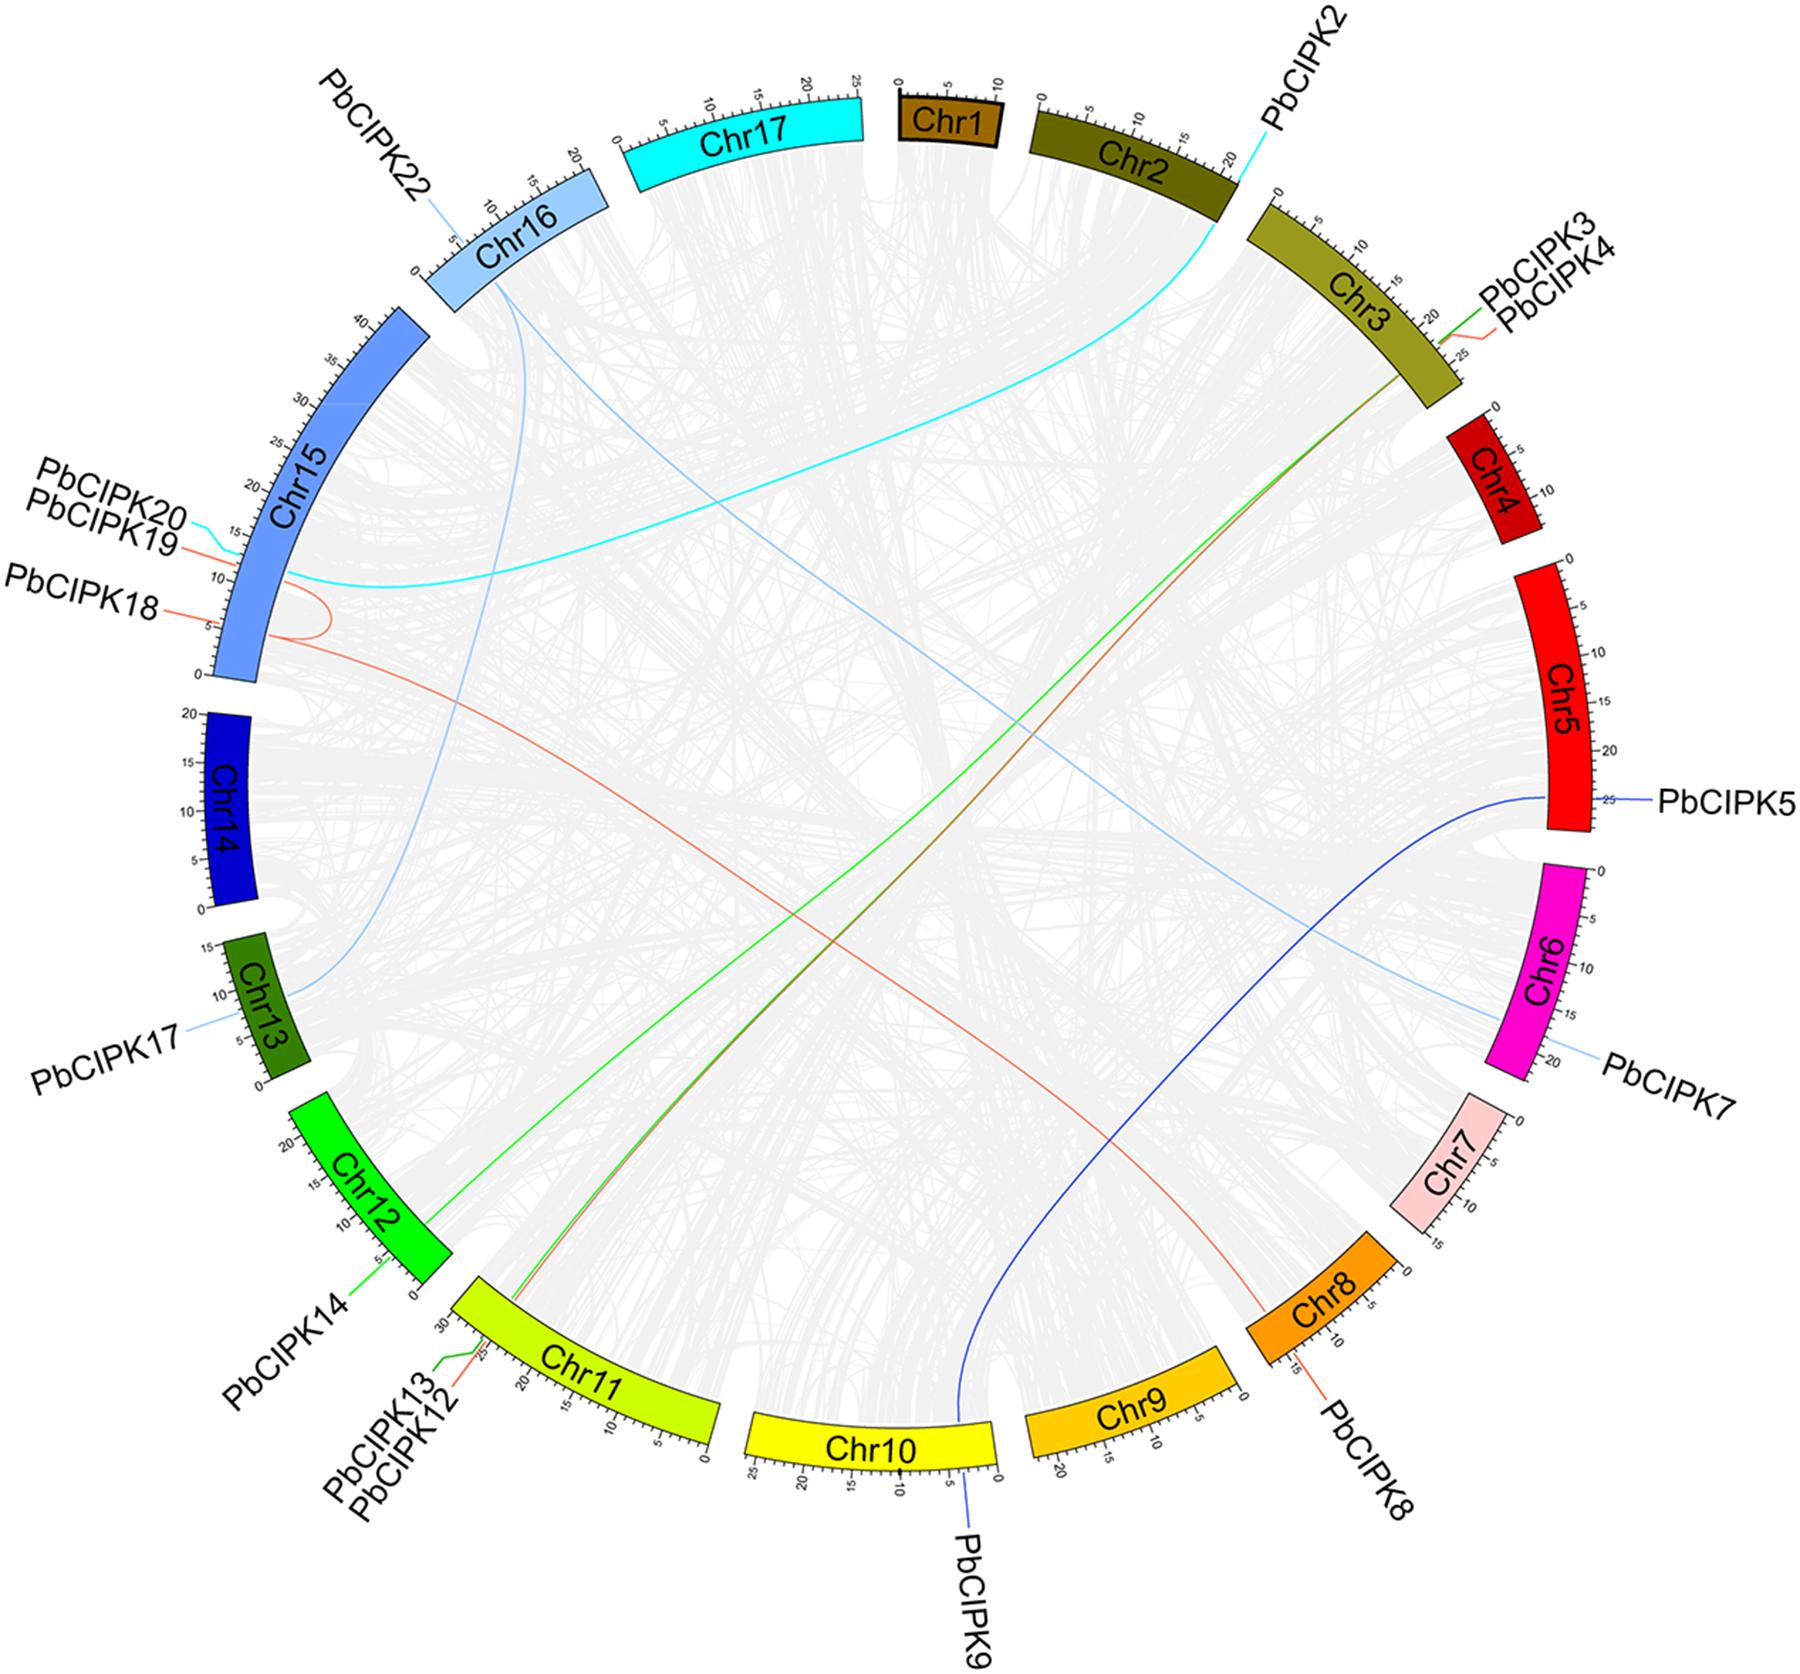
FIGURE 3. Colinearity analysis CIPK gene family in pear genome. All the pear CIPK family duplicated gene pairs are depicted in the pear chromosomes (Chr1-17). Gray background lines indicate collinear blocks in whole pear genome, and the collinear relationship of PbCIPK genes are indicated by solid color lines.
Cis-Regulatory Elements Analysis of PbCIPK Genes
The cis-regulatory elements, such as ABRE (ABA-responsive element), HSE (heat shock element), LTRE (Low-temperature-responsive element), MYBR (MYB transcription factor binding site), and W-box (WRKY transcription factor binding site) have been extensively characterized for their important roles under stress conditions (Yamaguchi-Shinozaki and Shinozaki, 2005; Xiang et al., 2007; Kim et al., 2011; Hernandez-Garcia and Finer, 2014). Stress-responsive elements were investigated in the promoter regions of PbCIPKs to explore the possible responsive mechanisms of pear CIPK genes to abiotic stress and detected in the 28 CIPK gene promoter regions (1000 bp upstream of the translation start site) of PbCIPKs. In the promoter regions of 27 PbCIPKs (except PbCIPK9), 110 cis-elements were involved in responding abiotic stresses (Figure 4). The number of stress-responsive elements in the selected promoter regions of 27 PbCIPKs ranged from the maximum in PbCIPK25 (which contained 11 cis-elements) to the minimum in PbCIPK23 and PbCIPK13 (which contained one cis-elements). Sixty-three percent (17/27) of the promoter regions of PbCIPKs contained ABRE elements and 71% (20/27) contained HSE elements (Supplementary Table S4). A LTR element was found in five promoter regions of PbCIPK1,-3,-5, -10, and -28. Eighteen MYBR elements and five W-box elements were located in the promoter regions of 14 genes and five genes, respectively. Moreover, other stress-responsive cis-elements were detected, including WUN-motif (Ni et al., 1996) in three genes (PbCIPK12, PbCIPK23, and PbCIPK28), and CE3 element (Shen et al., 1996) in one gene (PbCIPK20), respectively. Therefore, most CIPK family members in pear could be induced and transcriptionally regulated during different abiotic stresses.
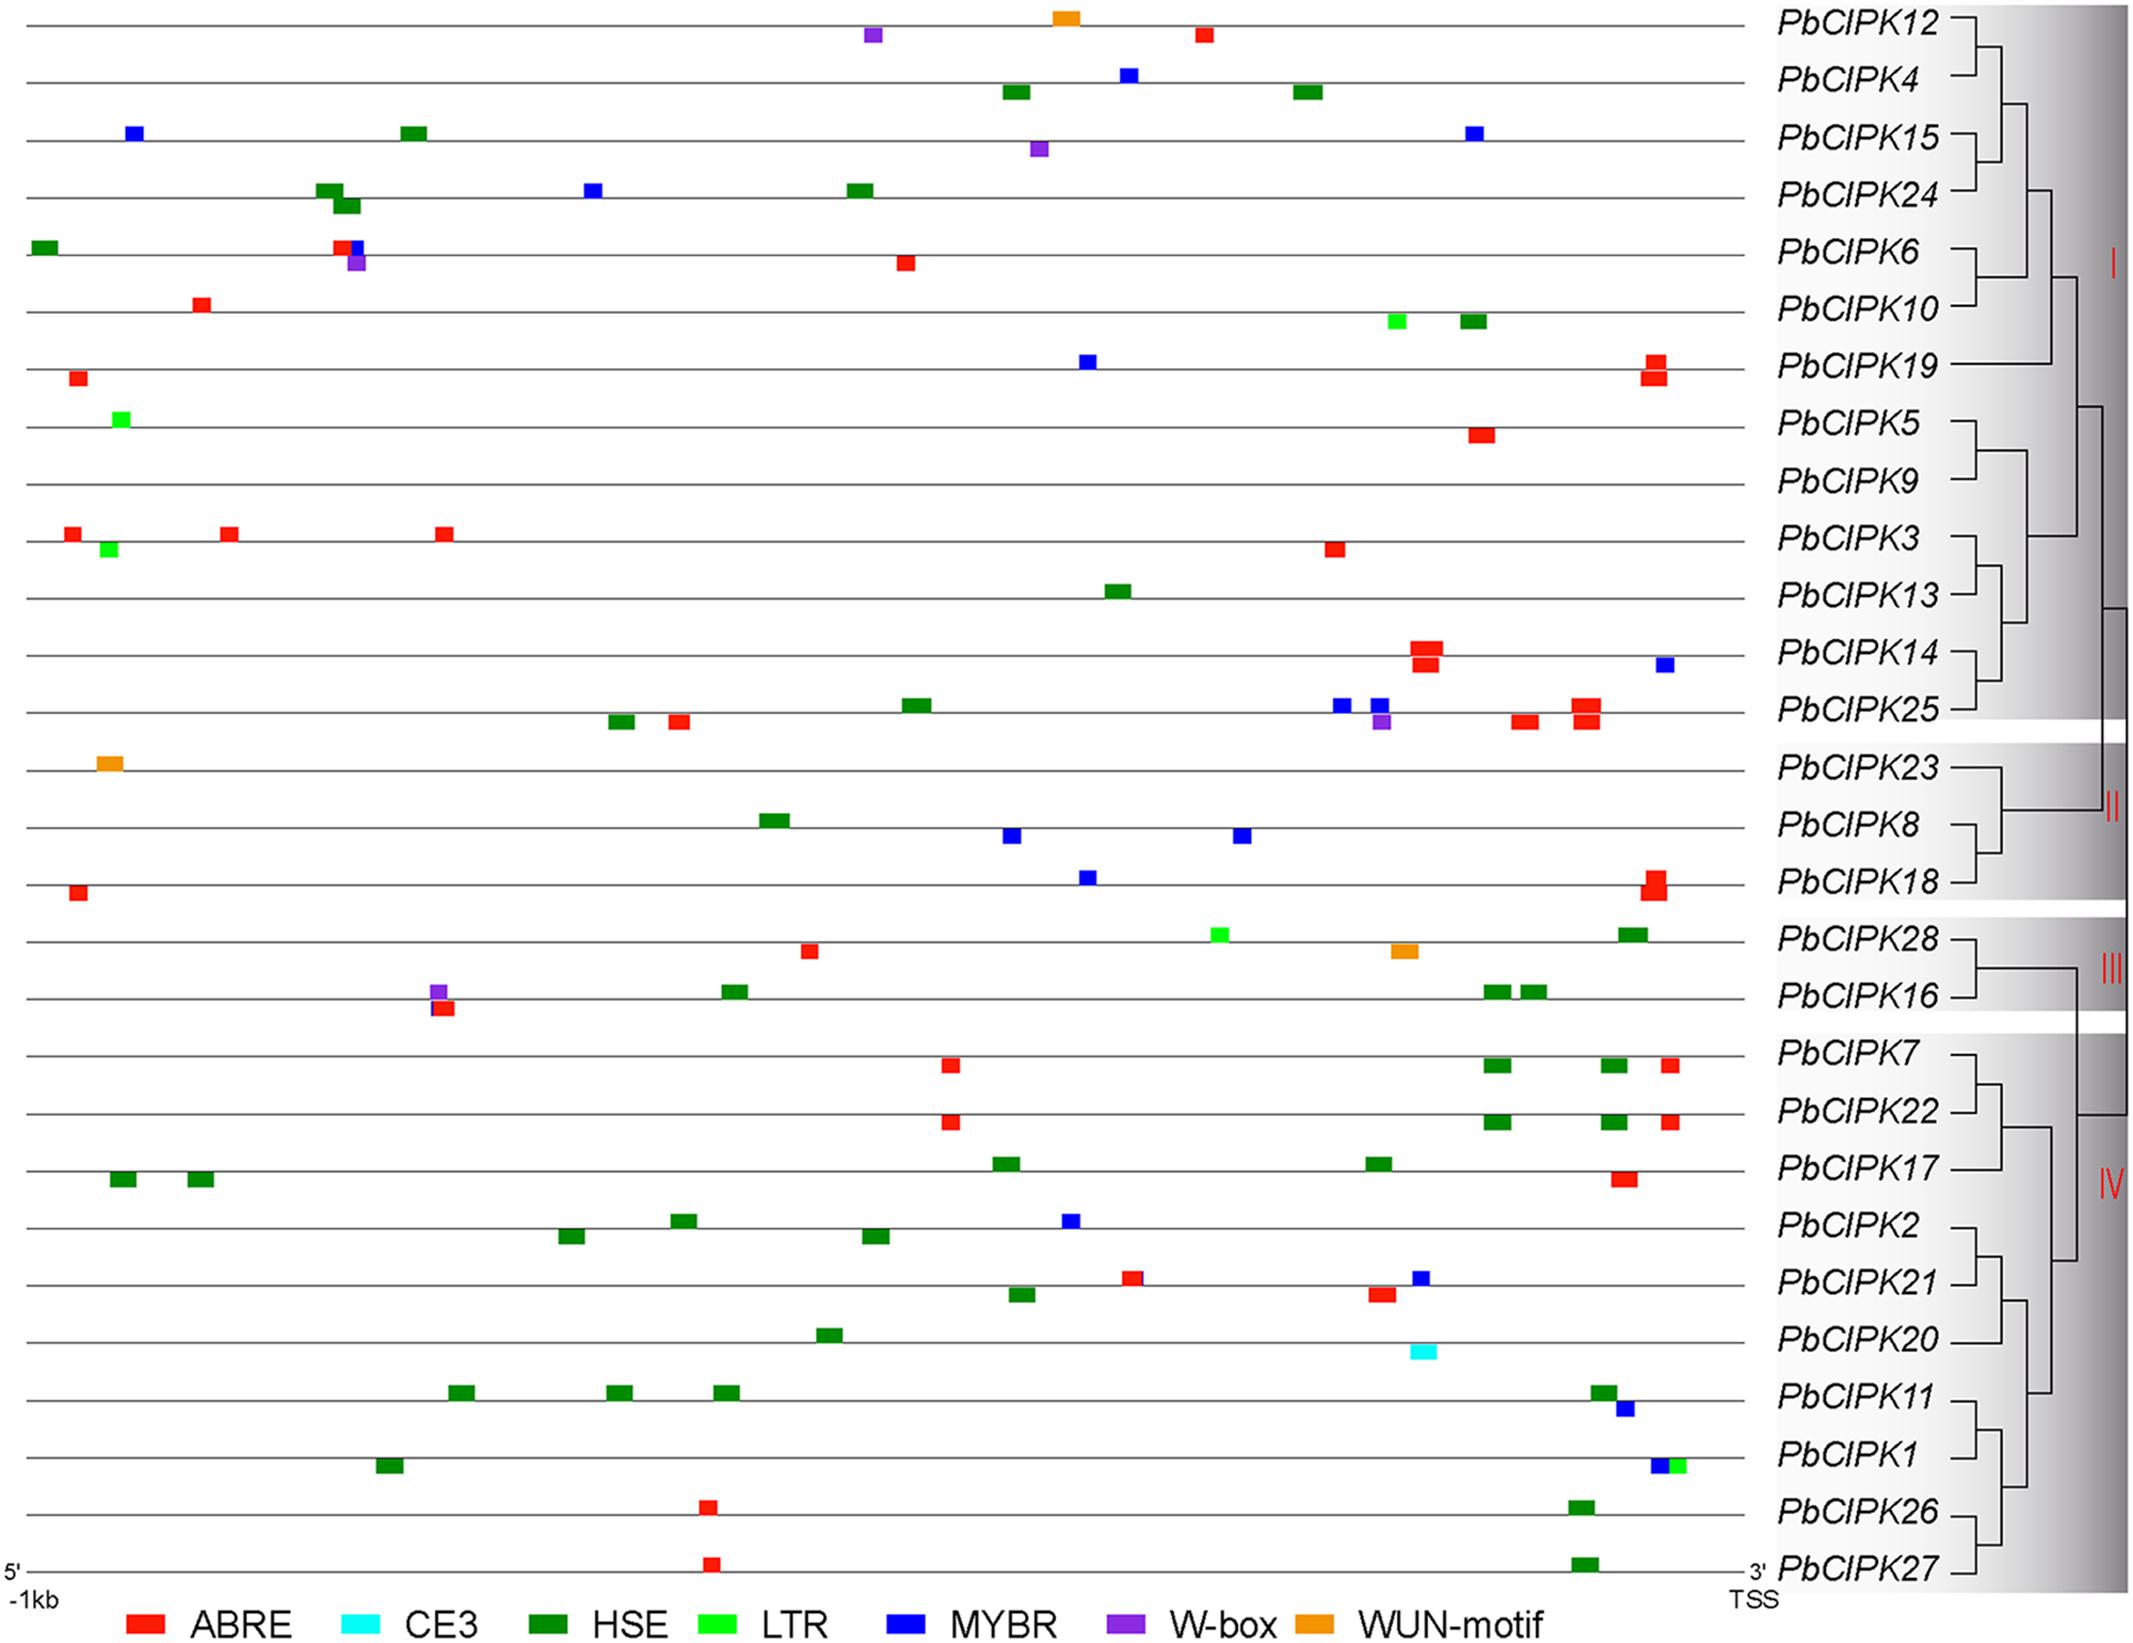
FIGURE 4. Putative cis-elements in the promoter regions of PbCIPK genes. Stress-responsive cis-elements ABRE (involved in the abscisic acid responsiveness), CE3 (involved in ABA and VP1 responsiveness), HSE (involved in heat and oxidative stress responsiveness), LTR (involved in the low-temperature responsiveness), MBR (MYB binding site involved in ABA and drought responsiveness), W-box (WRKY binding site involved in abiotic stress and defense response) and WUN-motif (involved in the wound responsiveness) were shown in the promoters regions (1000 bp upstream) of PbCIPKs.
Expression Patterns of PbCIPKs in Response to Salt and Osmotic Stresses
Calcineurin B-like interacting protein kinase family genes have been characterized to play an important role in plant response to salt or osmotic stress (Xiang et al., 2007; Weinl and Kudla, 2009; Chaves-Sanjuan et al., 2014; Manik et al., 2015; Pandey et al., 2015). To understand the responsive patterns of PbCIPK genes to salt and osmotic stresses, we selected all 23 PbCIPK genes, which can be mapped onto the pear chromosomes for RT-qPCR analyses (Figure 5). For salt treatments, among the 23 PbCIPKs, 12 genes (PbCIPK3, -7, -8, -9, -11, -14, -16, -18, -21, -22, and -23) were up-regulated, and 11 genes (PbCIPK2, -4, -5, -6,-10, -12, -15, -17, -19, and -20) were down-regulated (Figure 5A). For osmotic treatments, among 23 genes, 14 genes (PbCIPK3, -4, -5, -6, -8, -12, -13, -14, -15, -17, -20, -21, and -23) were up-regulated, and the remaining nine genes (PbCIPK1, -2, -7, -9,-10, -16, -18, -19, and -22) were down-regulated under osmotic stress (Figure 5B). Most PbCIPK genes that simultaneously responded to two stresses (Figures 5A,B) contained similar components of stress-responsive cis-elements, and each gene had more than one ABRE cis-elements in the promoter region (Figure 4). PbCIPKs contained putative stress-responsive cis-elements (i.e., ABRE, LTRE, MYBR, or W-box) in their promoter regions that were induced by salt or osmotic stresses. Among the 23 stress-inducible genes, five genes (PbCIPK3, -8, -11, -13, and -14) were up-regulatory in response to salt and osmotic stress, and four genes (PbCIPK1, -2, -10, and -19) were down-regulated expression by salt and osmotic stress. The expressions of duplicated PbCIPK gene pairs indicated the diverse expression of divergences under salt or osmotic stresses. For example, in gene pairs of PbCIPK3-PbCIPK13, PbCIPK3-PbCIPK14, PbCIPK7-PbCIPK22, PbCIPK4-PbCIPK12, the expression trends were consistent by salt and osmotic treatments, which implicated the duplicated genes in the co-expression phenomena with different expression patterns. Expressions of gene pairs, PbCIPK3-PbCIPK13, PbCIPK3-PbCIPK14, were up-regulated by salt or osmotic stress, whereas gene pairs of PbCIPK7-PbCIPK22, PbCIPK4 -PbCIPK12, had different expressions under salt or osmotic stress. Expressions of gene pairs of PbCIPK7-PbCIPK22 were both up-regulated by salt stress, and were both down-regulated by osmotic stress. In contrast, PbCIPK4-PbCIPK12 were both down-regulated under salt stress, and were both up-regulated under osmotic stress (Figures 5A,B). The duplicated genes in the PbCIPK family that were involved in the responses to salt or osmotic stresses also emerged responsive divergences, and suggests that they may have some functional differentiation in long adaptation. In contrast, some duplicated genes of the family also had co-responsive patterns to multiple stresses (Tang et al., 2014). In addition, PbCIPK genes from intron-free or intron-rich clusters were induced by a specific salt or osmotic treatment, suggesting that stress responsive expressions of those genes were not correlated with their intron-exon structures (Xiang et al., 2007). To confirm that some of these stress-responsive genes exhibit potentially common or specific expression patterns, these genes were analyzed by gene co-expression analysis.
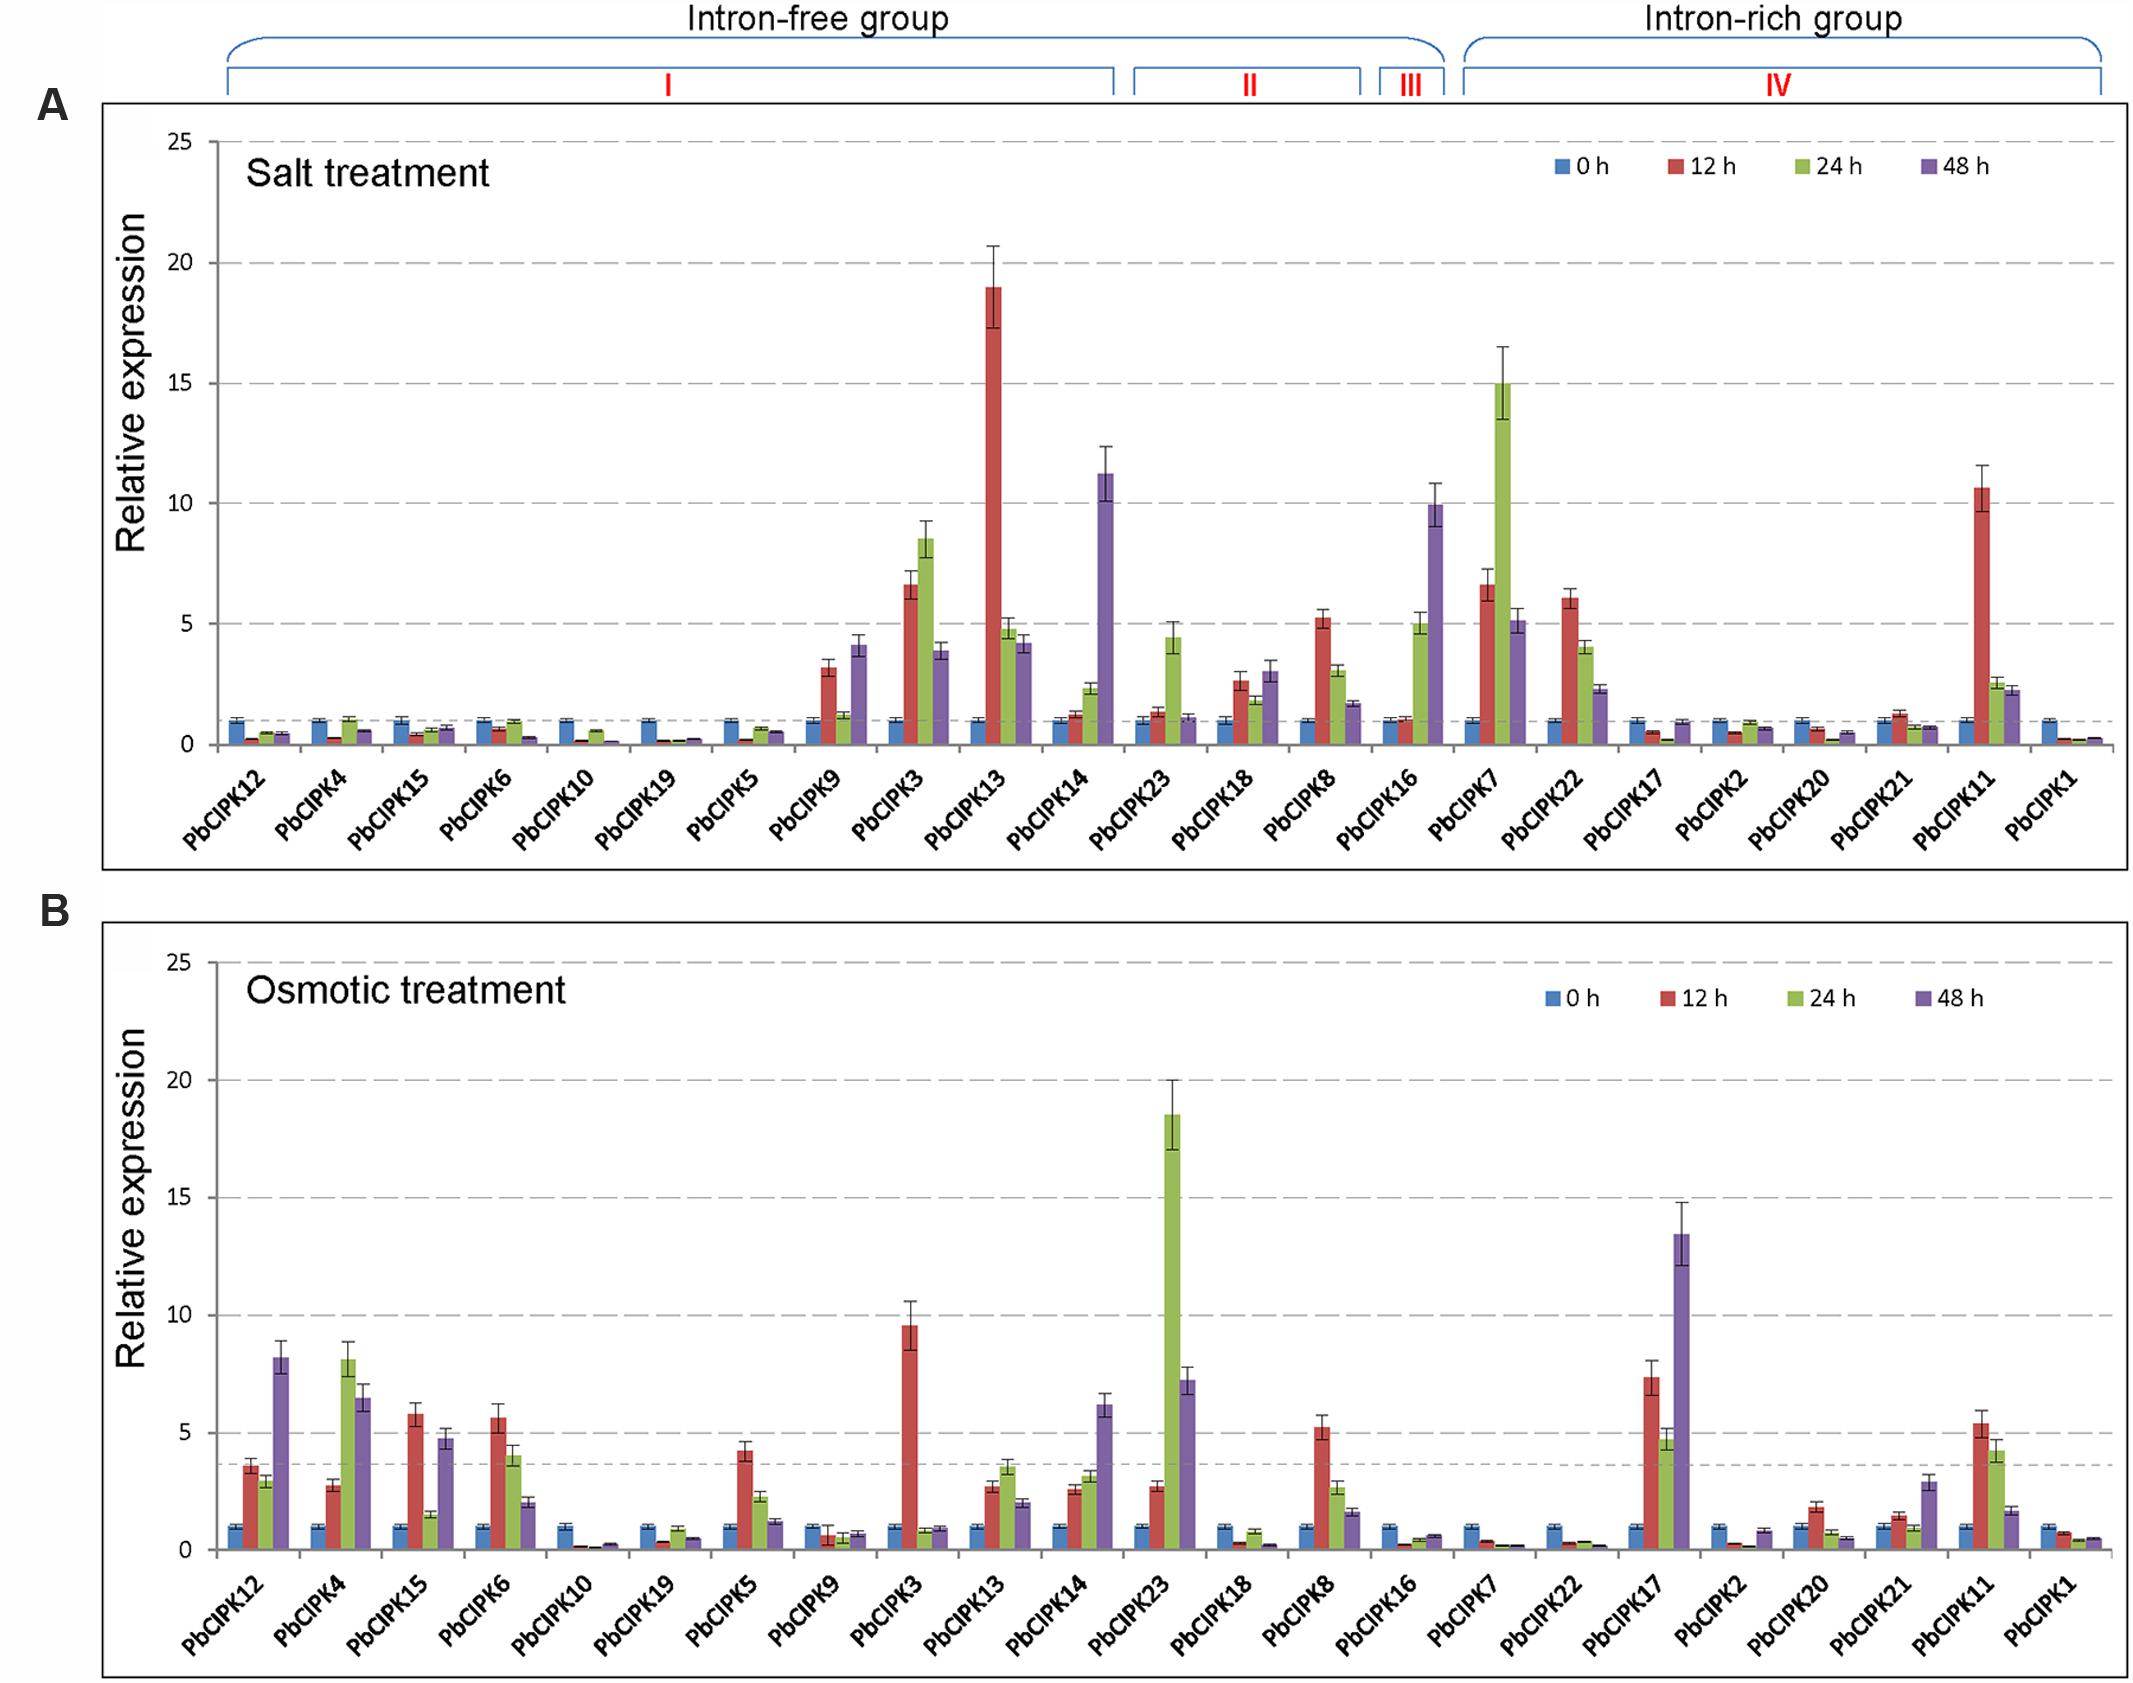
FIGURE 5. Expression profiles of PbCIPK genes under salt and osmotic stresses. Shoots with young leaves were exposed to 1/2 MS solution containing 200 mM NaCl or 15% (w/v) polyethylene glycol (PEG6000) for salt treatment (A) or osmotic treatment (B), and leaves were sampled at 0, 12, 24 and 48-h for RT-qPCR analysis. The relative expression levels of 23 PbCIPKs in pear leaves were quantitatively calculated via the 2-ΔΔCT method.
Co-expression Networks of PbCIPKs under Salt and Osmotic Stresses
Co-expression analysis has been employed to identify and discover some novel regulators or unknown mutual relationships by measuring large numbers of gene expressions involved in similar expression patterns under different conditions (Usadel et al., 2009; Movahedi et al., 2012; Bordych et al., 2013; Liang et al., 2014; Du et al., 2015). Previously, we utilized co-expression analyses tool to discover novel regulatory relationships and core nodes of networks (Tang et al., 2013). The gene co-expression networks of PbCIPKs were generated based on the Pearson correlation coefficients (PCCs) of stress-responsive PbCIPK genes under salt and osmotic treatments using RT-qPCR data. All PCCs that were significant at the 0.05 significance level (p-value) were collected and used to construct co-expression network by Cytoscape 3.3. A co-expression network of PbCIPKs mediating salt and osmotic stresses revealed 23 nodes and 39 regulatory edges (Figure 6). The 23 nodes representing 23 stress-responsive PbCIPKs were separately linked to each other through 39 edges representing PCCs between co-expression gene pairs (Figure 6; Supplementary Table S5). Among this network, 39 regulatory edges indicated 39 co-expression gene pairs of PbCIPKs that were linked with their PCCs. Each node harbored different number of regulatory edges, which varied from one to eight. Of the maximum number of regulatory edges, the PbCIPK18 node contained eight regulatory edges, the second was enriched in the nodes PbCIPK22, -19, -15, -8, and -6, which all separately contained five regulatory edges (Figure 6). Co-expression of gene pairs (22/39 or 56%) had positive significant correlations, the remaining ∼44% co-expression gene pairs (17/39) had significantly negative correlations (Figure 6). The nodes of PbCIPK22, -19, -18, -15, -8, and -6 could be placed in central roles in co-expression networks of PbCIPKs in response to abiotic stresses (Figure 6).
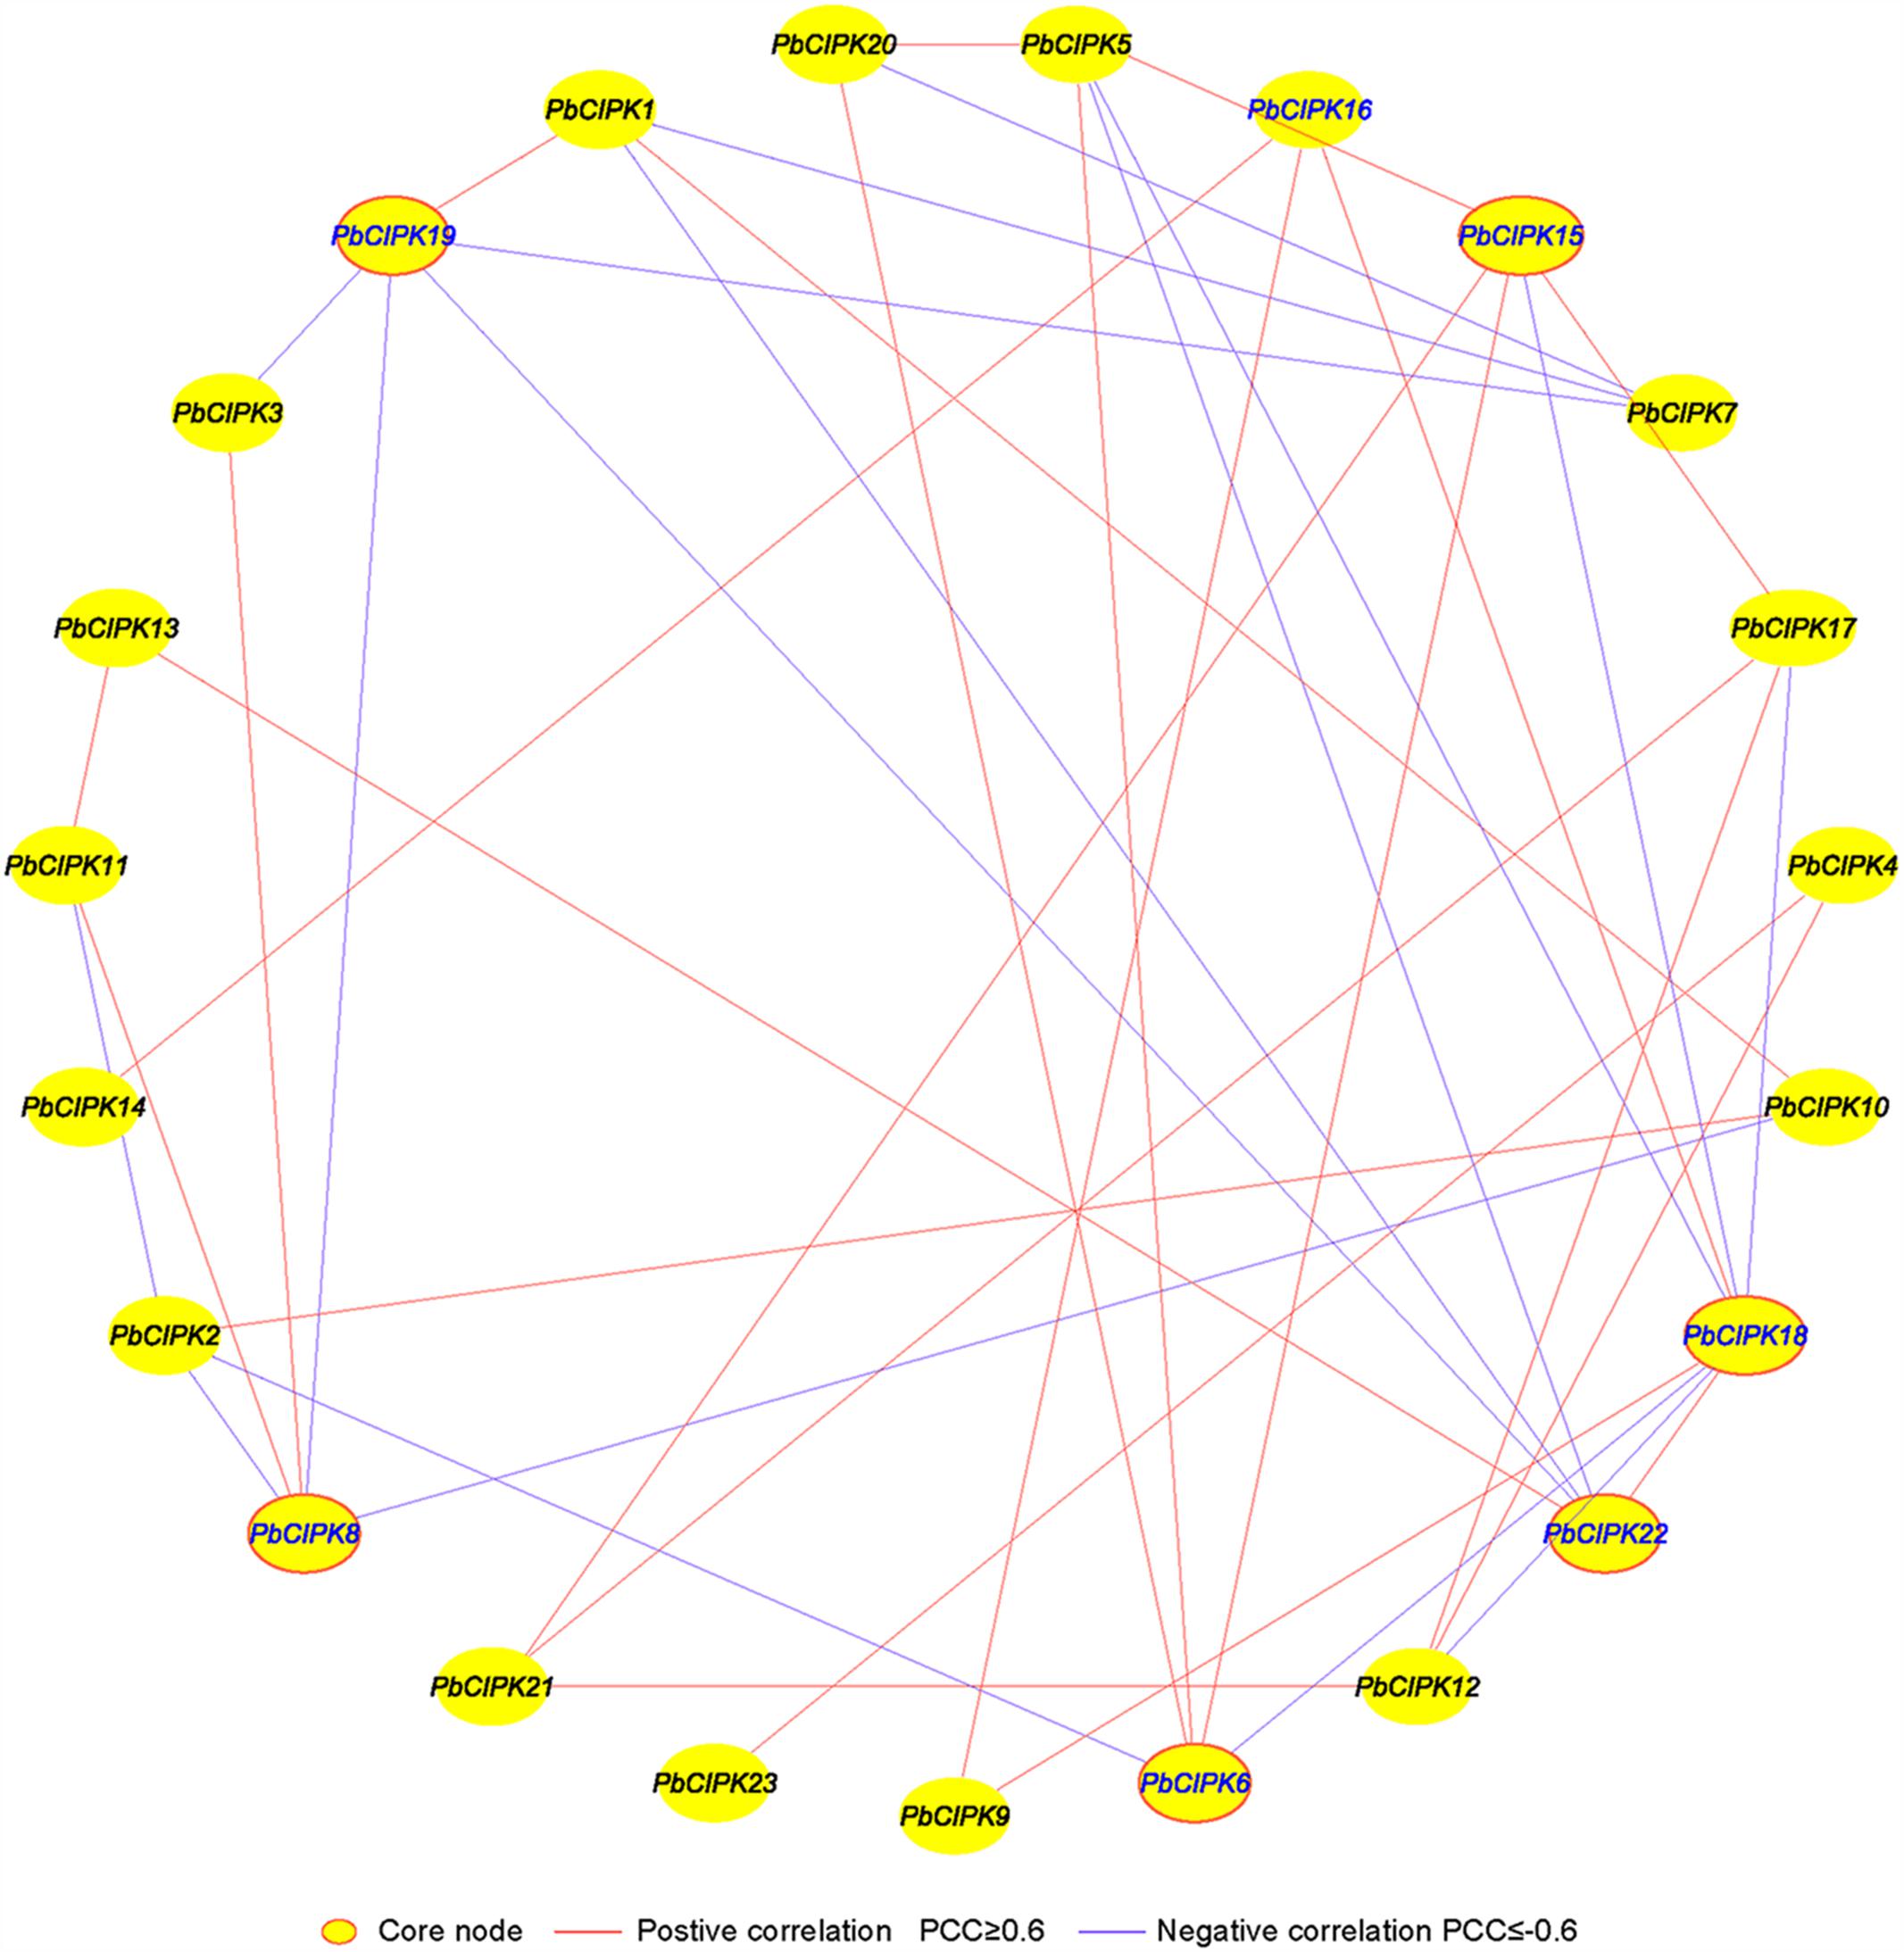
FIGURE 6. Co-expression networks of PbCIPK genes under salt and osmotic stresses. The co-expression networks were established based on the Pearson correlation coefficients of PbCIPKs gene pairs under salt and osmotic stresses, which involved 23 nodes and 108 regulatory edges. All of Pearson correlation coefficients of co-expression gene-pairs were significant at the 0.05 significance level (p-value), and the different edge line types indicated different relevance levels of co-expression gene-pairs.
To validate the co-regulated relationships of PbCIPK genes, we constructed interaction co-regulatory networks of CIPK orthologs through retrieving STRING database16 based on the CIPK orthologs in Arabidopsis, which identified 13 high confidence interactive CIPK proteins (CIPK1,-3, -4, -7, -8, -9, -10, 11, -12, -14, -23, and -24) which were involved in stress-related regulatory networks (Supplementary Figure S5). In Arabidopsis, the CIPKs and CBLs interactions were involved in mediating different environmental stresses such as abscisic acid, cold, high pH, high salt, and osmotic stress (Xiang et al., 2007; Luan, 2009; Weinl and Kudla, 2009; Yu et al., 2014; Manik et al., 2015). AtCIPK24/SOS2 can interact with AtCBL4/SOS3 to stimulate Na+/H+ exchange activity of the SOS1 to enhance salt stress tolerance in roots of Arabidopsis (Kudla et al., 2010; Manik et al., 2015). Among the 13 CIPK orthologs, each of them had at least three confidence interaction relationships, which targeted to CBLs (CBL1, -2, -4, -9, and -10) which were involved in calcium ion binding and related to sodium-hydrogen transport system. The co-regulatory relationships of PbCIPKs under salt and osmotic stresses were verified. Co-regulatory networks including PbCIPK22, -19, -18, -15, -8, and -6 could be core mediators in the PbCIPKs response to salt and osmotic stresses. Although CIPKs mediate different abiotic stress and interact with different CBL proteins involved in multiple biological processes, there is still a need to identify possible response patterns and interaction networks of pear CIPKs for better understanding of their biological functions in responding to environmental stresses.
Conclusion
In this study, we performed a comprehensive genome-wide survey of the CIPK family in pear. A total of 28 CIPK genes were identified and systematically analyzed for genomic locations, gene family organization, phylogenetic analyses, gene structure and conserved motif analysis, gene synteny and divergence timing, stress-responsive cis-element analysis, as well as gene expression profile and gene co-expression analyses under salt and osmotic stresses. Phylogenetic analyses of PbCIPKs indicated that 28 CIPKs from pear could be divided into four phylogenetic groups. Gene structure and motif analyses supported the classification of PbCIPKs, and each group shared similar or conserved distributions of exon-intron and protein motifs. Genomic location and synteny analyses indicated 23 out of 28 PbCIPKs were mapped on the pear chromosomes, nine gene pairs were derived from segmental duplications, and have maintained by purifying selections. Stress-responsive elements analysis indicated most promoter regions of PbCIPKs contained stress induced cis-acting elements, suggesting that these genes are involved in abiotic stress responses. Furthermore, expression profiles analysis of PbCIPKs under salt and osmotic stresses supported the prediction analysis of stress-responsive cis-elements in promoter regions. This indicated that almost all PbCIPKs could be induced by salt or osmotic treatment, and that some genes could be co-expressed in response to one or two stresses, which expressions exhibited similar or reverse patterns. Moreover, co-expression analyses indicated that 23 stress-responsive PbCIPKs had significant co-expression at 0.05 level under salt or osmotic stress, and some genes, such as PbCIPK22, -19, -18, -15, -8, and -6, acted as core regulators in response to salt and osmotic stresses. This study revealed the genome-wide identification of PbCIPK genes could be co-expressed under salt and osmotic stresses, and provide a basis for future research on abiotic stress responses medicated by CIPKs in pear.
Author Contributions
YC, Z-MC, and JL conceived the study and designed the experiments. JT, JL, HL, XL, and QY performed the experiments and data analysis. JT wrote the manuscript. Z-MC and YC revised and proofread the manuscript. All authors read and approved the final manuscript.
Conflict of Interest Statement
The authors declare that the research was conducted in the absence of any commercial or financial relationships that could be construed as a potential conflict of interest.
Acknowledgments
This work was supported by the Jiangsu Agriculture Science and Technology Innovation Fund of China [CX(14)5018], the National Natural Sciences Foundation of China (No. 31372051 and No. 31501796) and the Natural Science Foundation of Jiangsu Province (No. BK20150550).
Supplementary Material
The Supplementary Material for this article can be found online at: http://journal.frontiersin.org/article/10.3389/fpls.2016.01361
FIGURE S1 | Alignments of CIPK family proteins from pear (P. bretschneideri).
FIGURE S2 | Alignments of CIPK family proteins from pear (P. bretschneideri) and A. thaliana.
FIGURE S3 | AML phylogenetic analysis of CIPK gene family in P. bretschneideri and A. thaliana.
FIGURE S4 | ML phylogenetic analysis of CIPK gene family in eight plants. Methods follow ML with 1000 bootstrap in MEGA 6.0 according to full length amino acid sequences from A. thaliana, B. distachyon, G. max, O. sativa, P. richocarpa, P. persica, P. bretschneideri, V. vinifera.
FIGURE S5 | A confidence co-regulatory network of CIPK orthologs in Arabidopsis.
Footnotes
- ^http://peargenome.njau.edu.cn/
- ^http://www.arabidopsis.org/
- ^http://rice.plantbiology.msu.edu/
- ^http://pfam.xfam.org/
- ^http://hmmer.org/
- ^http://smart.embl-heidelberg.de/
- ^http://web.expasy.org/compute_pi/
- ^http://meme-suite.org/tools/meme
- ^http://prosite.expasy.org/
- ^http://gsds.cbi.pku.edu.cn/
- ^http://bioinformatics.psb.ugent.be/webtools/plantcare/html/
- ^http://www.dna.affrc.go.jp/PLACE/
- ^http://www.premierbiosoft.com
- ^http://www.cytoscape.org/
- ^http://string.embl.de/
- ^http://string-db.org/
References
Adams, K. L., and Wendel, J. F. (2005). Polyploidy and genome evolution in plants. Curr. Opin. Plant Biol. 8, 135–141. doi: 10.1016/j.pbi.2005.01.001
Albrecht, V., Ritz, O., Linder, S., Harter, K., and Kudla, J. (2001). The NAF domain defines a novel protein–protein interaction module conserved in Ca2+-regulated kinases. EMBO J. 20, 1051–1063. doi: 10.1093/emboj/20.5.1051
Batelli, G., Verslues, P. E., Agius, F., Qiu, Q., Fujii, H., Pan, S., et al. (2007). SOS2 promotes salt tolerance in part by interacting with the vacuolar H+-ATPase and upregulating its transport activity. Mol. Cell. Biol. 27, 7781–7790. doi: 10.1128/MCB.00430-07
Bordych, C., Eisenhut, M., Pick, T. R., Kuelahoglu, C., and Weber, A. P. (2013). Co-expression analysis as tool for the discovery of transport proteins in photorespiration. Plant Biol. (Stuttg) 15, 686–693. doi: 10.1111/plb.12027
Chaves-Sanjuan, A., Sanchez-Barrena, M. J., Gonzalez-Rubio, J. M., Moreno, M., Ragel, P., Jimenez, M., et al. (2014). Structural basis of the regulatory mechanism of the plant CIPK family of protein kinases controlling ion homeostasis and abiotic stress. Proc. Natl. Acad. Sci. U.S.A. 111, E4532–E4541. doi: 10.1073/pnas.1407610111
Du, D., Rawat, N., Deng, Z., and Gmitter, F. G. Jr (2015). Construction of citrus gene coexpression networks from microarray data using random matrix theory. Hortic. Res. 2:15026. doi: 10.1038/hortres.2015.26
Finn, R. D., Bateman, A., Clements, J., Coggill, P., Eberhardt, R. Y., Eddy, S. R., et al. (2014). Pfam: the protein families database. Nucleic Acids Res. 42, D222–D230. doi: 10.1093/nar/gkt1223
Guo, Y., Qiu, Q. S., Quintero, F. J., Pardo, J. M., Ohta, M., Zhang, C., et al. (2004). Transgenic evaluation of activated mutant alleles of SOS2 reveals a critical requirement for its kinase activity and C-terminal regulatory domain for salt tolerance in Arabidopsis thaliana. Plant Cell 16, 435–449. doi: 10.1105/tpc.019174
Hernandez-Garcia, C. M., and Finer, J. J. (2014). Identification and validation of promoters and cis-acting regulatory elements. Plant Sci. 21, 109–119. doi: 10.1016/j.plantsci.2013.12.007
Hrabak, E. M., Chan, C. W., Gribskov, M., Harper, J. F., Choi, J. H., Halford, N., et al. (2003). The Arabidopsis CDPK-SnRK superfamily of protein kinases. Plant Physiol. 132, 666–680. doi: 10.1104/pp.102.011999
Hu, D. G., Li, M., Luo, H., Dong, Q. L., Yao, Y. X., You, C. X., et al. (2012). Molecular cloning and functional characterization of MdSOS2 reveals its involvement in salt tolerance in apple callus and Arabidopsis. Plant Cell Rep. 31, 713–722. doi: 10.1007/s00299-011-1189-5
Hu, W., Xia, Z., Yan, Y., Ding, Z., Tie, W., Wang, L., et al. (2015). Genome-wide gene phylogeny of CIPK family in cassava and expression analysis of partial drought-induced genes. Front. Plant Sci. 6:914. doi: 10.3389/fpls.2015.00914
Ji, H., Pardo, J. M., Batelli, G., Van Oosten, M. J., Bressan, R. A., and Li, X. (2013). The Salt Overly Sensitive (SOS) pathway: established and emerging roles. Mol. Plant 6, 275–286. doi: 10.1093/mp/sst017
Jimenez, J., Duncan, C. D., Gallardo, M., Mata, J., and Perez-Pulido, A. J. (2015). AnABlast: a new in silico strategy for the genome-wide search of novel genes and fossil regions. DNA Res. 22, 439–449. doi: 10.1093/dnares/dsv025
Kim, J. S., Mizoi, J., Yoshida, T., Fujita, Y., Nakajima, J., Ohori, T., et al. (2011). An ABRE promoter sequence is involved in osmotic stress-responsive expression of the DREB2A gene, which encodes a transcription factor regulating drought-inducible genes in Arabidopsis. Plant Cell Physiol. 52, 2136–2146. doi: 10.1093/pcp/pcr143
Kim, K. N., Cheong, Y. H., Grant, J. J., Pandey, G. K., and Luan, S. (2003). CIPK3, a calcium sensor-associated protein kinase that regulates abscisic acid and cold signal transduction in Arabidopsis. Plant Cell 15, 411–423. doi: 10.1105/tpc.006858
Kleist, T. J., Spencley, A. L., and Luan, S. (2014). Comparative phylogenomics of the CBL-CIPK calcium-decoding network in the moss Physcomitrella, Arabidopsis, and other green lineages. Front. Plant. Sci. 5:187. doi: 10.3389/fpls.2014.00187
Kolukisaoglu, U., Weinl, S., Blazevic, D., Batistic, O., and Kudla, J. (2004). Calcium sensors and their interacting protein kinases: genomics of the Arabidopsis and rice CBL-CIPK signaling networks. Plant Physiol. 134, 43–58. doi: 10.1104/pp.103.033068
Krzywinski, M., Schein, J., Birol, I., Connors, J., Gascoyne, R., Horsman, D., et al. (2009). Circos: an information aesthetic for comparative genomics. Genome Res. 19, 1639–1645. doi: 10.1101/gr.092759.109
Kudla, J., Batistic, O., and Hashimoto, K. (2010). Calcium signals: the lead currency of plant information processing. Plant Cell 22, 541–563. doi: 10.1105/tpc.109.072686
Larkin, M. A., Blackshields, G., Brown, N. P., Chenna, R., Mcgettigan, P. A., Mcwilliam, H., et al. (2007). Clustal W and Clustal X version 2.0. Bioinformatics 23, 2947–2948. doi: 10.1093/bioinformatics/btm404
Li, J., Hou, H., Li, X., Xiang, J., Yin, X., Gao, H., et al. (2013). Genome-wide identification and analysis of the SBP-box family genes in apple (Malus × domestica Borkh.). Plant Physiol. Biochem. 70, 100–114. doi: 10.1016/j.plaphy.2013.05.021
Liang, Y.-H., Cai, B., Chen, F., Wang, G., Wang, M., Zhong, Y., et al. (2014). Construction and validation of a gene co-expression network in grapevine (Vitis vinifera. L.). Hortic. Res. 1:14040. doi: 10.1038/hortres.2014.40
Livak, K. J., and Schmittgen, T. D. (2001). Analysis of relative gene expression data using real-time quantitative PCR and the 2-ΔΔCT method. Methods 25, 402–408. doi: 10.1006/meth.2001.1262
Luan, S. (2009). The CBL-CIPK network in plant calcium signaling. Trends Plant Sci. 14, 37–42. doi: 10.1016/j.tplants.2008.10.005
Lynch, M., and Conery, J. S. (2000). The evolutionary fate and consequences of duplicate genes. Science 290, 1151–1155. doi: 10.1126/science.290.5494.1151
Ma, D. M., Wr, W. X., Li, H. W., Jin, F. X., Guo, L. N., Wang, J., et al. (2014). Co-expression of the Arabidopsis SOS genes enhances salt tolerance in transgenic tall fescue (Festuca arundinacea Schreb.). Protoplasma 251, 219–231. doi: 10.1007/s00709-013-0540-9
Manik, S. M., Shi, S., Mao, J., Dong, L., Su, Y., Wang, Q., et al. (2015). The calcium sensor CBL-CIPK is involved in plant’s response to abiotic stresses. Int. J. Genomics 2015:493191. doi: 10.1155/2015/493191
Martinez-Atienza, J., Jiang, X., Garciadeblas, B., Mendoza, I., Zhu, J. K., Pardo, J. M., et al. (2007). Conservation of the salt overly sensitive pathway in rice. Plant Physiol. 143, 1001–1012. doi: 10.1104/pp.106.092635
McGinnis, S., and Madden, T. L. (2004). BLAST: at the core of a powerful and diverse set of sequence analysis tools. Nucleic Acids Res. 32, W20–W25. doi: 10.1093/nar/gkh435
Movahedi, S., Van Bel, M., Heyndrickx, K. S., and Vandepoele, K. (2012). Comparative co-expression analysis in plant biology. Plant Cell Environ. 35, 1787–1798. doi: 10.1111/j.1365-3040.2012.02517.x
Murashige, T., and Skoog, F. (1962). A revised medium for rapid growth and bio assays with tobacco tissue cultures. Physiol. Plant. 15, 473–497. doi: 10.1111/j.1399-3054.1962.tb08052.x
Ni, M., Cui, D., and Gelvin, S. B. (1996). Sequence-specific interactions of wound-inducible nuclear factors with mannopine synthase 2′ promoter wound-responsive elements. Plant Mol. Biol. 30, 77–96. doi: 10.1007/BF00017804
Pandey, G. K., Kanwar, P., Singh, A., Steinhorst, L., Pandey, A., Yadav, A. K., et al. (2015). Calcineurin B-Like protein-interacting protein kinase CIPK21 regulates osmotic and salt stress responses in Arabidopsis. Plant Physiol. 169, 780–792. doi: 10.1104/pp.15.00623
Qiu, Q. S., Guo, Y., Dietrich, M. A., Schumaker, K. S., and Zhu, J. K. (2002). Regulation of SOS1, a plasma membrane Na+/H+ exchanger in Arabidopsis thaliana, by SOS2 and SOS3. Proc. Natl. Acad. Sci. U.S.A. 99, 8436–8441. doi: 10.1073/pnas.122224699
Qiu, Q. S., Guo, Y., Quintero, F. J., Pardo, J. M., Schumaker, K. S., and Zhu, J. K. (2004). Regulation of vacuolar Na+/H+ exchange in Arabidopsis thaliana by the salt-overly-sensitive (SOS) pathway. J. Biol. Chem. 279, 207–215. doi: 10.1074/jbc.M307982200
Roy, S. W., and Penny, D. (2007). Patterns of intron loss and gain in plants: intron loss-dominated evolution and genome-wide comparison of O. sativa and A. thaliana. Mol. Biol. Evol. 24, 171–181. doi: 10.1093/molbev/msl159
Shen, Q., Zhang, P., and Ho, T. H. (1996). Modular nature of abscisic acid (ABA) response complexes: composite promoter units that are necessary and sufficient for ABA induction of gene expression in barley. Plant Cell 8, 1107–1119. doi: 10.1105/tpc.8.7.1107
Tamura, K., Stecher, G., Peterson, D., Filipski, A., and Kumar, S. (2013). MEGA6: molecular evolutionary genetics analysis version 6.0. Mol. Biol. Evol. 30, 2725–2729. doi: 10.1093/molbev/mst197
Tang, J., Wang, F., Hou, X.-L., Wang, Z., and Huang, Z.-N. (2014). Genome-wide fractionation and identification of WRKY transcription factors in Chinese cabbage (Brassica rapa ssp. pekinensis) reveals collinearity and their expression patterns under abiotic and biotic stresses. Plant Mol. Biol. Rep. 32, 781–795. doi: 10.1007/s11105-013-0672-2
Tang, J., Wang, F., Wang, Z., Huang, Z., Xiong, A., and Hou, X. (2013). Characterization and co-expression analysis of WRKY orthologs involved in responses to multiple abiotic stresses in Pak-choi (Brassica campestris ssp. chinensis). BMC Plant Biology 13:1. doi: 10.1186/1471-2229-13-188
Tang, R. J., Liu, H., Bao, Y., Lv, Q. D., Yang, L., and Zhang, H. X. (2010). The woody plant poplar has a functionally conserved salt overly sensitive pathway in response to salinity stress. Plant Mol. Biol. 74, 367–380. doi: 10.1007/s11103-010-9680-x
Tang, R. J., Zhao, F. G., Garcia, V. J., Kleist, T. J., Yang, L., Zhang, H. X., et al. (2015). Tonoplast CBL-CIPK calcium signaling network regulates magnesium homeostasis in Arabidopsis. Proc. Natl. Acad. Sci. U.S.A. 112, 3134–3139. doi: 10.1073/pnas.1420944112
Usadel, B., Obayashi, T., Mutwil, M., Giorgi, F. M., Bassel, G. W., Tanimoto, M., et al. (2009). Co-expression tools for plant biology: opportunities for hypothesis generation and caveats. Plant Cell Environ. 32, 1633–1651. doi: 10.1111/j.1365-3040.2009.02040.x
Velasco, R., Zharkikh, A., Affourtit, J., Dhingra, A., Cestaro, A., Kalyanaraman, A., et al. (2010). The genome of the domesticated apple (Malus x domestica Borkh.). Nat. Genet. 42, 833–839. doi: 10.1038/ng.654
Wang, R. K., Li, L. L., Cao, Z. H., Zhao, Q., Li, M., Zhang, L. Y., et al. (2012). Molecular cloning and functional characterization of a novel apple MdCIPK6L gene reveals its involvement in multiple abiotic stress tolerance in transgenic plants. Plant Mol. Biol. 79, 123–135. doi: 10.1007/s11103-012-9899-9
Wang, Y., Tang, H., Debarry, J. D., Tan, X., Li, J., Wang, X., et al. (2012). MCScanX: a toolkit for detection and evolutionary analysis of gene synteny and collinearity. Nucleic Acids Res. 40:e49. doi: 10.1093/nar/gkr1293
Weinl, S., and Kudla, J. (2009). The CBL-CIPK Ca2+-decoding signaling network: function and perspectives. New Phytol. 184, 517–528. doi: 10.1111/j.1469-8137.2009.02938.x
Wu, J., Wang, Z., Shi, Z., Zhang, S., Ming, R., Zhu, S., et al. (2013). The genome of the pear (Pyrus bretschneideri Rehd.). Genome Res. 23, 396–408. doi: 10.1101/gr.144311.112
Xiang, Y., Huang, Y., and Xiong, L. (2007). Characterization of stress-responsive CIPK genes in rice for stress tolerance improvement. Plant Physiol. 144, 1416–1428. doi: 10.1104/pp.107.101295
Xiong, L., Schumaker, K. S., and Zhu, J. K. (2002). Cell signaling during cold, drought, and salt stress. Plant Cell 14(Suppl.), S165–S183.
Xu, Y., Li, H., Li, X., Lin, J., Wang, Z., Yang, Q., et al. (2015). Systematic selection and validation of appropriate reference genes for gene expression studies by quantitative real-time PCR in pear. Acta Physiol. Plant. 37, 1–16. doi: 10.1007/s11738-015-1784-0
Yamaguchi-Shinozaki, K., and Shinozaki, K. (2005). Organization of cis-acting regulatory elements in osmotic- and cold-stress-responsive promoters. Trends Plant Sci. 10, 88–94. doi: 10.1016/j.tplants.2004.12.012
Yamaguchi-Shinozaki, K., and Shinozaki, K. (2006). Transcriptional regulatory networks in cellular responses and tolerance to dehydration and cold stresses. Annu. Rev. Plant Biol. 57, 781–803. doi: 10.1146/annurev.arplant.57.032905.105444
Yang, Z., and Bielawski, J. P. (2000). Statistical methods for detecting molecular adaptation. Trends Ecol. Evol. 15, 496–503. doi: 10.1016/S0169-5347(00)01994-7
Yu, Q., An, L., and Li, W. (2014). The CBL-CIPK network mediates different signaling pathways in plants. Plant Cell Rep. 33, 203–214. doi: 10.1007/s00299-013-1507-1
Yu, Y., Xia, X., Yin, W., and Zhang, H. (2007). Comparative genomic analysis of CIPK gene family in Arabidopsis and Populus. Plant Growth Regul. 52, 101–110. doi: 10.1007/s10725-007-9165-3
Zhang, H., Yang, B., Liu, W. Z., Li, H., Wang, L., Wang, B., et al. (2014). Identification and characterization of CBL and CIPK gene families in canola (Brassica napus L.). BMC Plant Biol. 14:8. doi: 10.1186/1471-2229-14-8
Zhang, Z., Li, J., Zhao, X. Q., Wang, J., Wong, G. K., and Yu, J. (2006). KaKs_Calculator: calculating Ka and Ks through model selection and model averaging. Genomics Proteomics Bioinformatics 4, 259–263. doi: 10.1016/S1672-0229(07)60007-2
Zhu, J. K. (2002). Salt and drought stress signal transduction in plants. Annu. Rev. Plant Biol. 53, 247–273. doi: 10.1146/annurev.arplant.53.091401.143329
Keywords: Asian pear, CIPK, co-expression, evolution, osmotic stress, salt stress
Citation: Tang J, Lin J, Li H, Li X, Yang Q, Cheng Z-M and Chang Y (2016) Characterization of CIPK Family in Asian Pear (Pyrus bretschneideri Rehd) and Co-expression Analysis Related to Salt and Osmotic Stress Responses. Front. Plant Sci. 7:1361. doi: 10.3389/fpls.2016.01361
Received: 29 April 2016; Accepted: 26 August 2016;
Published: 07 September 2016.
Edited by:
Claudio Bonghi, University of Padua, ItalyReviewed by:
Chuang Ma, Northwest Agricultural and Forestry University, ChinaWu Jun, Nanjing Agricultural University, China
Copyright © 2016 Tang, Lin, Li, Li, Yang, Cheng and Chang. This is an open-access article distributed under the terms of the Creative Commons Attribution License (CC BY). The use, distribution or reproduction in other forums is permitted, provided the original author(s) or licensor are credited and that the original publication in this journal is cited, in accordance with accepted academic practice. No use, distribution or reproduction is permitted which does not comply with these terms.
*Correspondence: Jing Lin, lj84390224@126.com Zong-Ming Cheng, zcheng@utk.edu Youhong Chang, cyh@jaas.ac.cn