 Lixia Li
 Yujie Luo
 Biyun ChenKun XuFugui Zhang
 Hao LiQian HuangXin Xiao
 Tianyao ZhangJihong HuFeng Li
 Xiaoming Wu*
- Key Laboratory of Biology and Genetic Improvement of Oil Crops, Ministry of Agriculture, Oil Crop Research Institute – Chinese Academy of Agricultural Sciences, Wuhan, China
Rapeseed (Brassica napus L.) is one of the most important oil crops in the world. However, the yield and quality of rapeseed were largely decreased by clubroot (Plasmodiophora brassicae Woronin). Therefore, it is of great importance for screening more resistant germplasms or genes and improving the resistance to P. brassicae in rapeseed breeding. In this study, a massive resistant identification for a natural global population was conducted in two environments with race/pathotype 4 of P. brassicae which was the most predominant in China, and a wide range of phenotypic variation was found in the population. In addition, a genome-wide association study of 472 accessions for clubroot resistance (CR) was performed with 60K Brassica Infinium SNP arrays for the first time. In total, nine QTLs were detected, seven of which were novel through integrative analysis. Furthermore, additive effects in genetic control of CR in rapeseed among the above loci were found. By bioinformatic analyses, the candidate genes of these loci were predicted, which indicated that TIR-NBS gene family might play an important role in CR. It is believable that the results presented in our study could provide valuable information for understanding the genetic mechanism and molecular regulation of CR.
Introduction
Rapeseed (Brassica napus L., AACC, 2n = 38) is one of the most important and widely cultivated oil crops, which derived from the hybridization of two basic diploid species in U-triangle, Brassica rapa (AA, 2n = 20) and Brassica oleracea (CC, 2n = 18; Nagaharu, 1935). The completion of genome sequencing of A genome from B. rapa (Wang et al., 2011), C genome from B. oleracea (Liu et al., 2014) and AC genome from B. napus (Chalhoub et al., 2014) could provide crucial information for studying the genetic and molecular mechanisms of important traits.
Clubroot, caused by Plasmodiophora brassicae Woronin, is an obligate and devastating disease. The pathogen could infect about 3,700 species through 330 genera in Brassicaceae (Hwang et al., 2012), among that the host range is most widespread in Brassica, Raphanus, and Arabidopsis (Dixon, 2009). Physiological specialization has long been known to occur in P. brassicae (Honig, 1931). The Williams classification (Williams, 1966) and European Clubroot Differential (Buczacki et al., 1975) have been used commonly for assessment of virulence in P. brassicae. In China, race/pathotype 1, 2, 4, 7, 9, 10, 11, and 13, classified on the differentials of Williams, have been identified. Furthermore, race/pathotype 4 was found predominant in China (Chai et al., 2014). After infected by P. brassicae, the root of host became proliferation and deformity, leading to the formation of typical clubs (Dobson and Gabrielson, 1983). The symptoms prevented the root cells from absorption water and nutrition, and caused the host plant malnutrition, growth retardation even death, which resulted in reduction of crop production and quality. Studies showed that there was a reduction of 30%, even to 80–91% for yield loss in rapeseed experimental field trials (Tewari et al., 2005; Pageau et al., 2006). Aside from production, the seed quality was also decreased with a loss of 4.7–6.1% in oil content, 13–26% in 1000 seed weight (Hwang et al., 2012), and an increase of 50% in oil chlorophyll content (Engqvist, 1994). Although various managements have been used to control the clubroot (Kowata-Dresch and May-De Mio, 2012), improving varieties with durable resistance by classical breeding or genetic modification was still an effective and environment-friendly way.
Sources of resistance to P. brassicae have been identified in Brassica germplasms. Among the European fodder turnips (B. rapa ssp. rapifera), several clubroot-resistant cultivars including Gelria R, Siloga, Debra, and Milan White were found (Hirai, 2006). In contrast to B. rapa, the immune resources have only rarely been identified in B. oleracea and B. napus (Piao et al., 2009). Nevertheless, some high-resistant resources were also used to develop clubroot resistance (CR) cultivars with diverse resistant backgrounds in B. napus (Rahman et al., 2011).
Genetic mapping of CR has been performed extensively on resistant resources. In Arabidopsis thaliana, a CR gene RPB1, four additive QTLs, and four epistatic regions were identified (Fuchs and Sacristán, 1996; Jubault et al., 2008). Most of the known CR genes/QTLs were identified from B. rapa. At least 11 CR genes/QTLs were mapped on five different chromosomes based on different bi-parental linkage population, which were Crr2 on BrA01(Suwabe et al., 2003), Crr3 and CRc on BrA02 (Hirai et al., 2004; Sakamoto et al., 2008), CRa, CRb, CRk, PbBa3.1, PbBa3.3, and Rcr1 on BrA03 (Matsumoto et al., 1998; Piao et al., 2004; Sakamoto et al., 2008; Kato et al., 2012; Chen et al., 2013; Chu et al., 2014), Crr4 on BrA06 (Suwabe et al., 2006), Crr1 on BrA08 (Suwabe et al., 2003). To increase efficiency of marker assisted selection (MAS), fine mapping was carried out for CRb, Crr3, and Rcr1 (Saito et al., 2006; Kato et al., 2013; Chu et al., 2014; Zhang et al., 2014). In contrast to B. rapa, fewer CR loci, such as CR2a, CR2b, Pb3, Pb4, PbBo1, Pb-Bo (Anju 1), CRQTL-YC, CRQTL-GN_1, and CRQTL-GN_2 were identified in B. oleracea (Landry et al., 1992; Grandclément and Thomas, 1996; Voorrips et al., 1997; Rocherieux et al., 2004; Nagaoka et al., 2010; Lee et al., 2016). In B. napus, one dominant gene Pb-Bn1, and two other QTLs were mapped on the BnA04 and BnC05, respectively (Manzanares-Dauleux et al., 2000). As well as 19 QTLs were detected on eight chromosomes (Werner et al., 2008). One locus in a population of 121 doubled haploid lines was identified to be linked to CRa which was identified in B. rapa (Zhang et al., 2015).
Although, QTL mapping based on bi-parental population has been used in the study of genetic architecture of complex traits (Cai et al., 2016), it was also restricted for the limited recombination events between parents and the difficult-used marker information in previous study. With the development of high-throughput sequencing technology, genome-wide association study (GWAS) based on linkage disequilibrium (LD) has become an important and powerful tool for gene mapping. GWAS could take advantage of the phenotypic variation and historical recombination in natural populations without constructing a mapping population (Nordborg and Weigel, 2008). In recent years, GWAS has been used to identify genes of various traits in rapeseed, such as traits of yield, seed quality, flowering time, and resistance to Sclerotinia sclerotiorum (Harper et al., 2012; Lu et al., 2014; Raman et al., 2014; Li et al., 2015; Liu J. et al., 2016; Liu S. et al., 2016; Wei et al., 2016; Xu et al., 2016). However, there was no report of GWAS being used to study resistance to P. brassicae in Brassica.
Plants have evolved two innate immune pathways to resist the attack of pathogens (Jones and Dangl, 2006). The first one was pathogen-associated molecular pattern (PAMP) triggered immunity (PTI), which the pattern recognition receptor (PRR) proteins located on the external face of the host cell could recognize the conservative PAMPs released by pathogens, sequentially activating the PTI regulated by multiple signal transduction pathway; The other one was effector-triggered immunity (ETI), which the effector factor secreted by pathogens could inhibit the PTI, and be recognized by specific R genes in plants, consequently triggering the ETI. With the action of natural selection, pathogens would evolve new effectors, and plants also evolved new R genes (Bent and Mackey, 2007). Most R proteins contain conserved motifs such as nucleotide-binding site (NBS), leucine-rich repeat (LRR), Toll-interleukin-1 receptor domain (TIR), coiled-coil (CC) or leucine zipper (LZ) structure and protein kinase domain (PK, Liu et al., 2007). Among the identified CR loci, CRa and Crr1 have been cloned and confirmed to carry TIR-NBS-LRR structure (Ueno et al., 2012; Hatakeyama et al., 2013).
In this study, a massive resistant identification for a natural global population including 472 accessions was conducted with pathotype 4 of P. brassicae which was the most predominant in China. Based on the phenotypic data, a GWAS of 472 accessions was performed in CR with Brassica 60K SNP arrays at two environments for the first time. The aim of this study was to gain resistant resources from rapeseed by identification in multiple environments, and to detect CR loci. Some candidate genes were predicted by bioinformatic analyses. These findings would provide valuable information for understanding the genetic mechanism and molecular regulation of CR, and also for resistant breeding to P. brassicae in Brassica.
Materials and Methods
Plant Materials and Pathogen Isolates
The association population of rapeseed including 472 accessions, which were collected from 23 countries worldwide of four continents, has been previously reported (Li et al., 2014). All the seeds of these inbred lines were conserved in the National Mid-term Gene Bank for Oil Crops in Wuhan, China. To carry out the artificial inoculation in greenhouse (GH), the infected roots of rapeseed were collected from the infected field (IF) of Dangyang, China, where the pathogen was reported as pathotype 4 based on Williams classification (Ren et al., 2012).
Field Experiments and Artificial Inoculation
All of the 472 accessions were planted in field infected seriously by P. brassicae at Dangyang, China on October 2013. The field experiments followed a randomized complete block design with two rows and three replications. Before sowing, we partitioned compartments with width of 2.0 m in consideration of field drainage and soil fertility factors. The plants were sown in strip with a 0.3 m spacing between rows, singling 12 plants each row after sowing for 1 month. Infected rapeseed roots collected from Dangyang were stored at -20°C, which were used for artificial inoculation trials in GH. The artificial inoculation of the population was performed at Shenyang on October of 2015. Firstly, nutrient soil was dried and powdered, while the disease roots were unfrozen and decomposed for one night. Then we squeezed the disease roots with distilled water to make P. brassicae suspension. The suspension was mixed with the dried nutrient soil and adjusted to 108 resting spores per gram (g) dry soil. The soil humidity which reached to the extent of kneading with clumps and touching with scatter was advisable, and then was sealed to ferment for 2 days in dark. The hole tray was filled with nutritional soil and then irrigated enough water. About 3 g fermentative soil per hole was placed, and sowed two seeds in the fermentative soil. The artificial inoculation followed a randomized complete block design with three replications, and inoculated 24 seeds for each replication. The plants grew under a 16 h L/8 h D photoperiod at an average temperature of 20–25°C.
Evaluation of Clubroot Reaction, the Broad-Sense Heritability, and Statistical Analysis
At flowering time of IF trials and 50 days after inoculation in greenhouse, plants were all taken out with roots and the disease severity was assessed using a 0–3 scale as follows, 0 = no clubs, 1 = a few small clubs, 2 = moderate clubbing, and 3 = severe clubbing (Kuginuki et al., 1999). A disease index (DI) was calculated according to the formula DI = [(n1+2n2+3n3)/(NT × 3)] × 100, where n1 to n3 were the number of plants with different disease severity of 1–3 scale and NT represented the total number of identified plants, respectively. An incidence rate (IR) was calculated with a formula IR (%) = [(n1+n2+n3)/NT] × 100. The broad-sense heritability was calculated as h2= σ2g/(σ2g+σ2ge/n+σ2e/nr). Where σ2g is the genetic variance, σ2ge is the interaction variance of the genotype with environment, σ2e is the error variance, n is the number of environments and r is the number of replications. The estimates of σ2g, σ2ge, and σ2e were obtained from the analysis of variance (ANOVA) procedure in SPASS 20.0 and the frequency distribution of phenotype was carried out using Excel 2010. The multiple comparisons of phenotypic average value from different origins were tested with package of SAS 9.2 at a significance level of P < 0.05. Also, the difference analysis of genotypic effects with containing different No. of favorable SNPs was performed online1.
SNP Array Analysis and Mapping, Population Structure and Linkage Disequilibrium Analysis
The young leaves from the representative plants of all accessions were collected, and extracted their genomic DNAs using a modified cetyltrimethyl ammonium bromide (CTAB, Murray and Thompson, 1980) method. SNP genotyping of 472 accessions was performed using Brassica 60K Illumina Infinium® HD Assay SNP arrays by Emei Tongde, Co. (Beijing) according to the manufacturer’s protocol2. The quality control process of SNP array genotyping data was the same to our previous study (Li et al., 2014). The LD was calculated using the software TASSEL3.0 (Bradbury et al., 2007). The principal component analysis (PCA), population structure and kinship were analyzed by Li et al. (2014). To confirm the physical position of each SNP, the probe sequences of 26,841 high-quality SNPs previously selected (Li et al., 2014) were used to perform a BlastN search against the B. napus (Darmor-bzh) reference genome by Li et al. (2016). Only the top blast hits were considered to be mapped in the genome with an E-value threshold of 1E–15, and blast matches to multiple loci with the same top E-value were not considered to be mapped successfully. Totally, 19,945 SNPs were assigned to B. napus chromosomes.
Genome-Wide Association Study
To evaluate the effects of population structure (Q, PC), the trait-SNP association analysis was performed using TASSEL 4.0 with six models: (i) GLM, controlling for nothing, (ii) Q model, controlling for Q, (iii) PCA model, controlling for PC, (iv) K model, controlling for K, (v) Q+K model, controlling for both Q and K, (vi) P+K model, controlling for both PC and K. The GLM, Q, K, and PCA models were performed using a general linear model with the following equation: y = Xα+ e. The Q+K and P+K models were performed using a mixed linear model with the following equation: y = Xα+Kμ+e. In above equations, y represented phenotype, X represented genotype, α was a vector containing fixed effects, K was the relative kinship matrix, μ was a vector of random additive genetic effects, and e was the unobserved vector of random residual. The distribution of observed -log10(p) for each SNP from marker-trait associations was compared with the expected distribution in a quantile-quantile plot (Q-Q plot). The significance of associations between SNPs and traits was based on a threshold P < 5.01 × 10⁻⁵ [P = 1/N, where N = the number of SNPs used, -log10(1/19,945) = 4.3]. Meanwhile, to avoid ignoring the effects of minor loci, the threshold P was lowered to 2/N = 1.00 × 10⁻⁴. Q-Q plots and Manhattan plots were drawn using the R package qqman3.
QTL Alignment and Candidate Gene Prediction
To compare the QTLs detected in this study with previous studies on CR, the sequences of QTLs/genes which have been reported in previous studies were collected and performed BlastN or e-PCR on the B. napus reference genome (Darmor-bzh) with a threshold of 1E–10. By that, we could ensure the homoeologous fragments’ physical positions of QTLs/genes reported in previous studies on B. napus genome.
It was regarded as a LD block that the region containing all SNPs which r2 > 0.4 with the most significant SNP. To ascertain regions that potential candidate genes of each QTL identified in this study maybe located, we considered the flanking markers that outside and adjacent to the LD block were considered as the candidate region’s boundary. To further identify the candidate genes and the participated pathways of the identified loci, the gene function annotation and enrichment analysis were carried out. All B. napus genes which located in the candidate regions were searched against the NCBI non-redundant (Nr) protein database using BlastP with an E-value ≤ 1E–05. The gene ontology (GO) terms of the B. napus genes were annotated by merging the Blast2GO and InterPro annotation results (Wu et al., 2016). GO enrichment analysis provided all of the GO terms that were significantly enriched in candidate genes compared with the genome background using Blast2GO with a false discovery rate (FDR) ≤ 0.01. The published differential expressed genes (DEGs) information in B. rapa were downloaded (Chen et al., 2015), and searched the homoeologous genes in B. napus with a threshold of 1E–50.
Results
Phenotypic Variation of CR Revealed its Genetic Complexity in Rapeseed
The 472 rapeseed accessions were planted in two environments of IF in Dangyang at the year of 2013–2014, and GH in Shenyang at the year of 2015, respectively. DI and IR were used to evaluate extent of CR. The frequency distribution diagrams of these two indicators in the two environments all showed continuous distributions (Supplementary Figure S1), which indicated that DI and IR were both controlled by multiple loci. Extensive variations of these two indicators were observed among the population in both two environments (Table 1). In IF environment, DI ranged from 9.26 to 75.00, with an average value of 31.39 ± 5.92 ( ± SE); IR ranged from 18.18 to 100% with an average value of 48.11 ± 8.10% ( ± SE). The broad-sense heritability (h2) of DI and IR in IF were 64.8 and 55.0%, respectively (Table 1). In GH environment, DI was from 36.11 to 100.00, with an average value of 84.77 ± 9.67 (±SE); IR was from 58.26 to 100%, with an average value of 96.49 ± 7.64% ( ± SE). Moreover, the h2 of DI and IR in GH were 78.2 and 69.4%, respectively (Table 1). The results thus indicated that the stability of CR is high, especially in a control environment. The correlation analysis of these two indicators between the two environments showed that the correlation reached to highly significant level, but the value of which (0.24 and 0.19) is too low (Supplementary Table S1). The results indicated that genetic factor and environment factor both played an important role in CR.
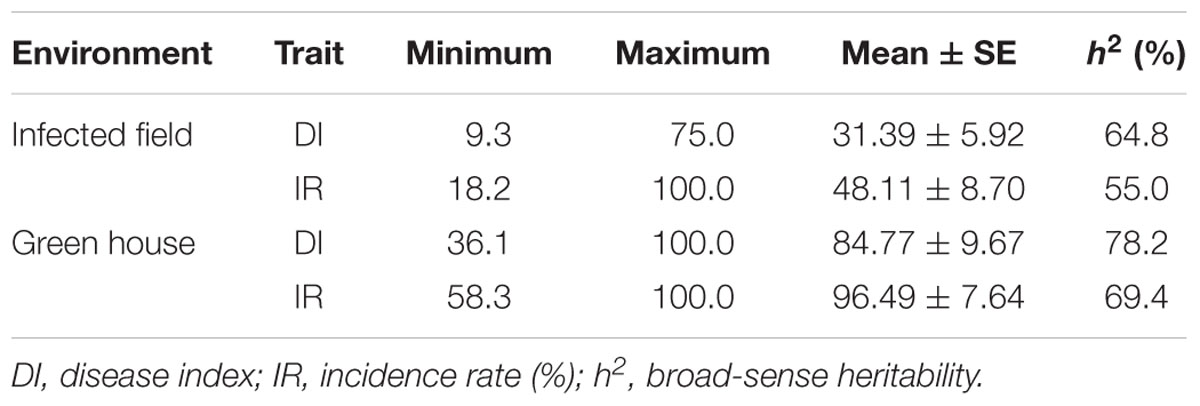
TABLE 1. The performance and heritability of clubroot resistance of the natural population in Brassica napus.
To assess the effects of origin including different continent (Europe, Asia, America, and Oceanica), different country (China and abroad), ecotype (spring, semi-winter, and winter type), and breeding eras in China (the years of 1950–1970, 1970–1980, 1980–1990, 1990–2000, and 2000–2011) on CR in the population, the accessions were classified by the above categories, respectively (Supplementary Figure S2). The DI and IR were both compared among different categories, and the results showed that the accessions from China were more resistant than that of from abroad both in DI and IR of two environments. Nevertheless, the absolute difference of these two indictors between China and abroad were very small (Supplementary Figure S2A). The similar tendency was emerged in the comparison among Europe, Asia, America, and Oceanica. The accessions from Asia and Europe were more resistant (Supplementary Figure S2B). Moreover, the semi-winter ecotype accession was the most resistant among the different ecotypes (Supplementary Figure S2C). The resistance of accessions from different breeding eras had significant difference (Supplementary Figure S2D), which indicated that artificial selection could impact the CR significantly. Therefore, we can further reinforce the resistance breeding in B. napus.
Genome-Wide Association Mapping Identified More Loci for CR in B. napus
In order to select suitable model for association mapping, GWAS was performed using four general liner models (GLM, Q, K, and P) and two mixed liner models (Q+K, and P+K) for IF-DI (DI in IF), IF-IR (IR in IF), GH-DI (DI in GH), and GH-IR (IR in GH), respectively. As the Q-Q plot showed, the distribution of observed -log10(p) from P+K model was the closest to the expected distribution for all four traits, which led to a low level of false-positive signals (Supplementary Figure S3). Therefore, the association signals were identified with P+K model subsequently.
To avoid ignoring the micro effective locus, significant associated SNP (sSNP, P < 5.01 × 10⁻⁵) and potential association SNP (pSNP, 5.01 × 10⁻⁵ < P < 1.00 × 10⁻⁴) were introduced in the study. If a confidence interval of a locus included one or more sSNPs, we called it significant association locus. Similarly, if a confidence interval of a locus did not have sSNP, and only included two or more pSNPs, we called it potential association locus. In total, seven significant association loci and two potential association loci were identified with these two indicators (Figure 1).
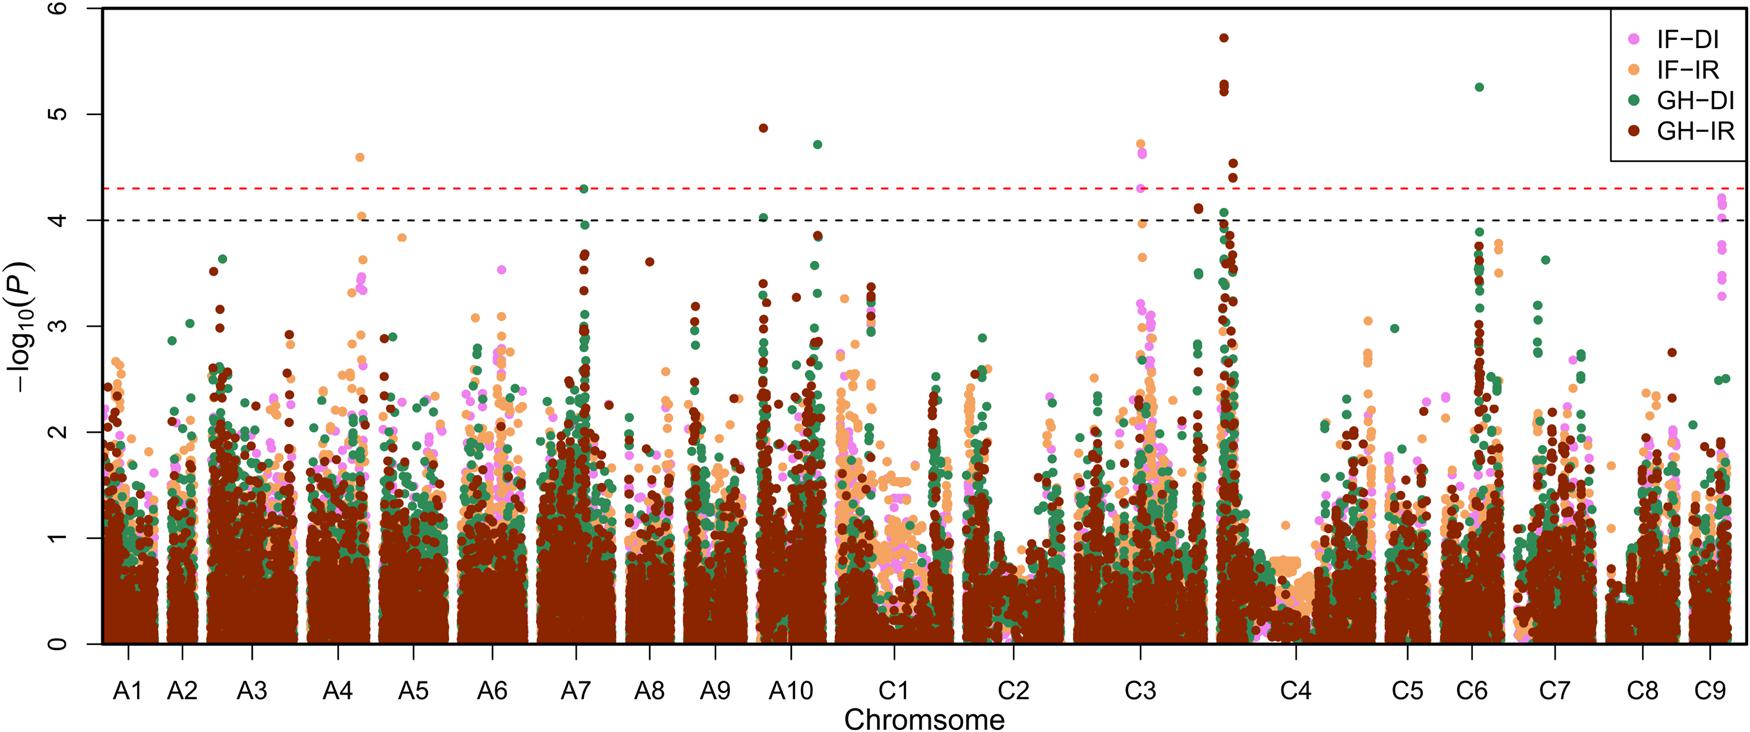
FIGURE 1. Manhattan plots of association analysis using the mixed liner model (MLM) model P+K. The pink plots, yellow plots, green plots and brown plots represent the associated signals for infected field-disease index (IF-DI), infected field-incidence rate (IF-IR), greenhouse-disease index (GH-DI), and greenhouse-incidence rate (GH-IR), respectively. The black and red dashed horizontal line depict the two significant thresholds that is (-log101/19,945 = 4.30) and (-log102/19,945 = 4.00).
For IF-DI, one significant association locus on BnC03 (named MCR-C3) was identified, with a peak SNP (highest significant) Bn-scaff_17521_1-p419499 which contributed to 4.81% of phenotypic variance. One potential association locus on BnC09 (named MCR-C9) was detected, with a peak SNP Bn-scaff_15576_1-p660538 which explained 4.21% of phenotypic variance (Table 2). For IF-IR, one significant association locus on BnA04 (named MCR-A04) was mapped, with a peak SNP Bn-A04-p16156157 which contributed 4.72% to phenotypic variance. It was noteworthy that MCR-C3 in IF-DI was also detected in IF-IR. For GH-DI, one significant association locus SCR-C6 was detected on BnC06 with a peak SNP Bn-scaff_16064_1-p26703 which explained 5.26% of phenotypic variance. Another significant association locus SCR-A10a was identified on BnA10 with a peak SNP Bn-A10-p16087066 which accounted for 4.71% of phenotypic variance. For GH-IR, three significant association loci were identified in total. Among that two loci were both on BnC04 (named SCR-C4a and SCR-C4b), which explained 5.72 and 4.54% of phenotypic variance, respectively. The rest one named SCR-A10b was on BnA10, with a peak SNP Bn-A10-p3966740 which explained 4.87% of phenotypic variance. In addition, one potential association locus SCR-C3 was mapped on BnC03 with a peak SNP Bn-scaff_18559_1-p166394 which accounted for 4.12% of phenotypic variance (Table 2).
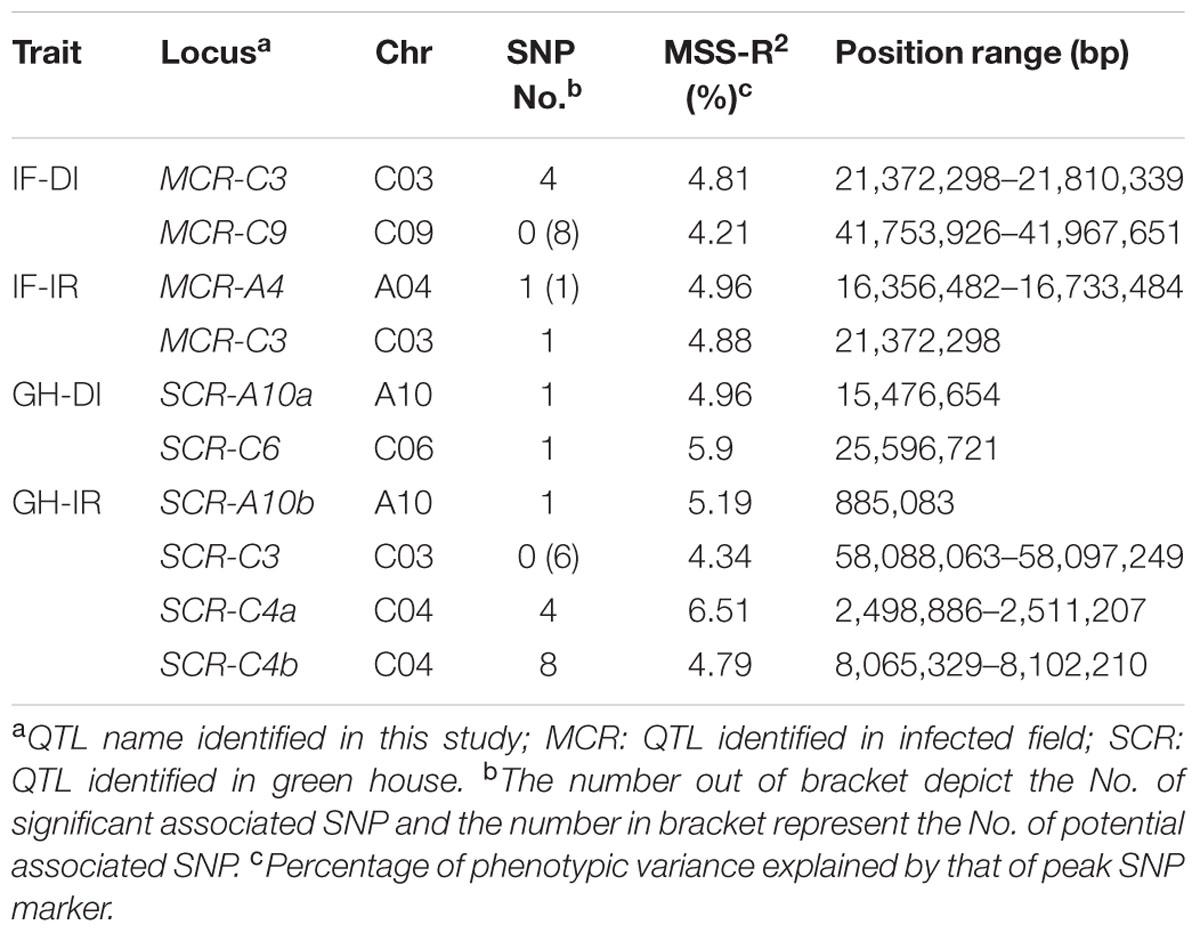
TABLE 2. The identified QTLs information through GWAS analysis in the natural population of B. napus.
Combined Effects Analysis Exhibited Additive Effects on CR
To understand the effects of allelic variations on CR in rapeseed, the combined effects of DI of different QTLs were analyzed in IF and GH, respectively (Figure 2). The genotype and phenotypic variance (R2) of each QTL was substituted by that of each peak marker of the corresponding QTL. On this basis, 472 accessions were grouped into three classes which contained 1, 2, and 3 favorable alleles in IF, respectively (Figure 2A). Because of too less accession contained in one group if all accessions were grouped by containing 1–6 favorable alleles in GH, all these six loci were merged and divided into three groups which contained 1–2, 3–4, and 5–6 favorable alleles to statistical analyze the DI in GH (Figure 2B). The results indicated that the more favorable alleles (resistant alleles) had, the lower DI (more resistance to P. brassicae) was demonstrated (Figure 2). In IF, the DI of the accessions held three resistant alleles can be reduced by 20.62% compared with that of holding one resistant allele. Similarly, the DI of the accessions held 5–6 resistant alleles can be reduced by 10.56% compared with that of only holding 1–2 resistant alleles in GH. The above results revealed that the CR was mainly controlled by additive effect. Therefore, the CR for B. napus can be improved by polymerization of all identified resistant alleles.
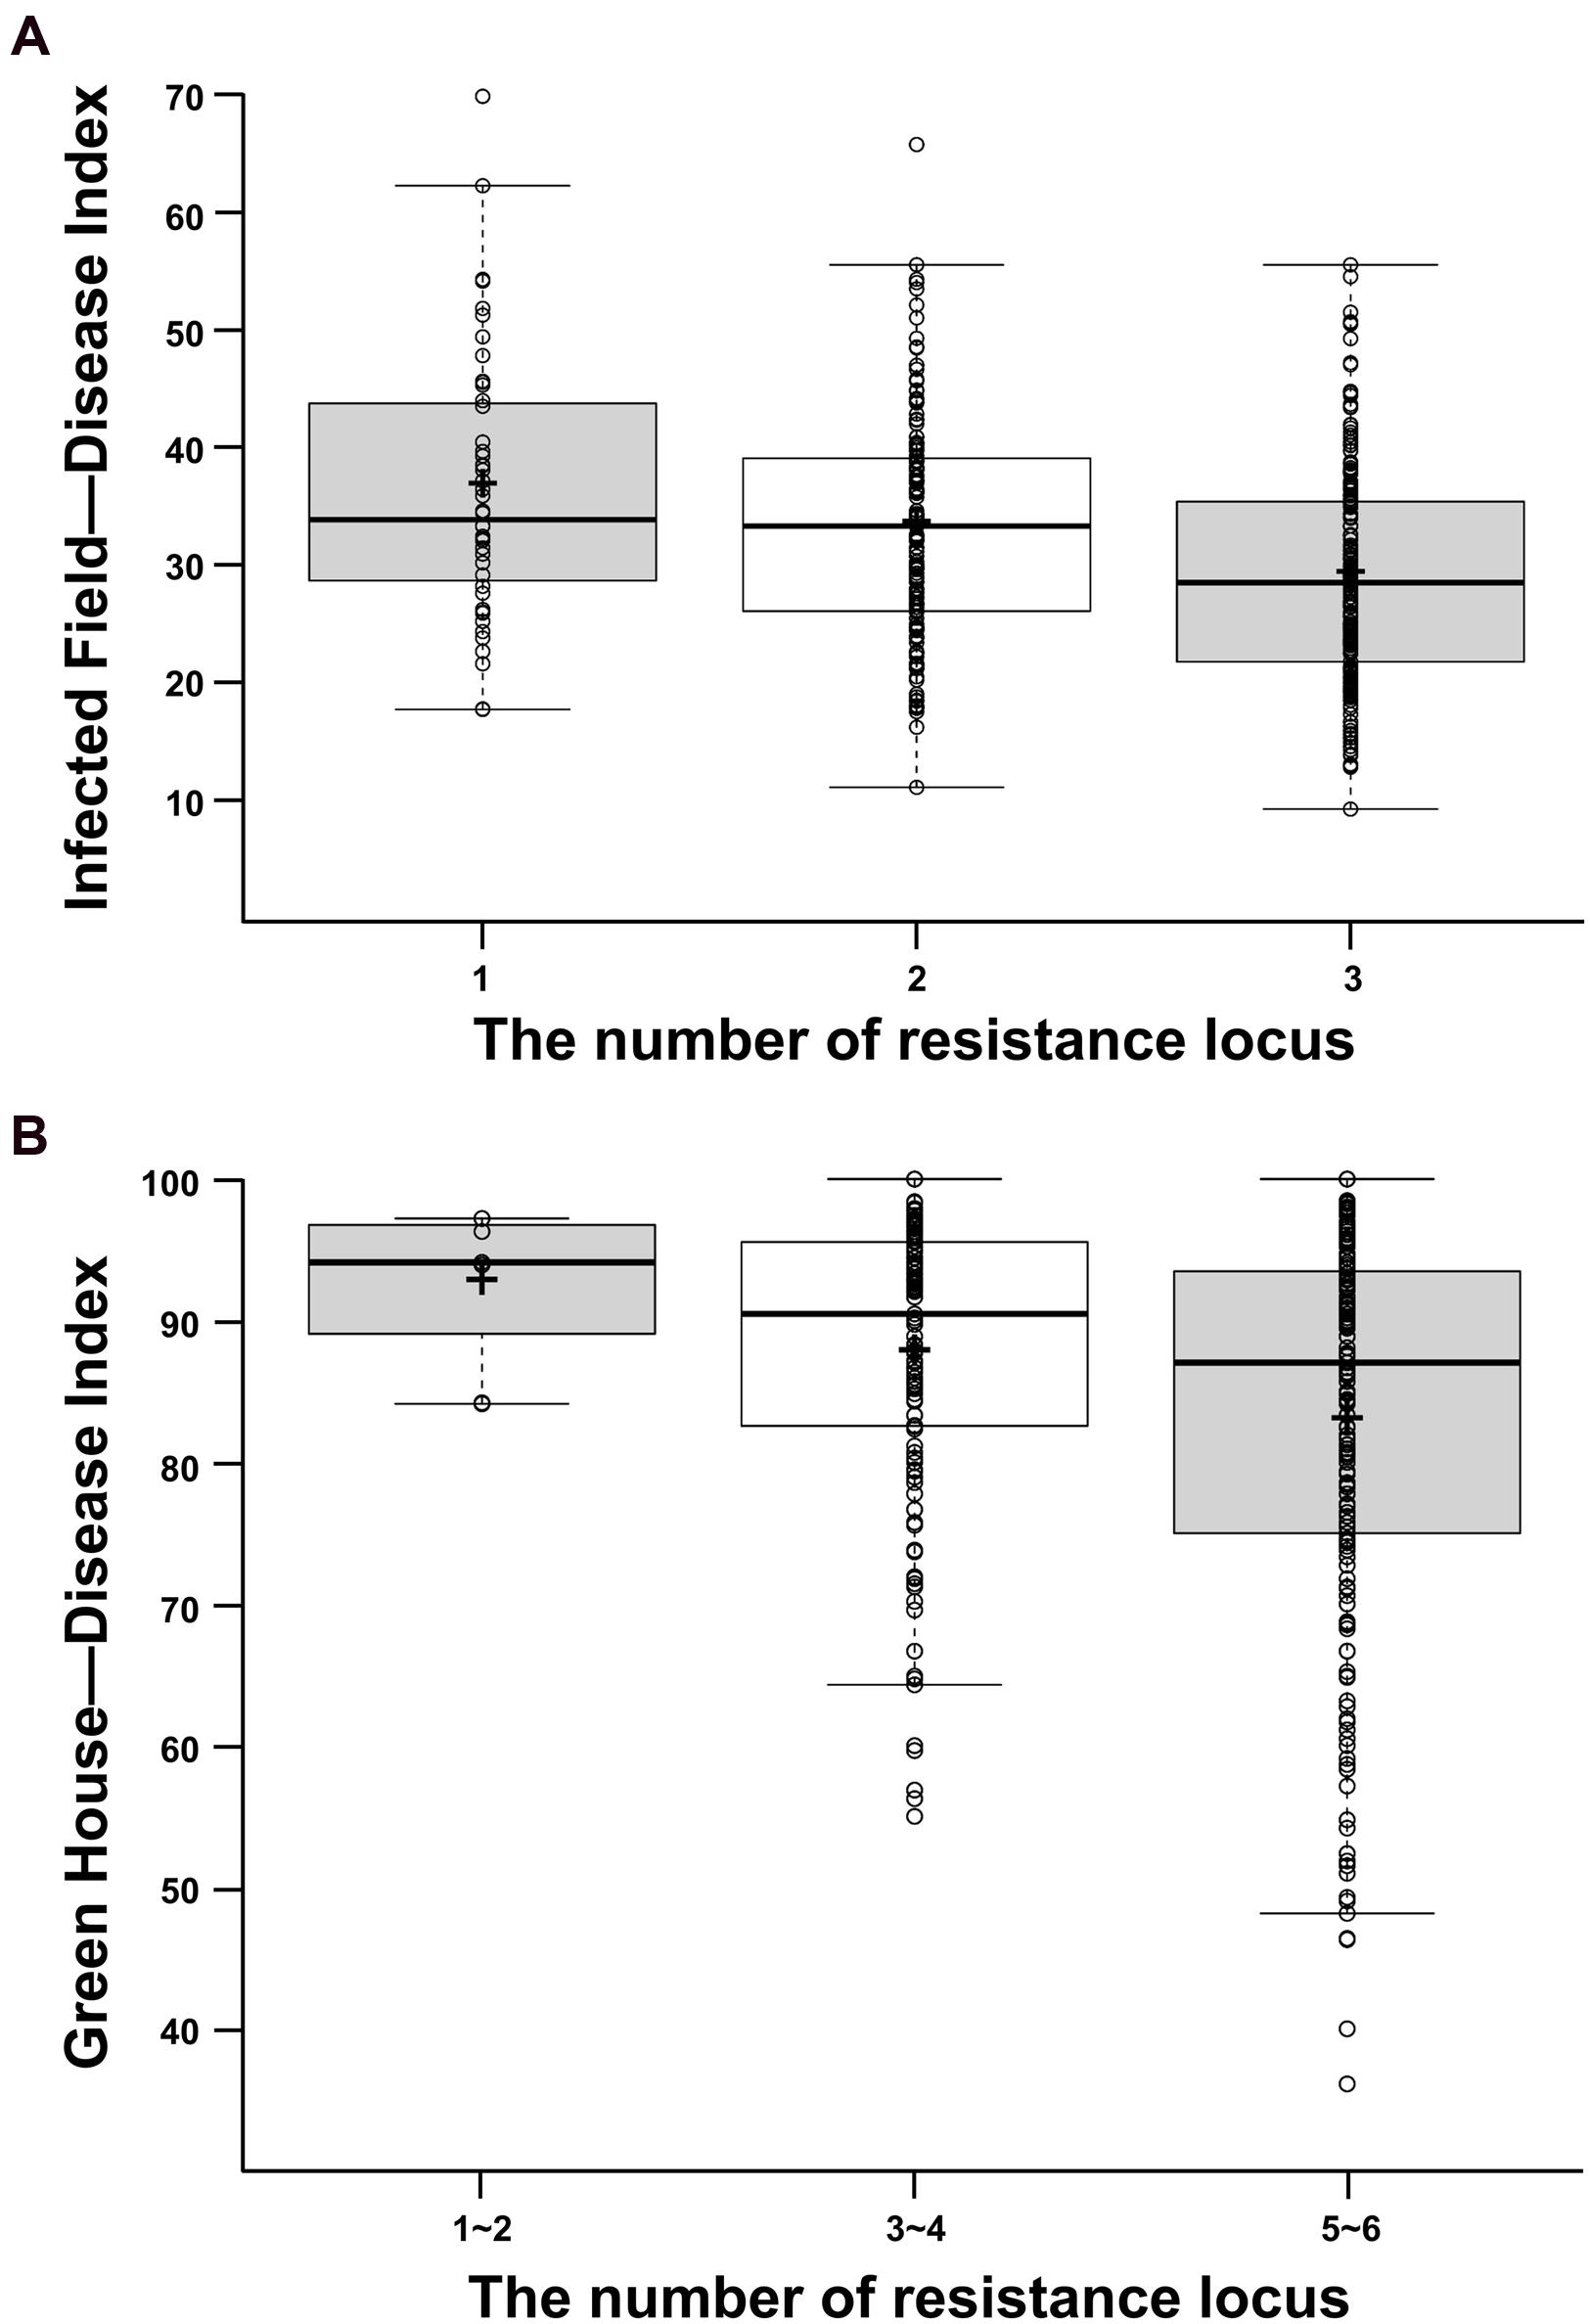
FIGURE 2. Box plot for DI in two environments. (A) Box plots for DI in IF. (B) Box plots for DI in GH. The middle line indicates the median, the plus sign shows the mean, the box represents the range of the 25th to 75th percentiles of the total data, the whiskers shows the interquartile range, the two line segments outside of the box indicates the boundary of normal value and the out dots means the outliers.
Integrative Analysis of CR Loci/Genes Revealed the Novel Loci Detected in this Study
To compare the GWAS results in this study with the previous reported CR QTLs/genes, the sequences of CR genes and markers of QTLs related to CR were collected in B. napus, B. rapa, and B. oleracea. And then the blastn or e-PCR with a threshold of 1E–10 was performed to B. napus reference genome (Darmor-bzh) to search their homoeologous regions in B. napus (Figure 3). In B. rapa, two homoeologous regions of CRa were identified on BnA03 (22,864,716–22,877,171 bp) and BnC07 (38,863,628–38,883,622 bp), respectively (Figure 3). Three homoeologous regions of Crr1 were found on BnA08 (9,456,084–9,467,947 bp), BnC03 (54,084,701–54,109,095), and BnC07 (38,863,628–38,869,983 bp), respectively (Figure 3). One homoeologous region of CRb was identified on BnA03 (21,682,961–22,238,961 bp). Two homoeologous regions of Rcr1 were found on BnA03 (22,797,049–23,009,129 bp) and BnC07 (36,229,328–39,036,510 bp) in B. napus. Homoeologous regions of other QTLs in B. rapa were not identified, because of their limited marker information or the physical positions of forward and reverse markers linked with the QTLs were not on the same chromosome in B. napus genome. Because of the limited reports on CR studies in B. oleracea, only three QTLs CRQTL-YC, CRQTL-GN_1, and CRQTL-GN_2 were searched. Two homoeologous regions of CRQTL-YC were identified on BnA03 and BnC03 respectively. Also, two homoeologous regions of CRQTL-GN_1 were detected on BnA02 (22,576,577–22,970,418 bp) and BnC02 (42,737,365–43,546,906 bp). And one homoeologous region of CRQTL-GN_2 was mapped on BnC03 (1,185,066–2,835,468 bp; Figure 3).
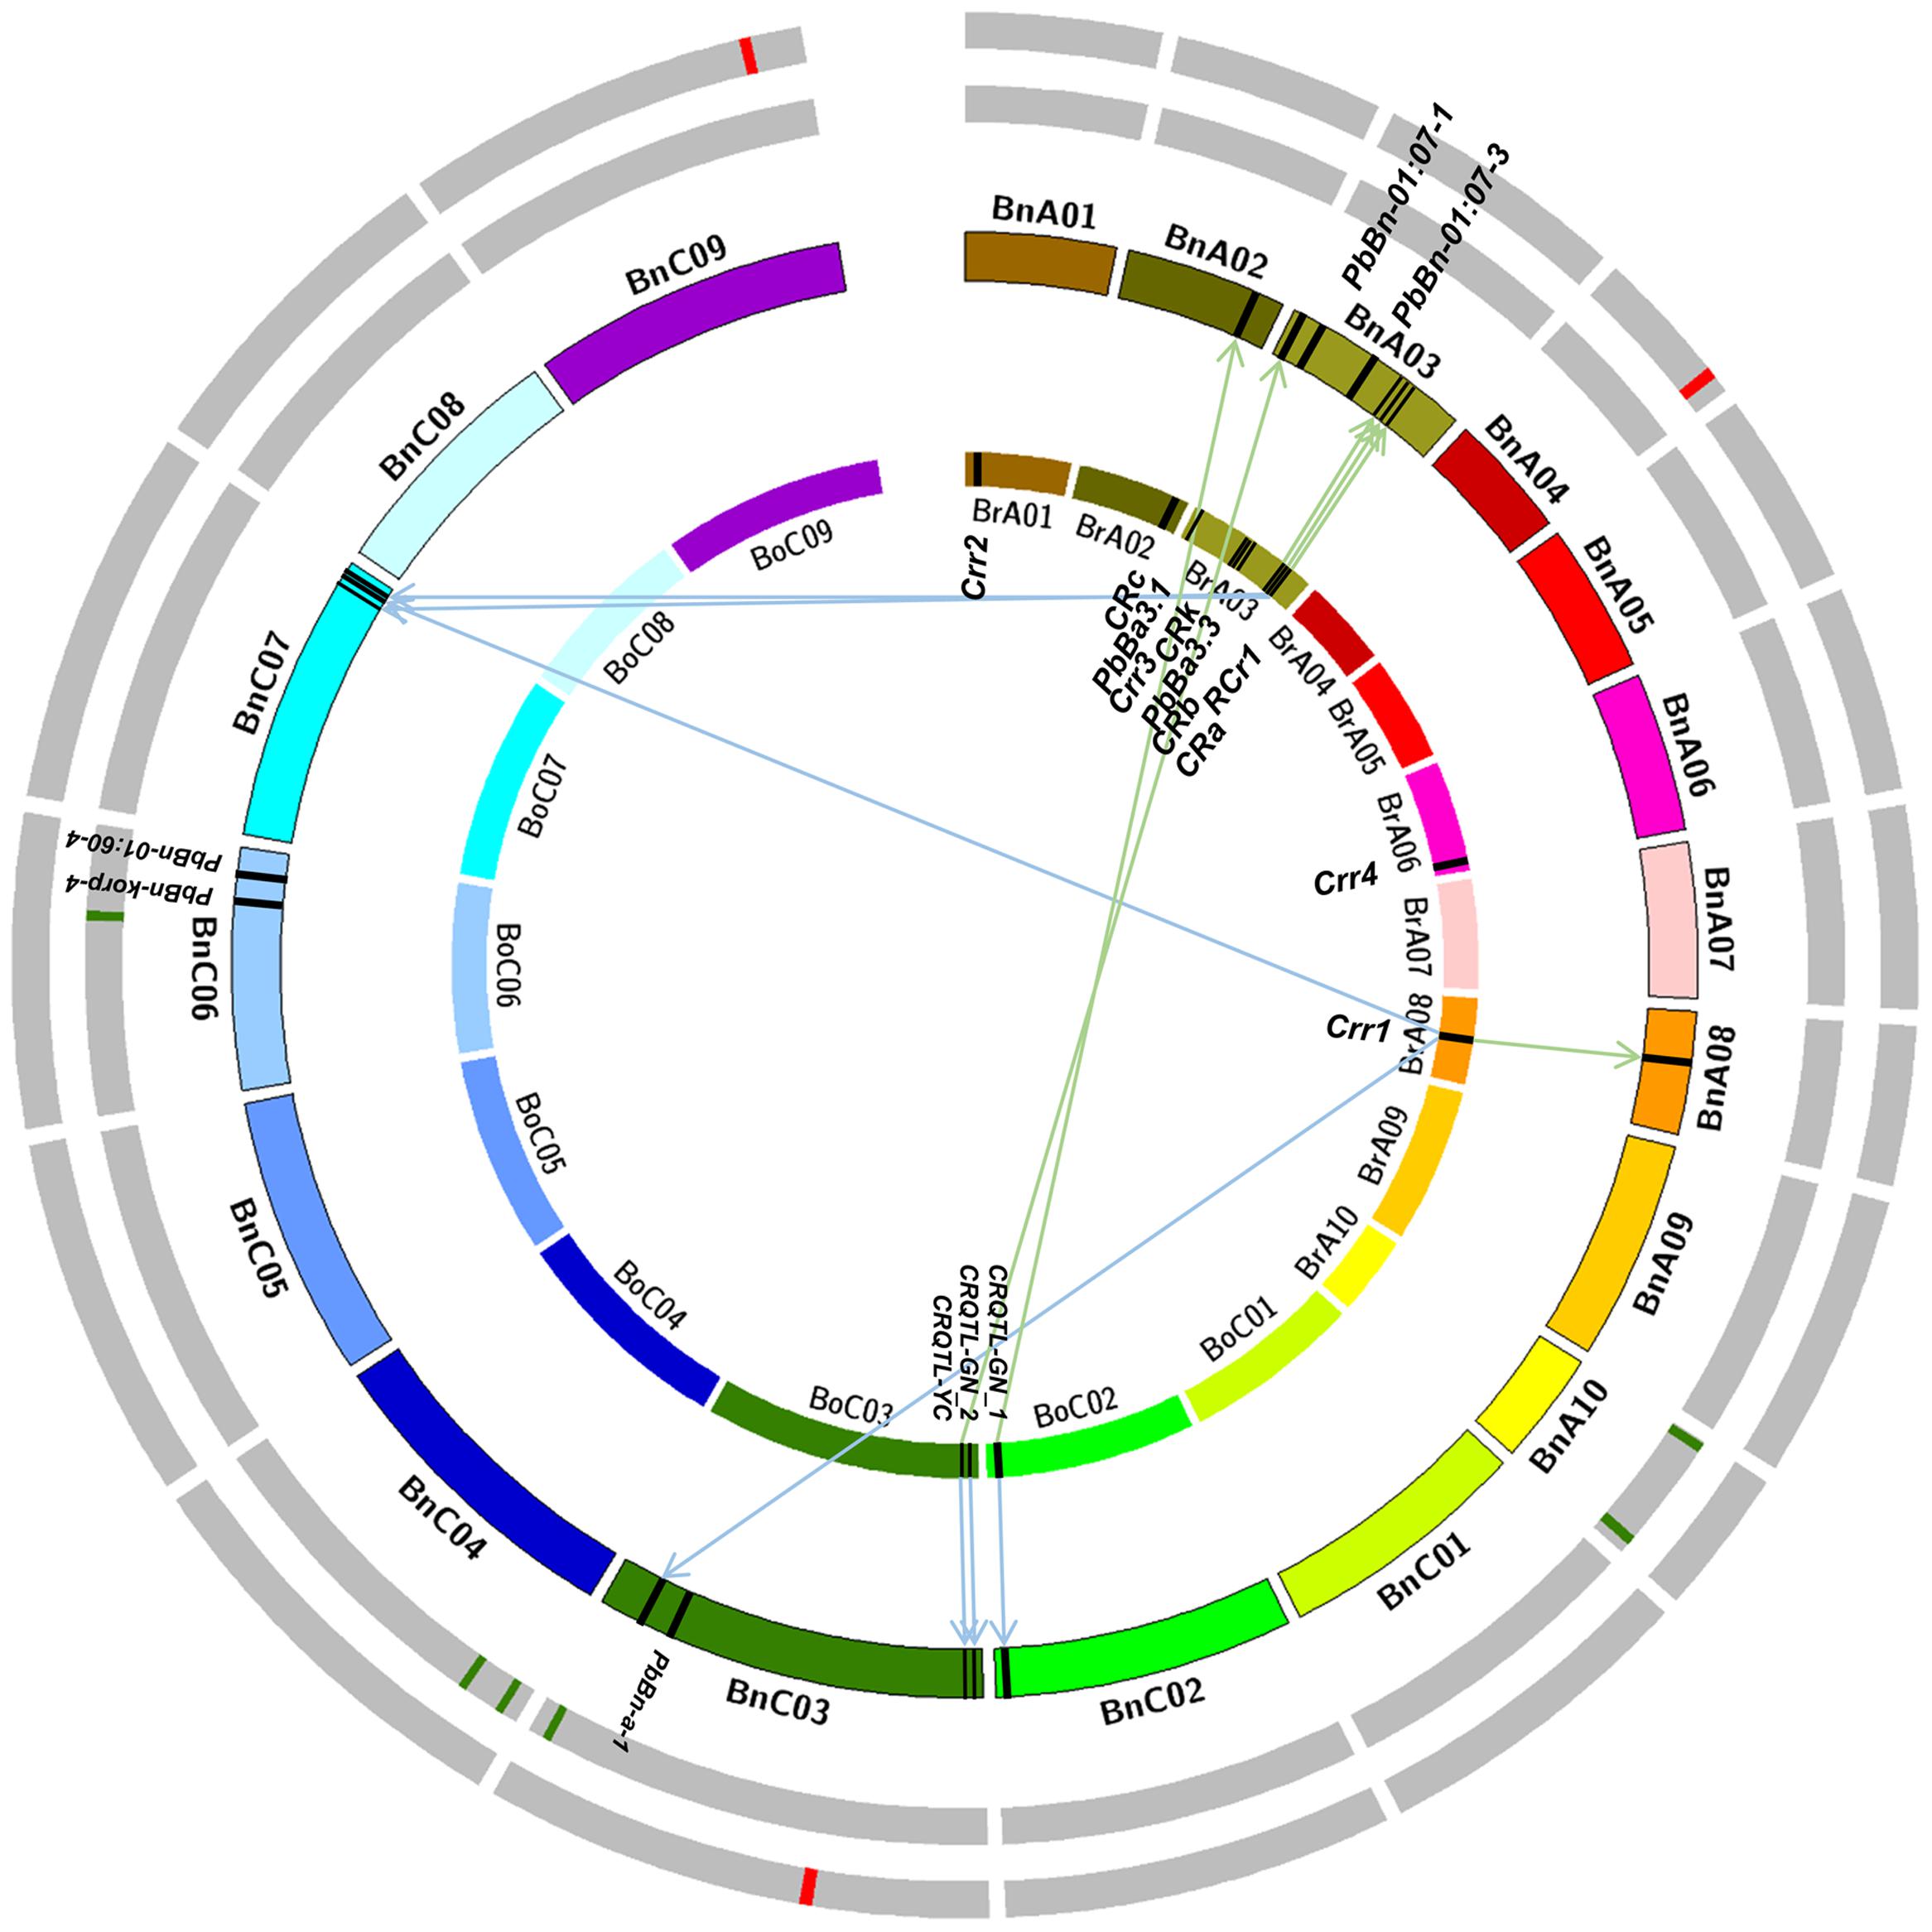
FIGURE 3. Integrative physical map of clubroot resistance (CR) sites based on the mapping results of the Brassica rapa, Brassica Oleracea, and Brassica napus. The right hand side of the innermost circle depicts the 10 chromosomes of B. rapa, the black square on that represents the CR loci identified in B. rapa; The left hand side of the innermost circle depicts the nine chromosomes of B. oleracea, the black squares on that represents the CR loci identified in B. oleracea. The second circle (from the innermost one) depicts the 19 chromosomes of B. napus, the black squares on that represents the CR loci which identified in previous reports in B. napus (without arrow) or the homoeologous regions (with arrow) of the black squares on the innermost circle. The green squares on the third circle represent the CR loci identified in greenhouse in this study. The red squares on the outermost circle represent the CR loci identified in infected field in this study.
Moreover, it was attempted to ensure the QTL physical position in B. napus according to the providing markers information in previous reports. Markers sequences of five QTLs reported on previous study in B. napus were searched and the physical position of PbBn-01:07-1 and PbBn-korp-4 were confirmed successfully. The physical positions of these two QTLs, BnA03 (5,386,730–5,386,845 bp) and BnC06 (27,067,129–27,067,246 bp), were proved to be accordance with the previous reports. However, the physical positions of other three QTLs were not accordance with the previous studies. For example, the QTL PbBn-a-1 located on BnA08 was mapped on BnC03, and the PbBn-01:07-3 located on BnC03 was mapped on BnA03 in this study (Figure 3).
It was found that the three QTLs identified in IF in our study were all novel, in which regions there were no homoeologous regions of CR QTLs reported in previous studies (Figure 3). The QTL SCR-C3 identified in GH was not located on the confidence intervals of one homoeolog of Crr1, but was close to it. We considered it as an old CR locus. The same situation was on SCR-C6, which closed to the physical position of PbBn-korp-4. The other four QTLs identified in this study were novel. So the GWAS had stronger ability to detect new loci on a given trait.
Prediction of the Candidate Genes of Identified CR QTLs by Bioinformatic Analyses
To predict the candidate genes of CR QTLs identified in this study, the candidate region (confidence interval) for each QTL was confirmed. There were 542 predicted genes in all nine candidate regions, 471 genes of which had functional annotations in total. To gain insights into the functionality of above genes, we performed GO enrichment analysis using Blast2GO (Conesa et al., 2005). The result showed that eight pathways of the molecular function related to ADP binding and methylthiopropyl-desulfoglucosinolate sulfotransferase activity were enriched (Supplementary Figure S4), the pathways of which were highly significant with TIR-NBS-LRR genes. It was interesting that two TIR-NBS gene clusters held 28 TIR-NBS genes which located in SCR-C6 (10 TIR-NBS genes) and MCR-C9 (18 TIR-NBS genes; Table 3) were participated in the function of ADP binding. The results indicated that the TIR-NBS gene family may associated with CR.
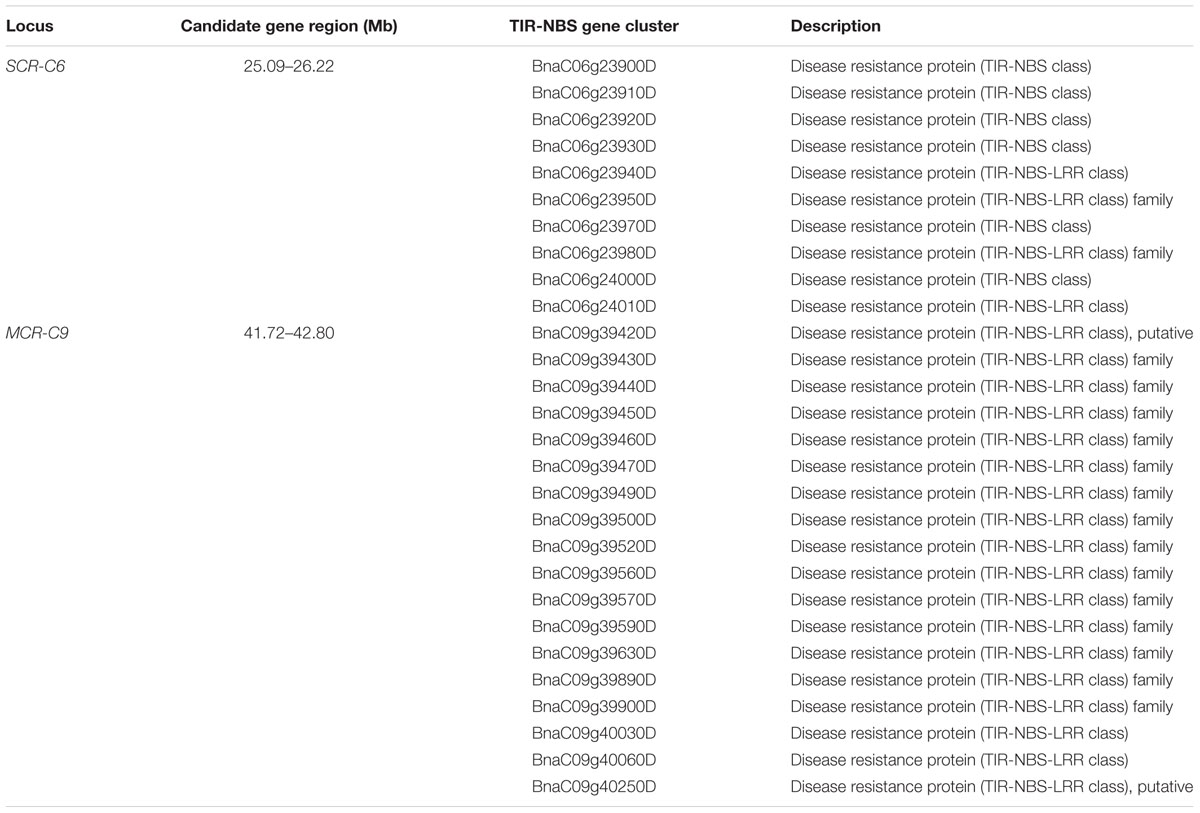
TABLE 3. The details of the TIR-NBS gene clusters in the candidate gene regions of SCR-C6 and MCR-C9.
In order to get more evidence to predict candidate genes, the homoeologous genes of DEGs from the transcriptome data after inoculation P. brassicae in B. rapa were identified in B. napus genome (Figure 4). For example, there were five SNPs involved in the MCR-C3 LD block, the candidate gene region was 21.72–21.92 Mb (194.6 Kb) in BnC03, where 44 genes were included, and four of which were the homoeologous genes of four DEGs identified in B. rapa (Figure 4A). Also, seven SNPs were involved in the LD block for SCR-C3, which the candidate region was 57.86–58.10 Mb (339.3 Kb) in BnC03, and 16 genes were predicted in this region. Only one homoeologous gene BnaC03g68270D of DEGs corresponding in B. rapa was searched (Figure 4A). Similarly, 9, 1, 2, 1, 6, 2, and 4 candidate genes obtained from the B. rapa homoeologous genes were identified in the candidate regions of MCR-A4, SCR-A10a, SCR-A10b, SCR-C4a, SCR-C4b, SCR-C6, and MCR-C9, respectively (Figure 4; Supplementary Table S2; Supplementary Figure S5). Overall, the 30 homoeologous genes of DEGs from B. rapa were likely candidate genes as these nine QTLs (Supplementary Table S2). However, the more evidence needs to be obtained by functional analysis of these genes.
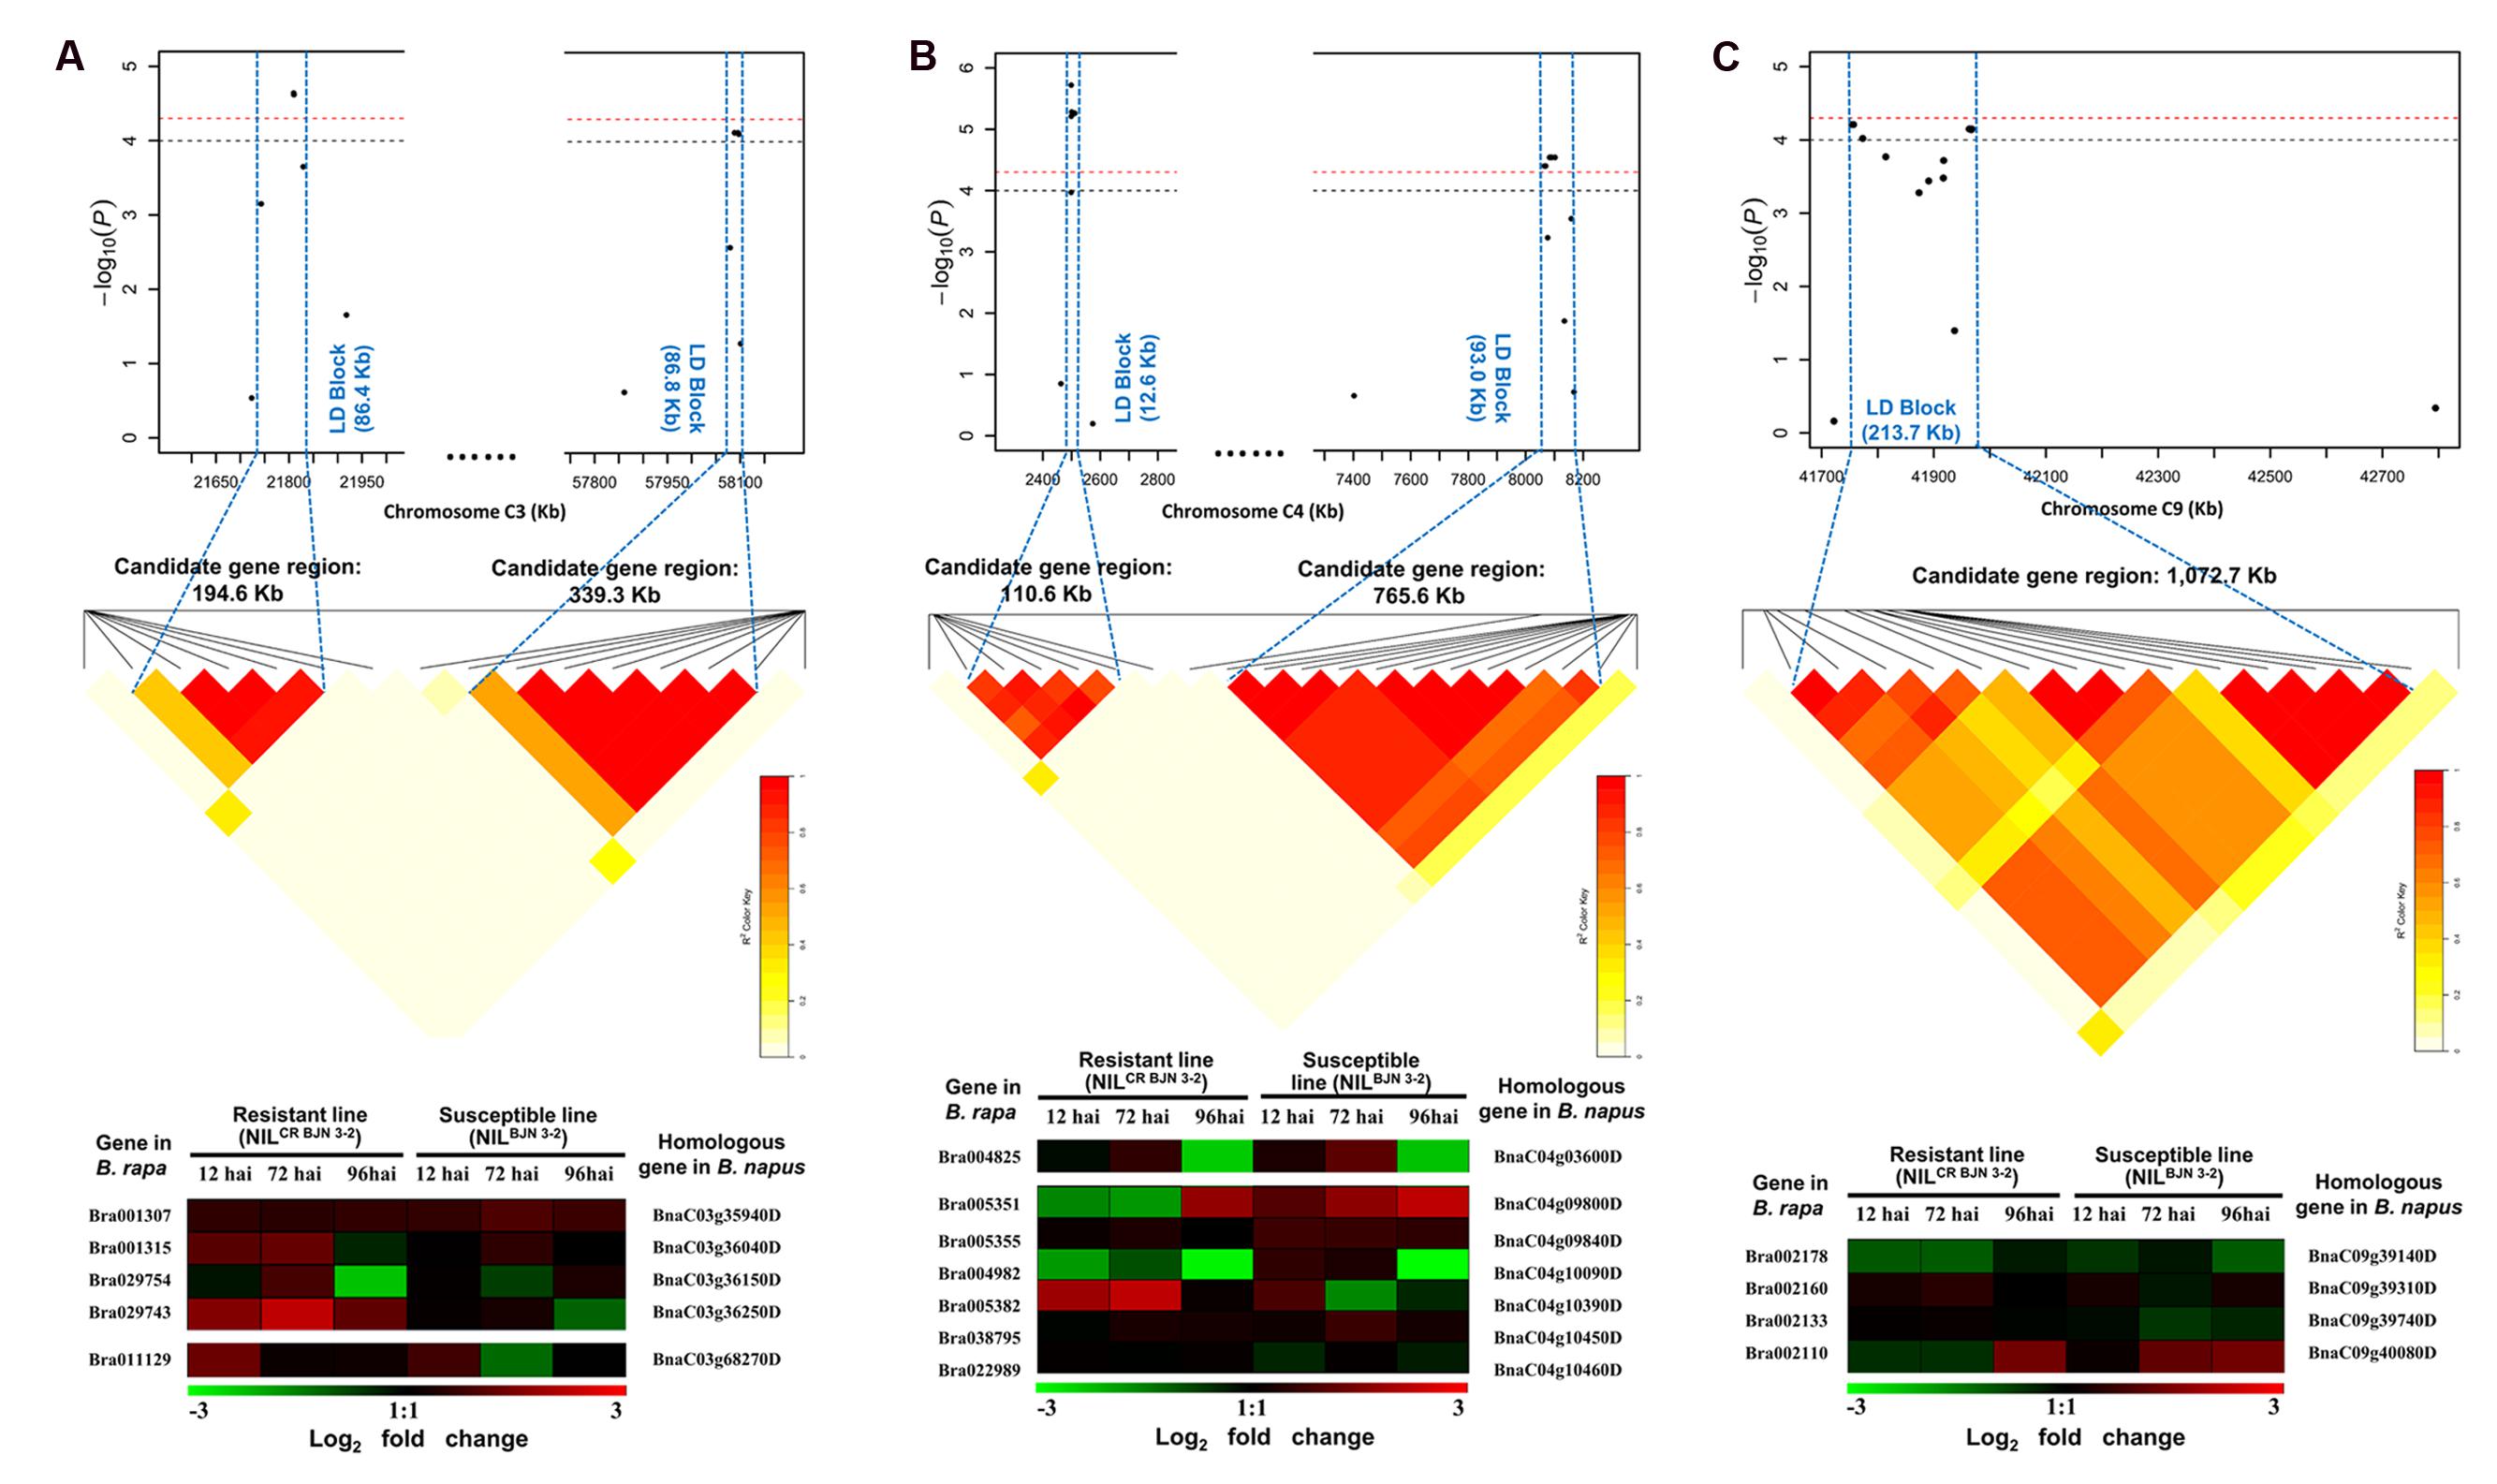
FIGURE 4. The candidate regions and predicting candidate genes for part of quantitative trait loci (QTL) identified in this study. (A) The candidate regions and predicting candidate genes for MCR-C3 and SCR-C3. (B) The candidate regions and predicting candidate genes for SCR-C4a and SCR-C4b. (C) The candidate regions and predicting candidate genes for MCR-C9. Haplotype block in strong LD (r2 > 0.4) with the most significant associated SNPs are shown between the blue dashed line. The chromosome region between the two flanking markers of the LD block is defined as candidate gene region for each QTL. Heat maps of the differentially expressed genes (DEGs) from transcriptome data of B. rapa, which were performed by Chen et al. (2015), the shade of color represent the log2 fold changes (inoculated/mock-inoculated) of the DEGs from B. rapa. The genes at the left of heat maps are the DEGs in B. rapa, and the genes at the right of heat maps are the homoeologous genes of DEGs from B. rapa in B. napus.
Discussion
Physiological Specialization of P. brassicae Played an Important Role in the Genetic Complexity of CR
The virulence of pathogen and resistance of host plant also changed along with the continuous game between them. There has been an abundant of research on characterizing the virulence of P. brassicae (Xue et al., 2008; Cao et al., 2009), and many races (pathotypes) have been identified by two identification system (Williams classification and European Clubroot Differential). At present, most CR resources identified in Brassica were pathotype specific. However, the resistance to single race controlled by single gene was unstable, which was continuously eroded by the pathogen’s adaptation. The above dynamics and instability made the genetic regulation of host plant became more complexity.
Until now, there is no certain conclusion about genetic regulation mode of CR. Genetic analysis showed that both qualitative and quantitative manners existed in the important Brassica crops due to the different resistant sources. In B. rapa, CR was controlled in a qualitative and quantitative manners both, whereas it was quantitative traits in B. oleracea (Piao et al., 2009; Lee et al., 2016). Genetic studies on CR of rapeseed were most based on the sources, of which the resistance derived from B. rapa (Zhang et al., 2015). Also, the inheritance of CR in rapeseed was governed by one or two single independent dominant genes (Piao et al., 2009). The difference of genetic regulation mode in CR among different species may be related to the various races. So enhancing the study to physiological race, including developing of new identification system, is the basis to perform intensive study.
The Results Can Give Some Constructive and Valuable Clues for Resistance Breeding in B. napus
There were three and six QTLs were identified in IF and GH, respectively (Table 2). But the same QTL between two environments were not detected, which may because that we performed the evaluation at the seedling stage in GH while at the harvest stage in IF. There were maybe different genetic mechanisms between vegetable stage and adult stage in rapeseed. It also gave us an ideal that it can improve the rapeseed CR both in vegetable stage and adult stage by polymerization of all identified CR loci/genes by MAS. The identified CR QTLs were showed additive effect (Figure 2), which provided theoretical basis for putting forward the resistant breeding strategy of polymerization of multiple loci, similarly. The SNPs detected in this study could be transformed to PCR markers (Yang et al., 2012), which could prove and consummate the method of screening the resistant germplasms resources and also provide strong and powerful measures for MAS. Meanwhile, we can pyramid different loci that resistant to different pathotypes for breeding to increase the resistant durability (Matsumoto et al., 2012; Tomita et al., 2013).
The results of integration of all the CR QTLs/genes on B. napus also gave us revelations that the closely relate species of B. napus (e.g., B. rapa, B. oleracea, and B. juncea) can be used for CR improvement through distant hybridization between these species (Figure 3). Therefore, we will have two approaches to improve the rapeseed CR. Firstly, all QTLs/genes which come from B. napus and closely relate species can be polymerized by MAS or interspecific hybridization (Yu et al., 2016); Secondly, we can get more resistant B. rapa and B. oleracea by MAS and phenotypic identification, and then the highly resistance rapeseed can be obtained by artificially synthesized (Diederichsen et al., 2006).
C-genome Might Have More Potential on CR Improvement than A-genome in B. napus
In this study, 6 of 9 identified QTLs were on C-genome, and most of them were novel, which illustrated that the C-genome (B. oleracea, B. carinata) had more potential on CR improvement (Figure 3). Researchers also found that there were more resistant loci in C-genome than A-genome of B. napus in the study of QTL mapping of resistance to Sclerotinia sclerotiorum (Wu et al., 2013; Wei et al., 2016). Wang et al. (2014) thought that breeding selection loci of C-genome were more than A-genome variation analysis of rapeseed core germplasms, which further verified that our research results had crucial contribution to resistant breeding in B. napus. Therefore, it is necessary for us to expand the resistance sources to discover more resistance genes/loci.
Integrate Analysis Revealed that the CR Hotspots Existed in Brassica
The CR QTL mapping results in B. rapa showed that 6 of 11 CR genes/QTLs were on BrA03, which indicated that there were CR hotspots existed in B. rapa. Until now, the genome sequences of B. rapa, B. oleracea, and B. napus have been sequenced which will accelerate their genetic improvements. All reported QTLs/loci information (linkage markers, candidate genes, and positions information) related to CR were collected in these three species (Figure 3). Most of the reported CR QTLs/genes were mapped on B. napus genome through bioinformatic analyses. The integration results illustrated the CR hotspots also existed in B. napus, which were the regions of BnA03 (21–23 Mb), BnC03 (1–2 Mb), and BnC07 (36–39 Mb; Figure 3). It was interesting that the top of BnA03 was homoeologous with the top of BnC03, and the bottom of BnA03 was homoeologous with the bottom of BnC07 (Chalhoub et al., 2014). Therefore, the evolution and origin of BnA03, and the genes related to disease-resistance on BnA03 are worth to deeply study. It was a pity that we did not detect any loci in the above hotspot regions of CR. The reason may be that the above hotspot regions were summarized from the population based on bi-parents in B. rapa. These hotspots may belong to rare variation sites which were difficult to detect in our natural population, or they were peculiar in B. rapa. Another reason maybe was that the previous mapping results were most aimed at the race/pathotype 3, the results of this study was based on the pathotype 4.
The Functional Annotation of Predicted Candidate Genes Provided Valuable Information for Understanding the Molecular Regulation of CR
So far, there were more than 70 R genes cloned from plants (Liu et al., 2007). Most of the cloned R genes were NBS-LRR family (Belkhadir et al., 2004; McHale et al., 2006). It was interesting that two R genes controlled CR in B. rapa were all TIR-NBS-LRR genes, which encoded large and abundant proteins involved in the detection of diverse pathogens. Similarly, the enrichment analysis also found eight pathways which were highly significant with TIR-NBS-LRR genes (Supplementary Figure S4), and there were two TIR-NBS gene clusters in our candidate regions (Table 3). NBS-LRR proteins could recognize the specialized pathogen effectors of ETI (also called avirulence proteins). Therefore, TIR-NBS-LRR gene family is most likely to play an important role in the process of the clubroot disease, which needs to deeply study in Brassica. Besides that, plant hormones, mainly salicylic acid (SA), jasmonic acid (JA), auxins and cytokinins, also played a role in compatible interactions between Arabidopsis and P. brassicae (Siemens et al., 2006; Lemarié et al., 2015). It also enlightens us on prediction candidate genes of above pathways and understanding the resistant molecular mechanism. Up to now, only one paper was reported on transcriptome analysis of CR in Brassica (Chen et al., 2015). It was a pity that two NILs of CRb were used for RNA-Seq in B. rapa, not two accessions or varieties. Therefore, these 30 candidate genes identified through the data from RNA-Seq in B. rapa just only provided clues for candidate genes prediction and understanding the molecular regulation of CR in B. napus. However, it needs to carry out more experiments to obtained more evidence to identify or evidence these candidate genes. For example, the RNA-Seq analysis can be carried out by using of some CR and susceptible lines from the natural population in this study.
Author Contributions
XW conceived the study. LL and XW designed the experiments. FL performed the genotyping of the association panel. LL, BC, and KX organized the implementation of field trials. LL, YL, FZ, HL, QH, XX, and TZ participated in the phenotyping of CR. LL and FL analyzed the data. LL and XW wrote the paper. YL, FL, JH, and XW participated in the modification of the manuscript. All the authors have read and approved the publication of the manuscript.
Funding
This work was supported by the National Key Program for Research and Development (2016YFD0100202), the Germplasm Resources Protection Project in China (2016NWB040), and the Scientific and Technological Support Program of Hubei Province (2015BBA189).
Conflict of Interest Statement
The authors declare that the research was conducted in the absence of any commercial or financial relationships that could be construed as a potential conflict of interest.
Acknowledgment
The authors are very grateful to Prof. Xiaoping Fang and Dr. Li Xu for providing pathogens for artificial inoculation.
Supplementary Material
The Supplementary Material for this article can be found online at: http://journal.frontiersin.org/article/10.3389/fpls.2016.01483
Footnotes
References
Belkhadir, Y., Subramaniam, R., and Dangl, J. L. (2004). Plant disease resistance protein signaling: NBS-LRR proteins and their partners. Curr. Opin. Plant Biol. 7, 391–399. doi: 10.1016/j.pbi.2004.05.009
Bent, A. F., and Mackey, D. (2007). Elicitors, effectors, and R genes: the new paradigm and a lifetime supply of questions. Annu. Rev. Phytopathol. 45, 399–436. doi: 10.1146/annurev.phyto.45.062806.094427
Bradbury, P. J., Zhang, Z., Kroon, D. E., Casstevens, T. M., Ramdoss, Y., and Buckler, E. S. (2007). TASSEL: software for association mapping of complex traits in diverse samples. Bioinformatics 23, 2633–2635. doi: 10.1093/bioinformatics/btm308
Buczacki, S., Toxopeus, H., Mattusch, P., Johnston, T., Dixon, G., and Hobolth, L. (1975). Study of physiologic specialization in Plasmodiophora brassicae: proposals for attempted rationalization through an international approach. Trans. Br. Mycol. Soc. 65, 295–303. doi: 10.1016/S0007-1536(75)80013-1
Cai, G., Yang, Q., Chen, H., Yang, Q., Zhang, C., Fan, C., et al. (2016). Genetic dissection of plant architecture and yield-related traits in Brassica napus. Sci. Rep. 6, 21625. doi: 10.1038/srep21625
Cao, T., Manolii, V. P., Strelkov, S. E., Hwang, S. F., and Howard, R. J. (2009). Virulence and spread of Plasmodiophora brassicae [clubroot] in Alberta, Canada. Can. J. Plant Pathol. 31, 321–329. doi: 10.1111/j.1364-3703.2011.00729.x
Chai, A. L., Xie, X. W., Shi, Y. X., and Li, B. J. (2014). Research status of clubroot (Plasmodiophora brassicae) on cruciferous crops in China. Can. J. Plant Pathol. 36, 142–153. doi: 10.1080/07060661.2013.868829
Chalhoub, B., Denoeud, F., Liu, S., Parkin, I. A., Tang, H., Wang, X., et al. (2014). Early allopolyploid evolution in the post-Neolithic Brassica napus oilseed genome. Science 345, 950–953. doi: 10.1126/science.1253435
Chen, J., Jing, J., Zhan, Z., Zhang, T., Zhang, C., and Piao, Z. (2013). Identification of novel QTLs for isolate-specific partial resistance to Plasmodiophora brassicae in Brassica rapa. PLoS ONE 8:e85307. doi: 10.1371/journal.pone.0085307
Chen, J., Pang, W., Chen, B., Zhang, C., and Piao, Z. (2015). Transcriptome analysis of Brassica rapa near-isogenic lines carrying clubroot-resistant and -susceptible alleles in response to Plasmodiophora brassicae during early infection. Front. Plant Sci. 6:1183. doi: 10.3389/fpls.2015.01183
Chu, M., Song, T., Falk, K. C., Zhang, X., Liu, X., Chang, A., et al. (2014). Fine mapping of Rcr1 and analyses of its effect on transcriptome patterns during infection by Plasmodiophora brassicae. BMC Genomics 15:1166. doi: 10.1186/1471-2164-15-1166
Conesa, A., Götz, S., García-Gómez, J. M., Terol, J., Talón, M., and Robles, M. (2005). Blast2GO: a universal tool for annotation, visualization and analysis in functional genomics research. Bioinformatics 21, 3674–3676. doi: 10.1093/bioinformatics/bti610
Diederichsen, E., Beckmann, J., Schondelmeier, J., and Dreyer, F. (2006). Genetics of clubroot resistance in Brassica napus ‘Mendel’. Acta Hortic. 706, 307–311. doi: 10.17660/ActaHortic.2006.706.35
Dixon, G. R. (2009). The occurrence and economic impact of Plasmodiophora brassicae and clubroot disease. J. Plant Growth Regul. 28, 194–202. doi: 10.1007/s00344-009-9090-y
Dobson, R. L., and Gabrielson, R. (1983). Role of primary and secondary zoospores of Plasmodiophora brassicae in the development of clubroot in Chinese cabbage. Phytopathology 73, 559–561. doi: 10.1094/Phyto-73-559
Engqvist, L. (1994). Distribution of clubroot (Plasmodiophora brassicae Wor) in Sweden and the effect of infection on oil content of oilseed rape (Brassica napus L.). Sver. Utsädesförenings Tidskr. 104, 82–86.
Fuchs, H., and Sacristán, M. D. (1996). Identification of a gene in Arabidopsis thaliana controlling resistance to clubroot (Plasmodiophora brassicae) and characterization of the resistance response. Mol. Plant Microbe Interact. 9, 91–97. doi: 10.1094/MPMI-9-0091
Grandclément, C., and Thomas, G. (1996). Detection and analysis of QTLs based on RAPD markers for polygenic resistance to Plasmodiophora brassicae Woron in Brassica oleracea L. Theor. Appl. Genet. 93, 86–90. doi: 10.1007/BF00225731
Harper, A. L., Trick, M., Higgins, J., Fraser, F., Clissold, L., Wells, R., et al. (2012). Associative transcriptomics of traits in the polyploid crop species Brassica napus. Nat. Biotechnol. 30, 798–802. doi: 10.1038/nbt.2302
Hatakeyama, K., Suwabe, K., Tomita, R. N., Kato, T., Nunome, T., Fukuoka, H., et al. (2013). Identification and characterization of Crr1a, a gene for resistance to clubroot disease (Plasmodiophora brassicae Woronin) in Brassica rapa L. PLoS ONE 8:e54745. doi: 10.1371/journal.pone.0054745
Hirai, M. (2006). Genetic analysis of clubroot resistance in Brassica crops. Breed. Sci. 56, 223–229. doi: 10.1270/jsbbs.56.223
Hirai, M., Harada, T., Kubo, N., Tsukada, M., Suwabe, K., and Matsumoto, S. (2004). A novel locus for clubroot resistance in Brassica rapa and its linkage markers. Theor. Appl. Genet. 108, 639–643. doi: 10.1007/s00122-003-1475-x
Honig, F. (1931). Der kohlkropferreger. (Plasmodiophora brassicae Wor.) Eine monographie. Gartenbauwissenschaft 5, 116–225.
Hwang, S. F., Strelkov, S. E., Feng, J., Gossen, B. D., and Howard, R. J. (2012). Plasmodiophora brassicae: a review of an emerging pathogen of the Canadian canola (Brassica napus) crop. Mol. Plant Pathol. 13, 105–113. doi: 10.1111/j.1364-3703.2011.00729.x
Jones, J. D., and Dangl, J. L. (2006). The plant immune system. Nature 444, 323–329. doi: 10.1038/nature05286
Jubault, M., Lariagon, C., Simon, M., Delourme, R., and Manzanares-Dauleux, M. J. (2008). Identification of quantitative trait loci controlling partial clubroot resistance in new mapping populations of Arabidopsis thaliana. Theor. Appl. Genet. 117, 191–202. doi: 10.1007/s00122-008-0765-8
Kato, T., Hatakeyama, K., Fukino, N., and Matsumoto, S. (2012). Identificaiton of a clubroot resistance locus conferring resistance to a Plasmodiophora brassicae classified into pathotype group 3 in Chinese cabbage (Brassica rapa L.). Breed. Sci. 62, 282–287. doi: 10.1270/jsbbs.62.282
Kato, T., Hatakeyama, K., Fukino, N., and Matsumoto, S. (2013). Fine mapping of the clubroot resistance gene CRb and development of a useful selectable marker in Brassica rapa. Breed. Sci. 63, 116–124. doi: 10.1270/jsbbs.63.116
Kowata-Dresch, L. S., and May-De Mio, L. L. (2012). Clubroot management of highly infested soils. Crop Prot. 35, 47–52. doi: 10.1016/j.cropro.2011.12.012
Kuginuki, Y., Yoshikawa, H., and Hirai, M. (1999). Variation in virulence of Plasmodiophora brassicae in Japan tested with clubroot-resistant cultivars of Chinese cabbage (Brassica rapa L. ssp. pekinensis). Eur. J. Plant Pathol. 105, 327–332. doi: 10.1023/A:1008705413127
Landry, B. S., Hubert, N., Crete, R., Chang, S., Lincoln, S. E., and Etoh, T. (1992). A genetic map for Brassica oleracea based on RFLP markers detected with expressed DNA sequences and mapping of resistance genes to race 2 of Plasmodiophora brassicae (Woronin). Genome 35, 409–420. doi: 10.1139/g92-061
Lee, J., Izzah, N. K., Choi, B. S., Joh, H. J., Lee, S. C., Perumal, S., et al. (2016). Genotyping-by-sequencing map permits identification of clubroot resistance QTLs and revision of the reference genome assembly in cabbage (Brassica oleracea L.). DNA Res. 23, 29–41. doi: 10.1093/dnares/dsv034
Lemarié, S., Robert-Seilaniantz, A., Lariagon, C., Lemoine, J., Marnet, N., Jubault, M., et al. (2015). Both the jasmonic acid and the salicylic acid pathways contribute to resistance to the biotrophic clubroot agent Plasmodiophora brassicae in Arabidopsis. Plant Cell Physiol. 56, 2158–2168. doi: 10.1093/pcp/pcv127
Li, F., Chen, B., Xu, K., Gao, G., Yan, G., Qiao, J., et al. (2016). A genome-wide association study of plant height and primary branch number in rapeseed (Brassica napus). Plant Sci. 242, 169–177. doi: 10.1016/j.plantsci.2015.05.012
Li, F., Chen, B., Xu, K., Wu, J., Song, W., Bancroft, I., et al. (2014). Genome-wide association study dissects the genetic architecture of seed weight and seed quality in rapeseed (Brassica napus L.). DNA Res. 21, 355–367. doi: 10.1093/dnares/dsu002
Li, L., Long, Y., Zhang, L., Dalton-Morgan, J., Batley, J., Yu, L., et al. (2015). Genome wide analysis of flowering time trait in multiple environments via high-throughput genotyping technique in Brassica napus L. PLoS ONE 10:e0119425. doi: 10.1371/journal.pone.0119425
Liu, J., Liu, X., Dai, L., and Wang, G. (2007). Recent progress in elucidating the structure, function and evolution of disease resistance genes in plants. J. Genet. Genomics 34, 765–776. doi: 10.1016/s1673-8527(07)60087-3
Liu, J., Wang, W., Mei, D., Wang, H., Fu, L., Liu, D., et al. (2016). Characterizing variation of branch angle and genome-wide association mapping in rapeseed (Brassica napus L.). Front. Plant Sci. 7:21. doi: 10.3389/fpls.2016.00021
Liu, S., Fan, C., Li, J., Cai, G., Yang, Q., Wu, J., et al. (2016). A genome-wide association study reveals novel elite allelic variations in seed oil content of Brassica napus. Theor. Appl. Genet. 129, 1203–1215. doi: 10.1007/s00122-016-2697-z
Liu, S., Liu, Y., Yang, X., Tong, C., Edwards, D., Parkin, I. A., et al. (2014). The Brassica oleracea genome reveals the asymmetrical evolution of polyploid genomes. Nat. Commun. 5:3930. doi: 10.1038/ncomms4930
Lu, G., Harper, A. L., Trick, M., Morgan, C., Fraser, F., O’Neill, C., et al. (2014). Associative transcriptomics study dissects the genetic architecture of seed glucosinolate content in Brassica napus. DNA Res. 21, 613–625. doi: 10.1093/dnares/dsu024
Manzanares-Dauleux, M. J., Delourme, R., Baron, F., and Thomas, G. (2000). Mapping of one major gene and of QTLs involved in resistance to clubroot in Brassica napus. Theor. Appl. Genet. 101, 885–891. doi: 10.1007/s001220051557
Matsumoto, E., Ueno, H., Aruga, D., Sakamoto, K., and Hayashida, N. (2012). Accumulation of three clubroot resistance genes through marker-assisted selection in Chinese cabbage (Brassica rapa ssp. pekinensis). J. Jpn. Soc. Hortic. Sci. 81, 184–190. doi: 10.2503/jjshs1.81.184
Matsumoto, E., Yasui, C., Ohi, M., and Tsukada, M. (1998). Linkage analysis of RFLP markers for clubroot resistance and pigmentation in Chinese cabbage (Brassica rapa ssp. pekinensis). Euphytica 104, 79–86. doi: 10.1023/A:1018370418201
McHale, L., Tan, X., Koehl, P., and Michelmore, R. W. (2006). Plant NBS-LRR proteins: adaptable guards. Genome Biol. 7:212. doi: 10.1186/gb-2006-7-4-212
Murray, M., and Thompson, W. F. (1980). Rapid isolation of high molecular weight plant DNA. Nucl. Acids Res. 8, 4321–4326. doi: 10.1093/nar/8.19.4321
Nagaharu, U. (1935). Genome analysis in Brassica with special reference to the experimental formation of B. napus and peculiar mode of fertilization. Jpn. J. Bot. 7, 389–452.
Nagaoka, T., Doullah, M. A., Matsumoto, S., Kawasaki, S., Ishikawa, T., Hori, H., et al. (2010). Identification of QTLs that control clubroot resistance in Brassica oleracea and comparative analysis of clubroot resistance genes between B. rapa and B. oleracea. Theor. Appl. Genet. 120, 1335–1346. doi: 10.1007/s00122-010-1259-z
Nordborg, M., and Weigel, D. (2008). Next-generation genetics in plants. Nature 456, 720–723. doi: 10.1038/nature07629
Pageau, D., Lajeunesse, J., and Lafond, J. (2006). Impact of clubroot [Plasmodiophora brassicae] on the yield and quality of canola. Can. J. Plant Pathol. 28, 137–143. doi: 10.1080/07060660609507280
Piao, Z., Ramchiary, N., and Lim, Y. P. (2009). Genetics of clubroot resistance in Brassica species. J. Plant Growth Regul. 28, 252–264. doi: 10.1007/s00344-009-9093-8
Piao, Z. Y., Deng, Y. Q., Choi, S. R., Park, Y. J., and Lim, Y. P. (2004). SCAR and CAPS mapping of CRb, a gene conferring resistance to Plasmodiophora brassicae in Chinese cabbage (Brassica rapa ssp. pekinensis). Theor. Appl. Genet. 108, 1458–1465. doi: 10.1007/s00122-003-1577-5
Rahman, H., Shakir, A., and Jakir, H. M. (2011). Breeding for clubroot resistant spring canola (Brassica napus L.) for the Canadian prairies: can the European winter canola cv. Mendel be used as a source of resistance? Can. J. Plant Sci. 91, 447–458. doi: 10.4141/cjps10073
Raman, H., Raman, R., Kilian, A., Detering, F., Carling, J., Coombes, N., et al. (2014). Genome-wide delineation of natural variation for pod shatter resistance in Brassica napus. PLoS ONE 9:e101673. doi: 10.1371/journal.pone.0101673
Ren, L., Jia, J., Li, M., Liu, F., Cheng, Y., Zhang, M., et al. (2012). Distribution of rapeseed clubroot disease in Hubei Province and evaluation of yield loss. Agric. Sci. Technol. 13, 775–777.
Rocherieux, J., Glory, P., Giboulot, A., Boury, S., Barbeyron, G., Thomas, G., et al. (2004). Isolate-specific and broad-spectrum QTLs are involved in the control of clubroot in Brassica oleracea. Theor. Appl. Genet. 108, 1555–1563. doi: 10.1007/s00122-003-1580-x
Saito, M., Kubo, N., Matsumoto, S., Suwabe, K., Tsukada, M., and Hirai, M. (2006). Fine mapping of the clubroot resistance gene, Crr3, in Brassica rapa. Theor. Appl. Genet. 114, 81–91. doi: 10.1007/s00122-006-0412-1
Sakamoto, K., Saito, A., Hayashida, N., Taguchi, G., and Matsumoto, E. (2008). Mapping of isolate-specific QTLs for clubroot resistance in Chinese cabbage (Brassica rapa L. ssp. pekinensis). Theor. Appl. Genet. 117, 759–767. doi: 10.1007/s00122-008-0817-0
Siemens, J., Keller, I., Sarx, J., Kunz, S., Schuller, A., Nagel, W., et al. (2006). Transcriptome analysis of Arabidopsis clubroots indicate a key role for cytokinins in disease development. Mol. Plant Microbe Interact. 19, 480–494. doi: 10.1094/MPMI-19-0480
Suwabe, K., Tsukazaki, H., Iketani, H., Hatakeyama, K., Fujimura, M., Nunome, T., et al. (2003). Identification of two loci for resistance to clubroot (Plasmodiophora brassicae Woronin) in Brassica rapa L. Theor. Appl. Genet. 107, 997–1002. doi: 10.1007/s00122-003-1309-x
Suwabe, K., Tsukazaki, H., Iketani, H., Hatakeyama, K., Kondo, M., Fujimura, M., et al. (2006). Simple sequence repeat-based comparative genomics between Brassica rapa and Arabidopsis thaliana: the genetic origin of clubroot resistance. Genetics 173, 309–319. doi: 10.1534/genetics.104.038968
Tewari, J. P., Strelkov, S. E., Orchard, D., Hartman, M., Lange, R. M., and Turkington, T. K. (2005). Identification of clubroot of crucifers on canola (Brassica napus) in Alberta. Can. J. Plant Pathol. 27, 143–144. doi: 10.1080/07060660509507206
Tomita, H., Shimizu, M., Doullah, M. A., Fujimoto, R., and Okazaki, K. (2013). Accumulation of quantitative trait loci conferring broadspectrum clubroot resistance in Brassica oleracea. Mol. Breed. 32, 889–900. doi: 10.1007/s11032-013-9918-9
Ueno, H., Matsumoto, E., Aruga, D., Kitagawa, S., Matsumura, H., and Hayashida, N. (2012). Molecular characterization of the CRa gene conferring clubroot resistance in Brassica rapa. Plant Mol. Biol. 80, 621–629. doi: 10.1007/s11103-012-9971-5
Voorrips, R. E., Jongerius, M. C., and Kanne, H. J. (1997). Mapping of two genes for resistance to clubroot (Plasmodiophora brassicae) in a population of doubled haploid lines of Brassica oleracea by means of RFLP and AFLP markers. Theor. Appl. Genet. 94, 75–82. doi: 10.1007/s001220050384
Wang, N., Li, F., Chen, B., Xu, K., Yan, G., Qiao, J., et al. (2014). Genome-wide investigation of genetic changes during modern breeding of Brassica napus. Theor. Appl. Genet. 127, 1817–1829. doi: 10.1007/s00122-014-2343-6
Wang, X., Wang, H., Wang, J., Sun, R., Wu, J., Liu, S., et al. (2011). The genome of the mesopolyploid crop species Brassica rapa. Nat. Genet. 43, 1035–1039. doi: 10.1038/ng.919
Wei, L., Jian, H., Lu, K., Filardo, F., Yin, N., Liu, L., et al. (2016). Genome-wide association analysis and differential expression analysis of resistance to Sclerotinia stem rot in Brassica napus. Plant Biotechnol. J. 14, 1368–1380. doi: 10.1111/pbi.12501
Werner, S., Diederichsen, E., Frauen, M., Schondelmaier, J., and Jung, C. (2008). Genetic mapping of clubroot resistance genes in oilseed rape. Theor. Appl. Genet. 116, 363–372. doi: 10.1007/s00122-007-0674-2
Williams, P. H. (1966). A system for the determination of races of Plasmodiophora brassicae that infect Cabbage and Rutabaga. Phytopathology 56, 624–626.
Wu, J., Cai, G., Tu, J., Li, L., Liu, S., Luo, X., et al. (2013). Identification of QTLs for resistance to Sclerotinia stem rot and BnaC.IGMT5.a as a candidate gene of the major resistant QTL SRC6 in Brassica napus. PLoS ONE 8:e67740. doi: 10.1371/journal.pone.0067740
Wu, J., Zhao, Q., Yang, Q., Liu, H., Li, Q., Yi, X., et al. (2016). Comparative transcriptomic analysis uncovers the complex genetic network for resistance to Sclerotinia sclerotiorum in Brassica napus. Sci. Rep. 6:19007. doi: 10.1038/srep19007
Xu, L., Hu, K., Zhang, Z., Guan, C., Chen, S., Hua, W., et al. (2016). Genome-wide association study reveals the genetic architecture of flowering time in rapeseed (Brassica napus L.). DNA Res. 23, 43–52. doi: 10.1093/dnares/dsv035
Xue, S., Cao, T., Howard, R. J., Hwang, S. F., and Strelkov, S. E. (2008). Isolation and variation in virulence of single-spore isolates of Plasmodiophora brassicae from Canada. Plant Dis. 92, 456–462. doi: 10.1094/pdis-92-3-0456
Yang, Q., Fan, C., Guo, Z., Qin, J., Wu, J., Li, Q., et al. (2012). Identification of FAD2 and FAD3 genes in Brassica napus genome and development of allele-specific markers for high oleic and low linolenic acid contents. Theor. Appl. Genet. 125, 715–729. doi: 10.1007/s00122-012-1863-1
Yu, F., Zhang, X., Huang, Z., Chu, M., Song, T., Falk, K. C., et al. (2016). Identification of genome-wide variants and discovery of variants associated with Brassica rapa clubroot resistance gene Rcr1 through bulked segregant RNA sequencing. PLoS ONE 11:e0153218. doi: 10.1371/journal.pone.0153218
Zhang, H., Feng, J., Hwang, S. F., Strelkov, S. E., Falak, I., Huang, X., et al. (2015). Mapping of clubroot (Plasmodiophora brassicae) resistance in canola (Brassica napus). Plant Pathol. 65, 435–440. doi: 10.1111/ppa.12422
Keywords: Brassica napus L., Plasmodiophora brassicae, clubroot resistance, genome wide association study, candidate gene prediction
Citation: Li L, Luo Y, Chen B, Xu K, Zhang F, Li H, Huang Q, Xiao X, Zhang T, Hu J, Li F and Wu X (2016) A Genome-Wide Association Study Reveals New Loci for Resistance to Clubroot Disease in Brassica napus. Front. Plant Sci. 7:1483. doi: 10.3389/fpls.2016.01483
Received: 08 August 2016; Accepted: 20 September 2016;
Published: 30 September 2016.
Edited by:
Maoteng Li, Huazhong University of Science and Technology, ChinaReviewed by:
Zhongyun Piao, Shenyang Agricultural University, ChinaChunyu Zhang, Huazhong Agricultural University, China
Copyright © 2016 Li, Luo, Chen, Xu, Zhang, Li, Huang, Xiao, Zhang, Hu, Li and Wu. This is an open-access article distributed under the terms of the Creative Commons Attribution License (CC BY). The use, distribution or reproduction in other forums is permitted, provided the original author(s) or licensor are credited and that the original publication in this journal is cited, in accordance with accepted academic practice. No use, distribution or reproduction is permitted which does not comply with these terms.
*Correspondence: Xiaoming Wu, wuxm@oilcrops.cn