 Harsh Raman1*Rosy Raman1Neil Coombes1Jie Song2Simon Diffey3
 Andrzej Kilian2Kurt Lindbeck1Denise M. Barbulescu4
 Jacqueline Batley5David Edwards5,6Phil A. Salisbury4,7Steve Marcroft8
- 1Graham Centre for Agricultural Innovation (an alliance between NSW Department of Primary Industries and Charles Sturt University), Wagga Wagga Agricultural Institute, Wagga Wagga, NSW, Australia
- 2Diversity Array Technology P/L, University of Canberra, Canberra, ACT, Australia
- 3Centre for Bioinformatics and Biometrics, University of Wollongong, Wollongong, NSW, Australia
- 4Department of Economic Development, Jobs, Transport and Resources, Horsham, VIC, Australia
- 5School of Plant Biology, University of Western Australia, Crawley, WA, Australia
- 6Institute of Agriculture, University of Western Australia, Crawley, WA, Australia
- 7Faculty of Veterinary and Agricultural Sciences, The University of Melbourne, Parkville, VIC, Australia
- 8Marcroft Grains Pathology, Horsham, VIC, Australia
Key message “We identified both quantitative and quantitative resistance loci to Leptosphaeria maculans, a fungal pathogen, causing blackleg disease in canola. Several genome-wide significant associations were detected at known and new loci for blackleg resistance. We further validated statistically significant associations in four genetic mapping populations, demonstrating that GWAS marker loci are indeed associated with resistance to L. maculans. One of the novel loci identified for the first time, Rlm12, conveys adult plant resistance in canola.” Blackleg, caused by Leptosphaeria maculans, is a significant disease which affects the sustainable production of canola (Brassica napus). This study reports a genome-wide association study based on 18,804 polymorphic SNPs to identify loci associated with qualitative and quantitative resistance to L. maculans. Genomic regions delimited with 694 significant SNP markers, that are associated with resistance evaluated using 12 single spore isolates and pathotypes from four canola stubble were identified. Several significant associations were detected at known disease resistance loci including in the vicinity of recently cloned Rlm2/LepR3 genes, and at new loci on chromosomes A01/C01, A02/C02, A03/C03, A05/C05, A06, A08, and A09. In addition, we validated statistically significant associations on A01, A07, and A10 in four genetic mapping populations, demonstrating that GWAS marker loci are indeed associated with resistance to L. maculans. One of the novel loci identified for the first time, Rlm12, conveys adult plant resistance and mapped within 13.2 kb from Arabidopsis R gene of TIR-NBS class. We showed that resistance loci are located in the vicinity of R genes of Arabidopsis thaliana and Brassica napus on the sequenced genome of B. napus cv. Darmor-bzh. Significantly associated SNP markers provide a valuable tool to enrich germplasm for favorable alleles in order to improve the level of resistance to L. maculans in canola.
Introduction
Blackleg disease, caused by the hemibiotrophic fungal pathogen Leptosphaeria maculans (Desm.) Ces. et de Not. is a major threat to the consistent global supply of canola (Brassica napus L). Canola is sown as a spring crop in the North Americas, winter crop in Europe and autumn crop in Australasia, and contributes approximately 14% of world vegetable oil production (USDA, 2016). Blackleg affects canola plants at various stages of plant development (GS10 to GS80), from cotyledon emergence to pod-filling growth stages. Under severe epiphytotic conditions, L. maculans can completely kill the young susceptible seedlings and cause catastrophic yield loss (Marcroft et al., 2002; Fitt et al., 2006).
Two types of resistance to L. maculans; qualitative and quantitative, have been reported in B. napus (Delourme et al., 2006). Qualitative resistance mediated by an effector–triggered immunity (ETI) mechanism relies on specific interaction between a race-specific R protein and corresponding avirulent (Avr) protein; also known as the gene-for-gene interaction (Flor, 1971). B. napus resistant genotypes do not kill this apoplastic pathogen but limit its biomass and asexual and sexual sporulation (Huang et al., 2006a; Stotz et al., 2014). Eighteen qualitative (R) genes for ETI have been identified in Brassica species; B. rapa, B. juncea, B. napus, and B. nigra and several of them are deployed in commercial canola varieties (Delourme et al., 2011; Marcroft et al., 2012; Balesdent et al., 2013; Larkan et al., 2013, 2015; Raman et al., 2013b). Intensive cultivation of broad-acre varieties carrying specific R genes results in the emergence of new virulent (avr) races and rapid change in the frequency of existing avirulence (Avr) alleles in natural populations of L. maculans. As a consequence, some R genes have become ineffective just within 5 years of their commercial release (Brun et al., 2000; Howlett et al., 2001; Li et al., 2003; Rouxel et al., 2003; Sprague et al., 2006; Van de Wouw et al., 2014).
Quantitative resistance (race non-specific) mediated by pattern–triggered immunity (PTI) mechanism via pathogen associated molecular patterns (Young, 1996; Dangl and Jones, 2001) does not effectively control blackleg disease at the seedling stage, but restrict the development of canker formation in mature stems (Delourme et al., 2006). However, knowledge of loci, including their uniqueness in controlling quantitative resistance under different environment conditions is rather limited in B. napus germplasm (Delourme et al., 2006; Huang et al., 2009; Kaur et al., 2009; Jestin et al., 2011; Raman et al., 2012). Australia has the most diverse population of L. maculans compared to other canola growing countries (Hayden et al., 2007) but host–pathogen interaction under the Australian environment is poorly understood due to G × E interactions and highly heterogeneous populations of L. maculans across canola growing regions. Understanding the genetic bases of resistance to L. maculans among diverse canola varieties will allow canola breeders to produce elite varieties with durable resistance, and design blackleg management strategies to achieve a high yield to meet the demand of a growing human population.
Both linkage and genome-wide association mapping (Flint-Garcia et al., 2003; Jannink, 2007) has been used simultaneously to unravel loci and candidate genes associated with resistance to L. maculans and for other traits of agricultural significance in canola (Raman et al., 2013a; Cai et al., 2014; Fopa Fomeju et al., 2014; Li et al., 2014; Raman H. et al., 2016; Raman R. et al., 2016; Wang et al., 2016). Single spore isolates (SSI) have been extensively utilized to map and characterize loci involved in resistance to L. maculans. However, the majority of individual isolates representing the Australian differential set have multiple Avr genes (Marcroft et al., 2012). These isolates could be used to identify and validate molecular marker loci for resistance in diverse canola accessions, e.g., GWAS panels, rather than following extremely laborious, low-resolution mapping of bi-parental populations. Several disease resistance genes have been identified in canola and in Arabidopsis – L. maculans pathosystem (Staal et al., 2006, 2008; Staal and Dixelius, 2008; Persson et al., 2009; Larkan et al., 2013, 2015) and would provide insights on the genetic architecture of qualitative and quantitative resistance loci in canola.
We determine the extent of genetic variation in resistance to L. maculans utilizing a panel of 179 diverse accessions of canola (Raman H. et al., 2016) and reveal genetic loci for race-specific and race non-specific resistance using a GWA strategy. We identified at least 503 markers associated with qualitative and quantitative resistance to L. maculans under the glasshouse and greenhouse experiments. We then validated the genome-wide SNP associations using linkage analyses of four doubled haploid (DH) populations derived from AG-Castle∗3/Westar-10 (Rlm3), BLN2762/Surpass400 (Rlm4, LepR3), Maxol∗3/Westar-10 (Rlm1 and Rlm3) and Skipton/Ag-Spectrum (Rlm4 and Rlm12). We further locate the physical map positions of the significant genomic regions on the B. napus sequenced genome, associated with resistance in relation to the candidate genes implicated in effector-triggered immunity in Arabidopsis and B. napus. Our work demonstrates the usefulness of GWAS in the discovery of new putative resistance loci to L. maculans, including reporting the Rlm12 locus for the first time.
Materials and Methods
Evaluation of Diverse Accessions and DH Lines with SSI
A diverse GWAS panel of 179 accessions of B. napus (Raman H. et al., 2016) was evaluated for resistance to 12 SSI (04MGPS021, 06MGPP041, D8, D9, IBCN13, IBCN15, IBCN16, IBCN17, IBCN18, IBCN75, IBCN76, and PHW1223) of L. maculans (Marcroft et al., 2012; Raman R. et al., 2013) at the Wagga Wagga Agricultural Institute. Details of Avr gene profiles of the SSI were described previously (Marcroft et al., 2012; Zander et al., 2013). Plants were grown in a randomized block designs generated using the software package DiGGer (Coombes, 2002) to randomize genotypes to tray blocks and spatially arrange genotypes within trays. For glasshouse experiments, seedlings were raised in plastic trays (7 × 8 cells) and inoculated as described previously in Raman et al. (2012).
Two replicates of 188 selfed diverse lines were arranged in a 4 row by 94 column array in the glasshouse. Two benches, each holding a replicate, had 4 rows of 47 trays, with each tray holding a row of 8 entries, and each experimental unit in the tray comprising a column of 7 seedlings. After 17–20 days from inoculation, cotyledons were scored on the basis of lesion size for the resistance or susceptibility using a scale between 0 (for highly resistance) to 9 (highly susceptible) (Raman et al., 2012).
In order to assess whether genetic variation for resistance expressed at the cotyledon stage is still effective at the adult plant stage (physiological maturity), five random plants (after the initial cotyledon scores) from each of the 12 SSI evaluations were transplanted in white plastic pots (10 cm diameter) according to a statistical design under greenhouse conditions and were raised till maturity. All plants were cut with secateurs at the crown and assessed for internal infection on a 0 to 100 scale based on per cent area showing necrosis (Raman et al., 2012). We also verified the accuracy of the visual assessment of crown canker lesions after infection with isolate 04MGPS021 which has been extensively used in previous studies (Raman et al., 2012; Zander et al., 2013; Raman et al., in review) by comparing visual scoring with ‘digitized’ internal infection score. The crowns of cut plants were first scored using the blackleg rating scale (0 to 100), and then photographed with a digital camera (Canon EOS 450D). Acquired digital images were measured for discolouration (black/brown areas) using the software1 ‘Image J’.
Evaluation of Diverse Lines with Pathotypes from Stubbles
In order to mimic field evaluation of germplasm and to reduce genotype × environment interaction, we tested the GWAS diversity panel and a backcross DH population from SAgSDH (Raman R. et al., 2016) with pathotypes from stubble using the ‘ascospore shower’ test (Huang et al., 2006b) under glasshouse conditions. Canola stubble from commercial crops of AV-Garnet (MT Hope, South Australia), CB-Jardee HT (Frances, South Australia), Monola76TT (Bool Lagoon, SA, Australia), and ATR-Cobbler (Wagga, NSW, Australia) grown in the 2011 cropping season was used. Sexual spores from pseudothecia were released from each stubble source and sprayed individually with distilled water. Plants inoculated with four different stubble sources were maintained at 100% relative humidity in growth room maintained at 18°C for 96 h and then transferred to greenhouse conditions. A GWAS diversity set was grown using a randomized complete block design with two replications. Each accession was grown in pots with the consistent plant density (4). Inoculated plants were assessed for per cent internal infection at physiological maturity.
The predicted means of disease scores for each genotype were used to determine the extent of genetic variation for resistance to L. maculans and to detect genome-wide trait-marker associations. Broad sense heritability was estimated for DH lines in each experiment (isolate/ascopsore shower test) using a method described previously (Cullis et al., 2006).
Genome-wide Association Analysis
A set of 18,804 single nucleotide polymorphism (SNP) and presence-absence markers with allele frequency >0.05 and call rate >80% was used for identification of trait-marker associations using the Emma/P3D method (Kang, 2008; Zhang et al., 2010; Raman H. et al., 2016) implemented in the R package Genome Association and Prediction Integrated Tool (Lipka et al., 2012). We used principal components (Price, 2006) and relative kinship coefficients (VanRaden, 2008) to reduce spurious associations between trait and markers as described in Raman H. et al. (2016). Genome-wide associations between markers and resistance to L. maculans was initially tested at p < 0.001. In order to reduce the chance of false positives, we used a Bonferroni correction based on a Type I error rate of 0.05. A stringent Bonferroni correction was calculated as described previously (Li et al., 2014) by dividing 0.05 by the total number of markers 18804 used for the GWAS analysis. Highly significant association between DArTseq markers and resistance to L. maculans was ‘declared’ when p < 2.66 × 10⁻⁶ or -log10(p) > 5.57. The -log10(p) values for each SNP were exported to generate a Manhattan plot.
Validation of Race-specific and Race Non-specific Resistance Loci
The associations detected through GWAS, were compared against the quantitative trait locus (QTL) marker intervals associated with resistance to L. maculans in DH mapping populations (94 to 186 lines) derived from (SASDH (Raman et al., 2012), BSDH (Raman R. et al., unpublished), and Maxol∗1/Westar-10 MWDH (Raman R. et al., 2013). Conventional microarray DArT, and SSR markers, which showed linkage with the Rlm1 locus for resistance to L. maculans in a DH population from MWDH (Raman R. et al., 2013) were further integrated with DArTseq markers mapped on 1518 loci (this study). In addition, we mapped two DH populations derived from Ag-Castle∗3/Westar-10 (AWDH) and Skipton/Ag-Spectrum//Skipton (SAgSDH).
(i) Mapping of the Rlm12 Locus in the SAgS Population.
The SAgSDH population comprising 146 lines was evaluated for resistance with the ‘ascospore shower’ test as described above. Mixed stubble was sourced from the current Australian canola cultivars: CrusherTT, CB-Telfer, ATR-Stingray, Hyola50, Brassica juncea, and ThumperTT. An incomplete block design, where trays on benches comprise incomplete blocks, was used. Three replicates of 146 DH lines and 42 entries of two parents were arranged in a 20 row by 24 column array in the glasshouse. Seeds were sown in plastic pots accommodating four plants/DH line.
The linkage map of SAgS DH population comprising 7716 DArTseq markers on 508 discrete loci on the 19 chromosomes of B. napus (Raman R. et al., 2016) was used to determine the genetic basis of resistance to L. maculans pathotypes derived from mixed stubble. QTL analysis for resistance was performed using the three step procedures as outlined previously (Raman R. et al., 2016). A log-likelihood (LOD) score threshold of 2.0 was used to identify genomic regions associated with resistance to L. maculans.
(ii) Mapping of the Rlm3 Locus in the AWDH Population.
Parental lines AG-Castle∗3 and Westar-10, along with R gene control lines (Westar, AV-Garnet, Surpass400, Caiman, ThunderTT, and Mustang), were characterized for their Avr profiles using a set of differential SSI of L. maculans. All 80 DH lines from AWDH, along with the parental lines were evaluated for the resistance or susceptibility to IBCN76 (AvrLm1, AvrLm3, AvrLm5, AvrLm6, AvrLm8, AvrLepR1, AvrLepR3, AvrLepR4), as described previously (Raman et al., 2012). Trays were arranged in a 4 row by 6 column array with replicates in a 2 row by 6 column array. Each tray held a row of 8 genotypes with each genotype being a column of seven plants. Genotypes were randomized to tray blocks and spatially arranged within trays using the DiGGer software (Coombes, 2002). GWAS associations linked with Rlm3 were confirmed by selective genotyping of 23 resistant and 23 susceptible lines from the set of 80 DH derived from AWDH with 17,887 polymorphic DArTseq markers (Raman et al., 2014b). Of these, 13,296 DArTseq markers which had an overall call rate over 80% and reproducibility over 95% were used for linear marker regression in SVS package2.
Statistical Analysis of Phenotyping Data
Disease scores collected from the different experiments were analyzed using linear mixed models with the statistical software package ASReml-R (Butler et al., 2009), which fits the linear mixed model using REML, within the R (R Development Core Team, 2014) computing environment. Internal infection on the crowns was recorded as percent infected area; logarithmic transformation was applied on data to normalize the residual variance and then used for QTL analysis. Predicted means were used to identify loci associated with resistance in the AWDH population using linear marker regression. The order of markers which were found to be significantly associated with resistance evaluated quantitatively (0–9 scores for cotyledon resistance and 0 to 100% for crown canker lesion) and ‘binned’ for resistance (‘A’ for resistance or ‘B’ for susceptibility), was determined in ‘Record’ (van Os et al., 2006) and with the FLAPJack software3.
Prediction of Candidate Genes
A total of 128 R genes in Arabidopsis thaliana were retrieved from the TAIR4 and NCBI databases5. Physical map positions of 425 nucleotide binding site leucine rich repeat (NBS-LRR) encoding R gene homologs in B. napus were retrieved from the Genoscope6. These genes were predicted on the basis of Motif Alignment Search Tool E (≤-24) and tBLASTn and BLASTp values (1E-5) in B. napus sequence (Chalhoub et al., 2014). In order to obtain the physical map positions of Arabidopsis R genes, sequences were searched for their identities with the reference B. napus genome (Chalhoub et al., 2014) using BLAT function in B. napus Genome browser2. Only hits which showed high alignment scores (≥100) were considered to identify ‘candidate genes’ for resistance to L. maculans. We further searched potential candidate genes based on collinearity which were predicted in the vicinity of significant association that appeared both in GWAS and DH populations. LD decay that was estimated (r2 = 0.24 Mb) for the B. napus accessions was used for the identification of candidate genes (Raman H. et al., 2016).
Results
Genetic Variation for Resistance to L. maculans
We determined the genetic resistance of 179 diverse accessions to 12 SSI of L. maculans at the seedling (cotyledon) stage. Across different experiments, we found extensive variation in resistance as lesion development ranged from 0 to 8.5 (Figure 1A; Supplementary Table S1). The majority of accessions were susceptible (cotyledon lesion scores >3) to different isolates (Figure 1A). Disease scores based on both visual and digitized score using isolate 04MGPS021 were highly positively correlated (R2 = 0.99, Supplementary Figure S1). To test the relationship between expression of resistance at both the seedling and adult plant stages, we compared cotyledon lesion and crown canker scores of 179 accessions of B. napus inoculated with 12 different isolates. Our results showed that resistance expressed at the cotyledon stage and in the crown canker was not always highly correlated; Pearson’s product-moment correlation coefficient ranged from 0.03 to 0.76 (Supplementary Table S2; Figure 1B), suggesting that some lines of the GWAS panel may have loci for adult plant and/or quantitative resistance.
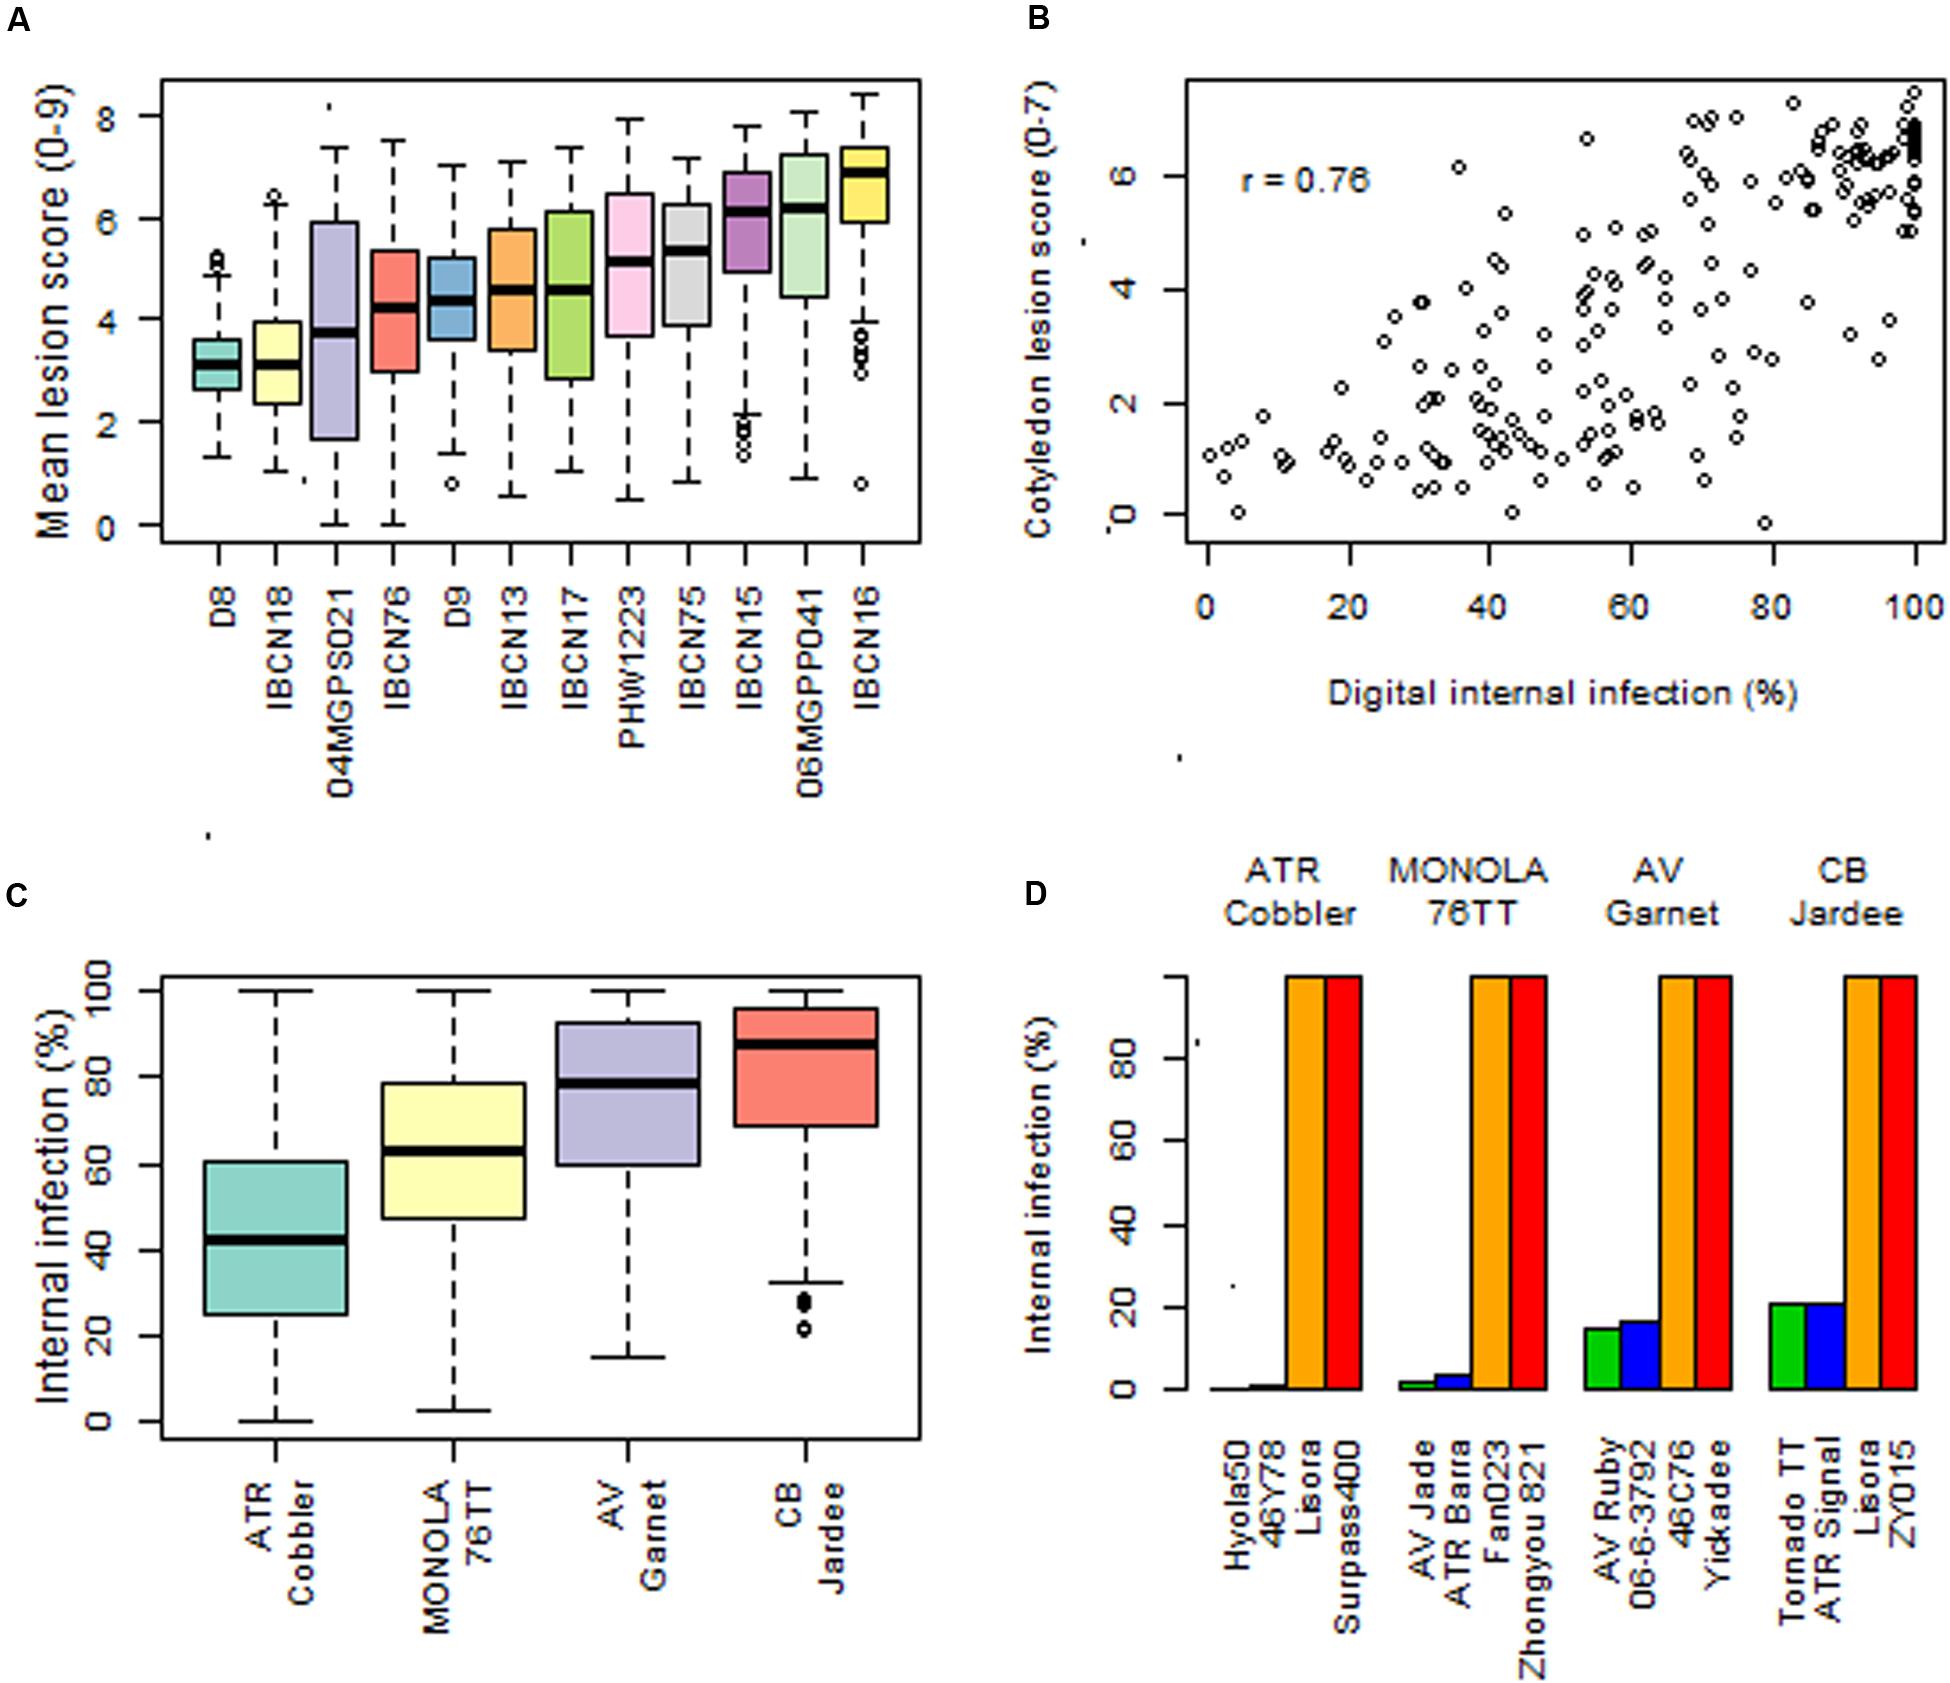
FIGURE 1. Natural variation for resistance to Leptosphaeria maculans. (A) Box-plots showing genetic variation for race-specific resistance to 12 SSIs in a diverse panel of 179 genotypes of Brassica under the glasshouse conditions. (B) Scatter graph showing relationship between cotyledon lesion and digital internal canker infection scores assessed under field conditions (C) Genetic variation for resistance evaluated at the adult plant stage using ascospore shower test in a diverse panel of 179 genotypes of canola under greenhouse conditions. Black bars represent median values and the colored boxes represent the range of variation in resistance and the error bars represent the outliers. (D) Promising canola genotypes which showed good level of resistance against pathotypes present on stubbles collected from the contemporary Australian canola varieties.
In order to identify adult plant/quantitative resistance the GWAS panel was evaluated with four stubble sources collected from the commercial Australian canola cultivars AV-Garnet (Rlm1), ATR-Cobbler (Rlm4, Rlm9), CB-JardeeHT (Rlm2), and Monola76TT (LepR3/Rlm1). Our result showed that the majority of genotypes were susceptible to pathotypes especially present on stubble derived from AV-Garnet, CB-JardeeHT and Monola76TT (Supplementary Table S1; Figure 1C), suggesting that the R genes; Rlm1, Rlm2, Rlm4, Rlm9, and LepR3 were no longer effective in conferring resistance to L. maculans. This study also revealed that some of the Australian cultivars carrying R genes, such as AV-Jade, ATR-Signal, AV-Ruby, 46Y78, TornadoTT, and ThunderTT were resistant to pathotypes present on at least three stubble sources (Supplementary Table S1; Figure ID). Several other accessions, such as Ag-Comet and StormTT, had a low level of disease. Our phenotyping experiments (SSI and ascospore shower test) showed that some genotypes in GWAS diversity panel may harbor quantitative resistance to Australian pathotypes of L. maculans.
GWAS Detected ‘Known’ and ‘Novel’ Loci for Resistance to L. maculans
Genetic architecture of loci involved in resistance to L. maculans at both seedling and adult plant stage was dissected using GWAS by implementing a mixed model algorithm. The number of significant associations varied from 94 to 600 depending on the source of inoculum (600 with SSI, and 94 with pathotypes on four stubble sources (Supplementary Table S3). Manhattan plots of the significant associations detected with all 12 SSI are presented in Supplementary Figure S2.
(i) Natural Variation in Resistance to 12 Isolates of L. maculans at the Cotyledon Stage in a GWAS Panel.
The number of significant SNP associations varied from six with isolate D8 (AvrLm5, AvrLm7, AvrLepR1, AvrLepr4) to 237 with isolate PHW1223 (AvrLm5, AvrLm6, AvrLm8, AvrLm9, AvrLepR1, AvrLepR3, AvrLepR4) (Supplementary Table S3). Significant SNP loci accounted for 2.82 to 10.85% of total genetic variation for resistance to different isolates (Supplementary Table S3). For 04MGPS021, we detected 36 significant associations [at the genome-wide significance thresholds of a -log10(p) ≥ 3] on chromosomes A03, A04, A06, A07, A10, C02, C06, C08, and C09. Significant loci on homoeologous chromosomes A07/C06 accounted for a total of 35.31% of genetic variation in resistance (Supplementary Table S3).
Of 600 significant SNP associations for resistance to L. maculans, 76 were detected repeatedly across multiple isolates (Supplementary Table S3). These associations were detected with the SNPs that were localized at the same physical positions on the reference B. napus genome. In addition, several SNP markers which were in linkage disequilibrium (within 200 kb); estimated in a previous study (Raman H. et al., 2016) exhibited statistically significant association with resistance, suggesting that these markers could be used to trace introgression of favorable QTL alleles in canola breeding programs. Six markers (delimited with 5149488| 55:T > G, and 5030408| 14:C > T) localized within a 200 kb region on A07 (coordinates: 15778332–15923268 on the reference B. napus genome v 4.1), associated with Rlm4 that was previously identified (Raman et al., 2012, 2014a) were detected across both subpopulations.
Our previous study showed that the GWAS panel used herein does have population structure which can highly affect the trait-marker associations for quantitative traits such as flowering time and response to vernalisation. In order to ascertain whether the population structure has any effect on detection of SNP associations (Raman H. et al., 2016) for qualitative traits, e.g., resistance to isolate 04MGPS021, we performed GWAS in individual subpopulations (I & II) and compared the GWAS results (Supplementary Figure S3). Subpopulations III and IV were very small in size (n = 8 to 11), therefore those were not suitable for GWAS. In subpopulation I (109 genotypes), 26 significant SNP associations (p value up to 1.54E-6) were detected on chromosomes A02, A07, A09, C02, C04, C06, and C09; of which eight were localized on homoeologous chromosomes A02/C02 and eleven on A07/C06. In subpopulation II (43 genotypes), 14 associations were detected on chromosomes A03, A05, A07, A10, C01, C03, C05, C06, and C07. Of them, six DArTSeq SNPs (one on A07, and five on C06) were present in LD estimated (r2 = 0.24 Mb) in B. napus accessions (Raman H. et al., 2016) used in this study. None of the markers on homoeologous chromosomes A02/C02; as detected in subpopulation-I, showed significant association with resistance in subpopulation-II, suggesting that subpopulation structure has profound effect on the identification of trait-marker associations.
(ii) Natural Variation in Resistance to L. maculans Evaluated with Ascospore Shower Test at the Adult Plant Stage.
We revealed 94 statistically significant associations for resistance to L. maculans, scored as per cent internal canker infection on all B. napus chromosomes with the exception of A02 and C01 (Supplementary Table S3; Figures 2A–D). The number of SNPs for resistance detected with GWAS varied from 12 (with pathotypes present on stubble of AV-Garnet) to 45 (with pathotypes present on CB-JardeeHT stubble) (Supplementary Table S3). Significant associations for resistance to pathotypes on AV-Garnet stubble were detected on chromosomes A01, A03, A07, CO2, and unassembled contigs of the CnCn subgenome (ChrCnn_random) on the pseudomolecule of B. napus (Supplementary Table S3; Figure 2B). The maximum genotypic variance (10.5%) was explained by marker 3099564:16:T > C (-log10(p) = 5.95 × 10⁻⁶) mapped on chromosome A01. Forty five significant genomic regions for resistance to pathotypes on CB-JardeeHT stubble were identified on A01, A03, A05, A07, A08, A09, A10, C03, C04, C05, C07, C08, and C09 (Figure 2C). However, only four genomic regions on A06, and C09 revealed consistent associations with resistance to at least two stubble sources (Supplementary Table S3; Figures 2C–D).
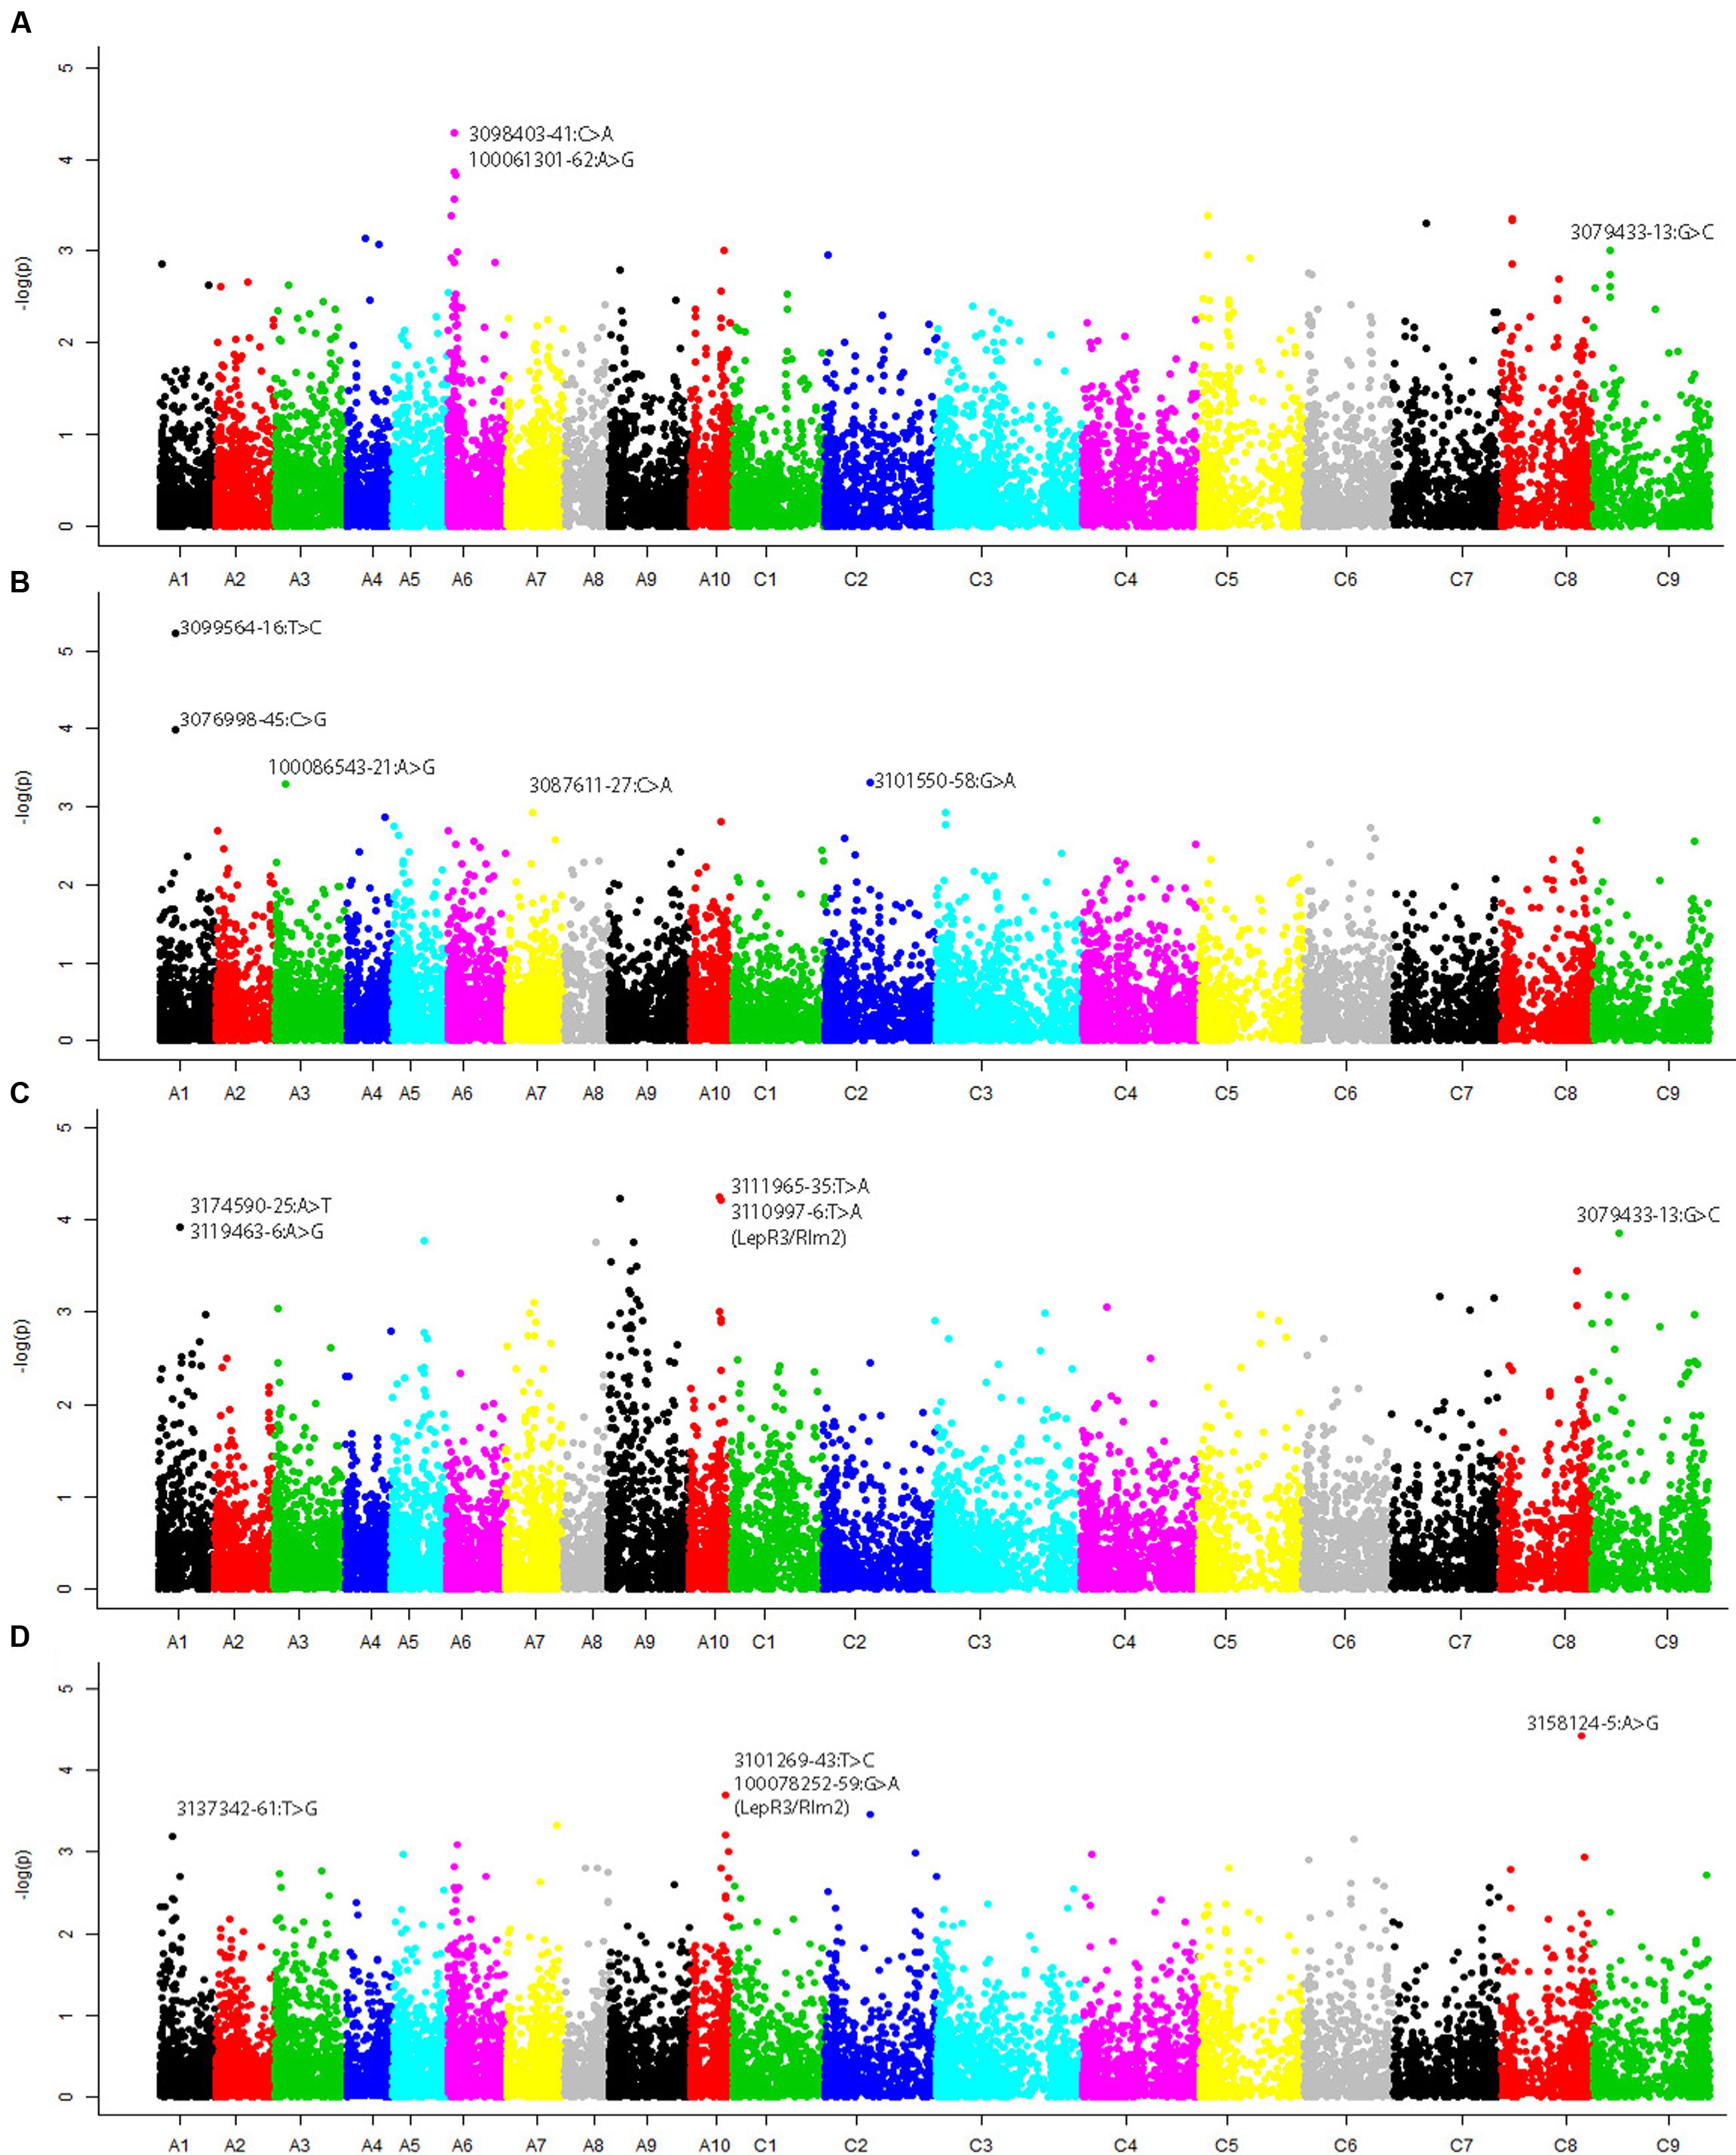
FIGURE 2. Manhattan plots showing genome-wide P values for associations between SNP markers and resistance to L. maculans evaluated with ascospore shower test under greenhouse conditions in 179 canola accessions. Stubble was collected from different canola varieties: (A) ATR-Cobbler, (B) AV-Garnet, (C) ATR-JardeeHT, and (D) Monola76TT. Different colors represent different chromosomes (A01–A10, C01–C9). Significant associations were tested at – log10(p) value of ≥3.
Comparison between genome-wide associations detected for race-specific (SSI) and race non-specific (pathotypes from stubble sources) resistance revealed at least 25 genomic regions that appeared repeatedly (within LD; 200 kb region) on chromosomes A01, A03, A05/C05, A06, A10/C09, C02, C05, C08, and unassembled contigs on the An subgenome (ChrAnn_random) of the current genome assembly (Supplementary Table S3E). None of the consistent associations across experiments for resistance were detected on chromosomes A07, suggesting that the R genes; Rlm1, Rlm3, Rlm4, and Rlm9 localized on A07 were in effective to provide resistance under field conditions (from where stubble sources were collected for ascospore shower test). Interestingly, a large number of significant associations (113) accounting for up to 10.84% phenotypic variation for resistance to SSI and pathotypes present on two stubble sources tested; CB-JardheeHT and AV-Garnet, were detected on homoeologous group 3 chromosomes, A03/C03. So far, no race-specific locus for resistance to L. maculans on these chromosomes has been reported in B. napus, B. rapa, and B. oleracea. In this study, we accounted for both population structure and kinship coefficients, therefore the likelihood of ‘false positive’ association is low, however, it needs further validation.
To assess whether resistance loci are clustered on any specific chromosomal regions, we compared the localisation of significant SNPs on the reference B. napus genome. We identified a higher frequency of significant SNP associations for resistance at seedling and adult plant stages on some chromosomes: A02 (2.73%), A03 (3.30%), A07 (9.88%), A10 (8.90%), and C03 (6.28%) (Supplementary Table S4). Only a small proportion of SNP markers (<2.2%) on A01/C01 were significantly associated with resistance to both seedling and adult plants stages, suggesting that a limited genetic variation occur at the detected loci in the accessions investigated.
Validation of Significant GWAS SNPs via Linkage Mapping
(i) Validation of Linkage Between SNP markers and the Newly Identified Rlm12 Gene in SAgSDH Population.
Genome-wide association analysis revealed eight significant SNP markers accounting for 5.23% to 10.50% of phenotypic variance on chromosome A01 in a GWAS panel when inoculated with two SSI; IBCN15 (AvrLm5, AvrLm6, AvrLm8, AvrLepR1, AvrLepR3, and AvrLepR4) and IBCN75 (AvrLm1, AvrLm 5, AvrLm6, AvrLm8, AvrLepR1, AvrLepR3, AvrLepR4), and stubble pathotypes derived from Monola76TT and AV-Garnet (Supplementary Table S3). These associations were further confirmed using the linkage mapping of the Skipton/Ag-Spectrum//Skipton (SAgSDH) population (146 lines). Significant genetic variation for resistance to L. maculans pathotypes was found among DH lines evaluated with pathotypes from mixed stubble using ascospore shower test (Figures 3A,B). Ag-Spectrum (inv.logit internal infection 58.1%) exhibited resistance as compared to Skipton (inv.logit internal infection 98.5%) (Table 1). The internal infection scores of DH lines ranged from 21.3 to 99.6% and mean internal infection (non-backtransformed mean) was 72%. The DH lines showed continuous distribution for multigenic resistance (Figure 3C), unlike the AWDH population. Most of the natural variation was genetically controlled as the broad sense heritability was high (67%).
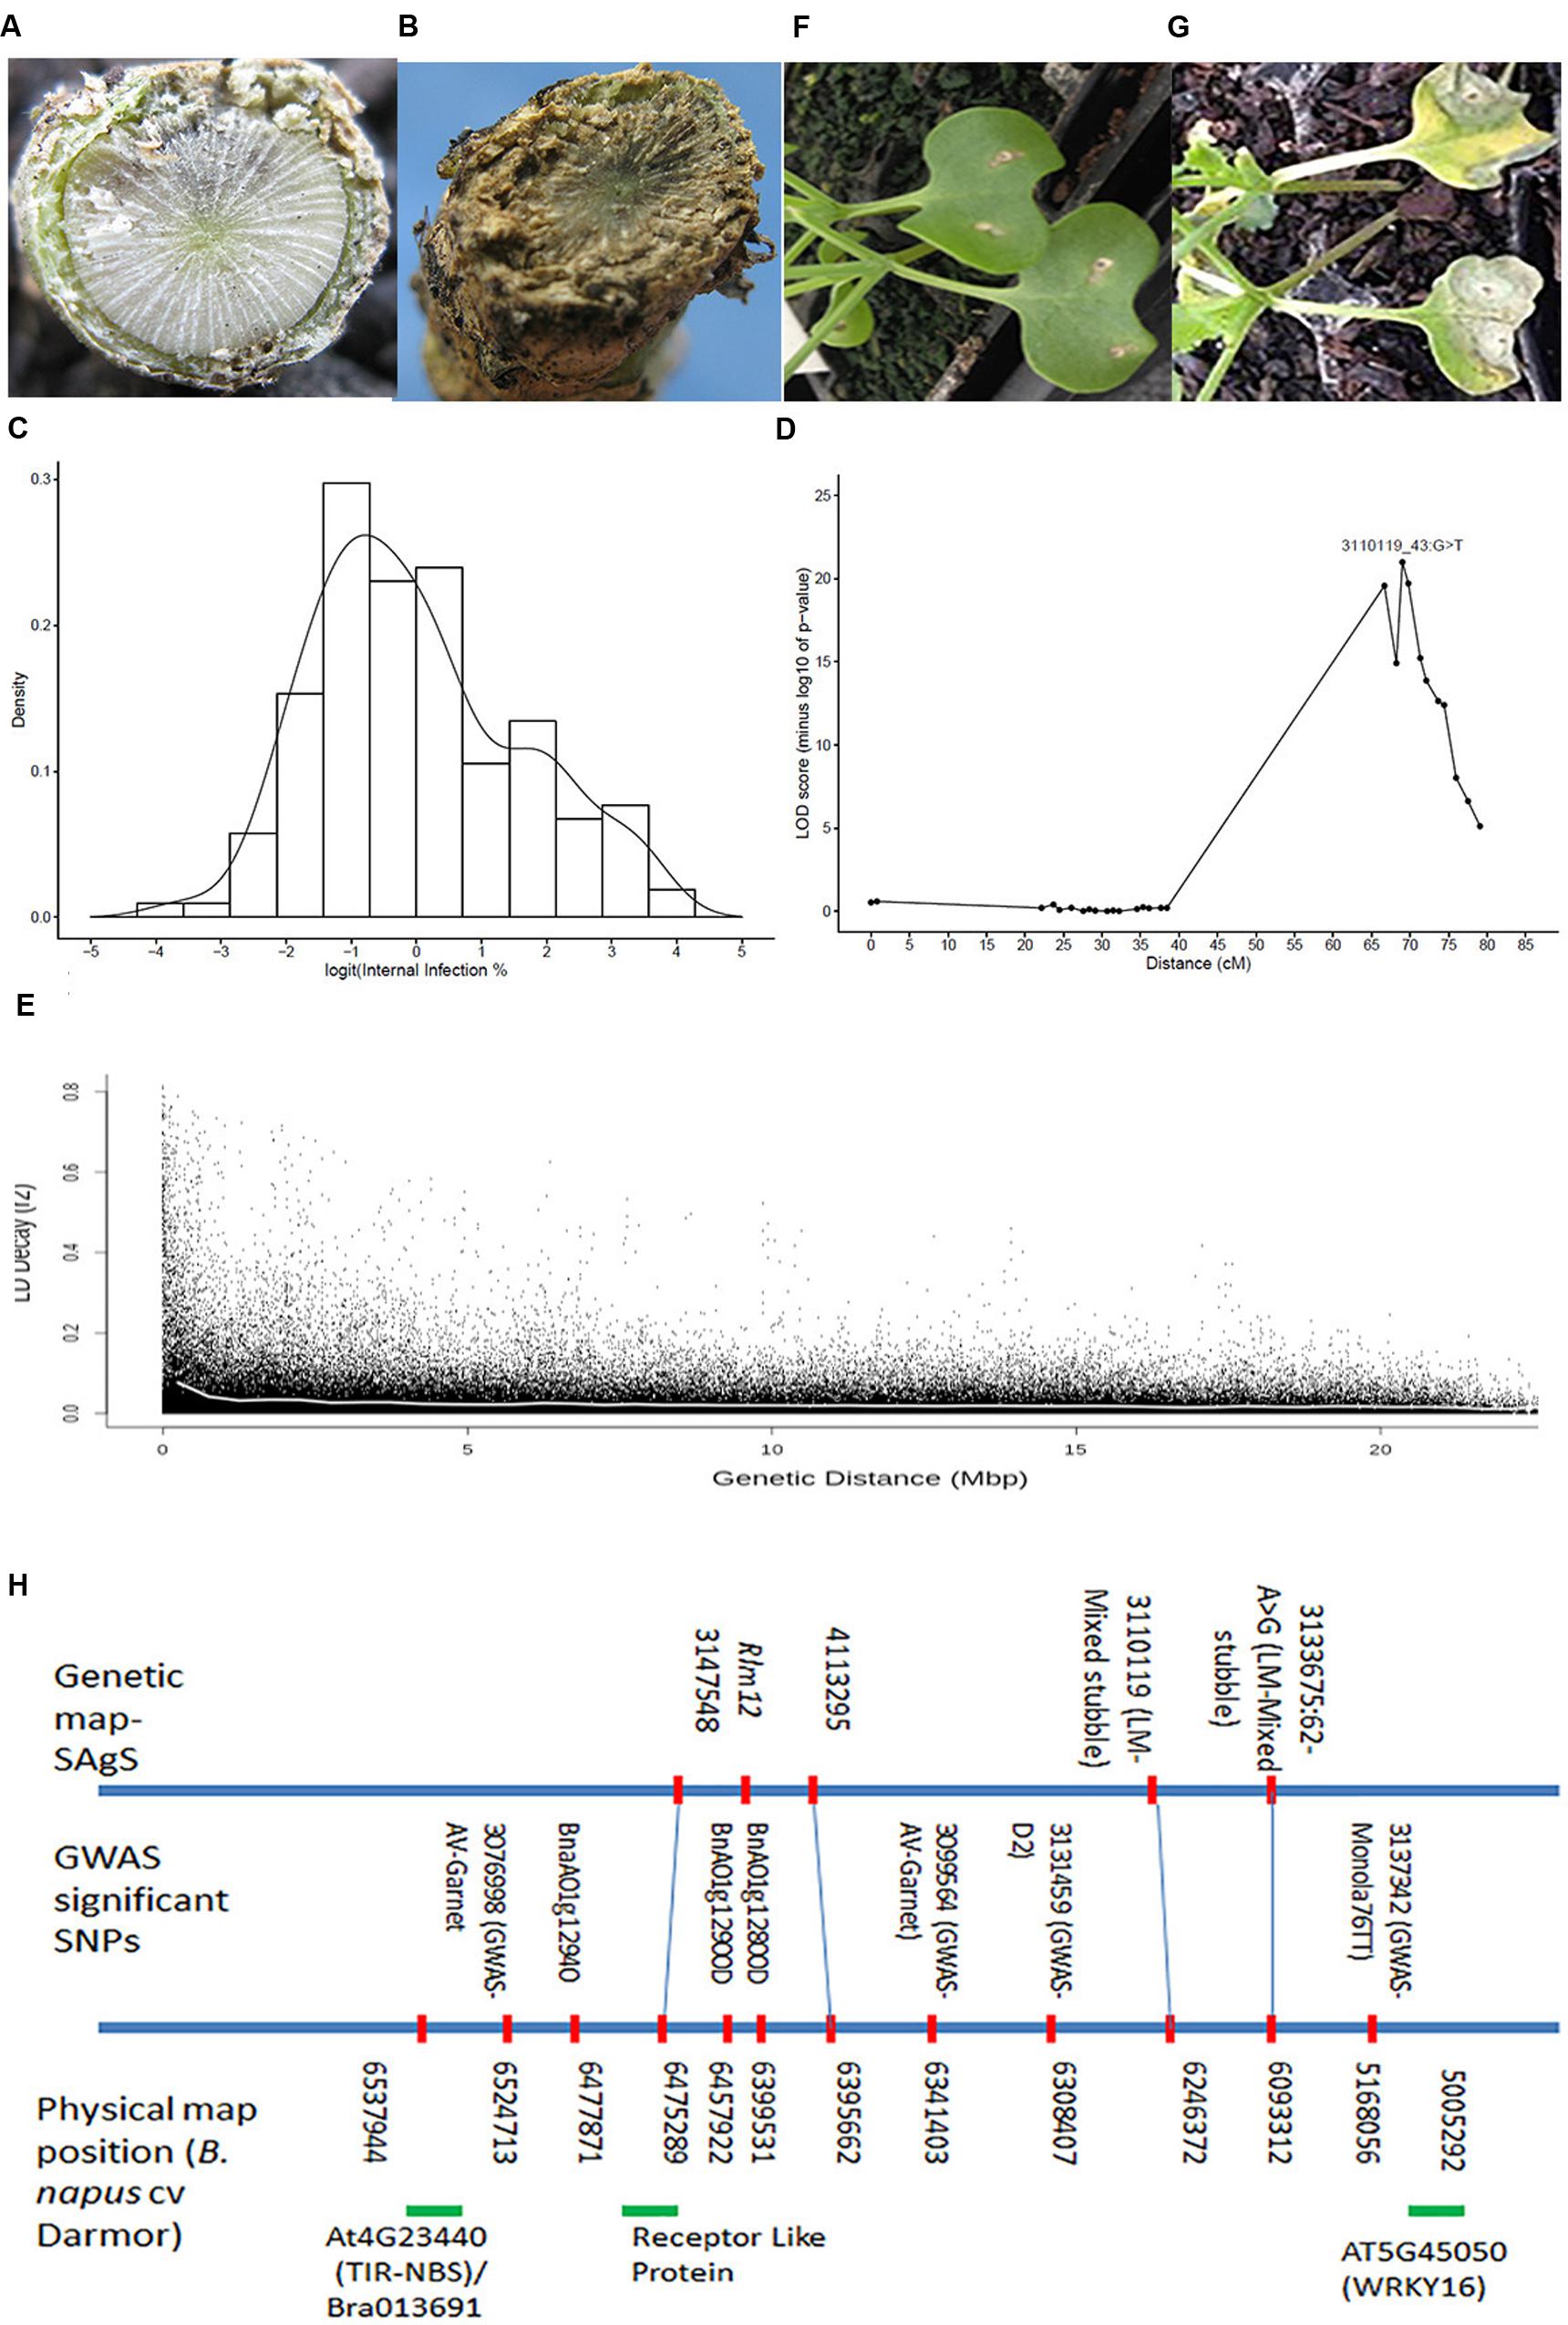
FIGURE 3. Genetic and physical mapping of Rlm12 locus on chromosome A01 in the SAgSDH population of Brassica napus. Crowns of resistant B. napus cv. Ag-Spectrum (A) and susceptible B. napus cv. Skipton (B) showing canker due to infection of L. maculans pathotypes at the adult plant stage. (C) The frequency distribution of internal infection scores among DH lines from the SAgS cross. The population was scored for resistance at the physiological maturity. (D) A major quantitative trait locus (QTL) showing highly significant association with resistance to L. maculans pathotypes present on mixed stubble. (E) The average LD decay (r2) on chromosome A01 approach 0.029 when distance between SNPs was approximately 200 kb. The curve (shown in white) was drawn across SNPs markers using the non-linear regression model. (F) Cotyledons of Ag-Spectrum and Skipton (G) showing critical symptoms of L. maculans infection after 20 days of inoculation with a single spore isolate 06MGPP041. (H) Alignment of markers that showed significant association with resistance to L. maculans isolates, pathotypes present on different stubbles (ascospore shower screen in a GWAS panel and SAgSDH population) and the reference B. napus genome sequence cv. Darmor.
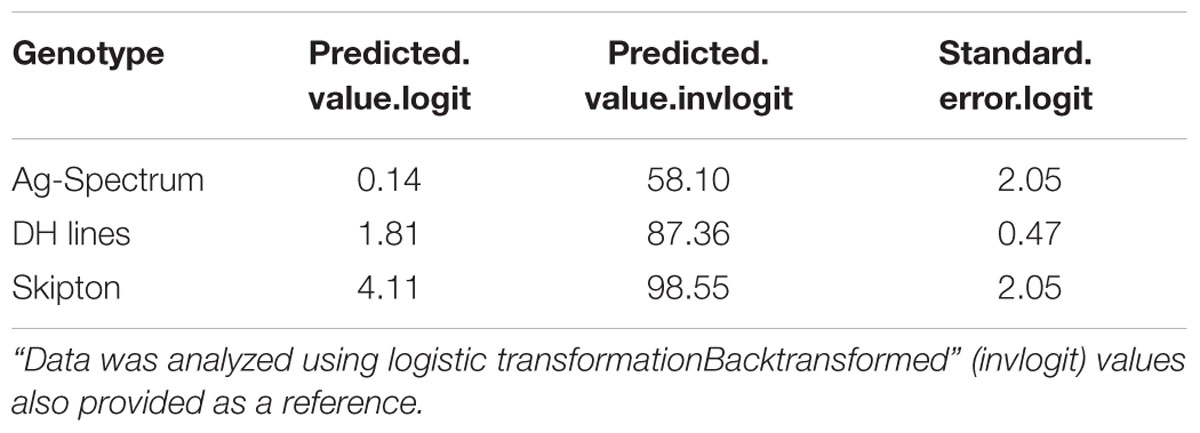
TABLE 1. Genetic variation for resistance to pathotypes present on mixed stubble collected from the commercial Australian canola cultivars AV-Garnet, ATR-Cobbler, CB-JardeeHT, and Monola76TT.
QTL analysis of the DH lines revealed five putative genomic regions for resistance to L. maculans; of which one highly significant locus [-log10(p) = > 26] was identified on chromosome A01 (Table 2; Figure 3D). This major QTL could explain 24.6% of the genotypic variance for resistance. Ag-Spectrum allele increased the resistance to L. maculans pathotypes as expected from phenotypic disease scores (Table 2). Four minor QTL (LOD score ≤ 2.3) were identified on chromosomes A02, A06, A07, and C08 (Table 2). To confirm the presence of QTL detected with WGAIM approach (Raman R. et al., 2016), linear marker regression was conducted in the SVS package using DArTseq markers and predicted means of DH lines. SNPs 3133675_62:A > G and 3110119_43:G > T on chromosome A01 showed highly significant association [-log10(p) = 32 to 32.8; Bonferroni P values = 4.52 × 10⁻³² to 8.40 × 10⁻³¹) with resistance to L. maculans pathotypes (Supplementary Table S5). In order to determine whether genetic variation at the QTL on A01 is due to a major locus, we ‘Mendelise’ quantitative disease scores into resistant and susceptible bins and performed linkage mapping. The QRlm.wwai-A01 was mapped as a single R locus and designated as Rlm12 (Figure 3H). This newly identified locus was delimited with 3147548–4113295 marker interval on the genetic linkage map of SAgSDH population (Raman R. et al., 2016).
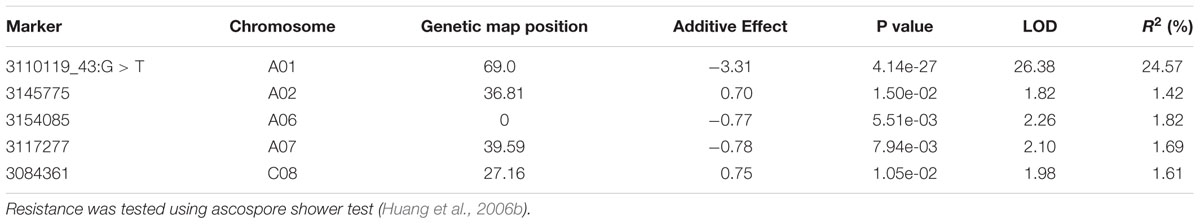
TABLE 2. Quantitative trait locus (QTL) associated with adult plant resistance (APR) to Leptosphaeria maculans pathotypes present on mixed stubble sources.
In order to verify whether the genomic region on A01 detected in the GWAS diversity panel (this study) and SAgSDH population evaluated under ascospore shower test, is the same as detected previously with isolate 06MGPP041 in a SASDH population (Raman et al., 2012), we re-evaluated the SASDH population for cotyledon resistance against 06MGPP041 under the glasshouse conditions. Cotyledons of Ag-Spectrum showed classical hypersensitive response on infection with the isolate 06MGPP041, consistent with the ETI mechanism established for R genes (Figures 3F,G). Utilizing a linkage map previously constructed for SASDH population (Raman et al., 2014b), resistance to L. maculans isolate 06MGPP041 was remapped using a cotyledon lesion scores on chromosome A01 near Infinium 6K SNP markers UQnapus0918/UQnapus3827 [–log10(p) > 2.5, favorable resistance allele: Ag-Spectrum].
(ii) Validation of Linkage Between SNP Markers and the Rlm3 gene in DH Population from AG-Castle∗3/Westar-10 (AWDH).
The presence of the Rlm3 in AG-Castle was validated using a differential set of isolates (Supplementary Table S6). Isolate IBCN76 was avirulent toward Rlm3 and produced resistant reaction (1 on a 0 to 9 scale) on AG-Castle∗3 compared to susceptible reaction (7 on a 0 to 9 scale) on Westar-10. The disease scores on DH lines exhibited the hallmark bimodal distribution (Figure 4A), suggesting that most likely a single gene controls resistance to isolate IBCN76. The broad sense heritability was high (90.3%), suggesting that most of the phenotypic variation for resistance is genetically controlled.
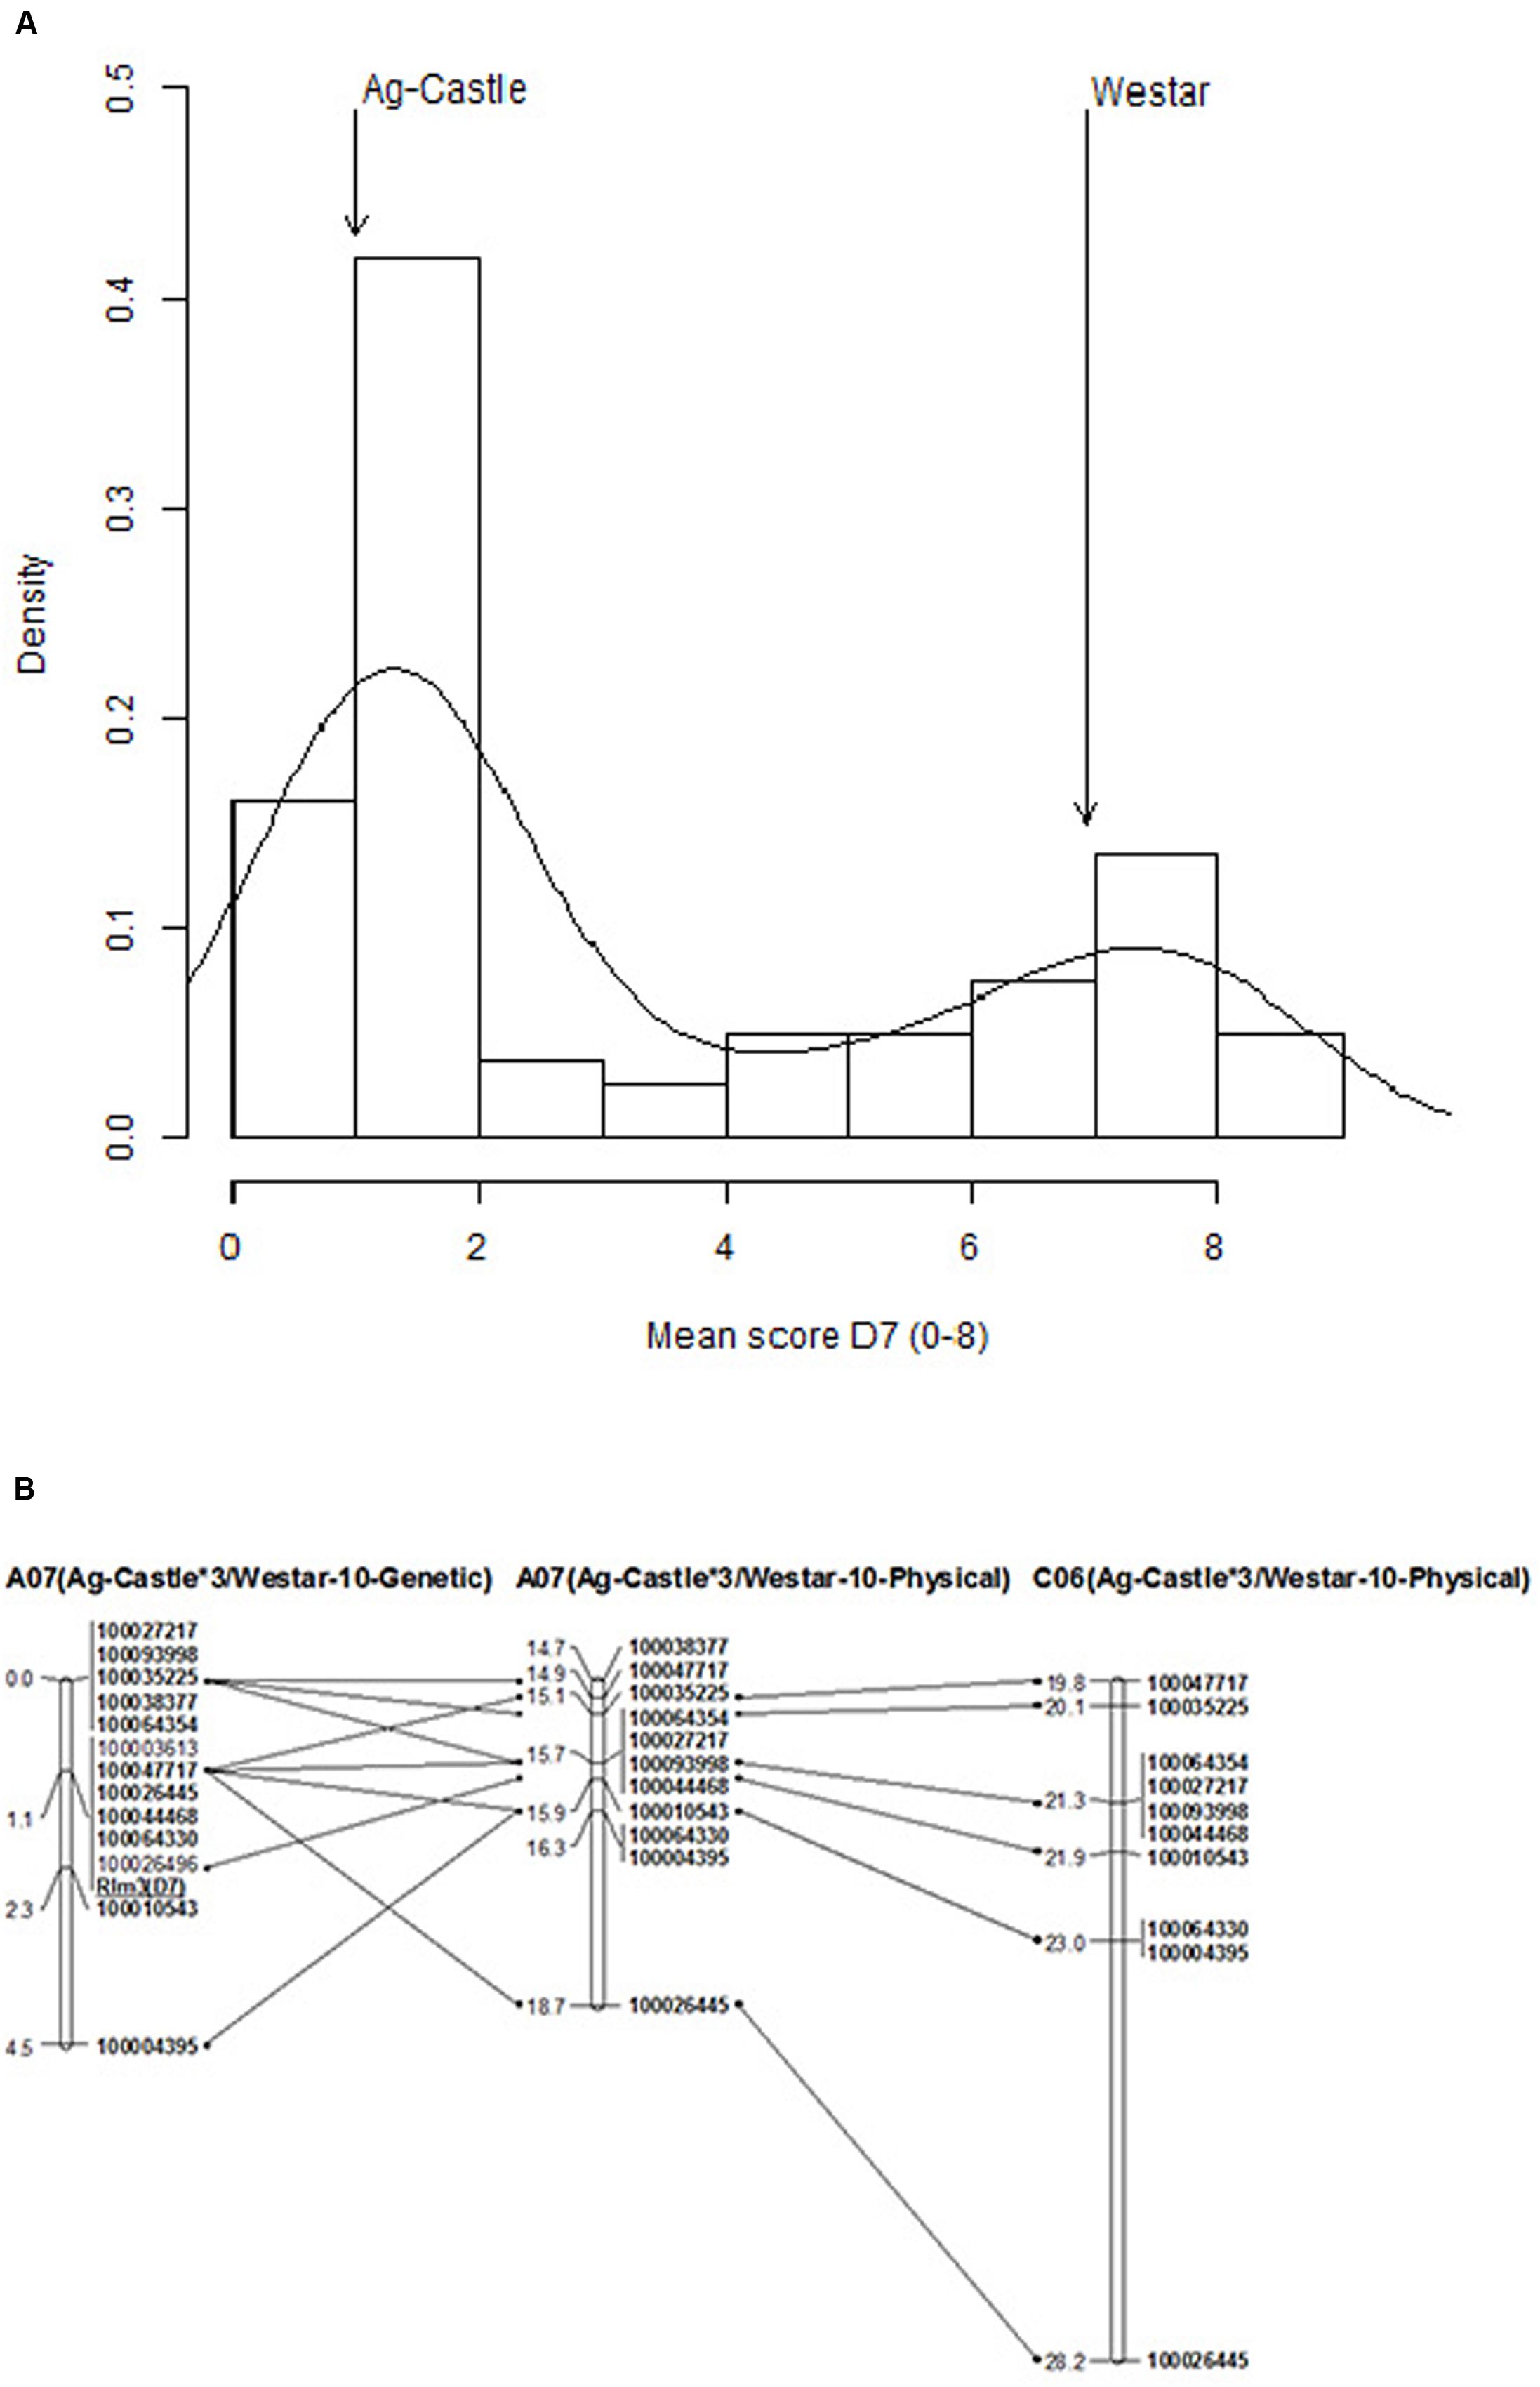
FIGURE 4. Genetic mapping of Rlm3 locus for resistance to blackleg in Ag-Castle∗3/Westar-10. (A) The frequency distribution of cotyledon lesion scores among DH lines from Ag-Castle∗3/Westar-10. (B) Physical mapping of Rlm3 gene for resistance to L. maculans on A07 and C06 (details are given in Supplementary Table S3). The marker order is shown on the right hand side, while the genetic and physical distances (x1Mbp) are on the left hand side.
DArTseq marker analysis of the AWDH population revealed a total of high quality 13,296 polymorphisms which showed segregation among 46 selected lines (Supplementary Table S7a). Of the 180 significant associations [-log10(p) ≥ 3], five DArTseq markers 100047717-11:C > G, 100026445-14:C > T, 100044468-36:C > T, 100064330-45:C > T and 100003613-47:G > C showed highly statistically significant association [-log10(p) = 19.68] with resistance to isolate IBCN76 (Supplementary Table S7b). In order to determine the relative position of the Rlm3 locus to the highly significant SNPs (revealed after correcting P value calculated with Bonferroni test = 3.76 × 10⁻⁶), we binned disease scores into two categories, resistant and susceptible. The Rlm3 locus from AG-Castle was mapped on chromosome A07, and showed a complete linkage with a suite of six markers (Figure 4B). Seven DArTseq markers which showed linkage with Rlm3 also revealed homoeology with a genomic region spanning 8.41-Mbp on the physical genomic map of chromosome C06 of the reference sequence of cv. Darmor-bzh (Figure 4), suggesting that a homoeologous genomic region on A07/C06 may control resistance to blackleg. Two SNP markers 100003613 and 100026496 located on chromosome A07_random contig, were mapped on A07 and showed tight linkage with Rlm3 in the AWDH population (Supplementary Table S3).
(iii) Validation of Linkage Between SNP markers and Known Rlm1, Rlm4, and LepR3 Genes in DH Populations.
In order to validate whether the genomic regions associated with resistance to L. maculans delineated in this GWAS are indeed ‘true’, we aligned adjacent sequence based DArTseq and 6K Infinium SNP markers (Dalton-Morgan et al., 2014) flanking QTL regions associated with resistance in four DH mapping populations derived from crosses AG-Castle∗3/Westar-10 (this study), BLN2762/Surpass400 (Raman R. et al., unpublished), Maxol∗1/Westar-10 (Raman R. et al., 2013), and Skipton/Ag-Spectrum (Raman et al., 2012; Tollenaere et al., 2012), with the published B. napus genome sequence (Chalhoub et al., 2014). Infinium SNP markers Bn_A07_p13943479 (UQBn0012), Bn_A07_p14002656 (UQBn2510 and UqBn5045), and Bn_A07_p15059054 (UQBn2528) closely linked with the Rlm4 locus for resistance to isolate 04MGPS021 in a Skipton/Ag-Spectrum (SASDH) population were localized on A07 (Figure 5) within 100 kb (88-kbp to 93-kbp) from the significant GWAS SNPs (Supplementary Table S8). This suggested that genome-wide associations identified in this study are indeed robust and valid. Likewise, GWAS associations were also verified for Rlm1 locus in DH populations derived from Maxol∗1/Westar-10 (MWDH) (within 241 kb), and LepR3 gene (∼within 400 kb) in the BLN2762/Surpass400 (BSDH) (Supplementary Table S8; Figure 5). The genetic linkage map of MWDH population (A07) was collinear, except the DArTseq marker 3077579 to the physical map of B. napus (Supplementary Figure S4), suggesting that DArTseq markers were anchored correctly on their respective genetic position.
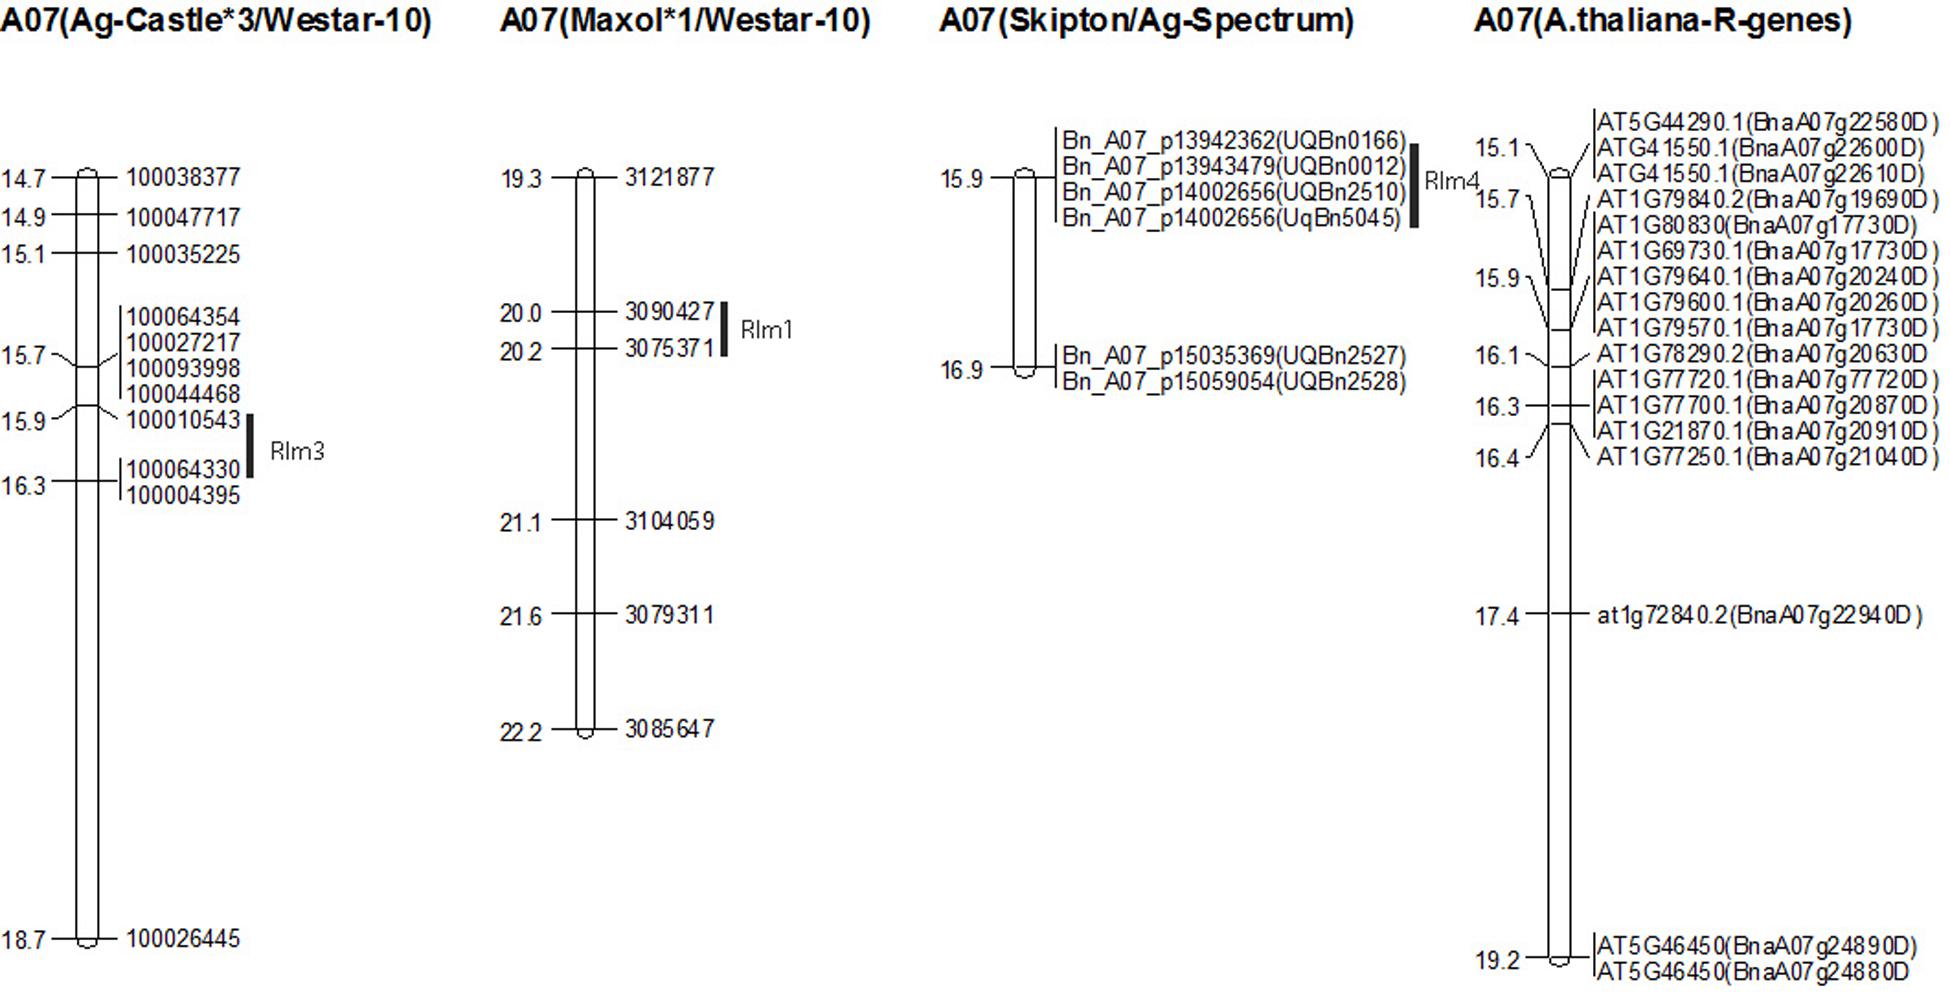
FIGURE 5. Physical mapping of Rlm1, Rlm3, and Rlm4 genes of B. napus associated with resistance to L. maculans and disease resistance genes of Arabidopsis on the sequenced genome of B. napus cv Darmor. The marker order is shown on the right hand side, while the physical distances (x1Mb) are on the left hand side. The markers labeled with prefix ‘Bn_A07_p’ and UQBn’ represent to 6K and 60K Infinium SNP markers, respectively. Arabidopsis disease resistance genes are labeled as ‘At’. Genes with the prefix ‘Bna’ represent to B. napus predicted R genes.
Prediction of Resistance Loci Using GWAS SNP
In order to verify whether significant GWAS SNPs accurately predict the known Rlm1, Rlm3, Rlm4, and LepR3/Rlm2 and the proposed Rlm12 loci for resistance, we filtered marker alleles in Microsoft excel and compared their allelic profiles with cotyledon lesion (mean) scores from differential set of isolates (Supplementary Table S9). Our results reiterated that SNP haplotypes were consistent in detecting resistance loci in Australian canola varieties. Several resistance sources could be tracked accurately, consistent with their breeding history. For example, the haplotype based on two GWAS SNPs (3100490| 56:A > T and 3132403| 42:G > T) linked with the Rlm4 locus on A07 enabled us to predict Rlm4 mediated resistance in several canola varieties such as 46C76, AV-Sapphire, BLN2762, BLN3347, CB-Telfer, Monty, Tarcoola, TornadoTT, ThunderTT, Scoop, and Skipton. All these varieties had cotyledon lesion scores ≤3.5 upon inoculation with IBCN17 and IBCN18 differential isolates (Supplementary Table S1). Prediction of Rlm4 mediated resistance in these varieties is also consistent with previous studies (Marcroft et al., 2012; Raman et al., 2012). Similarly, a suite of five markers enabled us to track the Rlm12 mediated adult plant resistance (APR) in Ag-Spectrum, Ag-Comet, ATR-Signal, AV-Ruby, HurricaneTT, TornadoTT, and ThunderTT. Pedigree analysis revealed that several of these varieties (Ag-Comet. ATR-Signal, AV-Ruby, ThunderTT, and TornadoTT) are genetically related7 (Raman et al., 2014b).
GWAS Identifies ‘Rlm’ Genes for Resistance to L. maculans in Canola
In order to identify potential candidate genes involved in the qualitative and quantitative resistance to L. maculans, we compared 78 highly significant SNP associations after applying Bonferroni correction [p < 2.68 × 10⁻⁵ or -log10(p) > 4.57] for resistance detected in the GWAS diversity panel phenotyped under the glasshouse (cotyledon test) and greenhouse conditions (ascospore shower screen) with the sequenced Rlm2, and LepR3, 425 R gene homologs of B. napus (Chalhoub et al., 2014) and other 126 R genes of A. thaliana (Supplementary Table S3E). We further searched potential candidate genes based on collinearity which were predicted in the vicinity of significant association that appeared both in GWAS and DH populations. Of highly significantly associated SNP loci for resistance to L. maculans pathotypes, 32 were localized within 200 kb from R genes of A. thaliana (Table 3; Supplementary Table S3E). Besides, a total of 48 NBS-LRR homologs of B. napus (Chalhoub et al., 2014) could be localized within 200 kb genomic region of SNP associations (data not shown); of them four were located on A01, A05, and A07 chromosomes within 150 kb from highly significant SNP associations (Supplementary Table S3E; Figure 3E). Two B. napus R gene homologs were localized within a 10 kb region of GWAS associations on A03 (AT2G14080.1) and A07 (AT1G72890.2) encoding R protein having TIR-NBS-LRR motifs (Supplementary Table S3). Significant SNPs for resistance against different isolates and stubble sources were detected within the genomic region of 13.4 to 14.4 Mbp on chromosome A10 representing to LepR3 and Rlm2 (BnaA10g20720D/AT2G15042.1) genes (Supplementary Table S3). The AT2G15042 gene encoding an LRR family protein on chromosome 2 of A. thaliana (6510165–6512335) was localized within 1.8 kb from BnaA10g20720D, suggesting that Arabidopsis based collinearity could be utilized to identify candidate genes for resistance to L. maculans in canola.
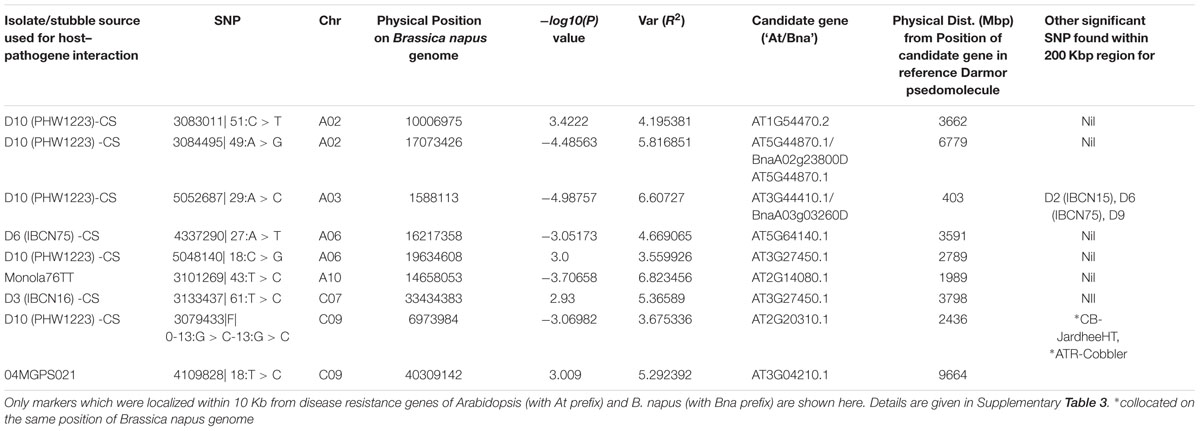
TABLE 3. Genome-wide significant SNP associated with variation in resistance to L. maculans at the cotyledon stage (cs).
Two genomic regions harboring Rlm1, Rlm3, and Rlm4 genes; delimited with coordinates 14.74 Mbp to 17.02 Mbp and 19.27 Mbp to 23.3 Mbp of A07 in the B. napus reference genome contained significant SNPs associated with resistance to IBCN15, IBCN17, IBCN75, IBCN76, D9, PHW1223, 04MGPS021 in GWAS, and DH populations derived from SASDH, AWDH, MWDH, and BSDH (Supplementary Table S3). This genomic region represents to collinear region on Arabidopsis chromosome 1 for resistance to L. maculans gene AtRlm1 (Mayerhofer et al., 2005) and corresponds to Rlm1, Rlm3, Rlm4, and Rlm9 genes in B. napus (Delourme et al., 2004; Parkin et al., 2005). Several R genes encoding TIR-NB-LRR and CC-NB-LRR domains (BnaA07g17000D, BnaA07g22940D, BnaA07g26100D BnaA07g30480D BnaA07g34770D BnaA07g35000D, and BnaA07g35000D), ROP3, PEN3, GST, SPL6, RbohF, protein kinase, and pathogenesis related proteins (AT5G46450.1 on At 5 chromosome) were also localized in both genomic intervals.
RLM1col gene (AT1G64070.1) for resistance to L. maculans in A. thaliana, was located approximately 150 kb from GWAS SNP, 3083208| 11:T > A detected for resistance to PHW1223 on chromosome C03. Physical mapping of significant SNPs on chromosome A01 and R genes of A. thaliana and B. napus on the reference sequenced genome of B. napus revealed that a genomic region spanning 1.3 Mb delimited with WRKY16 (AT5G45050/BnaC03g08660D) and TIR-NBS involved in signal transduction, apoptosis, and innate immune response in Arabidopsis (AT4G23440 on chromosome 4), B. rapa gene (Bra013691), and B. napus receptor like protein (BnaA01g12940D) is associated with resistance to L. maculans isolate IBCN15 [-log10(p) ≤ 3], stubble pathotypes derived from Monola76TT, AV-Garnet and mixed stubble in a SAgS DH population (Figure 3H). This suggested that utilization of GWAS and linkage mapping approaches in parallel enabled us to identify a ‘potential’ candidate gene underlying Rlm12 mediated resistance to L. maculans.
Discussion
Identification of ‘durable’ and novel alleles for qualitative and quantitative resistance to the devastating blackleg disease is critical for sustainability of canola industry. GWAS and linkage analyses enabled us to identify and validate statistically significant marker loci for known R genes to L. maculans (Rlm1, Rlm3, Rlm4, and LepR3). This has been possible due to the comprehensive analysis of 179 B. napus diverse lines, 12 SSI, and mixed pathotypes (present on the four different stubble sources) interactions, and a good understanding of chromosomal location of qualitative R loci in B. napus. In addition, we identified several new loci for resistance (Supplementary Table S3); one of them, Rlm12 was identified in a GWAS panel and validated in SAgSDH population. Our linkage mapping results suggested that Rlm12 is a major gene having large allelic effects and also provides APR. Previously, QTL for field resistance accounting for R2 = 14 to 24.6% on chromosome A01 were reported in Australian DH populations derived from AV-Sapphire/Westar-10, Caiman/Westar-10 and Camberra/Westar-10, and Skipton/Ag-Spectrum (Kaur et al., 2009; Raman et al., 2012). In addition, Raman et al. (2012) reported a QTL; QRlm.wwai-A1 (LOD score: 3.0) accounting for 22.8% of genetic variance on A01 for resistance at seedling stage with the isolate 04MGPP041. In this study, we showed that parental lines of a SAgSDH population exhibit a classical hypersensitive response on inoculation with 06MGPP0P41 (Figures 3G,H), as observed for R genes. Detection of low level of genetic variation for resistance at the seedling stage (Raman et al., 2012) and mapping of a major locus for resistance at the adult plant stage on A01 (this study) suggest that Rlm12 may represent an APR locus. Marker haplotypes showed that several accessions such as Ag-Spectrum, AV-Sapphire, AV-Ruby and ATR-Signal may carry the Rlm12 locus for resistance and may have provided resistance against different pathotypes under field conditions but due to the absence of a differential isolate set, this may have remained undetected in the Australian canola germplasm (Supplementary Table S3). Evidence of APR was also obtained from the phenotypic data obtained from SSI, as the cotyledon lesion score and internal infection was poorly correlated (Supplementary Table S2). Resistance expressed at the adult plants stage could be due to race non-specific APR genes (e.g., Rlm12), race-specific R genes (Delourme et al., 2004, 2011; Raman et al., 2012; Larkan et al., 2013, 2015) and race non-specific quantitative resistance (Delourme et al., 2006; Rimmer, 2006; Huang et al., 2009). This study revealed that some of the Australian cultivars were either resistant to pathotypes present on at least three stubble sources or had a low level of disease (Figure 1D, Supplementary Table S1). These specific varieties may provide a useful resource for genetic improvement of quantitative resistance to L. maculans.
We established that several GWAS SNP associations are indeed associated with resistance to L. maculans; however, some of them need to be validated in relevant populations. The genomic regions (SNP associations) on A02, A06, A07, and A10 may represent well defined race-specific R genes: LepR1 (on A02); LepR4 (on A06); Rlm1, Rlm3, Rlm4, Rlm7, and Rlm9 (on A07), and LepR3/Rlm2 on A10 controlling natural variation for resistance to L. maculans (Delourme et al., 2004, 2011; Raman et al., 2013b; Yu et al., 2013; Larkan et al., 2015). Our results also showed that highly significant associations for resistance can be identified in a small set of genotypes (subpopulation-II and AWDH population). Several GWAS SNPs for qualitative (cotyledon) and/or quantitative (crown canker) resistance were localized in homoeologous regions, particular on linkage groups A01/C01, A02/C02 A03/C03 A05/C05, and A07/C06. These regions may either represent functionally redundant loci or involved in increased allelic diversity of the genes controlling resistance to blackleg (Fopa Fomeju et al., 2014). Genome-wide associations detected in a GWAS panel on chromosomes A03/C03 may represent novel alleles or their interactions with the known R loci. It is also possible that resistance to L. maculans is confounded with other phenological attributes such as flowering time and plant maturity. The GWAS panel used herein possessed diverse accessions representing winter-, spring-, and semi-winter types (Raman H. et al., 2016) and included derivatives from B. napus/B. juncea (Roy, 1984) which may have resistance genes introgressed from B genome. Chromosome B3 in B. nigra/B. juncea, which is orthologous to B. rapa and B. napus chromosome A03, has been implicated in conferring blackleg resistance. We have not validated whether the statistical significant associations identified on A03/C03 either represent to (i) qualitative/quantitative resistance to L. maculans (Supplementary Table S3, (Fopa Fomeju et al., 2014), or due to (ii) pleotropic traits involved in phenological components. Comparative mapping showed that At3g15190 and BnaA03g03260D (AT2G14080.1, disease resistance protein (TIR-NBS-LRR class) genes could be localized in the same QTL region identified for resistance on A03/C03 in this study. At3g15190 gene also showed sequence identities with chromosomes B01/A01/C01, and B05/A05 (Panjabi et al., 2008). Large numbers of associations detected for specific isolates (e.g., PHW1223) may also be due to the genetic network involved in resistance to L. maculans to different Avr genes present. For example, SOBIR1 which was physically mapped on A03/C03 and A04 chromosomes (Supplementary Table S3) is suggested to interact with LRR-RLP (LepR3) in conferring resistance (Larkan et al., 2013; Liebrand et al., 2014).
The completely sequenced and annotated genomes of A. thaliana and B. napus proved to be useful to unravel candidate genes in B. napus; several paralogs for resistance to L. maculans were identified. For example, Rlm1, Rlm3, and Rlm4 were mapped in the vicinity of R genes such as ABCG36 and RAC-LIKE 1, and protein kinase genes (Supplementary Table S3, Figure 5). Previously, the same gene (At1g64070) has been shown to confer resistance to L. maculans in A. thaliana. R genes encoding CC-LRR-NBS, TIR-LRR-NBS, receptor-like kinase, receptor-like protein, transmembrane and PTO domains localized in the vicinity of significant SNP associations (Supplementary Table S3) have been implicated in signal perception and transduction, apoptosis, adaptive and innate immune response to positively enhance resistance function of disease resistance (Bent et al., 1994; Meyers et al., 2003; Mun et al., 2009; Yu et al., 2014; Larkan et al., 2015). Genome wide analyses of B. napus and B. rapa genomes revealed that R gene analogs are frequent (Wang et al., 2011; Chalhoub et al., 2014). We found that these genes were often localized close to the significant SNPs that we have identified in GWAS and DH populations in this study. It was interesting to note that some of the key genes such as LepR3/Rlm2 were not the closest (within LD: 200 kb) from the SNPs detected with GWAS. This may be due to lack of marker polymorphism in the mapping panels, moderate genome-wide coverage of markers and low frequency of informative alleles (associated with resistance to L. maculans).
Conclusion
GWAS and linkage analysis approaches delineated both known and unknown (new) genomic regions that control the resistance to L. maculans in B. napus and resolve genomic regions to a single gene level. We were able to identify Arabidopsis thaliana/B. napus genes that were present near loci exhibiting natural variation for resistance to L. maculans in a GWAS panel. Validation of significant GWAS markers associated with both race-specific (detected with multiple isolates) and race non-specific loci (naturally occurring pathotypes present on different stubbles) in DH populations suggested that these loci could be manipulated to enhance background level and durability of resistance in B. napus germplasm.
Author Contributions
HR and RR conceived and designed the study; NC and SD developed experimental design and analyzed phenotypic data; RR, HR, and KL phenotyped populations for blackleg resistance using SSI; SM, RR, and HR conducted ascospore shower test experiments on GWAS panel; SM, DB, and PS phenotyped SAgSDH population using ascospore test and provided seed of AWDH population; HR, RR, AK, and JS conducted molecular and association analyses, and determined physical locations of SNP and candidate genes of A. thaliana; JB and DE provided physical locations of R genes in the B. napus genome; HR and RR interpreted the data, prepared the manuscript and supervised the whole study; all authors reviewed and edited the manuscript.
Funding
This research was supported by grants from the Grains Research and Development Coorporation (DAN00117 & DAN00208), NSW Department of Primary Indistries, Department of Economic Development, Jobs, Transport and Resources (DAV000085), and Statistics for the Australian Grains Industry.
Conflict of Interest Statement
DArT P/L (authors JS and AK) (Canberra, Australia) is a genotyping company and may benefit from providing genotyping service of DArTseq markers to the Brassica R&D community. The other authors declare that the research was conducted in the absence of any commercial or financial relationships that could be construed as a potential conflict of interest.
Acknowledgments
We thank to Dr. Ata Rehman, Andrew Price, Belinda Taylor, and Ros Pragnell for phenotyping GWAS panel, Bhariv Raman for ImageJ analysis and, Dr. Vicki Elliott, Dr. Angela van de Wouw for supporting phenotyping of SAgSDH population for blackleg resistance.
Supplementary Material
The Supplementary Material for this article can be found online at: http://journal.frontiersin.org/article/10.3389/fpls.2016.01513
Footnotes
- ^ https://imagej.nih.gov/ij/
- ^ http://www.goldenhelix.com/
- ^ https://ics.hutton.ac.uk/flapjack/
- ^ http://www.arabidopsis.org/
- ^ http://www.ncbi.nlm.nih.gov/Genomes/
- ^ http://www.genoscope.cns.fr/brassicanapus/
- ^ http://pericles.ipaustralia.gov.au/pbr_db/
References
Balesdent, M.-H., Fudal, I., Ollivier, B., Bally, P., Grandaubert, J., Eber, F., et al. (2013). The dispensable chromosome of Leptosphaeria maculans shelters an effector gene conferring avirulence towards Brassica rapa. New Phytol. 198, 887–898. doi: 10.1111/nph.12178
Bent, A. F., Kunkel, B. N., Dahlbeck, D., Brown, K. L., Schmidt, R., Giraudat, J., et al. (1994). RPS2 of Arabidopsis thaliana: a leucine-rich repeat class of plant disease resistance genes. Science 265, 1856–1860. doi: 10.1126/science.8091210
Brun, H., Levivier, S., Somda, I., Ruer, D., Renard, M., and Chevre, A. M. (2000). A field method for evaluating the potential durability of new resistance sources: application to the Leptosphaeria maculans-Brassica napus pathosystem. Phytopathology 90, 961–966. doi: 10.1094/PHYTO.2000.90.9.961
Butler, D. G., Cullis, B. R., Gilmour, A. R., and Gogel, B. J. (2009). ASReml-R Reference Manual. Release 3.0. Technical report, Queensland Department of Primary Industries, Brisbane, QLD.
Cai, D., Xiao, Y., Yang, W., Ye, W., Wang, B., Younas, M., et al. (2014). Association mapping of six yield-related traits in rapeseed (Brassica napus L.). Theor. Appl. Gen. 127, 85–96. doi: 10.1007/s00122-013-2203-9
Chalhoub, B., Denoeud, F., Liu, S., Parkin, I. A. P., Tang, H., Wang, X., et al. (2014). Early allopolyploid evolution in the post-Neolithic Brassica napus oilseed genome. Science 345, 950–953. doi: 10.1126/science.1260782
Coombes, N. E. (2002). The Reactive Tabu Search for Efficient Correlated Experimental Designs. Ph.D. thesis, John Moores University, Liverpool.
Cullis, B. R., Smith, A. B., and Coombes, N. E. (2006). On the design of early generation variety trials with correlated data. J. Agric. Biol. Environ. Stat. 11, 381–393. doi: 10.1198/108571106X154443
Dalton-Morgan, J., Hayward, A., Alamery, S., Tollenaere, R., Mason, A. S., Campbell, E., et al. (2014). Development of a high-throughput SNP array in the amphidiploid species Brassica napus. Plant Biotechnol. J. 14, 643–655. doi: 10.1007/s10142-014-0391-2
Dangl, J. L., and Jones, J. D. G. (2001). Plant pathogens and integrated defence responses to infection. Nature 411, 826–833. doi: 10.1038/35081161
Delourme, R., Barbetti, M. J., Snowdon, R., Zhao, J., Maria, J., and Manzanares-Dauleux. (2011). Genetics and Genomics of Disease Resistance USA: Science Publishers. Boca Raton, FL: CRC Press.
Delourme, R., Chevre, A. M., Brun, H., Rouxel, T., Balesdent, M. H., Dias, J. S., et al. (2006). Major gene and polygenic resistance to Leptosphaeria maculans in oilseed rape (Brassica napus). Eur. J. Plant Pathol. 114, 41–52. doi: 10.1007/s10658-005-2108-9
Delourme, R., Pilet-Nayel, M. L., Archipiano, M., Horvais, R., Tanguy, X., Rouxel, T., et al. (2004). A cluster of major specific resistance genes to Leptosphaeria maculans in Brassica napus. Phytopathology 94, 578–583. doi: 10.1094/PHYTO.2004.94.6.578
Fitt, B., Brun, H., Barbetti, M., and Rimmer, S. (2006). World-wide importance of Phoma stem canker (Leptosphaeria maculans and L. biglobosa) on oilseed rape (Brassica napus). Eur. J. Plant Pathol. 114, 3–15. doi: 10.1007/s10658-005-2233-5
Flint-Garcia, S. A., Thornsberry, J. M., and Buckler, E. S. (2003). Structure of linkage disequilibrium in plants. Annu. Rev. Plant Biol. 54, 357–374. doi: 10.1146/annurev.arplant.54.031902.134907
Flor, H. H. (1971). The current status of the gene-for-gene concept. Annu. Rev. Phytopathol. 9, 275–296. doi: 10.1146/annurev-phyto-072910-095339
Fopa Fomeju, B., Falentin, C., Lassalle, G., Manzanares-Dauleux, M. J., and Delourme, R. (2014). Homoeologous duplicated regions are involved in quantitative resistance of Brassica napus to stem canker. BMC Genomics 15:498. doi: 10.1186/1471-2164-15-498
Hayden, H. L., Cozijnsen, A. J., and Howlett, B. J. (2007). Microsatellite and minisatellite analysis of Leptosphaeria maculans in Australia reveals regional genetic differentiation. Phytopathology 97, 879–887. doi: 10.1094/phyto-97-7-0879
Howlett, B., Idnurm, A., and Pedras, M. (2001). Leptosphaeria maculans, the causal agent of blackleg disease of Brassicas. Fungal Genet. Biol. 33, 1–14. doi: 10.1006/fgbi.2001.1274
Huang, Y. J., Evans, N., Li, Z. Q., Eckert, M., Chèvre, A. M., Renard, M., et al. (2006a). Temperature and leaf wetness duration affect phenotypic expression of Rlm6-mediated resistance to Leptosphaeria maculans in Brassica napus. New Phytol. 170, 129–141. doi: 10.1111/j.1469-8137.2006.01651.x
Huang, Y. J., Li, Z. Q., Evans, N., Rouxel, T., Fitt, B. D. L., and Balesdent, M. H. (2006b). Fitness cost associated with loss of the AvrLm4 avirulence function in Leptosphaeria maculans (Phoma stem canker of oilseed rape). Eur. J. Plant Pathol. 114, 77–89. doi: 10.1007/s10658-005-2643-4
Huang, Y. J., Pirie, E. J., Evans, N., Delourme, R., King, G. J., and Fitt, B. D. L. (2009). Quantitative resistance to symptomless growth of Leptosphaeria maculans (phoma stem canker) in Brassica napus (oilseed rape). Plant Pathol. 58, 314–323. doi: 10.1371/journal.pone.0084924
Jannink, J. L. (2007). Identifying quantitative trait locus by genetic background interactions in association studies. Genetics 176, 553–561. doi: 10.1534/genetics.106.062992
Jestin, C., Lodé, M., Vallée, P., Domin, C., Falentin, C., Horvais, R., et al. (2011). Association mapping of quantitative resistance for Leptosphaeria maculans in oilseed rape (Brassica napus L.). Mol. Breeding 27, 271–287. doi: 10.1007/s11032-010-9429-x
Kang, H. M. (2008). Efficient control of population structure in model organism association mapping. Genetics 178, 1709–1723. doi: 10.1534/genetics.107.080101
Kaur, S., Cogan, N. O. I., Ye, G., Baillie, R. C., Hand, M. L., Ling, A. E., et al. (2009). Genetic map construction and QTL mapping of resistance to blackleg (Leptosphaeria maculans) disease in Australian canola (Brassica napus L.) cultivars. Theor. Appl. Genet. 120, 71–83. doi: 10.1007/s00122-009-1160-9
Larkan, N. J., Lydiate, D. J., Parkin, I. A. P., Nelson, M. N., Epp, D. J., Cowling, W. A., et al. (2013). The Brassica napus blackleg resistance gene LepR3 encodes a receptor-like protein triggered by the Leptosphaeria maculans effector AvrLM1. New Phytol. 197, 595–605. doi: 10.1111/nph.12043
Larkan, N. J., Ma, L., and Borhan, M. H. (2015). The Brassica napus receptor-like protein RLM2 is encoded by a second allele of the LepR3/Rlm2 blackleg resistance locus. Plant Biotechnol. J. 13, 983–992. doi: 10.1111/pbi.12341
Li, F., Chen, B., Xu, K., Wu, J., Song, W., Bancroft, I., et al. (2014). Genome-wide association study dissects the genetic architecture of seed weight and seed quality in rapeseed (Brassica napus L.). DNA Res. 21, 355–367. doi: 10.1093/dnares/dsu002
Li, H., Sivasithamparam, K., and Barbetti, M. J. (2003). Breakdown of a Brassica rapa subsp. sylvestris single dominant blackleg resistance gene in B. napus rapeseed by Leptosphaeria maculans field isolates in Australia. Plant Dis. 87, 752. doi: 10.1094/PDIS.2003.87.6.752A
Liebrand, T. W. H., van den Burg, H. A., and Joosten, M. H. A. J. (2014). Two for all: receptor-associated kinases SOBIR1 and BAK1. Trends Plant Sci. 19, 123–132. doi: 10.1016/j.tplants.2013.10.003
Lipka, A. E., Tian, F., Wang, Q., Peiffer, J., Li, M., Bradbury, P. J., et al. (2012). GAPIT: genome association and prediction integrated tool. Bioinformatics 28, 2397–2399. doi: 10.1093/bioinformatics/bts444
Marcroft, S. J., Elliott, V. L., Cozijnsen, A. J., Salisbury, P. A., Howlett, B. J., and Van de Wouw, A. P. (2012). Identifying resistance genes to Leptosphaeria maculans in Australian Brassica napus cultivars based on reactions to isolates with known avirulence genotypes. Crop Pasture Sci. 63, 338–350. doi: 10.1071/CP11341
Marcroft, S. J., Purwantara, A., Salisbury, P., Potter, T. D., Wratter, N., Khangura, R., et al. (2002). Reaction of a range of Brassica species under Australian conditions to the fungus, Leptosphaeria maculans, the causal agent of blackleg. Aust. J. Exp. Agric. 42, 587–594. doi: 10.1071/EA01112
Mayerhofer, R., Wilde, K., Mayerhofer, M., Lydiate, D., Bansal, V. K., Good, A. G., et al. (2005). Complexities of chromosome landing in a highly duplicated genome: toward map-based cloning of a gene controlling blackleg resistance in Brassica napus. Genetics 171, 1977–1988. doi: 10.1534/genetics.105.049098
Meyers, B. C., Kozik, A., Griego, A., Kuang, H., and Michelmore, R. W. (2003). Genome-wide analysis of NBS-LRR-encoding genes in Arabidopsis. Plant Cell 15, 809–834. doi: 10.1105/tpc.009308
Mun, J. H., Yu, H. J., Park, S., and Park, B. S. (2009). Genome-wide identification of NBS-encoding resistance genes in Brassica rapa. Mol. Gen. Genet. 282, 617–631. doi: 10.1007/s00438-009-0492-0
Panjabi, P., Jagannath, A., Bisht, N. C., Padmaja, K. L., Sharma, S., and Gupta, V. (2008). Comparative mapping of Brassica juncea and Arabidopsis thaliana using Intron Polymorphism (IP) markers: homoeologous relationships, diversification and evolution of the A, B and C Brassica genomes. BMC Genomics 9:113. doi: 10.1186/1471-2164-9-113
Parkin, I. A. P., Gulden, S. M., Sharpe, A. G., Lukens, L., Trick, M., Osborn, T. C., et al. (2005). Segmental structure of the Brassica napus genome based on comparative analysis with Arabidopsis thaliana. Genetics 171, 765–781. doi: 10.1534/genetics.105.042093
Persson, M., Staal, J., Oid, S., and Dixelius, C. (2009). Layers of defense responses to Leptosphaeria maculans below the Rlm1 – and Camelexin – dependent resistances. New Phytol. 182, 470–482. doi: 10.1111/j.1469-8137.2009.02763.x
Price, A. L. (2006). Principal components analysis corrects for stratification in genome-wide association studies. Nat. Genet. 38, 904–909. doi: 10.1038/ng1847
R Development Core Team (2014). R: A Language and Environment for Statistical Computing. Vienna: R Foundation for Statistical Computing.
Raman, H., Dalton-Morgan, J., Diffey, S., Raman, R., Alamery, S., Edwards, D., et al. (2014a). SNP markers-based map construction and genome-wide linkage analysis in Brassica napus. Plant Biotechnol. J. 12, 851–860. doi: 10.1111/pbi.12186
Raman, H., Raman, R., Coombes, N., Song, J., Prangnell, R., Bandaranayake, C., et al. (2016). Genome-wide association analyses reveal complex genetic architecture underlying natural variation for flowering time in canola. Plant Cell Environ. 39, 1228–1239. doi: 10.1111/pce.12644
Raman, H., Raman, R., Kilian, A., Detering, F., Carling, J., Coombes, N., et al. (2014b). Genome-wide delineation of natural variation for pod shatter resistance in Brassica napus. PLoS ONE 9:e101673. doi: 10.1371/journal.pone.0101673
Raman, R., Diffey, S., Carling, J., Cowley, R., Kilian, A., Luckett, D., et al. (2016). Quantitative genetic analysis of yield in an Australian Brassica napus doubled haploid population. Crop Pasture Sci. 67, 298–307. doi: 10.1071/CP15283
Raman, H., Raman, R., Eckermann, P., Coombes, N., Manoli, S., Zou, X., et al. (2013a). Genetic and physical mapping of flowering time loci in canola (Brassica napus L.). Theor. Appl. Genet. 126, 119–132. doi: 10.1007/s00122-012-1966-8
Raman, H., Raman, R., and Larkan, N. (2013b). “Genetic dissection of blackleg resistance loci in rapeseed (Brassica napus L.),” in Plant Breeding from Laboratories to Fields, ed. S. B. Andersen (Rijeka: InTech).
Raman, H., Raman, R., Nelson, M. N., Aslam, M. N., Rajasekaran, R., Wratten, N., et al. (2012). Diversity array technology markers: genetic diversity analyses and linkage map construction in rapeseed (Brassica napus L.). DNA Res. 19, 51–65. doi: 10.1093/dnares/dsr041
Raman, R., Taylor, B., Lindbeck, K., Coombes, N., Barbulescu, D., Salisbury, P., et al. (2013). Molecular mapping and validation of Rlm1 genes for resistance to Leptosphaeria maculans in canola (Brassica napus L). Crop Pasture Sci. 63, 1007–1017. doi: 10.1071/CP12255
Raman, R., Taylor, B., Marcroft, S., Stiller, J., Eckermann, P., Coombes, N., et al. (2012). Molecular mapping of qualitative and quantitative loci for resistance to Leptosphaeria maculans; causing blackleg disease in canola (Brassica napus L.). Theor. Appl. Genet. 125, 405–418. doi: 10.1007/s00122-012-1842-6
Rimmer, S. R. (2006). Resistance genes to Leptosphaeria maculans in Brassica napus. Can. J. Plant Pathol. 28, S288–S297. doi: 10.1080/07060660609507386
Rouxel, T., Penaud, A., Pinochet, X., Brun, H., Gout, L., Delourme, R., et al. (2003). A 10-year survey of populations of Leptosphaeria maculans in France indicates a rapid adaptation towards the Rlm1 resistance gene of oilseed rape. Eur. J. Plant Pathol. 109, 871–881. doi: 10.1023/A:1026189225466
Roy, N. N. (1984). Interspecific transfer of Brassica juncea-type high blackleg resistance to Brassica napus. Euphytica 33, 295–303. doi: 10.1007/BF00021125
Sprague, S., Balesdent, M.-H., Brun, H., Hayden, H., Marcroft, S., Pinochet, X., et al. (2006). Major gene resistance in Brassica napus (oilseed rape) is overcome by changes in virulence of populations of Leptosphaeria maculans in France and Australia. Eur. J. Plant Pathol. 114, 33–40. doi: 10.1007/s10658-005-3683-5
Staal, J., and Dixelius, C. (2008). RLM3, a potential adaptor between specific TIR-NB-LRR receptors and DZC proteins. Commun. Integr. Biol. 1, 59–61. doi: 10.4161/cib.1.1.6394
Staal, J., Kaliff, M., Bohman, S., and Dixelius, C. (2006). Transgressive segregation reveals two Arabidopsis TIR-NB-LRR resistance genes effective against Leptosphaeria maculans, causal agent of blackleg disease. Plant J. 46, 218–230. doi: 10.1111/j.1365-313X.2006.02688.x
Staal, J., Kaliff, M., Dewaele, E., Persson, M., and Dixelius, C. (2008). RLM3, a TIR domain encoding gene involved in broad-range immunity of Arabidopsis to necrotrophic fungal pathogens. Plant J. 55, 188–200. doi: 10.1111/j.1365-313X.2008.03503.x
Stotz, H. U., Mitrousia, G. K., de Wit, P. J. G. M., and Fitt, B. D. L. (2014). Effector-triggered defence against apoplastic fungal pathogens. Trends Plant Sci. 19, 491–500. doi: 10.1016/j.tplants.2014.04.009
Tollenaere, R., Hayward, A., Dalton-Morgan, J., Campbell, E., Lee, J. R. M., Lorenc, M., et al. (2012). Identification and characterization of candidate Rlm4 blackleg resistance genes in Brassica napus using next-generation sequencing. Plant Biotechnol. J. 10, 709–715. doi: 10.1111/j.1467-7652.2012.00716.x
USDA (2016). Oilseeds: World Markets and Trade. Available at: http://www.ers.usda.gov/topics/crops/soybeans-oil-crops/canola.aspx
Van de Wouw, A. P., Marcroft, S. J., Ware, A., Lindbeck, K., Khangura, R., and Howlett, B. J. (2014). Breakdown of resistance to the fungal disease, blackleg, is averted in commercial canola (Brassica napus) crops in Australia. Field Crops Res. 166, 144–151. doi: 10.1016/j.fcr.2014.06.023
van Os, H., Stam, P., Visser, R., and Eck, H. (2006). RECORD: a novel method for ordering loci on a genetic linkage map. Theor Appl Genet. 112, 389–389. doi: 10.1007/s00122-005-0152-7
VanRaden, P. M. (2008). Efficient methods to compute genomic predictions. J. Dairy Sci. 91, 4414–4423. doi: 10.3168/jds.2007-0980
Wang, X., Chen, L., Wang, A., Wang, H., Tian, J., Zhao, X., et al. (2016). Quantitative trait loci analysis and genome-wide comparison for silique related traits in Brassica napus. BMC Plant Biol. 16:71. doi: 10.1186/s12870-016-0759-7
Wang, X., Wang, H., Wang, J., Sun, R., Wu, J., Liu, S., et al. (2011). The genome of the mesopolyploid crop species Brassica rapa. Nat. Genet. 43, 1035–1039. doi: 10.1038/ng.919
Young, N. D. (1996). QTL mapping and quantitative disease resistance in plants. Annu. Rev. Phytopathol. 34, 479–501. doi: 10.1146/annurev.phyto.34.1.479
Yu, F. Q., Gugel, R. K., Kutcher, H. R., Peng, G., and Rimmer, S. R. (2013). Identification and mapping of a novel blackleg resistance locus LepR4 in the progenies from Brassica napus x B-rapa subsp sylvestris. Theor. Appl. Genet. 126, 307–315. doi: 10.1007/s00122-012-1919-2
Yu, J., Tehrim, S., Zhang, F., Tong, C., Huang, J., Cheng, X., et al. (2014). Genome-wide comparative analysis of NBS-encoding genes between Brassica species and Arabidopsis thaliana. BMC Genomics 15:3. doi: 10.1186/1471-2164-15-3
Zander, M., Patel, D. A., Wouw, A. V. D., Lai, K., Lorenc, M. T., Campbell, E., et al. (2013). Identifying genetic diversity of avirulence genes in Leptosphaeria maculans using whole genome sequencing. Funct. Integr. Genomics 13, 295–308. doi: 10.1007/s10142-013-0324-5
Keywords: natural variation, resistance to L. maculans canola, genome-wide association analysis, linkage analysis, comparative mapping, blackleg, race-specific and race non-specific resistance
Citation: Raman H, Raman R, Coombes N, Song J, Diffey S, Kilian A, Lindbeck K, Barbulescu DM, Batley J, Edwards D, Salisbury PA and Marcroft S (2016) Genome-wide Association Study Identifies New Loci for Resistance to Leptosphaeria maculans in Canola. Front. Plant Sci. 7:1513. doi: 10.3389/fpls.2016.01513
Received: 09 July 2016; Accepted: 23 September 2016;
Published: 24 October 2016.
Edited by:
Maoteng Li, Huazhong University of Science and Technology, ChinaReviewed by:
Qing-Yong Yang, Huazhong Agricultural University, ChinaYan Long, Chinese Academy of Agricultural Sciences, China
Copyright © 2016 Raman, Raman, Coombes, Song, Diffey, Kilian, Lindbeck, Barbulescu, Batley, Edwards, Salisbury and Marcroft. This is an open-access article distributed under the terms of the Creative Commons Attribution License (CC BY). The use, distribution or reproduction in other forums is permitted, provided the original author(s) or licensor are credited and that the original publication in this journal is cited, in accordance with accepted academic practice. No use, distribution or reproduction is permitted which does not comply with these terms.
*Correspondence: Harsh Raman, harsh.raman@dpi.nsw.gov.au