 Zheng Xiao
 Xiaobo Sun
 Xiaoqing Liu
 Jiale Su
- Institute of Horticulture, Jiangsu Key Laboratory for Horticultural Crop Genetic Improvement, Jiangsu Academy of Agricultural Sciences, Nanjing, China
The quantitative real-time polymerase chain reaction (qRT-PCR) approach has become a widely used method to analyze expression patterns of target genes. The selection of an optimal reference gene is a prerequisite for the accurate normalization of gene expression in qRT-PCR. The present study constitutes the first systematic evaluation of potential reference genes in Rhododendron molle G. Don. Eleven candidate reference genes in different tissues and flowers at different developmental stages of R. molle were assessed using the following three software packages: GeNorm, NormFinder, and BestKeeper. The results showed that EF1-α (elongation factor 1-alpha), 18S (18s ribosomal RNA), and RPL3 (ribosomal protein L3) were the most stable reference genes in developing rhododendron flowers and, thus, in all of the tested samples, while tublin (TUB) was the least stable. ACT5 (actin), RPL3, 18S, and EF1-α were found to be the top four choices for different tissues, whereas TUB was not found to favor qRT-PCR normalization in these tissues. Three stable reference genes are recommended for the normalization of qRT-PCR data in R. molle. Furthermore, the expression profiles of RmPSY (phytoene synthase) and RmPDS (phytoene dehydrogenase) were assessed using EF1-α, 18S, ACT5, RPL3, and their combination as internals. Similar trends were found, but these trends varied when the least stable reference gene TUB was used. The results further prove that it is necessary to validate the stability of reference genes prior to their use for normalization under different experimental conditions. This study provides useful information for reliable qRT-PCR data normalization in gene studies of R. molle.
Introduction
Rhododendrons, which are commonly referred to as rosage, are decorative shrubs with beautiful flowers that are widespread around the world in countries characterized by mild climates (Chosson et al., 1998). While there is a remarkably broad range of rhododendron flower colors, such as red, pink, purple, and white, there is no yellow-flowered cultivar of evergreen rhododendron (Ureshino et al., 2016). The enhancement of yellow flowers is one of the most important breeding objectives in regards to evergreen rhododendrons. Rhododendron molle is a deciduous Rhododendron species with unique yellow flowers. Variations in the morphological characteristics and pigments of wild evergreen rhododendron flowers have been studied in detail (Miyajima et al., 2000; Nakatsuka et al., 2008; Mizuta et al., 2009; Ureshino et al., 2016). However, factors that regulate the flower pigmentation of R. molle are still unknown. Therefore, the study of expression patterns of some key genes involved in flower development at the molecular level will help improve our ability to breed desirable yellow-flowered evergreen rhododendrons.
Methods for detecting gene expression levels include the following: semi-RT-PCR, Northern blot, RNase protection analysis, in situ hybridization and quantitative real-time polymerase chain reaction (qRT-PCR). qRT-PCR is considered to be an efficient, sensitive and reliable technique for conducting simultaneous measurements of selected gene expressions in many different samples (Galli et al., 2015; Machado et al., 2015). Compared to conventional methods, qRT-PCR is the only method available for detecting mRNA levels of low copy number target genes of interest (Huggett et al., 2005). However, qRT-PCR involves the use of appropriate normalization methods to ensure reliable measurements of target gene expressions. One of the most popular methods used to normalize qRT-PCR data involves selecting optimal reference genes, which can control potential experimental errors. Ideal reference genes should be stable at the expression level under various experimental conditions (Banda et al., 2008). Generally speaking, genes that play key roles in the maintenance of basic cellular functioning are typically selected as reference genes [e.g., Tublin (TUB), elongation factor 1-α (EF1-α), glyceraldehydes-3-phosphate dehydrogenase (GAPDH), actin (ACT), and 18s ribosomal RNA (18S)]. The expression patterns of reference genes can vary among different species or for the same plant under different experimental conditions. For example, EF1-α is the most suitable reference gene among different tissues of Chinese cabbage (Qi et al., 2010), but it is not recommended as a suitable reference gene of Arabidopsis (Czechowski et al., 2005). Moreover, GAPDH was found to be the best reference gene according to Chinese cabbage experiments conducted under conditions of drought stress (Qi et al., 2010). It is thus absolutely vital to validate the stability of reference genes before selecting them for the normalization of qRT-PCR data under specific experimental conditions.
In R. simsii hybrids, GAPDH and maturase K have been used as reference genes to flower development (De Keyser et al., 2004). However, the stability of both genes has not been verified. Moreover, a few reference genes have been validated for flower petals of azalea due to limited sequence data available (Keyser et al., 2013). Validated qualitative RT-PCR protocols for R. molle are still rare. Thus, the identification of reliable reference genes for gene expression normalization will facilitate further studies on R. molle flower development and different tissues at the transcript level. In this study, the stability of eleven potential reference genes was identified in developing flowers and R. molle tissues. The expression profiles of eleven reference genes including ACT5, ACT7, EF1-α, elongation factor 1-gamma (EF1-γ), 18S, GAPDH, ubiquitin-conjugating enzyme E2 (UBC), TUB, NAC domain-containing protein (NAC), fatty acid desaturase (FAD), and ribosomal protein L3 (RPL3) were studied in seven different tissues and during six flower developmental stages. Expressions of these genes were evaluated using GeNorm (Vandesompele et al., 2002), BestKeeper (Pfaffl et al., 2004), and NormFinder (Andersen et al., 2004). Moreover, R. molle phytoene synthase (RmPSY) and R. molle phytoene dehydrogenase (RmPDS) are the main genes that control the biosynthesis of carotenoid content, which is involved in flower yellow biosynthesis. Expression patterns of RmPSY and RmPDS were investigated using the selected references, which may serve as a valuable resource for future association studies aimed at better understanding molecular mechanisms that drive flower pigmentation in R. molle.
Materials and Methods
Plant Materials
Rhododendron molle was obtained from a Rhododendron garden managed by the Jiangsu Academy of Agricultural Sciences. Seven different tissues, including flowers, new leaves, mature leaves, petioles, roots, stems and seeds were collected, frozen immediately in liquid nitrogen and stored in a -80°C freezer prior to use. Samples of flowers at six developmental stages were collected in 2016 as follows: March 9 (flower buds 2–5 mm in diameter), March 12 (flower buds 5–10 mm in diameter), March 15 (unfold-petal stage), March 18 (initial-flowering stage), March 21 (full-flowering stage), and March 24 (flower-wilting stage).
RNA Isolation and Reverse Transcription
Total RNA was extracted using an EASYspin plus Plant RNA out RN28 kit (Ailab Technology Company, Beijing, China). The integrity of total RNA was determined by denaturing 1.0% agarose gel electrophoresis. RNA concentrations were determined using a Nanodrop 1000 spectrophotometer (Thermo, Wilmington, DE, USA). First strand cDNA synthesis was performed using a PrimeScript 1st Strand cDNA Synthesis Kit (TaKaRa, Dalian, China). The cDNA products were diluted 20 times.
Primer Design and PCR Conditions
Two target genes and eleven reference genes were selected from the transcriptome of R. molle. The gene sequences are stored in GenBank (Table 1). Primers of the eleven reference genes and two target genes were designed through the Primer 3 program1. qRT-PCR was performed on cDNA, and their products were analyzed via electrophoresis on 2.0% agarose gel to determine primer features.
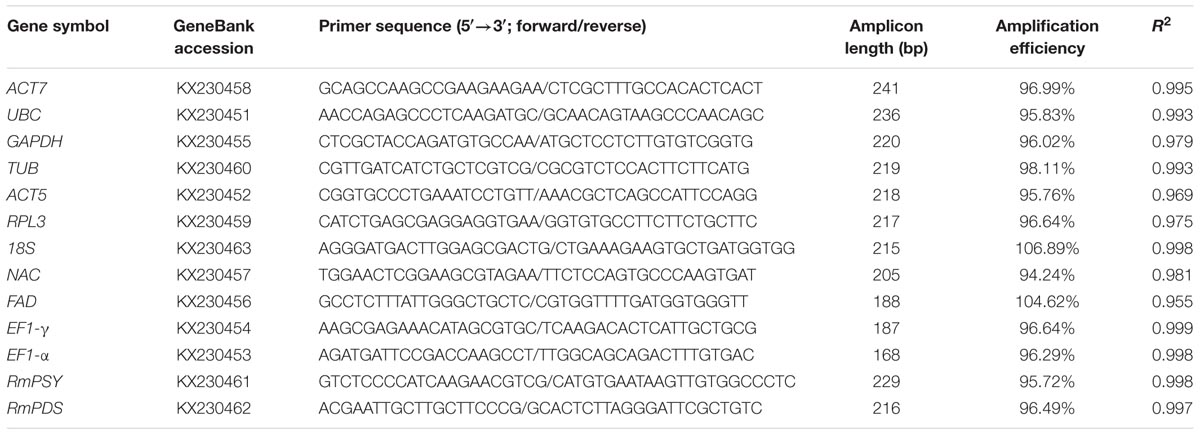
TABLE 1. Candidate reference genes and different parameters derived from the qRT-PCR analysis.
Quantitative real-time polymerase chain reaction reactions were performed using a 7,500 Real-Time PCR system (Applied Biosystems, Carlsbad, CA, USA). In a white 96-well plate (Axygen, Union City, CA, USA), 10 μL of SYBR Premix Ex Taq (TaKaRa, Dalian, China) and 0.4 μL of 10 μM forward primer and reverse primer was used in combination with 2 μL of cDNA, resulting in a total volume of 20 μL. Cycling conditions involved 10 s at 95°C followed by 40 cycles of 5 s 95°C and 34 s 60°C. A melting dissociation curve was created to identify amplicon characteristics. The final threshold cycle values were average values. Each reaction was performed in triplicate.
Gene Stability Analysis
Standard curves were used to determine the gene-specific PCR efficiency level from a 10-fold dilution of the mixed cDNA template for each primer pair. Correlation coefficients (R2) and slope values were obtained from the standard curve, and corresponding PCR amplification efficiencies (E) were determined according to the following equation: E = (10-1/slope-1) × 100 (Radonić et al., 2004).
Reference gene expression stability was statistically analyzed based on the results obtained from the following three Excel-based software programs: GeNorm (Vandesompele et al., 2002), NormFinder and BestKeeper (Andersen et al., 2004; Pfaffl et al., 2004). The GeNorm program was used to calculate the expression stability value (M) for reference genes based on the pairwise variation. Stable expression genes were characterized with lower M values. The BestKeeper program uses an index for the evaluation of expression stability that is calculated based on standard deviation (SD) and percentage covariance (CV) values (Sang et al., 2013). The NormFinder program can determine degrees of variance within and between groups, and the gene with the lowest stability value is ranked as the best.
Results
Primer Specificity, RNA Integrity, Reference Gene Candidate, and PCR Amplification Efficiency Verification
Eleven reference genes were selected from the transcriptome of R. molle and two other genes were obtained (Table 1). High quality of the RNA samples is critical for a successful qRT-PCR. The results showed that ratio value of 260/280 nm wavelength between 1.8 and 2.1, and 260/230 nm wavelength higher than 2.0. The degradation of the RNA was minimal (Figure 1A). Melting temperatures (Tm) of all of the PCR products ranged from 81.2°C for RPL3 to 86.7°C for UBC. The amplification efficiency of PCR reactions varied from 94.24% for NAC to 106.89% for 18S, and correlation coefficients (R2) ranged from 0.955 for FAD to 0.999 for EF1-γ (Table 1). Amplifications were confirmed based on the presence of single fragments of an expected size during 2.0% agarose gel electrophoresis (Figure 1B). Furthermore, only one distinctive peak was found in the melting curves, indicating that no primer dimmers were generated from non-specific amplification (Figure 1C).
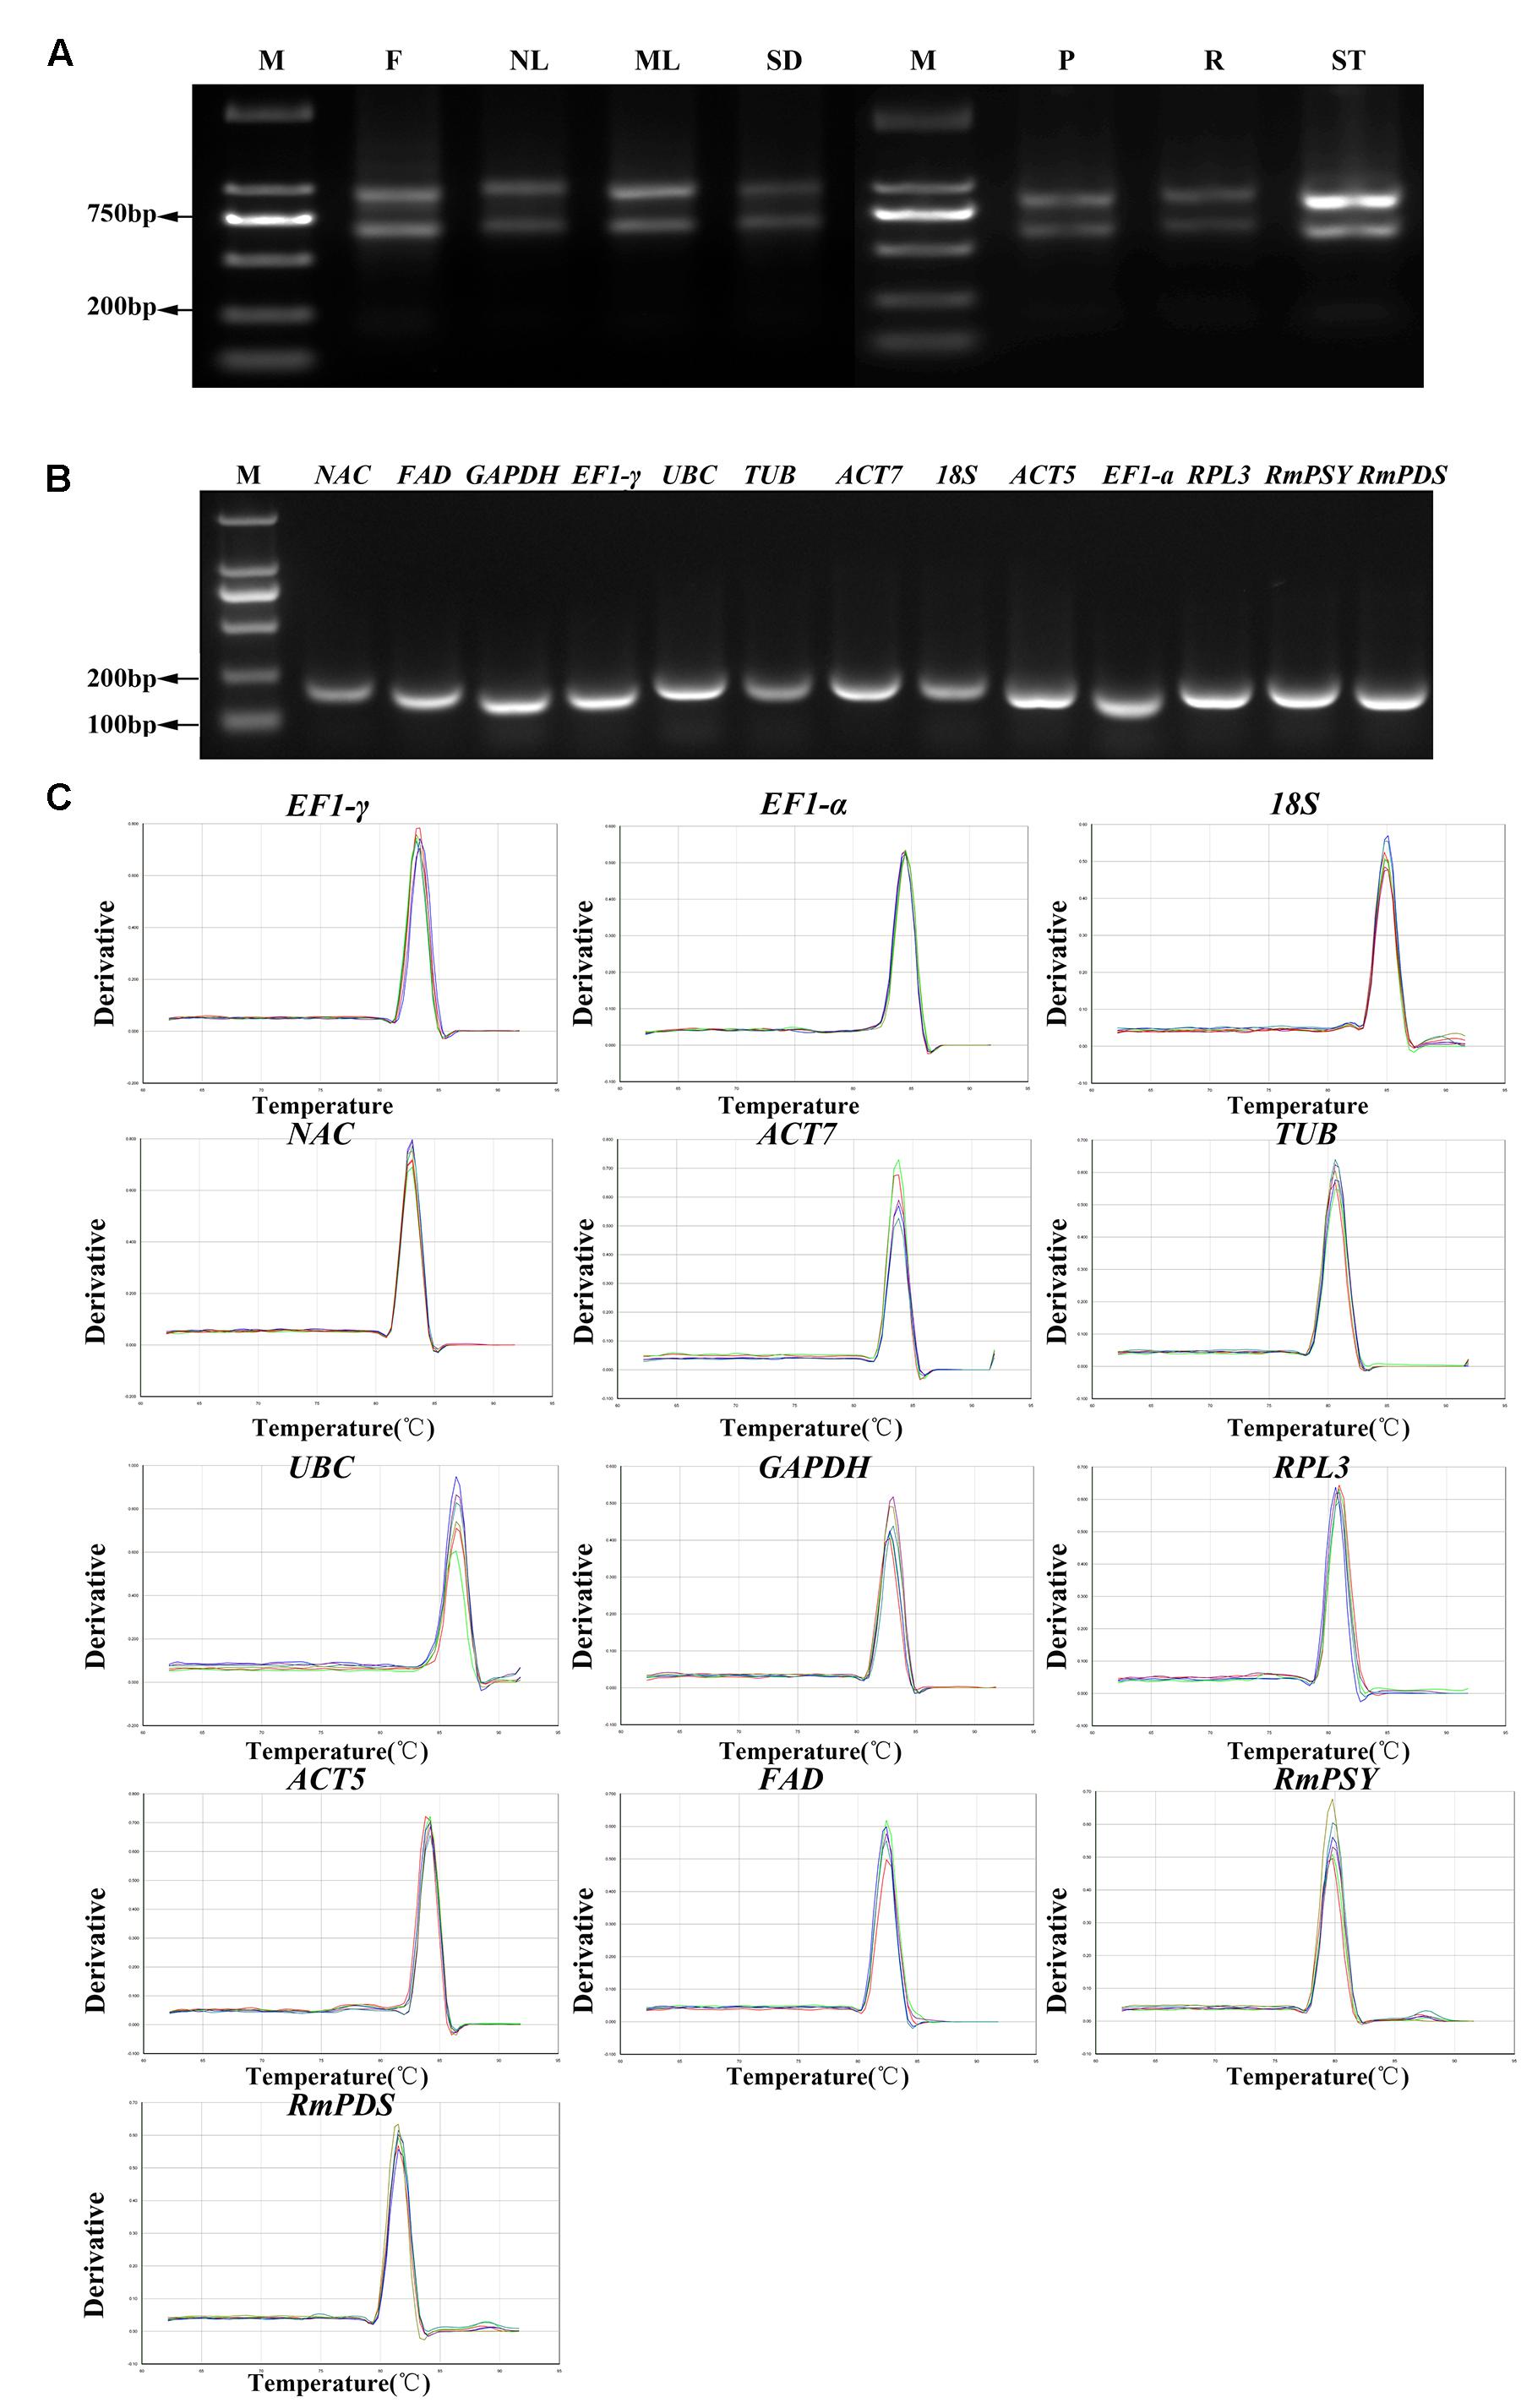
FIGURE 1. RNA extraction, confirmation of gene specificity and amplicon size. (A) The integrity of RNA samples were determined by electrophoresis on agarose gel. F, flowers; NL, new leaves; ML, mature leaves; SD, seeds; P, petioles; R, roots; ST, stems. (B) Agarose gel showing qRT-PCR products for each gene with the expected size. (C) Melting curves of 13 genes with a single peak. M denotes the 2,000 bp DNA marker.
Cycle threshold (Ct) values were calculated to determine transcript levels of the reference gene in the tested samples. The eleven reference genes exhibited a relatively broad degree of transcript level dispersal. Average Ct vales ranged from 15.57 for EF1-α to 26.28 for ACT7 (Figure 2). EF1-α with narrow variance was found to be the most common reference transcript and ACT7 was identified as the least common. The coefficient of variance (CV) of Ct values can determine reference gene stability levels. GAPDH presented a high degree of transcript level variation with a CV value of 8.59% while NAC presented the lowest degree of variation with a CV value of 3.57%.
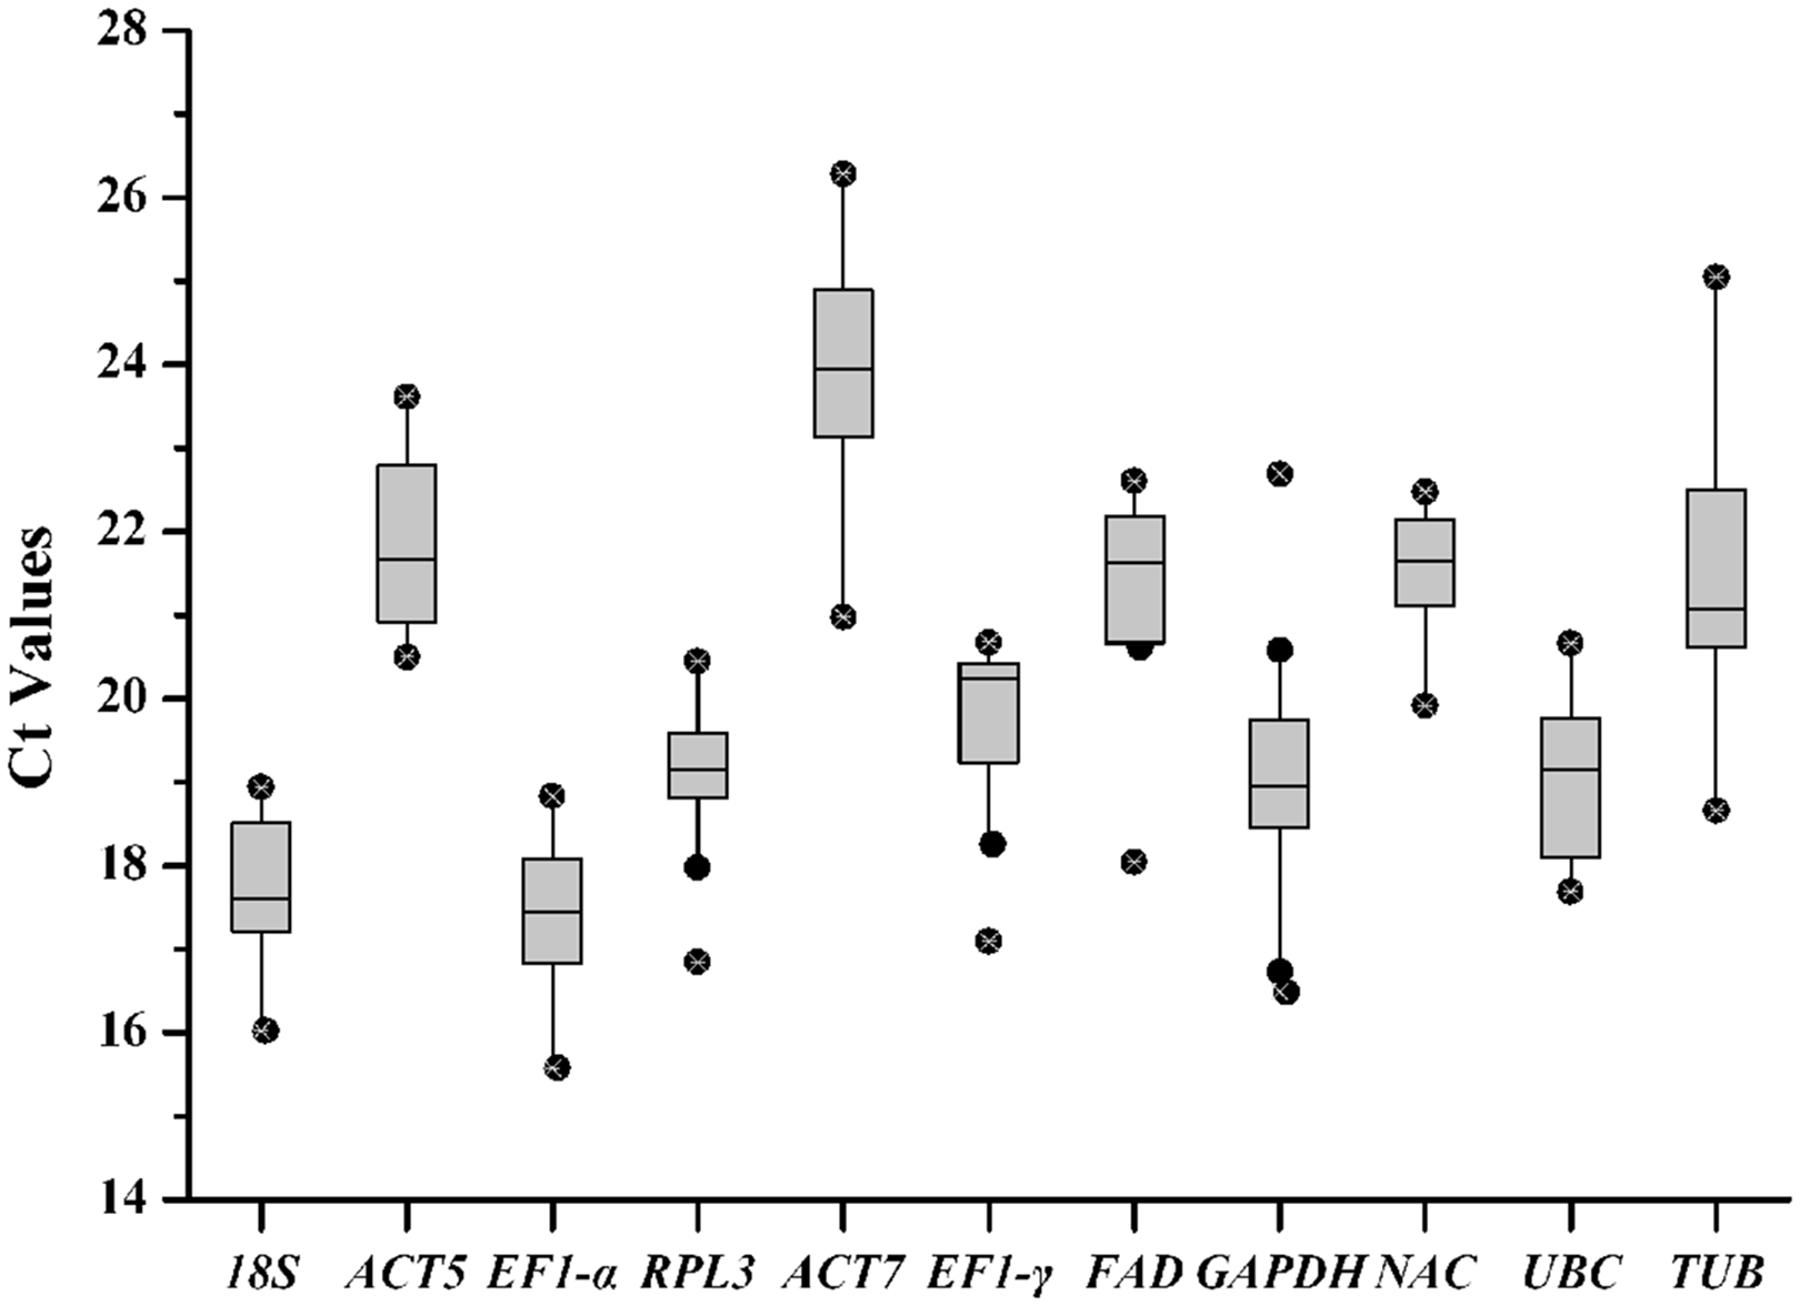
FIGURE 2. Quantitative real-time polymerase chain reaction Ct values for reference genes. Ct values for each reference gene in all of the R. molle samples. A line across the box denotes the median. The box denotes the 25 and 75% percentiles, whisker caps represent maximum and minimum values, and dots represent outliers.
GeNorm Analysis
GeNorm was used to select an ideal pair of reference genes by calculating gene expression stability values M based on the average pairwise expression ratio. Genes with low M values were characterized as the most stable reference genes (Vandesompele et al., 2002). The program guidelines recommend using M values falling below a threshold of 1.5 to identify ideal reference genes with stable expression. Our analysis showed that the M values of all eleven genes were lower than 1.5, indicating that they all conformed to basic requirements for the reference gene (Figure 3). ACT5 and RPL3 were the most stable genes found in the seven tissues with the lowest M value (0.40), and TUB was the least stable gene with the lowest M value (1.24) (Figure 3A). For the flower samples representing six different developmental stages, 18S and RPL3 showed the highest levels of expression stability and the lowest M value (0.42), and TUB was the least stable gene with the lowest M value (1.11) (Figure 3B). Meanwhile, 18S and RPL3 were found to be the most stable genes, and TUB was found to be the least stable gene in all of the samples (Figure 3C). Overall, RPL3, 18S, EF1-α, and ACT5 showed relatively higher degrees of stability with lower M values while TUB presented the lowest levels of stability.
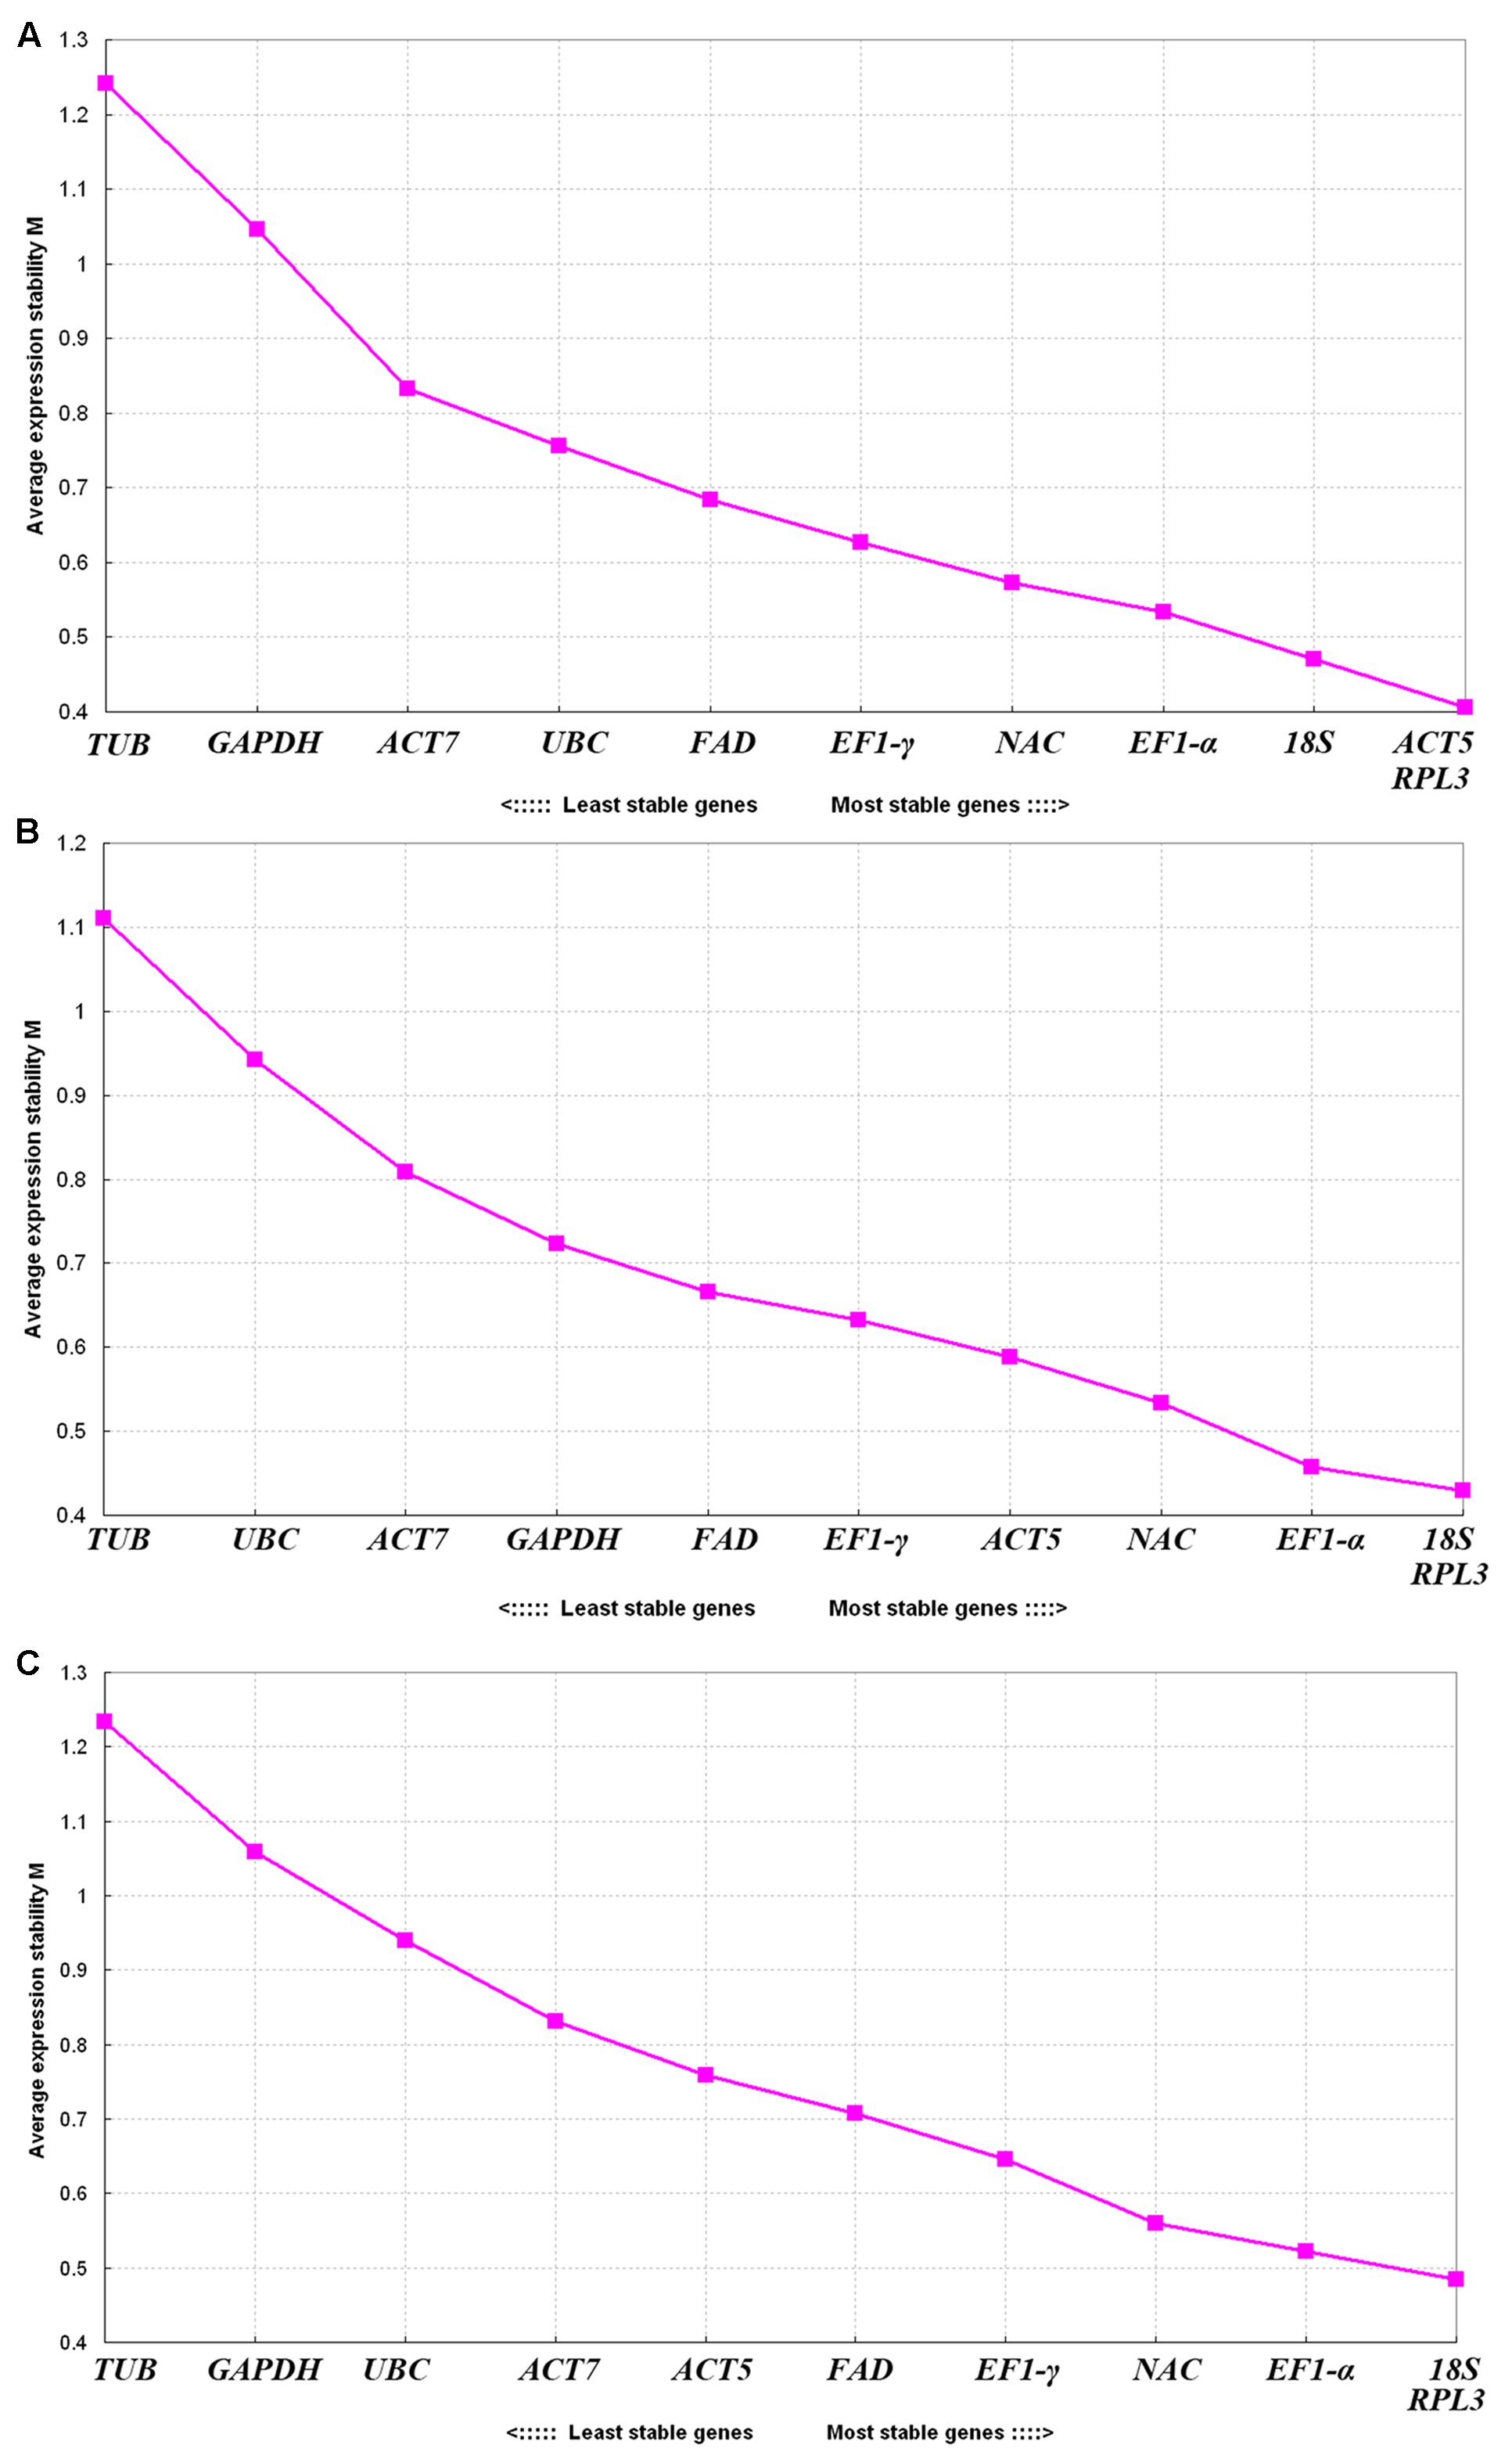
FIGURE 3. Expression stability values (M) of eleven reference genes calculated through GeNorm. (A) Different tissues, (B) flower samples of different developmental stages, and (C) all samples. Lower average expression stability levels (M value) denote more stable expression.
The optimal number of reference genes was determined by determining the pairwise variation (Vn/Vn+1) between two sequential normalization factors (NFn and NFn+1) through GeNorm (Figure 4). Generally speaking, 0.15 was used as a cutoff value to determine the optimal number of reference genes (Vandesompele et al., 2002; Pfaffl et al., 2004). In seven tissue sample sets, the paired variable coefficient for different tissues showed that two stable genes (V2/3 > 0.15) were deficient in determining variations of the normalization factor, whereas three stable reference genes (ACT5, RPL3, and 18S; V3/4 < 0.15) were found to be sufficient for normalizing gene expression (Figure 4A). When the flower samples of six developmental stages were tested, all pairwise variations except for V10/11 (0.164) fell below the cutoff value (0.15) (Figure 4B), thus indicating that one reference gene was sufficient for normalization. For all of the samples, V2/3 (0.161) was higher than the given threshold (0.15), and the other pairwise variations except for V10/11 (0.173) were lower than 0.15 (Figure 4C), thus showing that a third internal gene was required to normalize gene expression.
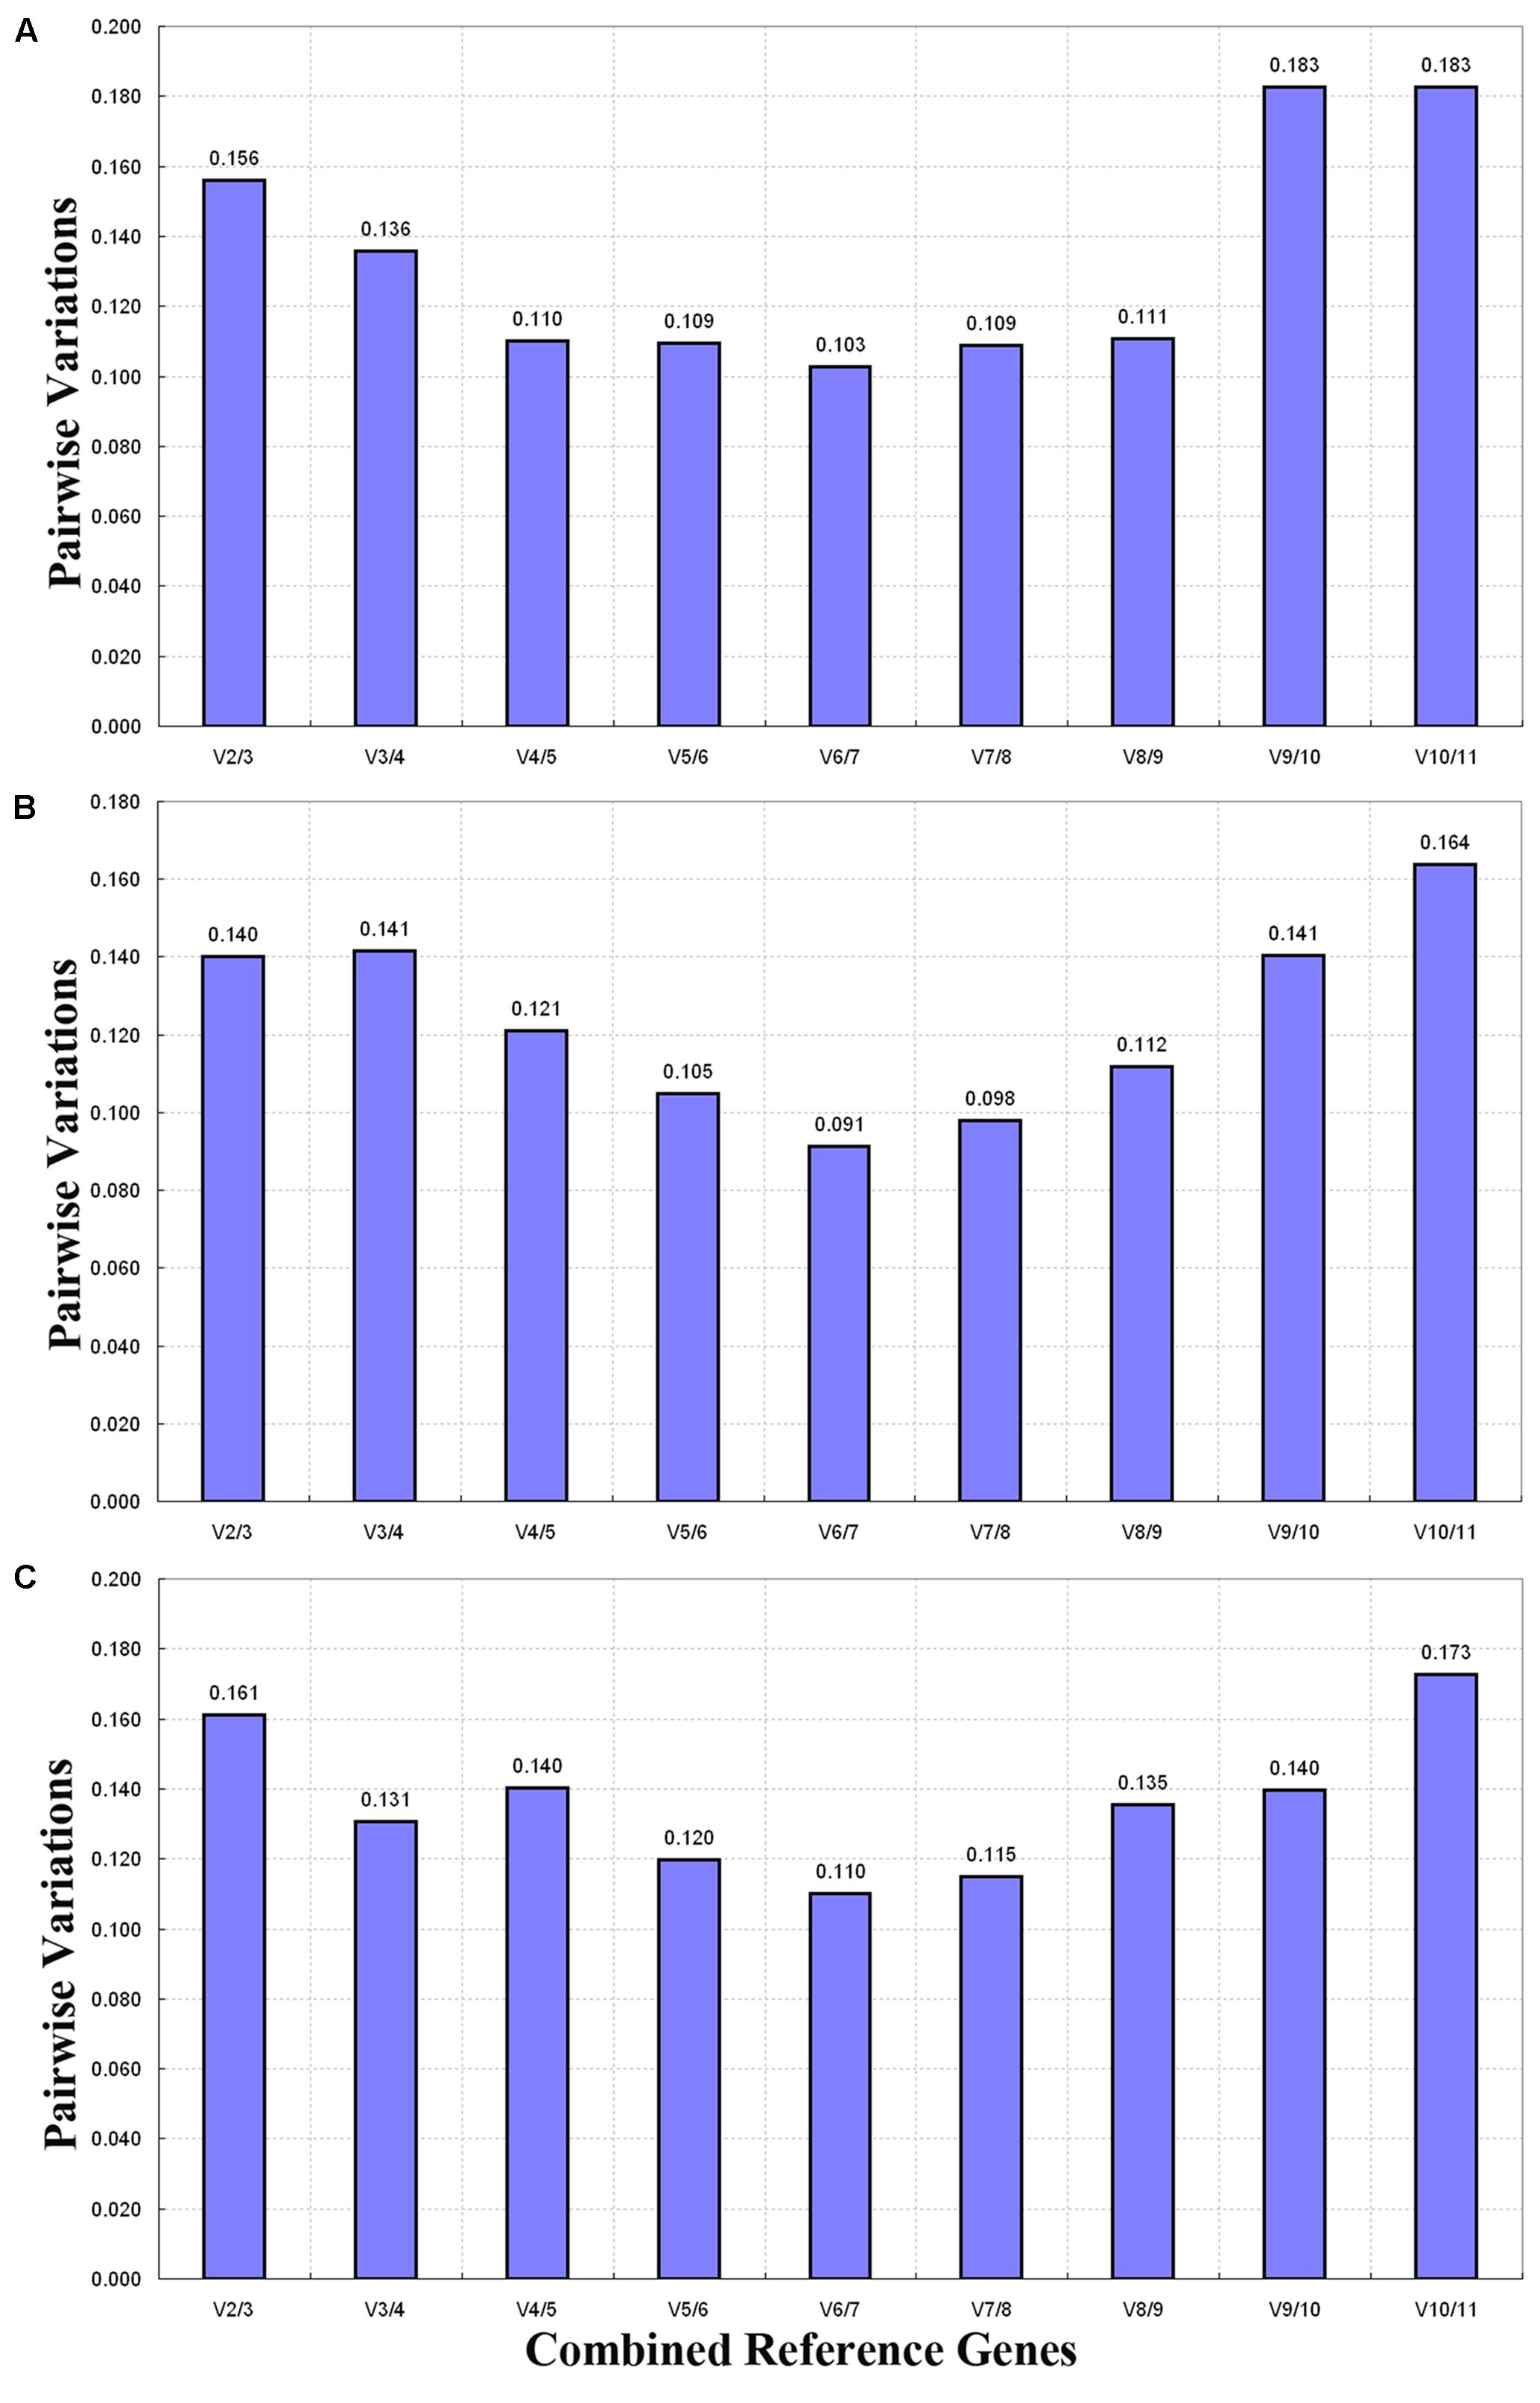
FIGURE 4. Pairwise variation (V) calculated through GeNorm to determine the optimal number of reference genes. The average pairwise variation (Vn/Vn+1) between normalization factors NFn and NFn+1was analyzed to determine the optimal number of reference genes required for qRT-PCR data normalization in different samples. (A) Different tissues, (B) flower samples of different developmental stages, and (C) all samples.
NormFinder Analysis
NormFinder ranks candidate genes based on the average pairwise variation in a gene relative to other candidate genes (Han et al., 2012). The stable gene generated lower average expression stability values (Andersen et al., 2004). Gene stability values were determined using NormFinder as shown in Table 2. ACT5 and RPL3 were ranked by NormFinder as the most stable genes in the seven tissues (Table 2). EF1-α and RPL3 were ranked as the most stable genes in all of the samples owing to their low stability values. This result is consistent with the results determined through GeNorm. When considering the flower samples of six developmental stages, the stability ranking of the eleven candidate genes drawn from the NormFinder program showed somewhat different values from those drawn from GeNorm as follows: EF1-α and ACT5 were ranked consistently through GeNorm, whereas RPL3 and 18S were omitted from the list of most stable genes. Like the GeNorm program, NormFinder characterized TUB as the least stable gene.
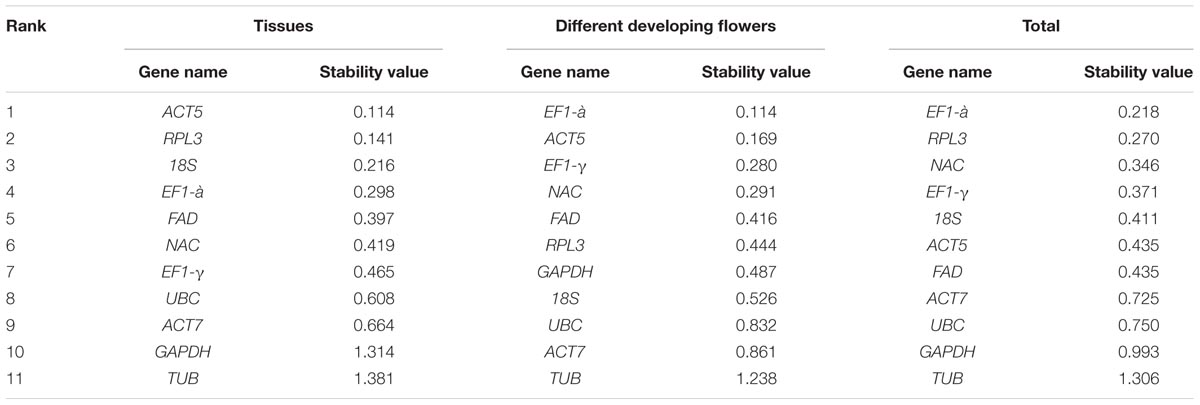
TABLE 2. Ranking of candidate reference genes by expression stability levels determined via NormFinder.
BestKeeper Analysis
BestKeeper is used to evaluate the expression stability of reference genes based on the coefficient of correlation (r) of the BestKeeper index based on SD and CV values (Pfaffl et al., 2004). The BestKeeper analysis showed that the best correlations were obtained for EF1-α (0.936), FAD (0.919), and RPL3 (0.909) for all of the samples (Table 3). For the different tissues, EF1-α (0.914), RPL3 (0.902), 18S (0.843), and ACT5 (0.799) showed the highest correlations, which is consistent with results drawn from GeNorm and NormFinder. When considering the flower samples of different growth phases, BestKeeper analyses revealed few differences among results produced by the three programs. Overall, EF1-α showed a strong correlation with the BestKeeper index in all of the experimental sets consistent with the corresponding GeNorm and NormFinder results. Therefore, EF1-α is recommended as the ideal reference gene for normalization.
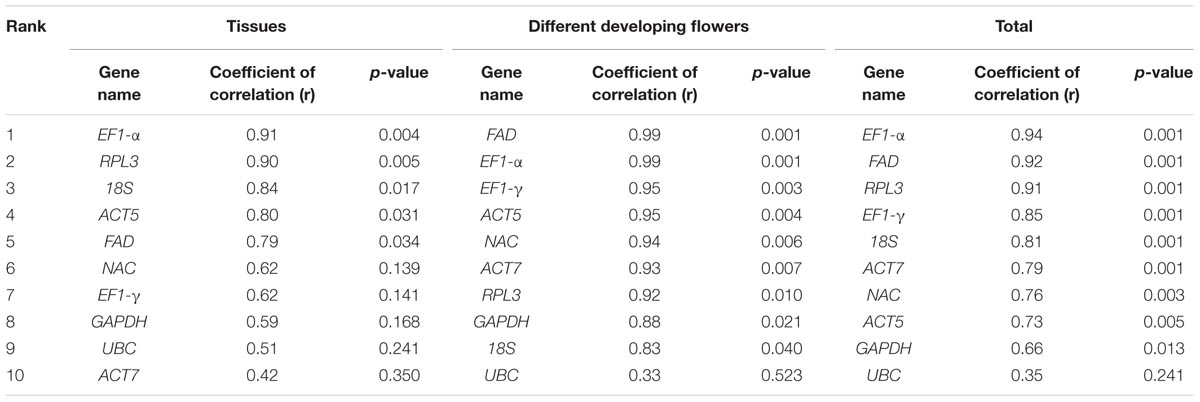
TABLE 3. Expression stability values of ten selected genes determined through BestKeeper.
Reference Gene Validation
Optimal reference genes should have a significant effect on final normalized results. To determine the effects of reference genes on experimental results and to validate the stability of reference genes, expression patterns of two functional genes (RmPSY and RmPDS) occupying different stages of flower development were evaluated using different reference genes (EF1-α, ACT5, 18S, and RPL3). The expression patterns of RmPSY and RmPDS showed low levels of expression during earlier stages of flower development (March 9 and 12) and reached to maximum expression levels during later stages (March 21). The expression profiles of the two target genes showed similar trends when stable reference genes were used (EF1-α, ACT5, 18S, and RPL3) (Figure 5). When TUB was used as an internal gene, the highest expression level of the target genes was reached at an earlier stage (March 15), contradicting the other stable reference gene results. This showed that the least stable gene TUB failed to standardize the expression data effectively.
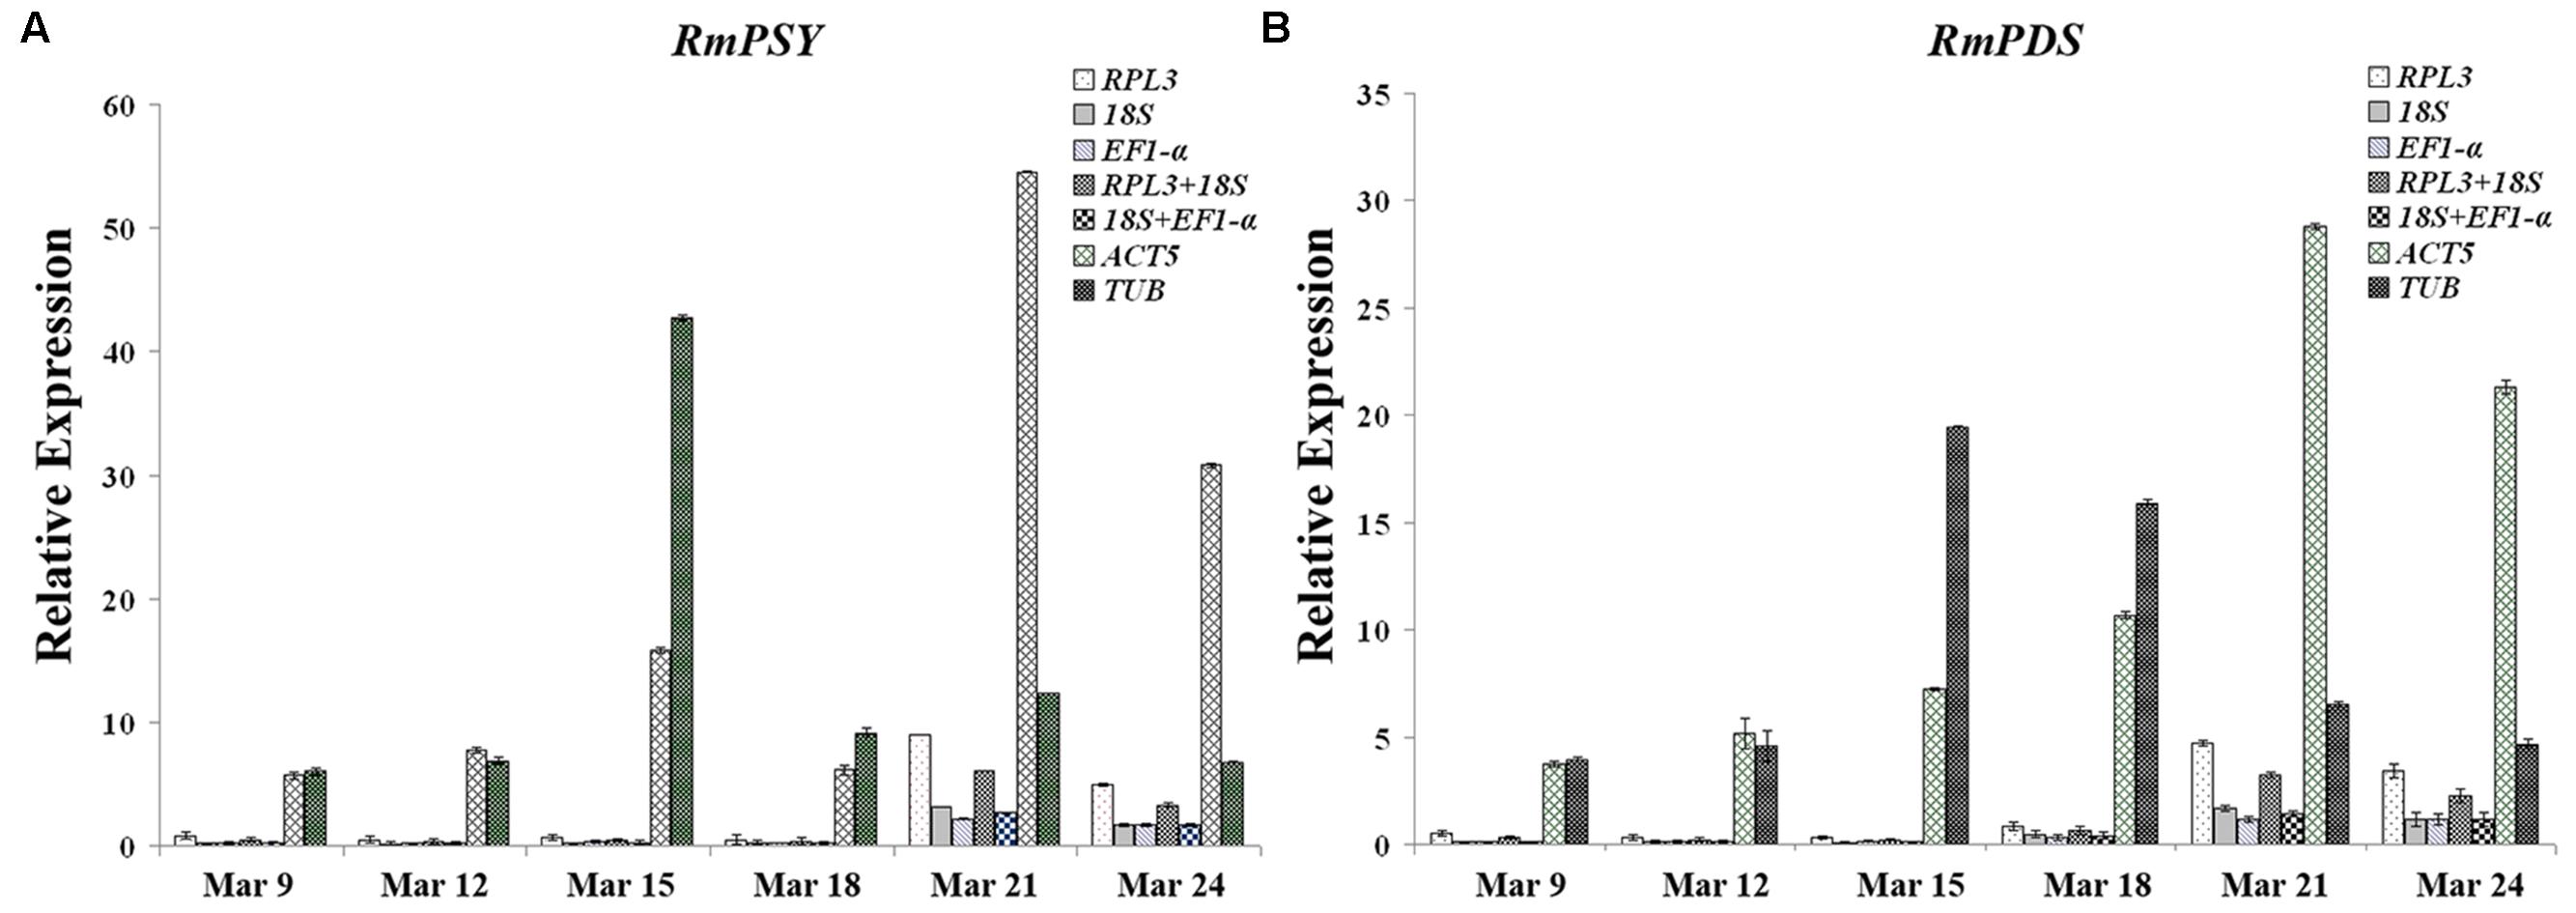
FIGURE 5. Expression levels of RmPSY and RmPDS throughout the flower development of R. molle. (A) Expression levels of RmPSY at different stages of flower development. (B) Expression levels of RmPDS at different stages of flower development. Genes were normalized to different reference genes. Error bars show the standard error calculated from three biological replicates.
Discussion
The quantitative real-time PCR approach has become a key method of gene expression profiling owing to its accuracy, sensitivity, and efficiency (Jacobsen et al., 2016; Sgamma et al., 2016; Song et al., 2016). It is crucial for selecting reference genes that are stably expressed amongst treatment groups in real-time quantitative PCR gene expression studies. A good reference gene should maintain invariable expression levels in different tissues, organs and developmental stages and under various experimental conditions (Chapman and Waldenström, 2015). Therefore, the selection of reference genes that are stably expressed across different samples can improve the accuracy and reliability of results obtained through qRT-PCR (Radonić et al., 2004).
The GeNorm program was used to determine the stability of a candidate gene by pairwise comparison, and the NormFinder and BestKeeper programs were used to prevent co-regulation and to further assess the analysis results obtained from the GeNorm program (Cruz et al., 2009; Zhao et al., 2011). From the GeNorm evaluation, we found that RPL3, 18S, and EF1-α are the most stable reference genes in all of the samples examined (Figure 3). Ribosomal genes are often found to serve as good housekeeping genes, as they carry out the biogenesis of new ribosomes and are expressed in all cells (Hsiao et al., 2001). Thus, RPL3, which encodes ribosomal protein L3, is known to be the most reliable gene in seedlings and anther-regenerated plants of different ploidy of Dendrocalamus latiflorus Munro (Liu et al., 2014). EF1-α also presents stable expression patterns in water lily tissues (Luo et al., 2010) darnel ryegrass (Martin et al., 2008), grape berries (Reid et al., 2006), and cucumbers (Wan et al., 2009). Moreover, EF1-α shows stable expression in potato and soybean plants (Nicot et al., 2005; Jian et al., 2008). However, EF1-α is not recommended as a suitable reference gene in Arabidopsis and Moso bamboo (Czechowski et al., 2005; Fan et al., 2013). In addition, 18S, ACT, TUB, and GAPDH are commonly used as traditional reference genes in qRT-PCR assays (Niu et al., 2015; Reddy et al., 2015). 18S is the most suitable stability gene for different organs and growth stages (Xu et al., 2016), but it is less stable in broomrape tissues (González-Verdejo et al., 2008) and peaches (Tong et al., 2009). ACT7 presents the most stable expression across pear (Xu et al., 2015) and tung samples that have been examined (Han et al., 2012), but it is not suitable as a reference gene in A. thaliana (Remans et al., 2008). GAPDH and ACT11 are the two top-ranked reference genes in seedlings of Panax ginseng treated with heat (Wang and Lu, 2016). In the present study, ACT7, GAPDH, and TUB were found to be unstable. 18S and ACT5 were also ranked first in terms of stable reference genes across all of the R. molle samples examined. These results show that reference genes should be reconfirmed according to experimental conditions or plant species.
One reference gene is typically used in qRT-PCR data normalization (Suzuki et al., 2000). However, it has been insufficient to select only one reference gene in some gene expression studies (Veazey and Golding, 2011). GeNorm guidelines recommend that a cutoff value of 0.15 is used to determine the optimal number of reference genes (Han et al., 2012). In the three experiment sets, all pairwise variations of V3/4 fell below 0.15 (Figure 4). This shows that a combination of three reference genes is sufficient for the normalization of qRT-PCR data obtained from different tissues of R. molle or flower samples.
Rhododendron molle phytoene synthase and RmPDS were found to be the main genes controlling the biosynthesis of carotenoid content and were found to be involved in the flower yellow biosynthesis of R. molle (Nisar et al., 2015). To validate the suitability of the reference genes, the expression profiles of RmPSY and RmPDS were assessed in the different flower samples usingEF1-α, 18S, RPL3, ACT5, TUB, and a combination of these as internal controls. As a result, RPL3/18S and 18S/EF1-α were selected as optimum pairs of reference genes for qRT-PCR data normalization for different flower samples of R. molle. The expression profiles of RmPSY and RmPDS showed low degrees of expression in earlier stages of flower development (March 9 and 12) and reached maximum expression levels during later stages (March 21). The expression patterns of the two target genes showed similar trends when stable reference genes EF1-α, 18S, and RPL3 or a combination of stable reference genes were used (Figure 5). The relative transcript abundance presented conflicting results when the least stable gene, TUB, was used as an internal control. Therefore, the incorrect use of reference genes can lead to the misinterpretation of data. Moreover, the two most stable gene pairs can serve as internal controls in gene expression studies of different flower samples of R. molle.
Conclusion
This is the first study to conduct a systematic exploration of R. molle to validate candidate reference genes for qRT-PCR normalization in various tissues or flower samples of different developmental stages. Eleven housekeeping genes were assessed. EF1-α, RPL3, 18S, and ACT5 were identified as optimum internal control genes in different tissues of R. molle and different flower samples. Furthermore, expression profiles of RmPSY and RmPDS were used to validate the suitability of the reference genes selected in this study. The results show that expression profiles normalized by the most stable reference gene (EF1-α, 18S, RPL3, ACT5) were similar but became obscured when the least stable reference gene (TUB) was used. These results present useful information for reliable qRT-PCR data normalization in R. molle gene expression studies.
Author Contributions
Conceived and designed the experiments: ZX and JS. Performed the experiments: ZX. Analyzed the data: ZX, JS, XS, and XL. Revised the final version of the paper: CL, LH, and SC. Approved the final version of the paper: ZX and JS.
Funding
This work was supported by the National Natural Science Foundation of China (Grant No.: 31600570), National Science and Technology Program (2013BAD01B070403), Jiangsu Natural Science Foundation (BK20150548), and Jiangsu Agriculture Science and Technology Innovation Fund of China (cx(14)2026).
Conflict of Interest Statement
The authors declare that the research was conducted in the absence of any commercial or financial relationships that could be construed as a potential conflict of interest.
Acknowledgment
The authors give great thanks to the editor and four anonymous reviewers for careful reading and many helpful comments.
Footnotes
References
Andersen, C. L., Jensen, J. L., and Orntoft, T. F. (2004). Normalization of real-time quantitative reverse transcription-PCR data: a model-based variance estimation approach to identify genes suited for normalization, applied to bladder and colon cancer data sets. Cancer Res. 64, 5245–5250. doi: 10.1158/0008-5472.CAN-04-0496
Banda, M., Bommineni, A., Thomas, R., Luckinbill, L., and Tucker, J. (2008). Evaluation and validation of housekeeping genes in response to ionizing radiation and chemical exposure for normalizing RNA expression in real-time PCR. Mutat. Res. 649, 126–134. doi: 10.1016/j.mrgentox.2007.08.005
Chapman, J. R., and Waldenström, J. (2015). With reference to reference genes: a systematic review of endogenous controls in gene expression studies. PLoS ONE 10:e0141853. doi: 10.1371/journal.pone.0141853
Chosson, E., Chaboud, A., Chulia, A. J., and Rayhaud, J. (1998). Dihydroflavonol glycosides from Rhododendron ferrugineum. Phytochemistry 49, 1431–1433. doi: 10.1016/S0031-9422(98)00080-6
Cruz, F., Kalaoun, S., Nobile, P., Colombo, C., Almeida, J., Barros, L. M. G., et al. (2009). Evaluation of coffee reference genes for relative expression studies by quantitative real-time RT-PCR. Mol. Breed. 23, 607–616. doi: 10.1007/s11032-009-9259-x
Czechowski, T., Stitt, M., Altmann, T., Udvardi, M. K., and Scheible, W. R. (2005). Genome-wide identification and testing of superior reference genes for transcript normalization in Arabidopsis. Plant Physiol. 139, 5–17. doi: 10.1104/pp.105.063743
De Keyser, E., De Riek, J., and Van Bockstaele, E. (2004). Optimisation of relative quantitative RT-PCR for expression analysis in azalea flower colour sports. Acta Hortic. 651, 91–96. doi: 10.17660/ActaHortic.2004.651.9
Fan, C., Ma, J., Guo, Q., Li, X., Wang, H., and Lu, M. (2013). Selection of reference genes for quantitative real-time PCR in bamboo (Phyllostachys edulis). PLoS ONE 8:e56573. doi: 10.1371/journal.pone.0056573
Galli, V., Borowski, J., Perin, E., Messias, R., Labonde, J., Pereira, I., et al. (2015). Validation of reference genes for accurate normalization of gene expression for real time-quantitative PCR in strawberry fruits using different cultivars and osmotic stresses. Gene 554, 205–214. doi: 10.1016/j.gene.2014.10.049
González-Verdejo, C. I., Die, J. V., Nadal, S., Jiménez-Marín, A., Moreno, M. T., and Román, B. (2008). Selection of housekeeping genes for normalization by real-time RT-PCR: analysis of Or-MYB1 gene expression in Orobanche ramosa development. Anal. Biochem. 379, 176–181. doi: 10.1016/j.ab.2008.05.003
Han, X., Lu, M., Chen, Y., Zhan, Z., Cui, Q., and Wang, Y. (2012). Selection of reliable reference genes for gene expression studies using real-time PCR in tung tree during seed development. PLoS ONE 7:e43084. doi: 10.1371/journal.pone.0043084
Hsiao, L., Dangond, F., Yoshida, T., Hong, R., Jensen, R. V., Misra, J., et al. (2001). A compendium of gene expression in normal human tissues. Physiol. Genomics 7, 97–104. doi: 10.1152/physiolgenomics.00040.2001
Huggett, J., Dheda, K., Bustin, S., and Zumla, A. (2005). Real-time RT-PCR normalisation; strategies and considerations. Genes Immun. 6, 279–284. doi: 10.1038/sj.gene.6364190
Jacobsen, K. S., Nielsen, K. O., Winther, T. N., Glebe, D., Pociot, F., and Hogh, B. (2016). Identification of valid reference genes for microRNA expression studies in a hepatitis B virus replicating liver cell line. BMC Res. Notes 9:38. doi: 10.1186/s13104-016-1848-2
Jian, B., Liu, B., Bi, Y., Hou, W., Wu, C., and Han, T. (2008). Validation of internal control for gene expression study in soybean by quantitative real-time PCR. BMC Mol. Biol. 9:59. doi: 10.1186/1471-2199-9-59
Keyser, E. D., Desmet, L., Bockstaele, E. V., and Riek, J. D. (2013). How to perform RT-qPCR accurately in plant species? A case study on flower colour gene expression in an azalea (Rhododendron simsii hybrids) mapping population. BMC Mol. Biol. 14:13. doi: 10.1186/1471-2199-14-13
Liu, M., Jiang, J., Han, X., Qiao, G., and Zhuo, R. (2014). Validation of reference genes aiming accurate normalization of qRT-PCR data in Dendrocalamus latiflorus Munro. PLoS ONE 9:e87417. doi: 10.1371/journal.pone.0087417
Luo, H., Chen, S., Wan, H., Chen, F., Gu, C., and Liu, Z. (2010). Candidate reference genes for gene expression studies in water lily. Anal. Biochem. 404, 100–102. doi: 10.1016/j.ab.2010.05.002
Machado, R., Christoff, A., Loss-Morais, G., Margis-Pinheiro, M., Margis, R., and Körbes, A. (2015). Comprehensive selection of reference genes for quantitative gene expression analysis during seed development in Brassica napus. Plant Cell Rep. 34, 1139–1149. doi: 10.1007/s00299-015-1773-1
Martin, R. C., Hollenbeck, V. G., and Dombrowski, J. E. (2008). Evaluation of reference genes for quantitative RT-PCR in Lolium perenne. Crop Sci. 48, 1881–1887. doi: 10.2135/cropsci2007.10.0597
Miyajima, I., Ureshino, K., Kobayashi, N., and Akabane, M. (2000). Flower color and pigments of intersubgeneric hybrid between white-flowered evergreen and yellow-flowered deciduous azaleas. J. Jpn. Soc. Hortic. Sci. 69, 280–282. doi: 10.2503/jjshs.69.280
Mizuta, D., Ban, T., Miyajima, I., Nakatsuka, A., and Kobayashi, N. (2009). Comparison of flower color with anthocyanin composition patterns in evergreen azalea. Sci. Hortic. 122, 594–602. doi: 10.1016/j.scienta.2009.06.027
Nakatsuka, A., Mizuta, D., Kii, Y., Miyajima, I., and Kobayashi, N. (2008). Isolation and expression analysis of flavonoid biosynthesis genes in evergreen azalea. Sci. Hortic. 118, 314–320. doi: 10.1016/j.scienta.2008.06.016
Nicot, N., Hausman, J., Hoffmann, L., and Evers, D. (2005). Housekeeping gene selection for real-time RT-PCR normalization in potato during biotic and abiotic stress. J. Exp. Bot. 56, 2907–2914. doi: 10.1093/jxb/eri285
Nisar, N., Li, L., Lu, S., Khin, N. C., and Pogson, B. J. (2015). Carotenoid metabolism in plants. Mol. Plant 8, 68–82. doi: 10.1016/j.molp.2014.12.007
Niu, X., Qi, J., Zhang, G., Xu, J., Tao, A., Fang, P., et al. (2015). Selection of reliable reference genes for quantitative real-time PCR gene expression analysis in Jute (Corchorus capsularis) under stress treatments. Front. Plant Sci. 6:848. doi: 10.3389/fpls.2015.00848
Pfaffl, M. W., Tichopad, A., Prgomet, C., and Neuvians, T. P. (2004). Determination of stable housekeeping genes, differentially regulated target genes and sample integrity: BestKeeper-Excel-based tool using pair-wise correlations. Biotechnol. Lett. 26, 509–515. doi: 10.1023/B:BILE.0000019559.84305.47
Qi, J., Yu, S., Zhang, F., Shen, X., Zhao, X., Yu, Y., et al. (2010). Reference gene selection for real-time quantitative polymerase chain reaction of mRNA transcript levels in Chinese cabbage (Brassica rapa L. ssp. pekinensis). Plant Mol. Biol. Rep. 28, 597–604. doi: 10.1007/s11105-010-0185-1
Radonić, A., Thulke, S., Mackay, I. M., Landt, O., Siegert, W., and Nitsche, A. (2004). Guideline to reference gene selection for quantitative real-time PCR. Biochem. Biophys. Res. Commun. 313, 856–862. doi: 10.1016/j.bbrc.2003.11.177
Reddy, P. S., Reddy, D. S., Sharma, K. K., Bhatnagar-Mathur, P., and Vadez, V. (2015). Cloning and validation of reference genes for normalization of gene expression studies in pearl millet (Pennisetum glaucum (L.) R. Br.) by quantitative real-time PCR. Plant Gene 1, 35–42. doi: 10.1016/j.plgene.2015.02.001
Reid, K. E., Olsson, N., Schlosser, J., Peng, F., and Lund, S. T. (2006). An optimized grapevine RNA isolation procedure and statistical determination of reference genes for real-time RT-PCR during berry development. BMC Plant Biol. 6:27. doi: 10.1186/1471-2229-6-27
Remans, T., Smeets, K., Opdenakker, K., Mathijsen, D., Vangronsveld, J., and Cuypers, A. (2008). Normalisation of real-time RT-PCR gene expression measurements in Arabidopsis thaliana exposed to increased metal concentrations. Planta 227, 1343–1349. doi: 10.1007/s00425-008-0706-4
Sang, J., Han, X., Liu, M., Qiao, G., Jiang, J., and Zhuo, R. (2013). Selection and validation of reference genes for real-time quantitative PCR in hyperaccumulating ecotype of Sedum alfredii under different heavy metals stresses. PLoS ONE 8:e82927. doi: 10.1371/journal.pone.0082927
Sgamma, T., Pape, J., Massiah, A., and Jackson, S. (2016). Selection of reference genes for diurnal and developmental time-course real-time PCR expression analyses in lettuce. Plant Methods 12, 1–9. doi: 10.1186/s13007-016-0121-y
Song, L., Li, T., Fan, L., Shen, X., and Hou, C. (2016). Identification and evaluation of reliable reference genes in the medicinal fungus Shiraia bambusicola. Curr. Microbiol. 72, 444–449. doi: 10.1007/s00284-015-0972-x
Suzuki, T., Higgins, P. J., and Crawford, D. R. (2000). Control selection for RNA quantitation. Biotechniques 29, 332–337.
Tong, Z., Gao, Z., Wang, F., Zhou, J., and Zhang, Z. (2009). Selection of reliable reference genes for gene expression studies in peach using real-time PCR. BMC Mol. Biol. 10:71. doi: 10.1186/1471-2199-10-71
Ureshino, K., Nakayama, M., and Miyajima, I. (2016). Contribution made by the carotenoid cleavage dioxygenase 4 gene to yellow colour fade in azalea petals. Euphytica 207, 401–417. doi: 10.1007/s10681-015-1557-2
Vandesompele, J., Preter, K. D., Pattyn, F., Poppe, B., Roy, N. V., Paepe, A. D., et al. (2002). Accurate normalization of real-time quantitative RT-PCR data by geometric averaging of multiple internal control genes. Genome Biol. 3, research0031–research0034. doi: 10.1186/gb-2002-3-7-research0034
Veazey, K. J., and Golding, M. C. (2011). Selection of stable reference genes for quantitative RT-PCR comparisons of mouse embryonic and extra-embryonic stem cells. PLoS ONE 6:e27592. doi: 10.1371/journal.pone.0027592
Wan, H., Zhao, Z., Qian, C., Sui, Y., Malik, A. A., and Chen, J. (2009). Selection of appropriate reference genes for gene expression studies by quantitative real-time polymerase chain reaction in cucumber. Anal. Biochem. 399, 257–261. doi: 10.1016/j.ab.2009.12.008
Wang, M., and Lu, S. (2016). Validation of suitable reference genes for quantitative gene expression analysis in Panax ginseng. Front. Plant Sci. 6:1259. doi: 10.3389/fpls.2015.01259
Xu, X., Liu, X., Chen, S., Li, B., Wang, X., Fan, C., et al. (2016). Selection of relatively exact reference genes for gene expression studies in flixweed (Descurainia sophia) by quantitative real-time polymerase chain reaction. Pestic. Biochem. Physiol. 127, 59–66. doi: 10.1016/j.pestbp.2015.09.007
Xu, Y., Li, H., Li, X., Lin, J., Wang, Z., Yang, Q., et al. (2015). Systematic selection and validation of appropriate reference genes for gene expression studies by quantitative real-time PCR in pear. Acta Physiol. Plant. 37, 1–16. doi: 10.1007/s11738-015-1784-0
Keywords: Rhododendron, qRT-PCR, flower, reference gene, normalization
Citation: Xiao Z, Sun X, Liu X, Li C, He L, Chen S and Su J (2016) Selection of Reliable Reference Genes for Gene Expression Studies on Rhododendron molle G. Don. Front. Plant Sci. 7:1547. doi: 10.3389/fpls.2016.01547
Received: 20 May 2016; Accepted: 03 October 2016;
Published: 18 October 2016.
Edited by:
Roger Deal, Emory University, USAReviewed by:
Ai-Sheng Xiong, Nanjing Agricultural University, ChinaZhezhi Wang, National Engineering Laboratory for Resource Development of Endangered Crude Drugs in Northwest of China, China
Copyright © 2016 Xiao, Sun, Liu, Li, He, Chen and Su. This is an open-access article distributed under the terms of the Creative Commons Attribution License (CC BY). The use, distribution or reproduction in other forums is permitted, provided the original author(s) or licensor are credited and that the original publication in this journal is cited, in accordance with accepted academic practice. No use, distribution or reproduction is permitted which does not comply with these terms.
*Correspondence: Jiale Su, sjle66@sina.com