 Peng-Cheng Fu
 Qing-Bo Gao1
- 1Key Laboratory of Adaptation and Evolution of Plateau Biota, Northwest Institute of Plateau Biology, Chinese Academy of Sciences, Xining, China
- 2College of Life Science, Luoyang Normal University, Luoyang, China
- 3College of Life Science, University of Chinese Academy of Sciences, Beijing, China
Studying closely related species and divergent populations provides insight into the process of speciation. Previous studies showed that the Sibiraea complex's evolutionary history on the Qinghai-Tibetan Plateau (QTP) was confusing and could not be distinguishable on the molecular level. In this study, the genetic structure and gene flow of Sibiraea laevigata and Sibiraea angustata on the QTP was examined across 45 populations using 8 microsatellite loci. Microsatellites revealed high genetic diversity in Sibiraea populations. Most of the variance was detected within populations (87.45%) rather than between species (4.39%). We found no significant correlations between genetic and geographical distances among populations. Bayesian cluster analysis grouped all individuals in the sympatric area of Sibiraea into one cluster and other individuals of S. angustata into another. Divergence history analysis based on the approximate Bayesian computation method indicated that the populations of S. angustata at the sympatric area derived from the admixture of the 2 species. The assignment test assigned all individuals to populations of their own species rather than its congeneric species. Consistently, intraspecies were detected rather than interspecies first-generation migrants. The bidirectional gene flow in long-term patterns between the 2 species was asymmetric, with more from S. angustata to S. laevigata. In conclusion, the Sibiraea complex was distinguishable on the molecular level using microsatellite loci. We found that the high genetic similarity of the complex resulted from huge bidirectional gene flow, especially on the sympatric area where population admixtures occurred. This study sheds light on speciation with gene flow in the QTP.
Introduction
Understanding the effect of gene flow in genetic evolution could shed light on speciation (Slatkin, 1987; Smadja and Butlin, 2011). During population divergence, gene flow is absent in the “allopatric speciation” model (Hoskin et al., 2005) but evident in the “sympatric speciation” model (Smadja and Butlin, 2011). Since gene flow constrains population differentiation and is thereby often regarded as a constraining force in evolution, speciation in the face of gene flow is generally considered difficult (Slatkin, 1987; Coyne and Orr, 2004). Nonetheless, multiple examples of speciation with gene flow now indicates that speciation with gene flow may be common (Nosil, 2008; Fitzpatrick et al., 2009; Duncan et al., 2016). Additionally, gene flow between subpopulations can maintain high levels of diversity within each subpopulation (Epps et al., 2005).
Gene flow among populations can be estimated using population genetic analyses (Pearse and Crandall, 2004; Hey, 2006) through patterns of shared genetic variation detected by molecular techniques (Cowen and Sponaugle, 2009). Genetic differentiation between distinct lineages can be quickly and easily determined by DNA fragment sequences (e.g., DNA barcodes) for multiple individuals (Mallet, 1995). Although, DNA fragment sequences revealed numerous cryptic species lacking morphological differentiation in both animals and plants (Myers et al., 2013; Su et al., 2015), they sometimes fail when groups are closely related species, let alone evolutionary complex. At present, simple sequence repeats (SSR) are widely used to characterize divergence among closely related species (e.g., Surget-Groba and Kay, 2013; Yan et al., 2015; Duncan et al., 2016). Here we present the first evidence of gene flow in a plant species complex in the Qinghai-Tibetan Plateau (QTP) based on SSR loci.
As the largest and highest plateau, with an average elevation of >4000 m, the QTP has received a great deal of attention from botanists. The QTP uplift significantly changed the climate and environment of Asia (Zhang et al., 2000; Zheng et al., 2002). Additionally, Pleistocene climate change played an important role in shaping geographical patterns of intraspecific genetic diversity (Hewitt, 2000, 2004; Qiu et al., 2011; Liu et al., 2012). The QTP uplift also affected glacial environments; therefore, species in the QTP were probably more affected by Quaternary glaciations than those in other regions of the world at similar latitude (Zhang et al., 2000). During Pleistocene glaciations, the spread of large ice sheets affected species at high to mid-latitudes (Willis and Niklas, 2004) and fragmented geographical distributions of many species. This fragmentation promoted conditions favorable for allopatric divergence among isolated populations and, potentially, speciation (Wen et al., 2014). Mountains in the QTP with the potential to act as barriers to movement can result in genetic structures ranging from panmixia (Lessios et al., 2003) to complete separation (Baums et al., 2012). Therefore, species on the QTP likely experienced an evolution history different from other areas of the world (Liu et al., 2014; Wen et al., 2014).
Sibiraea angustata (Rehder) Hand.-Mazz. and Sibiraea laevigata (L.) Maxim. (Rosaceae) are the 2 common Sibiraea species in the QTP (Gu and Alexander, 2003). Preliminary analyses of chromosome numbers confirmed that they are diploid species (2n = 18; Fu et al., 2016). Although morphologically similar, they can be distinguished by the pubescent peduncles and pedicels of S. angustata and the glabrous peduncles and pedicels in S. laevigata. Furthermore, S. laevigata has a much smaller distribution area and is less abundant in the QTP than S. angustata, with which it is always sympatric in the QTP. Field work showed that both species are outcrossing, exhibit identical flowering times, and have a number of light seeds with wings (Fu et al., 2016). This phylogeographic study based on chloroplast (cp) DNA and internal transcribed spacer (ITS) sequences also indicated the high genetic similarity of the 2 species, and classified complex individuals into 3 clades: the Northern, the Central, and the Southern. However, these clades failed to correspond to the different species. Sibiraea laevigata shared all its haplotypes with S. angustata, and phylogenetic analysis failed to distinguish them. Therefore, these previous studies raised 2 important questions concerning their genetic similarity: (i) Whether the complex could be genetically distinguished using microsatellite loci and (ii) What the reason was for the high genetic similarity and whether gene flow contributed to it. This study addresses these questions through genetic variation analysis based on 8 unlinked microsatellite loci.
Materials and Methods
Study Area and Sampling
We used 33 and 12 populations of S. angustata and S. laevigata, respectively, with a total of 681 individuals from 33 sites throughout the QTP (Fu et al., 2016; Figure 1). Voucher individuals were deposited in the Qinghai-Tibetan Plateau Museum of Biology, Northwest Institute of Plateau Biology, Chinese Academy of Sciences.
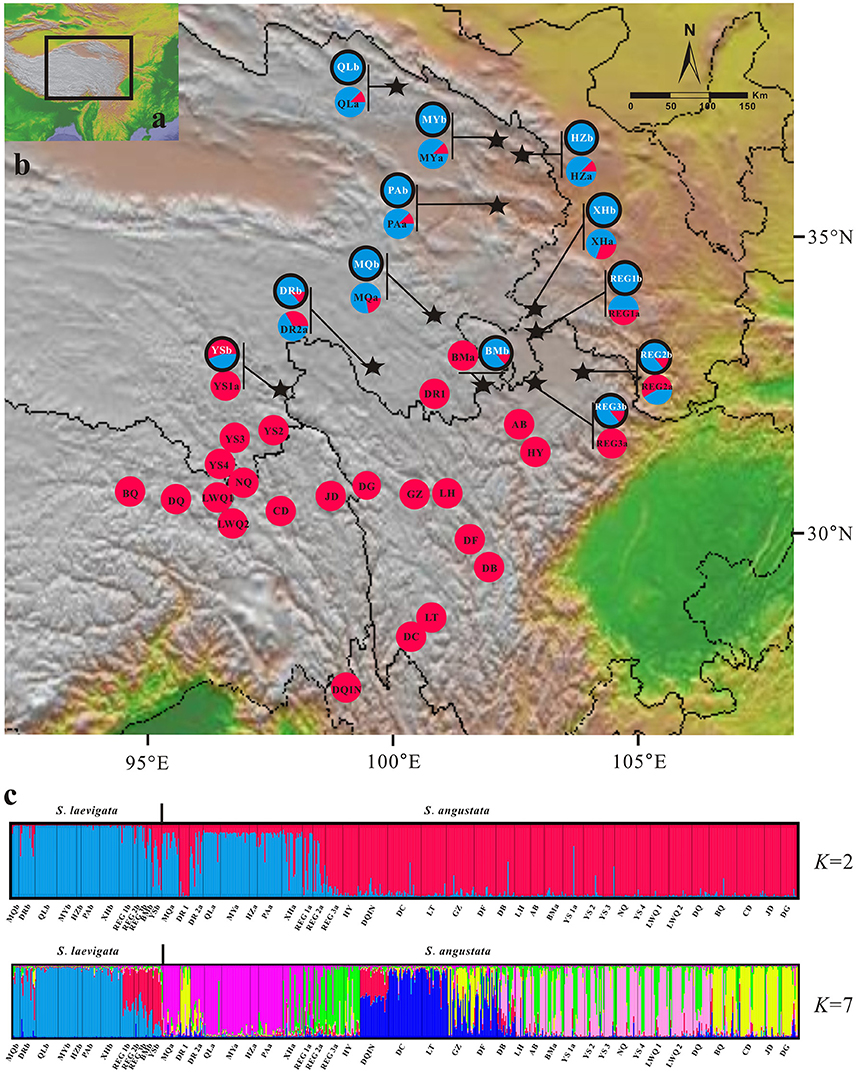
Figure 1. Genetic structure of Sibiraea populations in the Qinghai-Tibetan Plateau. (A) Sampling area; (B) Genetic structure of Sibiraea populations based on K = 2 genetic clusters; (C) Proportional membership of 55 Sibiraea populations to K = 2 and 7 genetic clusters. Individuals are represented by a single vertical column divided into 2 or 7 (= K) colors. The relative length of the colored segment corresponds to the individual's estimated proportion of membership in that cluster.
Amplification and Microsatellite Genotyping
For this study, we used the 8 microsatellite loci (SS3, SS11, SS16, SS37, SS40, SS43, SS53, and SS54) described by Arranz et al. (2013). PCR reactions were performed in a 15 μl reaction volume containing 10–100 ng of template DNA, 1 × PCR Buffer, 2 mM of MgCl2, 0.5 μM of each dNTPs, 0.2 μM of each primer, and 1 U of Taq DNA polymerase (Takara, China). The reaction profile included an initial denaturation at 95°C for 5 min, followed by 36 cycles of initial denaturation at 95°C for 50 s, an annealing temperature of 53°C for 50 s, extension at 72°C for 30 s, and a final extension step at 72°C for 7 min. We analyzed amplified fragments using the QIAxcel DNA High Resolution cartridge and method OM800 on the QIAxcel Advanced System (QIAGEN, Germany). Allele sizing was performed using QIAxcel ScreenGel software version 1.0.2.0 (QIAGEN, Germany) by comparing alleles with a molecular alignment marker (10 and 600 bp, QIAGEN) and size marker (25–500 bp, QIAGEN).
Genetic Variation, Hardy–Weinberg, and Linkage Equilibrium
The presence of null alleles, scoring errors, and large allele dropout were checked using MICROCHECKER version 2.2.3 (Van Oosterhout et al., 2004). Tests of departure from Hardy-Weinberg equilibrium (HWE) and genotypic linkage disequilibrium (LD) were carried out using Genepop version 4.0.10 (Rousset, 2008). We calculated gene diversity according to Nei (1987), and observed heterozygosity (HO), expected heterozygosity (HE), and pairwise FST using ARLEQUIN version 3.5 (Excoffier and Lischer, 2010). Through these methods, we determined the private alleles, i.e., the number of unique alleles in a population relative to the overall number of alleles in that species. Lastly, the fixation index FIS was determined using FSTAT version 2.9.3.2 (Goudet, 2001) within and across populations.
Population Genetic Structure
The genetic structure among populations and individuals was investigated using the Bayesian clustering algorithm implemented in STRUCTURE version 2.3.1 (Pritchard et al., 2000). We ran 10 independent replicates testing for 1–12 clusters (K) using both species' samples. Each run started with a burn-in of 100,000 followed by 1 million iterations. The most likely true value of K was determined using the method proposed by Pritchard et al. (2000) and using the second rate of change in the likelihood distribution (ΔK; Evanno et al., 2005). To develop a consensus value for K, independent runs of all data sets were averaged in CLUMPP v.1.1.2 (Jakobsson and Rosenberg, 2007) using the Greedy algorithm with 10,000 repeats. Graphical representation was performed using DISTRUCT version 1.1 (Rosenberg, 2004). Genetic isolation by distance was determined using IBDWS version 3.23 (Isolation by Distance Web Service, Jensen et al., 2005). Rousset's distance FST/(1-FST) was regressed against log-geographical distance and tested for significance using the Mantel test with 10,000 permutations.
Demographic History
To test alternative hypotheses that could explain the genetic similarity between S. laevigata and S. angustata samples, we conducted an approximate Bayesian computation (ABC) analysis (Beaumont, 2010). The ABC analyses were conducted using DIYABC 2.0 (Cornuet et al., 2014). We assumed populations of Sibiraea as 3 subpopulations. The first one (named LA) contained S. laevigata populations, the second (named ANS) contained S. angustata populations that were sympatric with S. laevigata, and the third (named ANR) contained the remaining S. angustata populations. A total of 3 evolutionary scenarios were compared (Figure 2). Scenario 1 assumed that an ancestral population of size NA split t2 generations ago into 2 daughter populations, LA and ANR, of effective sizes N1 and N3, respectively; ANS was constituted at t1 generations ago by migrants from LA and ANR at rates r and 1–r, respectively (Figure 2A). In contrast, Scenario 2 assumed that an ancestral population split t2 generations ago into 2 daughter populations, where one was LA and the other split t1 generations ago into ANS and ANR (Figure 2A). Lastly, Scenario 3 is similar to Scenario 2, wherein ANR was first split from the ancestral population t2 generations ago (Figure 2A). The prior distributions were uniform for all parameters, and the same range was used for common parameters between models. For all scenarios, we assumed that microsatellites evolved under a stepwise-mutation model. Under each model, we ran 100,000 coalescent simulations of our data set of 8 microsatellites. The posterior probabilities of the 3 scenarios were subsequently estimated based on (i) a direct estimate, in which the 500 data sets with summary statistics closest to the target values were extracted, and (ii) a polychotomous logistic approach that recovers the 1% closest to the simulated data sets. For the scenario with the highest support, posterior distributions for parameters were estimated using a local linear regression on the closest 1% of the simulated data set. Recent reductions to effective population sizes were tested with the Wilcoxon signed-rank test implemented in BOTTLENECK version 1.2.02 (Cornuet and Luikart, 1996). Tests were conducted using the recommended model in BOTTLENECK, namely the two-phase mutational model (TPM) with 10,000 iterations.
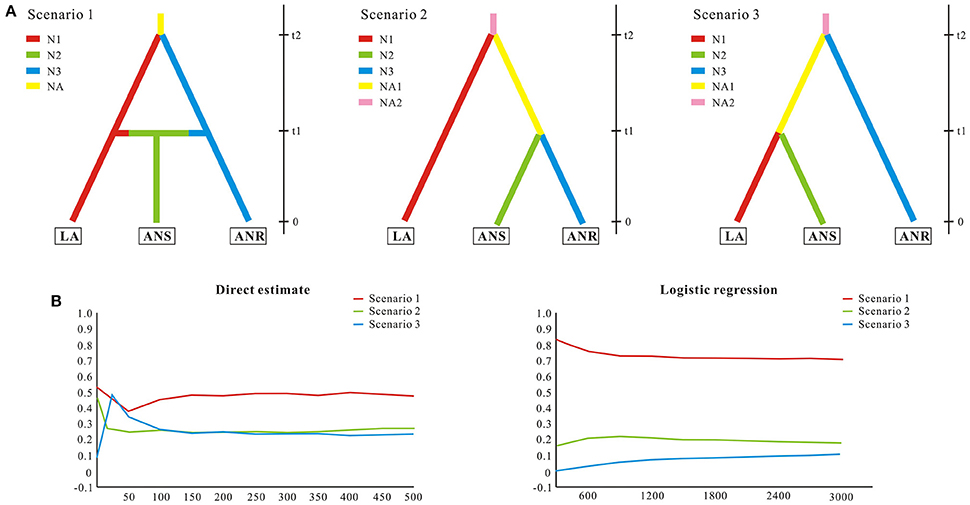
Figure 2. Possible scenarios of Sibiraea population history in the Qinghai-Tibetan Plateau. Approximate Bayesian computation was conducted using DIYABC 2.0.4 to estimate the relative likelihood of scenarios for Sibiraea's evolutionary history. (A) Graphs in the upper panel illustrate the proposed scenarios proposed. The Sibiraea populations were assumed to be 3 subpopulations. LA contained S. laevigata populations; ANS contained S. angustata populations that were sympatric with S. laevigata; ANR contained the remaining S. angustata populations. Colors indicate different (but unknown) population sizes. Zero means sampling time, and t1-t2 refers to relative times of past events that are suggestive of population splitting. (B) Graphs in the lower panel indicate the relative likelihoods of the 3 scenarios compared by direct estimate and logistic regression.
Migration Patterns
We used GENECLASS version 2.0 (Piry et al., 2004) to perform the assignment test with the Bayesian method (Rannala and Mountain, 1997) and detect first-generation migrants among populations using the frequency-based method (Paetkau et al., 1995). The assignment test assigned the possible origins of individuals in reference populations, with 1 million simulations and an alpha level of 0.01. Using Monte Carlo resampling of 1000 individuals and a threshold of 0.01, first-generation migrants among populations were detected to identify immigrant individuals that were not born in the population. Since the migrant rate may not accurately reflect long-term gene flow patterns (Slatkin, 1987), the private allele method was used to estimate the effective number of migrants per generation. This was conducted using Genepop version 4.0.10 (Rousset, 2008). To examine gene flow levels among defined regional groups, we used MIGRATE version 3.6 to estimate theta and M using MCMC searches (Beerli and Felsenstein, 2001; Beerli and Palczewski, 2010). Theta was defined as 4Neμ for diploid organisms, where Ne is the effective population size and μ is the mutation rate. Conversely, M was expressed as the number of migrants per generation between populations and equal to 4Nem, where m is the proportion of the population composed of migrants. We used the stepping-stone model of population structure (Kimura and Weiss, 1964) in our analyses for reducing the number of parameters and degrees of freedom. Therefore, gene flow was only estimated between adjoining regional groups. We performed 20 short chains with 500 sampled genealogies each, and 3 long chains with 5000 sampled genealogies each. Heating was set as active, with four temperatures (1.0, 1.5, 3.0, and 1000.0). This process was repeated 4 times with different random seed numbers, but under the same conditions.
Results
Hardy–Weinberg Equilibrium, Linkage Disequilibrium, and Genetic Diversity
All 681 samples were amplified at all 8 microsatellite loci. Mean expected heterozygosities (HE) were uniformly high, and ranged from 0.564 to 0.895 (Table 1). The mean number of alleles/locations ranged from 4.38 to 15.13. MICROCHECKER detected the presence of null alleles at all loci. Pairwise comparisons among the 8 microsatellite loci and for all 45 populations revealed no linkage disequilibrium (P < 0.05). In contrast to S. laevigata, more S. angustata locations showed significant departure from Hardy-Weinberg equilibrium with a significant multilocus heterozygosity deficiency (Table 1). Furthermore, more private alleles were detected in S. laevigata than in S. angustata. A private allele was counted following the standard that it appeared only in a single population. The 8 microsatellite markers used in this study were assessed and summarized in Table S1.
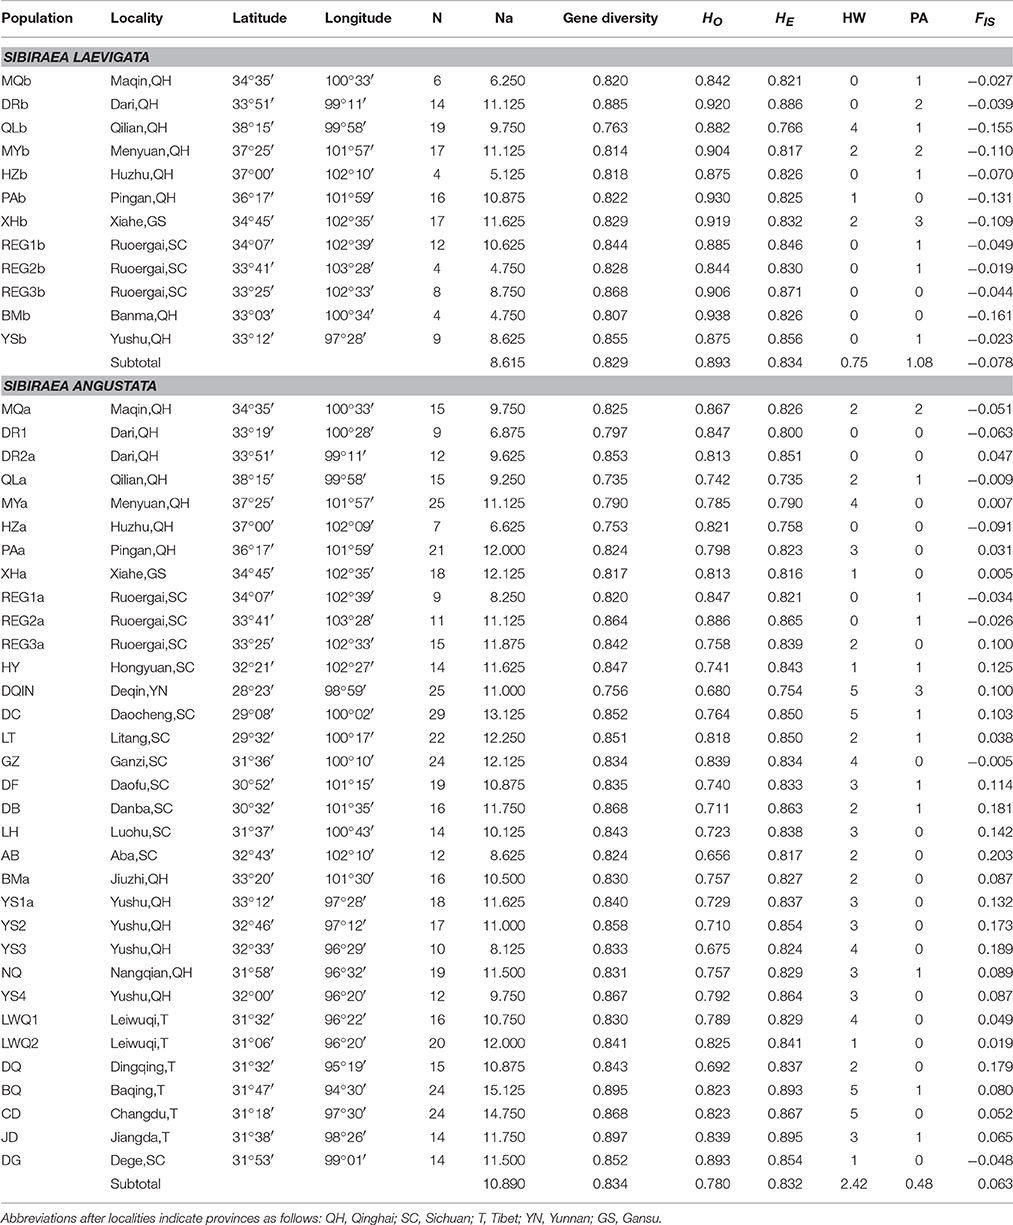
Table 1. Summary statistics for Sibiraea populations in the Qinghai-Tibetan Plateau: sample size (N), average observed heterozygosity over loci (HO), average heterozygosity over loci (HE), number of loci deviating from Hardy-Weinberg equilibrium (HW), number of private alleles (PA), fixation index (FIS).
Recent inbreeding was apparent for all S. laevigata populations but only for a few S. angustata populations (8 out of 33). Populations in the sympatric area of the complex were more inbred than those from the non-sympatric area. Pairwise FST values (Table S2) clearly indicate significant genetic differentiation between populations. Levels of pairwise population differentiation were variable, ranging from 0.001 to 0.283. The pairwise FST values between S. laevigata and S. angustata was 0.049 (P = 0.000). AMOVA analysis showed that 4.39% of the variance was found between species (Va = 0.166), 8.16% among populations within species (Vb = 0.309), and 87.45% within populations (Vc = 3.315) (Table 2).
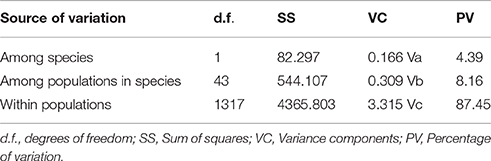
Table 2. Analyses of molecular variance (AMOVA) in Sibiraea based on 8 SSR loci.
Population Structure
In Bayesian clustering analysis, the Ln-likelihood values for the number of clusters (K) increased with each K-value and did not plateau when the complex was analyzed together (Figure S1). Using the method proposed by Evanno et al. (2005) the suggested number of clusters were 2 and 7 (ΔK = 2 and 7, Figure S1). When examining bar-plot outputs during analyses for the K-values, results were biologically meaningful. We therefore consider K = 2 and K = 7 to be the most likely number of clusters in the 2 Sibiraea species. At K = 2, all S. laevigata individuals were primarily located in 1 cluster, while S. angustata individuals were in 2 clusters (Figure 1C). The individual's estimated proportion of membership in each cluster is presented in Table S3. The first cluster contained all populations at the sympatric area of the complex. The genetic structure of Sibiraea populations based on K = 2 genetic clusters was presented in Figure 1B. At higher K-values, individuals within the S. angustata subpopulation were assigned to additional clusters. At K = 7, S. laevigata individuals were assigned to 2 clusters, while S. angustata individuals were assigned to 6 clusters, one of which was shared with S. laevigata (Figure 1C).
Demographic History
Since all populations at the sympatric area were grouped into a single cluster, we conducted ABC analysis to reveal the divergence history of populations at this area. The ABC simulations showed high support for Scenario 1 (subpopulation ANS was constituted by migrants from subpopulations LA and ANR) and favored this as the most probable scenario (Figure 2). The median estimates of migrant rate r, split time t1 and t2, as estimated from posterior distributions, were around 0.61, 4600, and 34,200, respectively (Table S4). Despite some of the estimated parameters showing low robustness (Factor 2 statistic, Table S5), ABC analyses conclusively support a migrant in the Sibiraea species populations. Posteriors of the effective population sizes, rate of admixture, and time of population splits are given in Table S4. Due to an excess of observed heterozygosity, bottleneck tests under TPM models showed deviations from mutation equilibrium for populations P9, P11, and S32. Two other populations, S13 and S22, deviated from mutation equilibrium due to deficiency of observed heterozygosity and experienced genetic bottleneck (Table S6).
Gene Flow and Migration
There were no significant correlations between genetic and geographical distances among the populations analyzed in this study (for S. laevigata, r = 0.457, P = 0.997; for S. angustata, r = 0.236, P = 1.000). The assignment test assigned all individuals to populations of their own species rather than their congeneric species. GENEGLASS detected no first-generation migrant between the 2 species. Ten first-generation migrants were detected within S. laevigata populations and 41 first-generation migrants were detected within S. angustata populations (Table S7). Based on Genepop's private allele method, the number of migrants (after correction for size) in S. laevigata, S. angustata, and the Sibiraea complex were 2.33, 4.88, and 2.75, respectively. Results from MIGRATE showed that recent immigration rate from S. laevigata to S. angustata (m12 = 0.0059) was much lower than the recent immigration rate from S. angustata to S. laevigata (m21 = 0.0234) (Table 3). This suggests that the bidirectional gene flow between the species was asymmetrical. Focusing on the sympatric area, recent immigration rate from S. laevigata to S. angustata was only slightly lower (m12 = 0.0106) than that from S. angustata to S. laevigata (m21 = 0.0187).
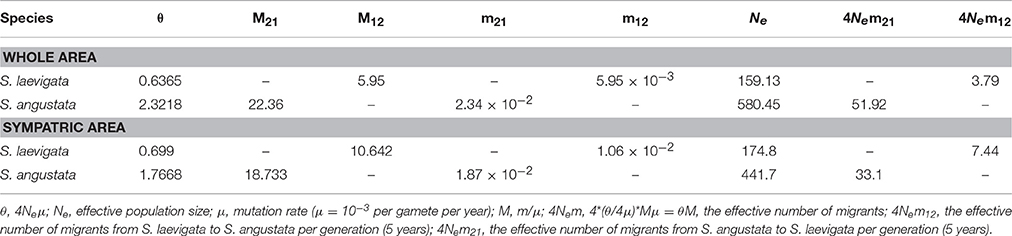
Table 3. Effective population sizes (Ne) and effective number of migrants between species (4Nem) in S. angustata and S. laevigata, estimated by maximum likelihood.
Discussion
The Sibiraea complex, S. angustata, and S. laevigata, is a common shrub in the QTP. Previous study based on cpDNA and ITS indicated that the 2 species had high genetic similarity and could not be genetically distinguished (Fu et al., 2016). However, by including data from microsatellite loci, a more detailed genetic structure can be established, and this approach has been successfully applied to a range of species (Kalia et al., 2011).
Population Genetic Structure
The challenge in molecular taxonomy is to distinguish species that have low levels of genetic divergence either due to recent speciation or continuous gene exchange (Petit and Excoffier, 2009). Although, the Sibiraea complex could not be distinguished by cpDNA and nrITS datasets, it may be distinguished using microsatellite loci. Firstly, S. laevigata and S. angustata had significant differentiation (FST = 0.049, P = 0.000). Then, STRUCTURE provided a comprehensive understanding of the Sibiraea populations under study. The K = 2 model seems to support the interpretation that each cluster represents a single geographical region; one is the sympatric region, while the other is the left region. The K = 7 model in STRUCTURE clearly separated S. laevigata populations from S. angustata populations. Furthermore, STRUCTURE grouped all S. laevigata populations into a unique cluster (the blue one), and S. angustata populations under another clusters (Figure 1C).
Even though the complex was genetically distinguished, they shared some genetic variability. There was evident structuring regarding 5 populations (P8–P12), where approximately 60% of genetic variability was attributed to the blue cluster, and 40% to the red cluster (Figure 1C), which also contained 1 S. angustata population (S13). However, population S13 was not geographically adjacent to the 5 populations. Since a significant bottleneck effect was detected in population S13, the geographical disjunction between population S13 and other populations of the red cluster might be due to a genetic remnant following the genetic bottleneck.
Hartl et al. (1997) proposed FST < 0.05 as indicator of little genetic differentiation. The FST between the Sibiraea complex is low (0.049), meaning that there is not much genetic differentiation between them. At the same time, shared genetic variation was observed and most genetic variance was detected within populations rather than between species. However, the complex has been divergent in stable morphological characteristics, such as pubescent or peduncles and pedicels (Gu and Alexander, 2003). Therefore, the Sibiraea complex may be on an incomplete process of speciation. Ongoing speciation has been reported in several taxa such as the Gymnocypris complex in the QTP (Zhang et al., 2013) and the Anastrepha fraterculus complex in the Americas (Devescovi et al., 2014).
Gene Flow in Sibiraea Complex
High genetic diversity was detected in both species (Table 1). On one hand, the high genetic diversity owns to high polymorphism of SSR loci used in this study because SSR loci have higher mutation rates than chloroplasts and nuclear genes. On the other hand, our results indicated that both species had high genetic diversity. Geographical isolation could increase opportunities for genetic divergence. Vicariance on the QTP, and fragmentation during repeated glaciations in the late Pleistocene, contributed to plant evolution and differentiation (Liu et al., 2012, 2014; Wen et al., 2014). Therefore, geographical isolation due to vicariance and fragmentation may partly contribute to this high genetic diversity.
While genetic diversity increases, geographical isolation simultaneously intensifies genetic differentiation. Our results showed no significant correlations between genetic and geographical distances among the populations, therefore indicating that Sibiraea was not isolated by distance. Gene flow between populations maintains genetic diversity within a species (Slatkin, 1994), and frequent gene flow increases genetic diversity. However, as genetic diversity increases, gene flow decreases genetic differentiation. Therefore, logically, if gene flow increased genetic diversity, a decrease in genetic differentiation should be observed. In our study, a low differentiation was confirmed by low FST (0.049) between the Sibiraea complex. Coincidentally, AMOVA analysis also indicated that the majority of diversity was within populations (87.45%) rather than among populations (12.55%). Moreover, MCMC searches indicated high gene flow between S. laevigata and S. angustata, especially on the sympatric area (Table 3). Although, the QTP is mountainous, frequent gene flow is possible because both species are wind-pollinated, exhibit the same flowering times, and have a number of light seeds with wings (Fu et al., 2016). Genetic differentiation despite high gene flow was also detected in the wind-pollinated keystone rainforest tree Nothofagus cunninghamii (Duncan et al., 2016). Our study agrees with the statement that speciation with gene flow may be common (Nosil, 2008).
Evolutionary History
In addition to distribution in the QTP, S. laevigata also presently distributes in the Mediterranean (Gu and Alexander, 2003; Ballian et al., 2006), and may have distributed around the Tethys Ocean before the QTP uplift. On the other hand, S. angustata was endemic to the QTP. Although no genetic differentiation was observed, the Bayesian estimation of the divergence time in the Sibiraea complex in the QTP was around 3.8 Ma (Fu et al., 2016), when the QTP quickly uplifted (Shi et al., 1998). Our ABC model based on microsatellites indicated that populations of the 2 species split around 0.17 Ma, when glaciers occurred in the QTP (Zheng et al., 2002). According to these results, S. angustata possibly originated from the remnants of S. laevigata in the QTP, which diverged with the uplift and glacier formation. Having hair in its stems and leaves, S. angustata adapted to the cold environment of the QTP and had wider distributions than S. laevigata.
Studying closely related species and divergent populations gives insight into how genetic differences in speciation proceed (Surget-Groba and Kay, 2013). The Bayesian clustering analysis tended to cluster the populations of the complex at the sympatric area into 1 group. Our ABC model supported that the populations of S. angustata at the sympatric area was an admixture between the S. laevigata populations and southern S. angustata populations. Sibiraea laevigata (61%) contributed to the admixture more than the southern S. angustata (39%). Significant bidirectional gene flow between them, especially on the sympatric area, contributed to their high genetic similarity. When generation time of Sibiraea was set to 5 years, according to our field observations, the admixture occurred about 23,000 years ago, i.e., when the QTP was in the Last Glacial period. Phylogeographic study indicated that the Sibiraea complex had 3 independent refugia in the QTP, 2 of which were high altitude (Fu et al., 2016). Population glacial contractions and postglacial recolonization offered opportunities for population admixture (Hewitt, 2000). The ABC model also indicated that S. laevigata populations and southern S. angustata populations split around 0.17 Ma. During this period (the penultimate glacial), the area covered by glaciers was larger than that of former glaciations in the southern part of Himalaya and Southeastern Tibet (Zheng et al., 2002). This larger glacier possibly triggered Sibiraea divergence and decreased population size. The population size decrease was observed in our previous study using the Bayesian skyline plot, which showed that Sibiraea populations in the QTP decreased 23-fold during the last 0.12 Ma (Fu et al., 2016).
In conclusion, this study examined the population genetic structure of 45 populations of Sibiraea from the QTP. The Sibiraea complex, S. angustata and S. laevigata, which could not be distinguished by DNA sequence data in previous research, were genetically distinguished based on the microsatellite markers applied in this study. We found that the high genetic similarity of these 2 species is the result of huge bidirectional gene flow, especially on the sympatric area where population admixtures occurred. The Sibiraea complex may be on an incomplete process of speciation with gene flow. Our study suggests that microsatellite loci are helpful for species population genetics, especially for closely related species. This study greatly enhanced our knowledge on the genetic diversity and evolutionary history of Sibiraea in the QTP.
Author Contributions
PF conceived and designed the experiments, performed the experiments, analyzed the data, wrote the paper, prepared figures and/or tables. QG reviewed drafts of the paper, revise the manuscript. FZ analyzed the data, prepared figures and/or tables, reviewed drafts of the paper, revise the manuscript. RX, JW, and HL performed the experiments, analyzed the data. SC conceived and designed the experiments, reviewed drafts of the paper. PF, FZ have contributed equally to this work.
Conflict of Interest Statement
The authors declare that the research was conducted in the absence of any commercial or financial relationships that could be construed as a potential conflict of interest.
Acknowledgments
We thank the Key Laboratory of Crop Molecular Breeding, Qinghai Province for help in our experiment. This work was financially supported by the National Natural Science Foundation of China (Grant No. 31400322, No. 31270270, No. 31600296, and No. 31110103911). We thank LetPub (www.letpub.com) for its linguistic assistance during the preparation of this manuscript.
Supplementary Material
The Supplementary Material for this article can be found online at: http://journal.frontiersin.org/article/10.3389/fpls.2016.01596
References
Arranz, S. E., Avarre, J. C., Balasundaram, C., Bouza, C., Calcaterra, N. B., Cezilly, F., et al. (2013). Permanent genetic resources added to molecular ecology resources database 1 december 2012-31 january 2013. Mol. Ecol. Resour. 546–549. doi: 10.1111/1755-0998.12095
Ballian, D., Grebenc, T., Božič, G., Melnik, V., Wraber, T., and Kraigher, H. (2006). History, genetic differentiation and conservation strategies for disjunct populations of Sibiraea species from Southeastern Europe and Asia. Conserv. Genet. 7, 895–907. doi: 10.1007/s10592-006-9131-z
Baums, I. B., Boulay, J. N., Polato, N. R., and Hellberg, M. E. (2012). No gene flow across the Eastern Pacific Barrier in the reef-building coral Porites lobata. Mol. Ecol. 21, 5418–5433. doi: 10.1111/j.1365-294X.2012.05733.x
Beaumont, M. A. (2010). Approximate Bayesian Computation in evolution and ecology. Annu. Rev. Ecol. Evol. S. 41, 379–406. doi: 10.1146/annurev-ecolsys-102209-144621
Beerli, P., and Felsenstein, J. (2001). Maximum likelihood estimation of a migration matrix and effective population sizes in n subpopulations by using a coalescent approach. Proc. Natl. Acad. Sci. U.S.A. 98, 4563–4568. doi: 10.1073/pnas.081068098
Beerli, P., and Palczewski, M. (2010). Unified framework to evaluate panmixia and migration direction among multiple sampling locations. Genetics 185, 313–326. doi: 10.1534/genetics.109.112532
Cornuet, J. M., and Luikart, G. (1996). Description and power analysis of two tests for detecting recent population bottlenecks from allele frequency data. Genetics 144, 2001–2014.
Cornuet, J. M., Pudlo, P., Veyssier, J., Dehne-Garcia, A., Gautier, M., Leblois, R., et al. (2014). DIYABC v2.0: a software to make approximate Bayesian computation inferences about population history using single nucleotide polymorphism, DNA sequence and microsatellite data. Bioinformatics 30, 1187–1189. doi: 10.1093/bioinformatics/btt763
Cowen, R. K., and Sponaugle, S. (2009). Larval dispersal and marine population connectivity. Annu. Rev. Mar. Sci. 1, 443–466. doi: 10.1146/annurev.marine.010908.163757
Devescovi, F., Abraham, S., Roriz, A. K., Nolazco, N., Castaneda, R., Tadeo, E., et al. (2014). Ongoing speciation within the Anastrepha fraterculus cryptic species complex: the case of the Andean morphotype. Entomol. Exp. Appl. 152, 238–247. doi: 10.1111/eea.12219
Duncan, C. J., Worth, J. R. P., Jordan, G. J., Jones, R. C., and Vaillancourt, R. E. (2016). Genetic differentiation in spite of high gene flow in the dominant rainforest tree of southeastern Australia, Nothofagus cunninghamii. Heredity 116, 99–106. doi: 10.1038/hdy.2015.77
Epps, C. W., Palsbøll, P. J., Wehausen, J. D., Roderick, G. K., Ramey, R. R., and McCullough, D. R. (2005). Highways block gene flow and cause a rapid decline in genetic diversity of desert bighorn sheep. Ecol. Lett. 8, 1029–1038. doi: 10.1111/j.1461-0248.2005.00804.x
Evanno, G., Regnaut, S., and Goudet, J. (2005). Detecting the number of clusters of individuals using the software STRUCTURE: a simulation study. Mol. Ecol. 14, 2611–2620. doi: 10.1111/j.1365-294X.2005.02553.x
Excoffier, L., and Lischer, H. E. L. (2010). Arlequin suite ver 3.5: a new series of programs to perform population genetics analyses under Linux and Windows. Mol. Ecol. Res. 10, 564–567. doi: 10.1111/j.1755-0998.2010.02847.x
Fitzpatrick, B. M., Fordyce, J. A., and Gavrilets, S. (2009). Pattern, process and geographic modes of speciation. J. Evolution. Biol. 22, 2342–2347. doi: 10.1111/j.1420-9101.2009.01833.x
Fu, P. C., Gao, Q. B., Zhang, F. Q., Xing, R., Khan, G., Wang, J. L., et al. (2016). Responses of plants to changes in Qinghai-Tibetan Plateau and glaciations: evidence from phylogeography of a Sibiraea (Rosaceae) complex. Biochem. Syst. Ecol. 65, 72–82. doi: 10.1016/j.bse.2016.01.006
Goudet, J. (2001). FSTAT, a Program to Estimate and Test Gene Diversities and Fixation Indices (Version 2.9. 3). Available online at: http://www2.unil.ch/popgen/softwares/fstat.htm
Gu, C. Z., and Alexander, C. (2003). “Sibiraea,” in Flora of China, Vol. 9, eds Z. Y. Wu, P. H. Raven (Beijing; St. Louis, MO: Science Press; Missouri Botanical Garden Press), 46–434.
Hartl, D. L., Clark, A. G., and Clark, A. G. (1997). Principles of Population Genetics. Sunderland: Sinauer Associates.
Hewitt, G. M. (2000). The genetic legacy of the Quaternary ice ages. Nature 405, 907–913. doi: 10.1038/35016000
Hewitt, G. M. (2004). Genetic consequences of climate oscillations in the Quaternary. Philos. T. R. Soc. B. 359, 183–195. doi: 10.1098/rstb.2003.1388
Hey, J. (2006). Recent advances in assessing gene flow between diverging populations and species. Curr. Opin. Genet. Dev. 16, 592–596. doi: 10.1016/j.gde.2006.10.005
Hoskin, C. J., Higgie, M., McDonald, K. R., and Moritz, C. (2005). Reinforcement drives rapid allopatric speciation. Nature 437, 1353–1356. doi: 10.1038/nature04004
Jakobsson, M., and Rosenberg, N. (2007). CLUMPP: a cluster matching and permutation program for dealing with label switching and multimodality in analysis of population structure. Bioinformatics 23, 1801–1806. doi: 10.1093/bioinformatics/btm233
Jensen, J. L., Bohonak, A. J., and Kelley, S. T. (2005). Isolation by distance, web service. BMC Genet. 6:13. doi: 10.1186/1471-2156-6-13
Kalia, R. K., Rai, M. K., Kalia, S., Singh, R., and Dhawan, A. K. (2011). Microsatellite markers: an overview of the recent progress in plants. Euphytica 177, 309–334. doi: 10.1007/s10681-010-0286-9
Kimura, M., and Weiss, G. H. (1964). The stepping stone model of population structure and the decrease of genetic correlation with distance. Genetics 49, 561–576.
Lessios, H. A., Kane, J., and Robertson, D. R. (2003). Phylogeography of the pantropical sea urchin Tripneustes: contrasting patterns of population structure between oceans. Evolution 57, 2026–2036. doi: 10.1111/j.0014-3820.2003.tb00382.x
Liu, J. Q., Duan, Y. W., Hao, G., Ge, X. J., and Sun, H. (2014). Evolutionary history and underlying adaptation of alpine plants on the Qinghai-Tibet Plateau. J. Syst. Evol. 52, 241–249. doi: 10.1111/jse.12094
Liu, J. Q., Sun, Y. S., Ge, X. J., Gao, L. M., and Qiu, Y. X. (2012). Phylogeographic studies of plants in China: advances in the past and directions in the future. J. Syst. Evol. 50, 267–275. doi: 10.1111/j.1759-6831.2012.00214.x
Mallet, J. (1995). A species definition for the modern synthesis. Trends Ecol. Evol. 10, 294–299. doi: 10.1016/0169-5347(95)90031-4
Myers, E. A., Rodríguez-Robles, J. A., DeNardo, D. F., Staub, R. E., Stropoli, A., Ruane, S., et al. (2013). Multilocus phylogeographic assessment of the California Mountain Kingsnake (Lampropeltis zonata) suggests alternative patterns of diversification for the California Floristic Province. Mol. Ecol. 22, 5418–5429. doi: 10.1111/mec.12478
Nosil, P. (2008). Speciation with gene flow could be common. Mol. Ecol. 17, 2103–2106. doi: 10.1111/j.1365-294X.2008.03715.x
Paetkau, D., Calvert, W., Stirling, I., and Strobeck, C. (1995). Microsatellite analysis of population structure in Canadian polar bears. Mol. Ecol. 4, 347–354. doi: 10.1111/j.1365-294X.1995.tb00227.x
Pearse, D. E., and Crandall, K. A. (2004). Beyond FST: analysis of population genetic data for conservation. Conserv. Genet. 5, 585–602. doi: 10.1007/s10592-003-1863-4
Petit, R. J., and Excoffier, L. (2009). Gene flow and species delimitation. Trends Ecol. Evol. 24, 386–393. doi: 10.1016/j.tree.2009.02.011
Piry, S., Alapetite, A., Cornuet, J. M., Paetkau, D., Baudouin, L., and Estoup, A. (2004). GENECLASS2: a software for genetic assignment and first-generation migrant detection. J. Hered. 95, 536–539. doi: 10.1093/jhered/esh074
Pritchard, J. K., Stephens, M., and Donnelly, P. (2000). Inference of population structure using multilocus genotype data. Genetics 155, 945–959.
Qiu, Y. X., Fu, C. X., and Comes, H. P. (2011). Plant molecular phylogeography in China and adjacent regions: tracing the genetic imprints of Quaternary climate and environmental change in the world's most diverse temperate flora. Mol. Phylogenet. Evol. 59, 225–244. doi: 10.1016/j.ympev.2011.01.012
Rannala, B., and Mountain, J. L. (1997). Detecting immigration by using multilocus genotypes. Proc. Natl. Acad. Sci. U.S.A. 94, 9197–9201. doi: 10.1073/pnas.94.17.9197
Rosenberg, N. E. (2004). DISTRUCT: a program for the graphical display of population structure. Mol. Ecol. Notes 4, 137–138. doi: 10.1046/j.1471-8286.2003.00566.x
Rousset, F. (2008). GENEPOP'007: a complete reimplementation of the GENEPOP software for Windows and Linux. Mol. Ecol. Notes 8, 103–106. doi: 10.1111/j.1471-8286.2007.01931.x
Shi, Y. F., Li, J. J., and Li, B. Y. (1998). Uplift and Environmental Changes of Qinghai-Tibetan Plateau in the Late Cenozoic. Guangzhou: Guangdong Science and Technology Press.
Slatkin, M. (1987). Gene flow and the geographic structure of natural populations. Science 236, 787–792. doi: 10.1126/science.3576198
Slatkin, M. (1994). “Gene flow and population structure,” in Ecological Genetics, ed L. A. Real (Princeton, NJ: Princeton University Press), 3–17.
Smadja, C. M., and Butlin, R. K. (2011). A framework for comparing processes of speciation in the presence of gene flow. Mol. Ecol. 20, 5123–5140. doi: 10.1111/j.1365-294X.2011.05350.x
Su, X., Wu, G., Li, L., and Liu, J. (2015). Species delimitation in plants using the Qinghai-Tibet Plateau endemic Orinus (Poaceae: Tridentinae) as an example. Ann. Bot. 116, 35–48. doi: 10.1093/aob/mcv062
Surget-Groba, Y., and Kay, K. M. (2013). Restricted gene flow within and between rapidly diverging Neotropical plant species. Mol. Ecol. 22, 4931–4942. doi: 10.1111/mec.12442
Van Oosterhout, C., Hutchinson, W. F., Wills, D. P. M., and Shipley, P. (2004). Micro-Checker: software for identifying and correcting genotyping errors in microsatellite data. Mol. Ecol. Notes 4, 535–538. doi: 10.1111/j.1471-8286.2004.00684.x
Wen, J., Zhang, J. Q., Nie, Z. L., Zhong, Y., and Sun, H. (2014). Evolutionary diversifications of plants on the Qinghai-Tibetan Plateau. Front. Genet. 5, 1–16. doi: 10.3389/fgene.2014.00004
Willis, K. J., and Niklas, K. J. (2004). The role of Quaternary climate change in macroevolution: the exception or the rule. Philos. T. R. Soc. B. 359, 159–172. doi: 10.1098/rstb.2003.1387
Yan, J., Zhu, M., Liu, W., Xu, Q., Zhu, C., Li, J., et al. (2015). Genetic variation and bidirectional gene flow in the riparian plant Miscanthus lutarioriparius, across its endemic range: implications for adaptive potential. GCB Bioenergy 8, 764–776. doi: 10.1111/gcbb.12278
Zhang, D. F., Fengquan, L., and Jianmin, B. (2000). Eco-environmental effects of the Qinghai-Tibet Plateau uplift during the Quaternary in China. Environ. Geol. 39, 1352–1358. doi: 10.1007/s002540000174
Zhang, R., Peng, Z., Li, G., Zhang, C., Tang, Y., Gan, X., et al. (2013). Ongoing speciation in the Tibetan Plateau Gymnocypris species complex. PLoS ONE 8:e71331. doi: 10.1371/journal.pone.0071331
Keywords: gene flow, genetic divergence, microsatellite, Qinghai-Tibetan Plateau, Sibiraea
Citation: Fu P-C, Gao Q-B, Zhang F-Q, Xing R, Wang J-L, Liu H-R and Chen S-L (2016) Gene Flow Results in High Genetic Similarity between Sibiraea (Rosaceae) Species in the Qinghai-Tibetan Plateau. Front. Plant Sci. 7:1596. doi: 10.3389/fpls.2016.01596
Received: 15 July 2016; Accepted: 10 October 2016;
Published: 25 October 2016.
Edited by:
Tian Tang, Sun Yat-sen University, ChinaReviewed by:
Rachel Ben-Shlomo, University of Haifa, IsraelDavid Vieites, Spanish National Research Council, Spain
Copyright © 2016 Fu, Gao, Zhang, Xing, Wang, Liu and Chen. This is an open-access article distributed under the terms of the Creative Commons Attribution License (CC BY). The use, distribution or reproduction in other forums is permitted, provided the original author(s) or licensor are credited and that the original publication in this journal is cited, in accordance with accepted academic practice. No use, distribution or reproduction is permitted which does not comply with these terms.
*Correspondence: Shi-Long Chen, slchen@nwipb.cas.cn
†These authors have contributed equally to this work.