 Marcela I. Rodrigues
 Agnes A. S. Takeda
 Juliana P. Bravo
 Ivan G. Maia
- 1Department of Genetics, Institute of Biosciences of Botucatu, São Paulo State University, Botucatu, Brazil
- 2Department of Physics and Biophysics, Institute of Biosciences of Botucatu, São Paulo State University, Botucatu, Brazil
- 3Institute of Biotechnology, São Paulo State University, Botucatu, Brazil
Plant aquaporins are water channels implicated in various physiological processes, including growth, development and adaptation to stress. In this study, the Tonoplast Intrinsic Protein (TIP) gene subfamily of Eucalyptus, an economically important woody species, was investigated and characterized. A genome-wide survey of the Eucalyptus grandis genome revealed the presence of eleven putative TIP genes (referred as EgTIP), which were individually assigned by phylogeny to each of the classical TIP1–5 groups. Homology modeling confirmed the presence of the two highly conserved NPA (Asn-Pro-Ala) motifs in the identified EgTIPs. Residue variations in the corresponding selectivity filters, that might reflect differences in EgTIP substrate specificity, were observed. All EgTIP genes, except EgTIP5.1, were transcribed and the majority of them showed organ/tissue-enriched expression. Inspection of the EgTIP promoters revealed the presence of common cis-regulatory elements implicated in abiotic stress and hormone responses pointing to an involvement of the identified genes in abiotic stress responses. In line with these observations, additional gene expression profiling demonstrated increased expression under polyethylene glycol-imposed osmotic stress. Overall, the results obtained suggest that these novel EgTIPs might be functionally implicated in eucalyptus adaptation to stress.
Introduction
Aquaporins are membrane channels implicated in the transfer of water and small solutes across cell membranes (reviewed in Maurel et al., 2015). In plants, aquaporins fall into at least seven different subfamilies that reflect their main subcellular localization (reviewed in Maurel et al., 2015). Members of the Tonoplast Intrinsic Protein (TIP) subfamily are generally targeted to the vacuolar membrane and known to facilitate water transport across this subcellular compartment. Parallel to their role as water channels, TIP isoforms can also translocate glycerol, hydrogen peroxide (H2O2) (reviewed in Maeshima, 2001) and urea (Liu et al., 2003), and enhance vacuolar membrane permeability to ammonia (Loqué et al., 2005; Kirscht et al., 2016). Specificity of substrate transport is mainly determined by four amino acid (aa) residues present at specific positions of the so-called aromatic/arginine (ar/R) selectivity filter, which acts as a size-exclusion barrier (Sui et al., 2001; Wu et al., 2009).
Reports on the expression of a set of TIP genes revealed differential regulation in response to environmental constraints, especially drought and salinity, and to abscisic acid (ABA) (Alexandersson et al., 2005; Boursiac et al., 2005; Rodrigues et al., 2013; Regon et al., 2014). Supporting the importance of these proteins in plant stress adaptation, TIPs were shown to improve drought and salt tolerance when overexpressed in transgenic plants (Peng et al., 2007; Khan et al., 2015; Li and Cai, 2015). Intriguingly, TIP overexpression also positively affected plant growth and biomass production (Lin et al., 2007; Peng et al., 2007; Sade et al., 2009; Khan et al., 2015; Li and Cai, 2015). Although some discrepancies exist, since overexpression phenotypes displaying sensitivity to abiotic stress have been observed (Wang et al., 2011), the current consensus is that TIPs are engaged in the regulation of important physiological processes that contributes to plant growth and adaptation to stress (reviewed in Afzal et al., 2016). In this context, a recent role for different TIP isoforms in facilitating lateral root emergence in Arabidopsis thaliana was demonstrated (Reinhardt et al., 2016).
A systematic genome-wide analysis conducted in 10 different plant species, including both monocts and dicots, identified at least 100 genes encoding TIPs (Regon et al., 2014). In A. thaliana, the TIP subfamily is composed of 10 members that are phylogenetically classified into five subgroups (Johanson et al., 2001). In forest and fruit tree species, genome-wide surveys revealed the presence of 17 TIP genes in Populus trichocarpa (Gupta and Sankararamakrishnan, 2009) and Hevea brasiliensis (Zou et al., 2015a), while 10 and 11 genes were identified in Vitis vinifera and Citrus sinensis, respectively (Shelden et al., 2009; Martins et al., 2015). Intriguingly, a preliminary study identified a relatively small number of TIP genes (five in total) in the Eucalyptus genome (Rodrigues et al., 2013). Taking into consideration the evolutionary history of the eucalyptus genome (Myburg et al., 2014), such a comparatively low number of genes is unexpected and requires additional investigation.
To gain further insights into the functional/structural attributes of the TIP subfamily of Eucalyptus, in the present study we undertook a genomic survey for additional members. This effort led to the identification of six novel genes (referred to as EgTIP), indicating that the EgTIP subfamily encompasses 11 members. In parallel, we investigated the phylogeny, structural features and expression patterns across different eucalyptus organs/tissues and in response to osmotic stress of the entire gene subfamily. The results obtained provide an interesting framework for future studies aiming to elucidate the roles of TIPs in woody species.
Materials and Methods
Plant Material
Freshly harvested vegetative and reproductive organs/tissues (1 month-old plantlets; pool of leaves of different ages; roots from 1 and 6 month-old plantlets; stems from 1 and 6 month-old plantlets; vascular cambium samples from 6 year-old trees; flower; flower buds; and fruits) were obtained from Eucalyptus grandis essentially as described previously (Rodrigues et al., 2013). After harvesting, fresh samples were frozen immediately in liquid nitrogen until total RNA extraction. Two-month-old plantlets of a commercial clone of E. grandis, kindly provided by Suzano Papel e Celulose SA, Brazil, were used in the osmotic stress assays.
In silico Identification and Characterization of the Eucalyptus TIP Genes (EgTIP)
To identify members of the TIP gene subfamily in Eucalyptus, annotated TIP sequences from Arabidopsis (Johanson et al., 2001; Alexandersson et al., 2005) were used as queries in BLAST searches against the E. grandis BRASUZ1 genome assembly (v2.0) available at Phytozome1. To refine our analysis, additional BLAST searches were performed using previously identified poplar TIP sequences (Gupta and Sankararamakrishnan, 2009) as drivers. The identified gene products were subsequently validated using the Pfam domain annotation (Finn et al., 2016). The exon/intron organization of the mined EgTIP genes was determined using the Eucalyptus gene models annotated in Phytozome and the Gene Structure Display Server2 (GSDS v2.0). The existence of duplication of the EgTIP genes was investigated using the locus-search module of the Plant Genome Duplication Database3 (PGDD). The ratio of non-synonymous (Ka) to synonymous (Ks) substitution rates of evolution were also calculated using PGDD. Searches for the presence of putative cis-regulatory elements within the EgTIP promoter regions were carried out using the Plant Care and PLACE databases. Predictions of the subcellular location of the EgTIP proteins were performed using Plant-mPLoc4 (Chou and Shen, 2010).
Phylogenetic Analyses
The deduced aa sequences of the identified EgTIPs were aligned with known TIPs from A. thaliana, P. trichocarpa, Quercus petraea, and V. vinifera using CLUSTALX25. Phylogenetic relationships were inferred using the neighbor-joining method with 1000 bootstrap replicates implemented by the MEGA 7 software package6. Branches with <50% bootstrap support were collapsed. Accession numbers of the sequences used in the phylogenetic analyses are as follows: AtTIP1.1 (At2g36830), AtTIP1.2 (At3g26520), AtTIP1.3 (At4g01470), AtTIP2.1 (At3g16240), AtTIP2.2 (At4g17340), AtTIP2.3 (At5g47450), AtTIP3.1 (At1g73190), AtTIP3.2 (At1g17810), AtTIP4.1 (At2g25810), AtTIP5.1 (At3g47440), QqTIP1.1 (JQ846274), QqTIP2.1 (JQ846275), QqTIP2.2 (JQ846276), VvTIP1.1 (GSVIVP 00018548001), VvTIP1.2 (GSVIVP00000605001), VvTIP1.3 (GSVIVP00022146001), VvTIP1.4 (GSVIVP00024394001), VvTIP2.1 (GSVIVP00034350001), VvTIP2.2 (GSVIVP00012703001), VvTIP3.1 (GSVIVP00013854001), VvTIP4.1 (GSVIVP00032441001), VvTIP5.1 (GSVIVP00029946001), VvTIP5.2 (GSVIVP00019170001), PtTIP1.1 (549212), PtTIP1.2 (833283), PtTIP1.3 (822504), PtTIP1.4 (656044), PtTIP1.5 (667870), PtTIP1.6 (589502), PtTIP1.7 (558321), PtTIP1.8 (828458), PtTIP2.1 (548890), PtTIP2.2 (645978), PtTIP2.3 (817166), PtTIP2.4 (676397), PtTIP3.1 (584517), PtTIP3.2 (811826), PtTIP4.1 (561759), PtTIP5.1 (414059), PtTIP5.2 (423803). The Phytozome IDs of the mined E. grandis TIPs are: EgTIP1.1 (Eucgr.K02438), EgTIP1.2 (Eucgr.J00051), EgTIP1.3 (Eucgr.B02403), EgTIP1.4 (Eucgr.J02074) EgTIP2.1 (Eucgr.F03054), EgTIP2.2 (Eucgr.D02090), EgTIP2.3 (Eucgr.D02507), EgTIP3.1 (Eucgr.K02339), EgTIP3.2 (Eucgr.H00668), EgTIP4.1 (Eucgr.C02914), and EgTIP5.1 (Eucgr.K00164).
Molecular Modeling
The deduced aa sequences of EgTIPs representing each TIP group (EgTIP1.1; EgTIP2.1; EgTIP3.1; EgTIP4.1, and EgTIP5.1) were employed for the construction of the models. These structures were predicted based on the alignment data generated by the program Phyre2 that uses homology detection methods to build 3D models (Kelley et al., 2015). Considering the quality of the structure, the crystallographic structure of the A. thaliana aquaporin TIP2.1 (AtTIP2.1) at 1.18 Å resolution (PDB ID: 5I32, Chain A) (Kirscht et al., 2016) was chosen as template. The program MODELLER 9v16 (Sali and Blundell, 1993; Marti-Renom et al., 2000) was used to generate the protein models and rank them according to the DOPE (Discrete Optimized Protein Energy) score. The best TIP models were selected based on the stereochemical parameters using the program RAMPAGE (Lovell et al., 2003). The ConSurf Server (Landau et al., 2005; Ashkenazy et al., 2010) was used for conservation analysis and all images were generated using the PyMOL program (Schrödinger, 2011).
PEG-Imposed Osmotic Stress
The Eucalyptus plantlets (two months old) were transferred to hydroponic culture by means of a floating system and maintained in an aerated Hoagland’s nutrient solution (75%) at pH 6.0 (osmotic potential of -0.1 MPa) before stress imposition. After an acclimatization period, 50% of the tested plantlets were stressed by adding 215 g of polyethylene glycol 8000 (PEG; Sigma, USA) to 1 L of culture medium to induce osmotic stress, while the remaining were maintained in Hoagland’s nutrient solution (75%) throughout the assay as control. The osmotic potential of the PEG 8000-treated solution was -0.6 MPa (WP4-T, Decagon Devices, Inc., England). A compressed air system was used to homogenize the solutions in both the tray and the PEG container to avoid anoxia of the roots.
Both control and stress treatments comprised 15 plantlets per tray, and three trays per treatment (control/treated plantlets), representing three biological replications. To carry out the gene expression analyses, the roots, stems and leaves from three randomized plantlets per tray were collected after 6 h (short-term), 12 h (medium-term), and 24 h (long-term) of PEG-treatment. Organ samples from untreated control plantlets were simultaneously collected at each time-point. To reduce plant-to-plant variation, each collected group of organ samples was pooled before RNA extraction.
EgTIP Expression Analyses
The relative expression of the EgTIP genes was assessed using quantitative real-time RT-PCR (RT-qPCR). Total RNA extraction and cDNA synthesis were performed as previously described (Rodrigues et al., 2013). The qPCR analyses were carried out using Power SYBR Green Master Mix (Applied Biosystems) and a StepOnePlus Real Time PCR System (Applied Biosystems). The cycling conditions were as follows: 5 min at 95°C, followed by 45 cycles of 15 s at 95°C and 60 s at 60°C. Each reaction was performed in triplicate in a total volume of 10 μl, and contained 20 ng of cDNA and 0.2 μM of each EgTIP-specific primer (Supplementary Table S1). Among five selected E. grandis reference genes (Actin, GAPDH, Cdk8, Transcription elongation factor s-II, and Aspartyl-tRNA synthetase; de Oliveira et al., 2012) tested, actin was the most stable and thus employed as endogenous control (Supplementary Table S1; Goicoechea et al., 2005). Cycle threshold (Ct) values were obtained for each sample, and relative quantification was determined using the 2-ΔΔCt method as described (Livak and Schmittgen, 2001) Amplification efficiencies were derived from the amplification plots using the program LinRegPCR (Ramakers et al., 2003). A value of two was used in calculations. For the expression analysis under osmotic stress, the relative expression of each EgTIP at a given time point was determined as the fold change of its expression under treated condition relative to its expression under control condition.
Relative expression data were analyzed using the Relative expression software tool (REST 2009) and differences with p-values <0.05 were considered statistically significant. The heatmaps were created using the function heatmap.2 from plot package at R environment. For the organ/tissue-specific gene expression analyses, normalization was performed using 1-month-old plantlets as control sample as previously reported (Yu et al., 2014). According to Yu et al. (2014), these plantlets represent a highly stable and less variable sample that contain the main investigated organs/tissues. Additional expression analyses were performed using publicly available RNA-Seq data7 generated for six different vegetative organs/tissues (young and mature leaves, shoot tips, phloem, immature xylem and xylem) from a 6-year-old E. grandis X E. urophylla hybrid clone (Mizrachi et al., 2010). In this case, transcript abundances were expressed as units of normalized FPKM (fragments per kilobase of exon per million fragments mapped), that were used for heatmap construction.
Results
Identification and Analysis of the Eucalyptus TIP Genes
BLAST searches in the E. grandis genome identified 11 putative TIP coding sequences (Table 1), thus indicating that the Eucalyptus TIP subfamily has 11 members (refereed as EgTIP) and not 5 as previously suggested (Rodrigues et al., 2013). To analyze in more detail, the evolutionary relationships between the identified EgTIPs and those present in other plant species, an unrooted phylogenetic tree was constructed using the predicted protein sequences (Figure 1). Based on their phylogenetic relationships, the EgTIPs could be individually assigned to each of the classical TIP1–5 groups (Johanson et al., 2001), and were named accordingly (EgTIP1.1, EgTIP1.2, EgTIP1.3 and EgTIP1.4; EgTIP2.1, EgTIP2.2 and EgTIP2.3; EgTIP3.1 and EgTIP3.2; EgTIP4.1; and EgTIP5.1). In general, the corresponding groups, with the exception of group 1, were supported by moderate to high bootstrap values. The identity at the aa level varied according to the TIP group considered: 79–88% identity between EgTIP1s, 76%–47% identity between EgTIP2s and 77% between EgTIP3s. Taking into account the tree topology, EgTIP2.3 was grouped with known TIP5 isoforms, being closely related to VvTIP5.2 (61% identity at the aa level). Nevertheless, the inspection of the ar/R selectivity residues of both VvTIP5.2 and EgTIP2.3 (see below) revealed a closer relationship with TIP2 isoforms. Therefore, based on its selectivity filter, EgTIP2.3 was assigned here as a TIP2 as originally proposed in Phytozome instead of a TIP5. In fact, the small subgroup formed by VvTIP5.2 and EgTIP2.3 is branched between the groups encompassing TIP5.1 and TIP2 isoforms. In this regard, EgTIP2.3 shares 44 and 47% aa sequence identity with EgTIP5.1 and EgTIP2.2, respectively. As observed in other plant species, the majority of the identified EgTIPs belongs to group 1 (four members) followed by group 2, 3, and 5 with two members each. The phylogenetic tree also revealed the presence of closely related gene pairs (EgTIP1.3/EgTIP1.4 and EgTIP3.1/EgTIP3.2, for example), suggesting possible gene duplication events.
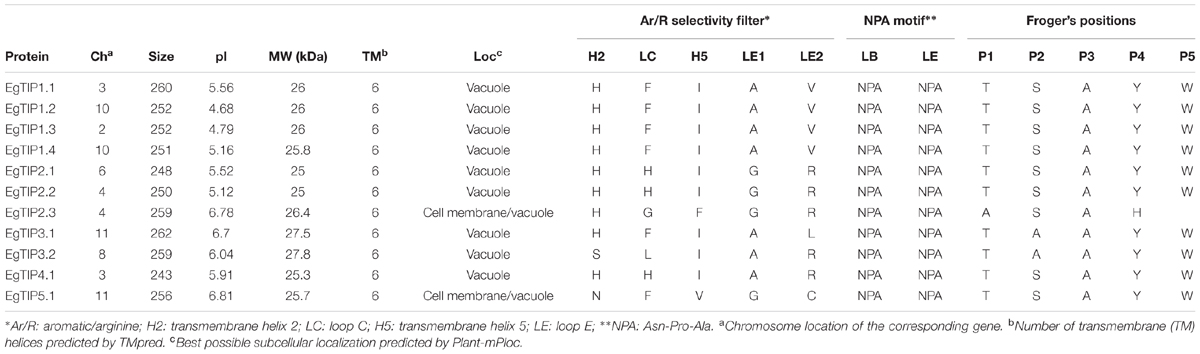
TABLE 1. Structural and subcellular localization analysis of the EgTIPs.
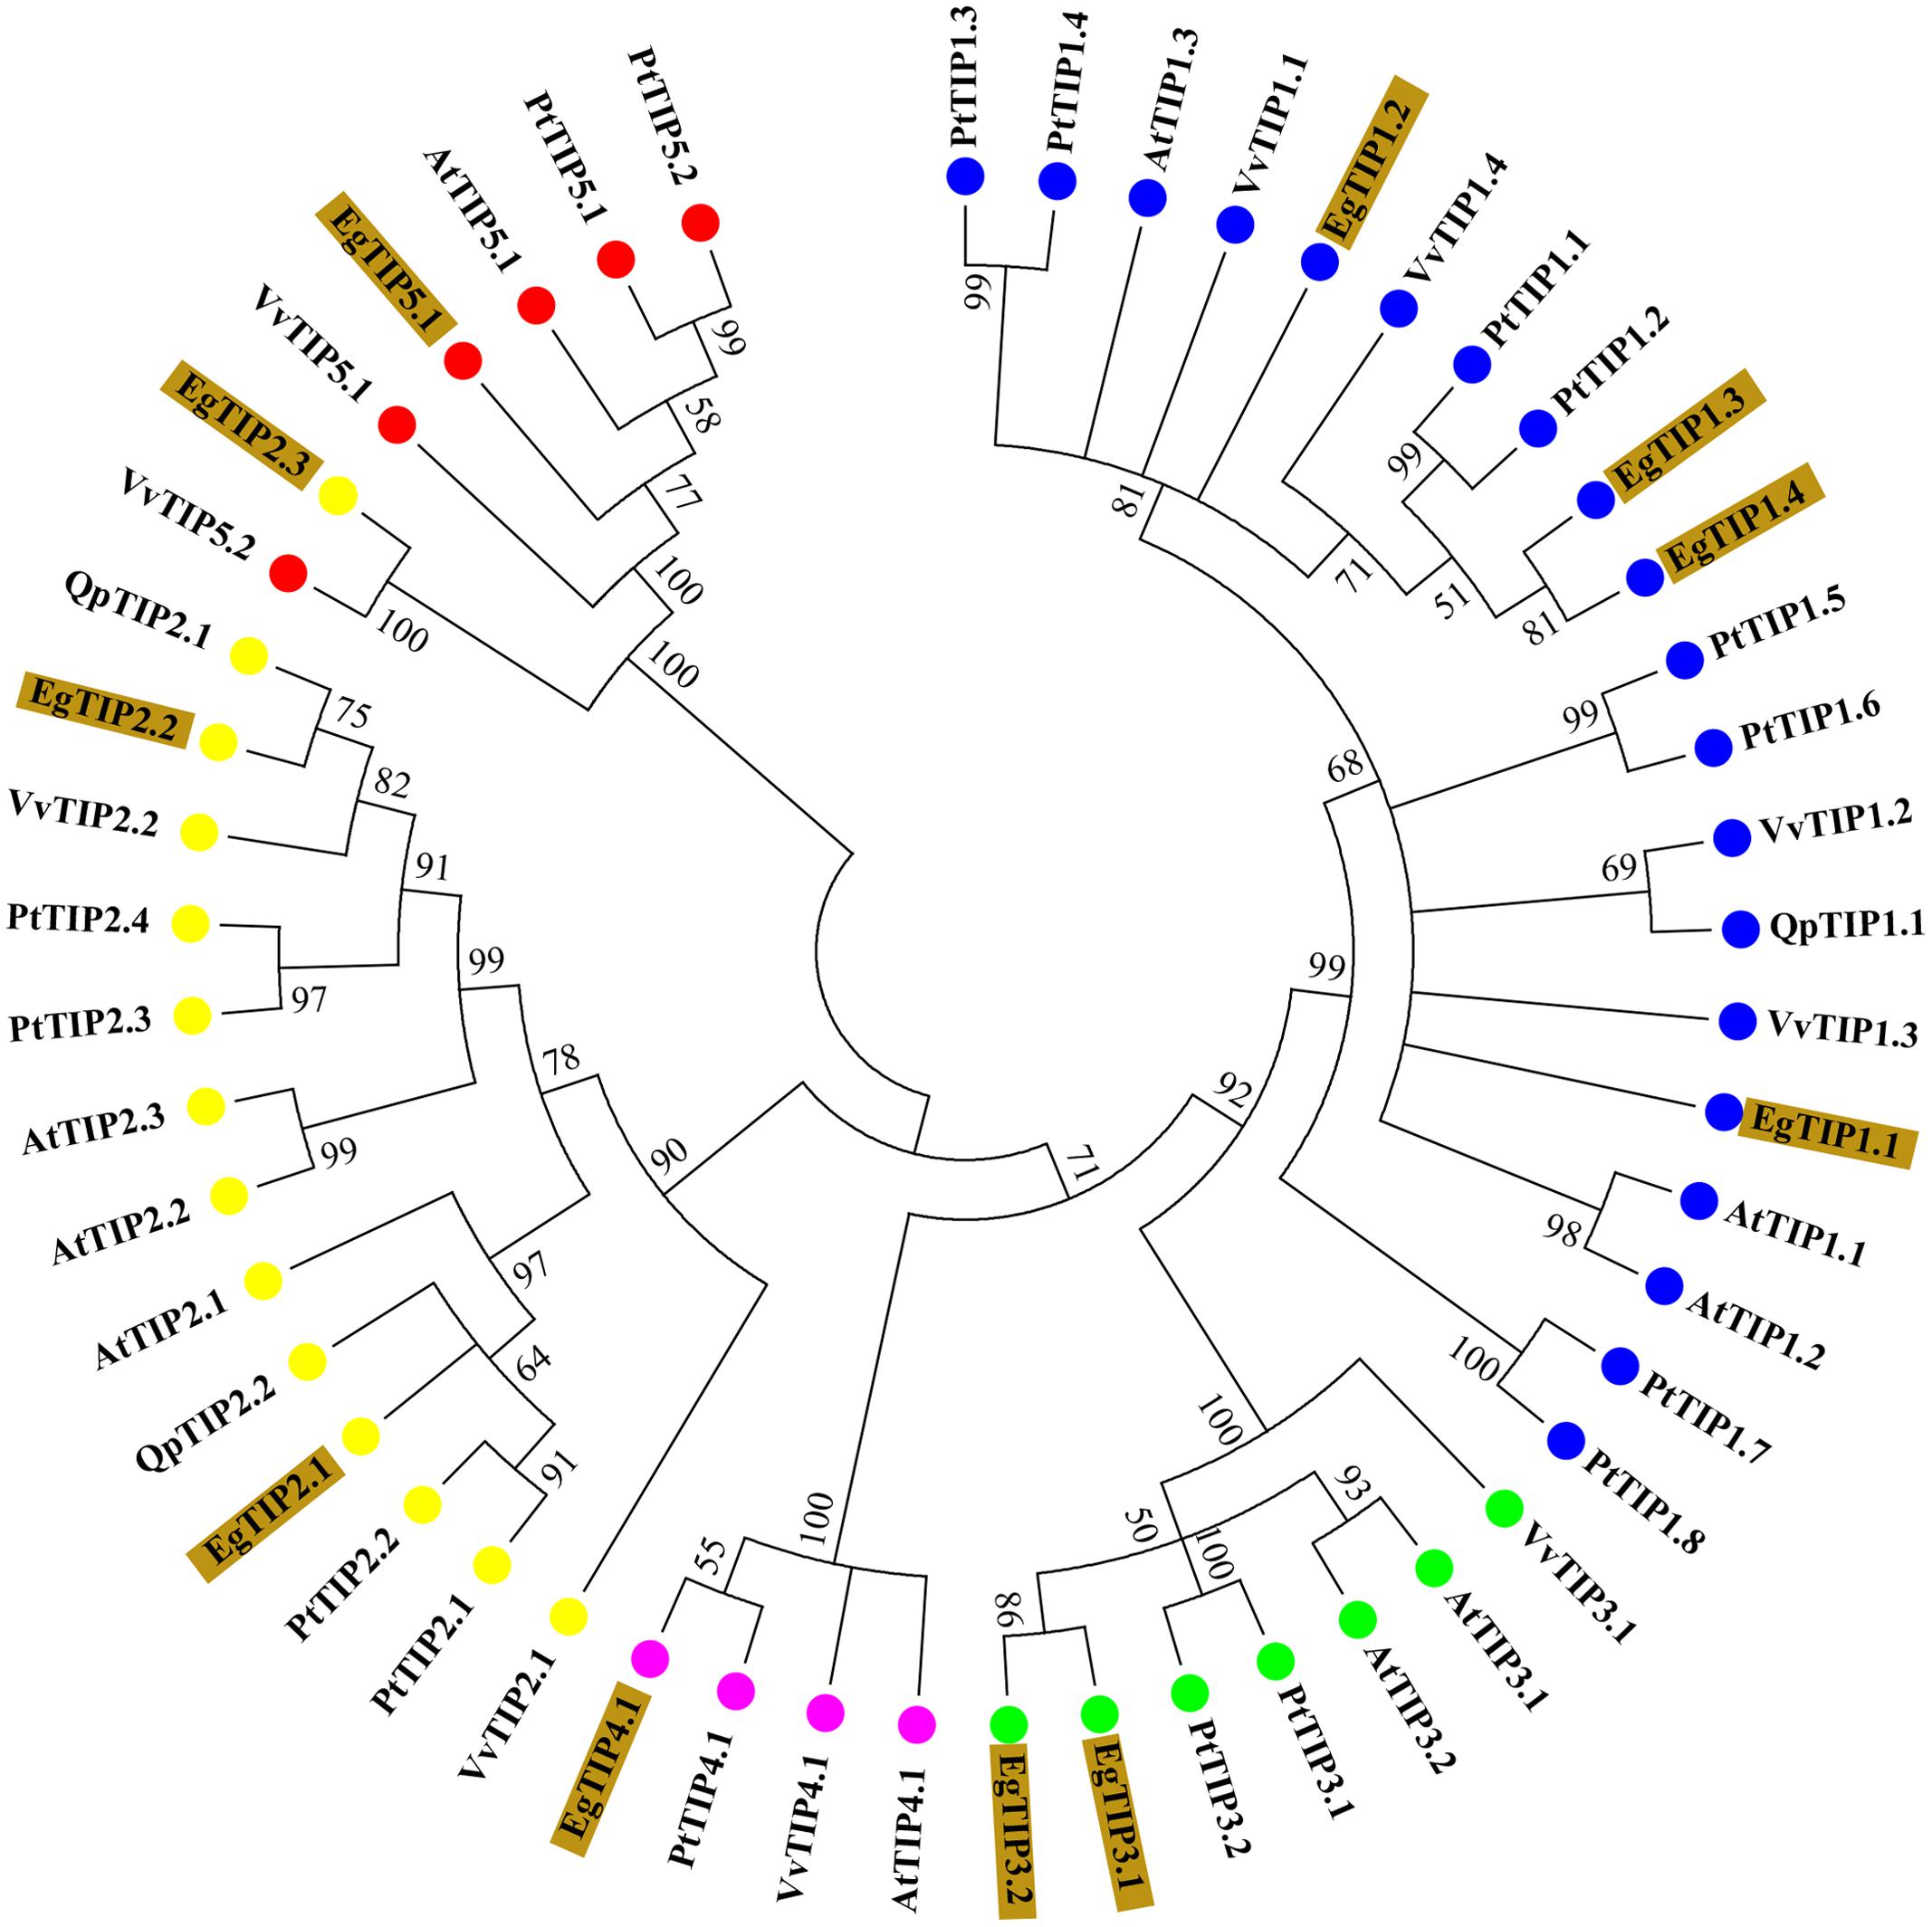
FIGURE 1. Phylogenetic relationships between Eucalyptus grandis (Eg), Arabidopsis thaliana (At), Populus trichocarpa (Pt), Vitis vinifera (Vv), and Quercus petreae (Qp) TIP proteins. The neighbor-joining unrooted phylogenetic tree was constructed using 1000 bootstrap replicas. Numbers next to each node indicate bootstrap values. Branches with <50% bootstrap support were collapsed. The identified EgTIPs are highlighted in brown while each TIP group (1-5) is indicated by colored circles.
Analysis of the genomic structure of the annotated EgTIP genes revealed a two-intron/three-exon organization, except for EgTIP1.1 that contained two exons disrupted by a single intron (Figure 2). These introns showed variations in length and position. Consistent with this, most members of the TIP subfamily of dicot species share such a well-conserved two-intron/three-exon pattern (Regon et al., 2014). Regarding their chromosomal distribution, the EgTIP genes are located on seven (2, 3, 4, 6, 8, 10, and 11) out of the eleven eucalyptus chromosomes (Table 1). In general, one or two genes are found per chromosome. In this context, EgTIP1.1 and EgTIP4.1 (on 3), EgTIP1.2 and EgTIP1.4 (on 10), EgTIP2.2 and EgTIP2.3 (on 4) and EgTIP3.1 and EgTIP5.1 (on 11) are among those located on the same chromosome.
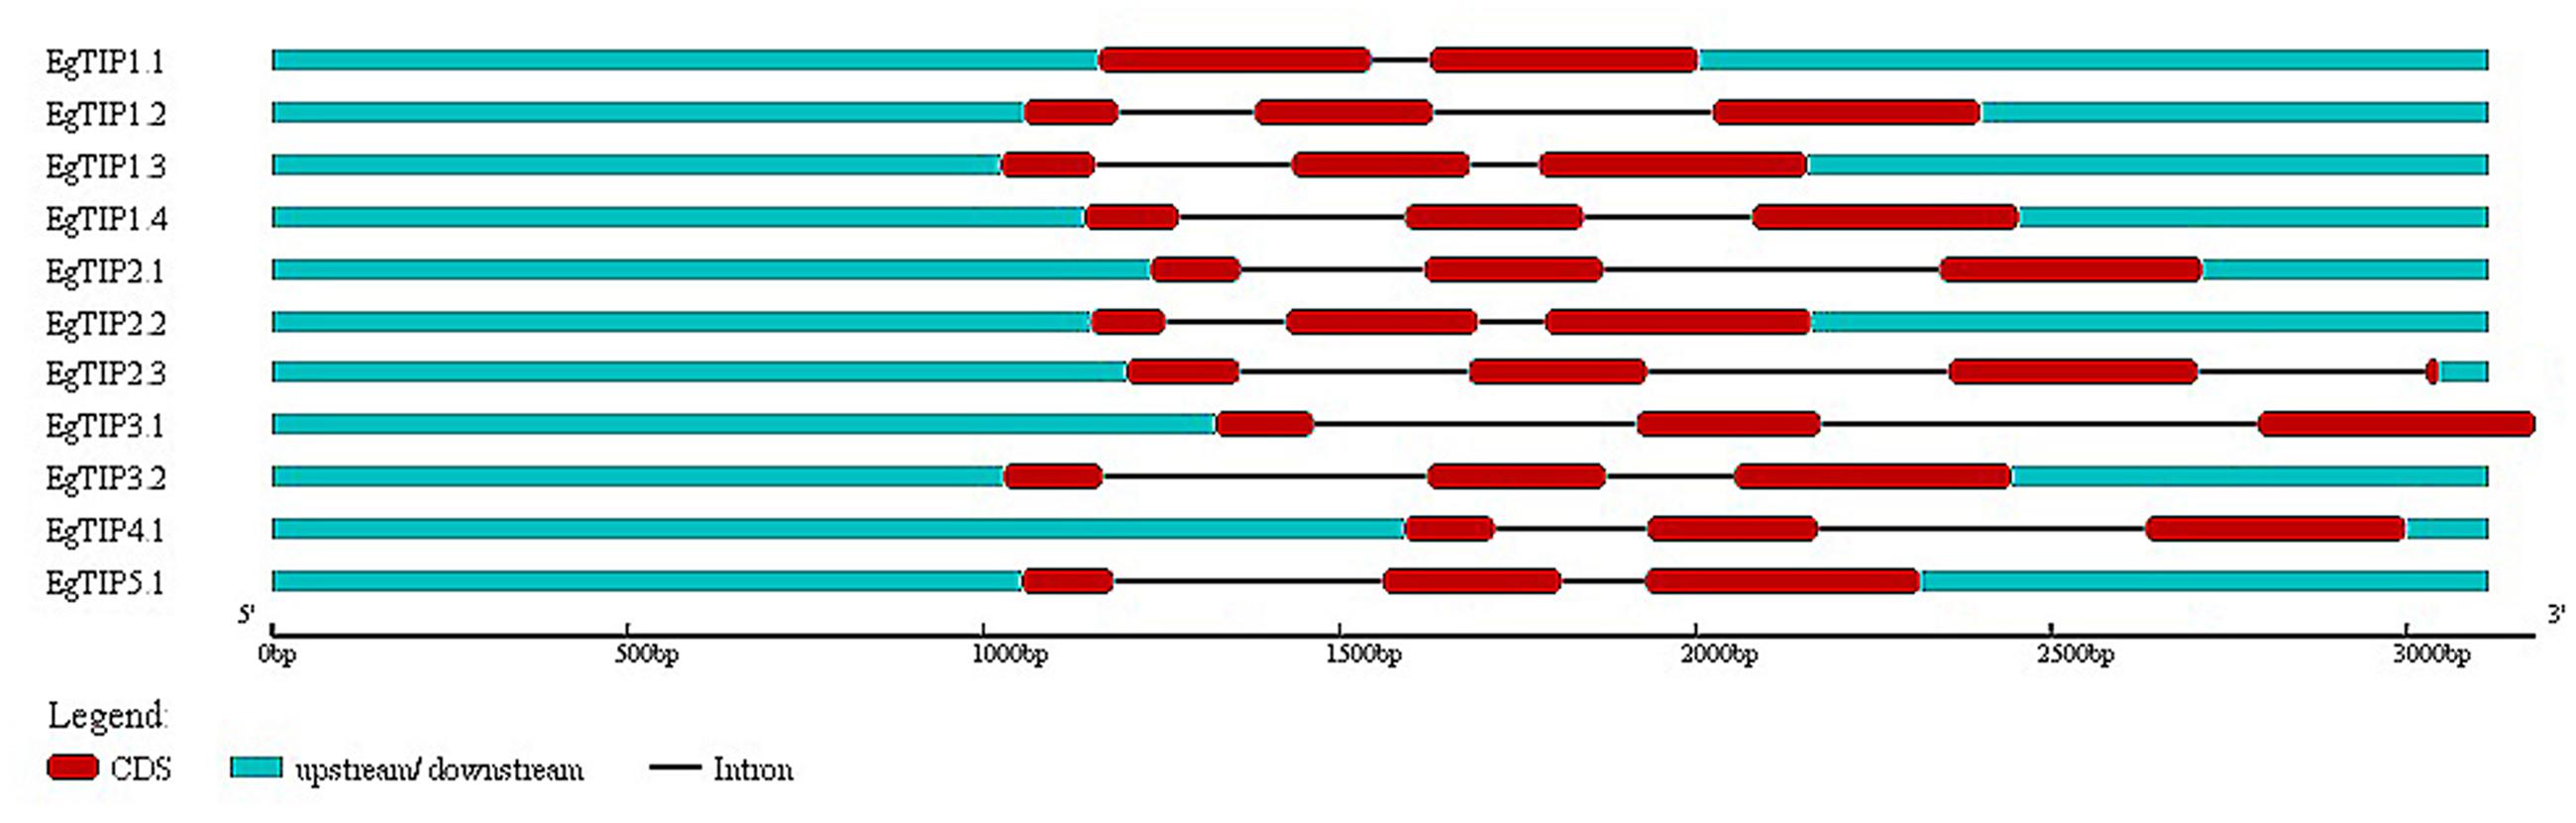
FIGURE 2. Schematic representation of the exon/intron structures of the EgTIP genes. The exons are represented by red rectangles and introns by thin black lines. The untranslated regions are depicted in blue. Lengths in nucleotides are shown at the bottom. The graphic representation was displayed using GSDS v2.0.
An additional locus search at the PGDD website was performed to evaluate possible EgTIP gene duplication. According to the resulting data, the following gene pairs were observed: EgTIP1.3/EgTIP1.4, EgTIP2.1/EgTIP4, EgTIP3.1/EgTIP3.2, and EgTIP2.2/EgTIP2.3. Among them, only EgTIP2.2 and EgTIP2.3 are located on the same chromosome (4), and may possibly represent tandemly duplicated genes. To investigate the mechanisms involved in gene duplication evolution after divergence, we calculated the Ka/Ks ratio of each EgTIP gene pairs. The results (Supplementary Table S2) revealed that the Ka/Ks ratios of all four EgTIP gene pairs were less than 0.4, implying that these genes had undergone purifying selection pressure with limited functional divergence after duplication.
Structural Features of the Identified EgTIPs
The deduced EgTIP proteins ranged in size from 243 (EgTIP4.1) to 262 (EgTIP3.1) aa residues, with molecular weights (MW) and theoretical isoelectric point (pI) values raging between 25 and 27.8 kDa and 4.68 and 6.81, respectively (Table 1). These proteins are all predicted to contain six transmembrane α-helices (H1–H6) and five loops. Concerning their sub-cellular localization, all EgTIPs are predicted to be located in the vacuole, with the exception of EgTIP5.1 and EgTIP2.3, that are also localized at the cell membrane (Table 1).
To evaluate structural similarities and differences, theoretical models for EgTIPs representing each classical TIP group were constructed using a comparative modeling approach and the crystallography structure of AtTIP2.1 at 1.18Å resolution (Kirscht et al., 2016) as a template. The sequences shared 53–85% aa identity and 90–95% of coverage. As expected, all models contained the six α-helices and interhelical loop regions as seen throughout the aquaporin family. The best models showed good stereochemical quality with 96.9% of the residues in favored regions, 2.6–1.7% and 0–0.9% (corresponding to two residues) in allowed and disallowed regions, respectively (Supplementary Table S3).
Residue conservation was reflected by surface mapping of the aa sequences of several plant TIPs over the generated EgTIP1.1 model (Figure 3). An overall evaluation of the EgTIP models detected the dual NPA (Asn-Pro-Ala) motifs conserved in all structures (Figures 3A,C; Supplementary Figure S1). In contrast, the key residues of the selectivity filter (positions H2, H5, LE1, and LE2) displayed some variations between the modeled proteins (Table 1; Figures 3B,C; Supplementary Figure S1). In all EgTIP1 and EgTIP2, the tetrad of the ar/R selectivity filter was composed of HIAV and HIGR, respectively (Table 1; Supplementary Figure S1). Despite showing phylogenetic relationships with TIP5 isoforms (Figure 1), the selectivity filter of EgTIP2.3 (HFGR) resembles the one found overall in group 2 members (HIGR; Figure 3E). Remarkably, EgTIP2.3 lacks the I residue in the H5 position, but has instead an F residue that preserves the hydrophobicity. Interestingly, the closest homologue of EgTIP2.3, VvTIP5.2, also harbors a classical TIP2-like selectivity filter (HIGR). For the other EgTIPs, slight residue variations at specific positions were observed (Table 1; Figure 3D). According to previous reports, a V residue is typically found at the LE2 position of TIPs from group 1, while an R is found in TIPs from groups 2, 3, and 4, whereas a C residue is present in all group 5 TIPs (Wallace and Roberts, 2004; Gupta and Sankararamakrishnan, 2009). In this regard, EgTIP3.1 harbors an atypical L residue in this position, while an R residue in EgTIP2.3 replaces the usual C residue (Table 1; Figure 3D). In addition, compared to the other EgTIPs, EgTIP3.2 and EgTIP5.1 harbor changes in the H2 position (S and N, respectively, instead of H), while EgTIP5.1 and EgTIP2.3 display variations in H5 (V and F, respectively, instead of I) (Table 1; Figure 3D).
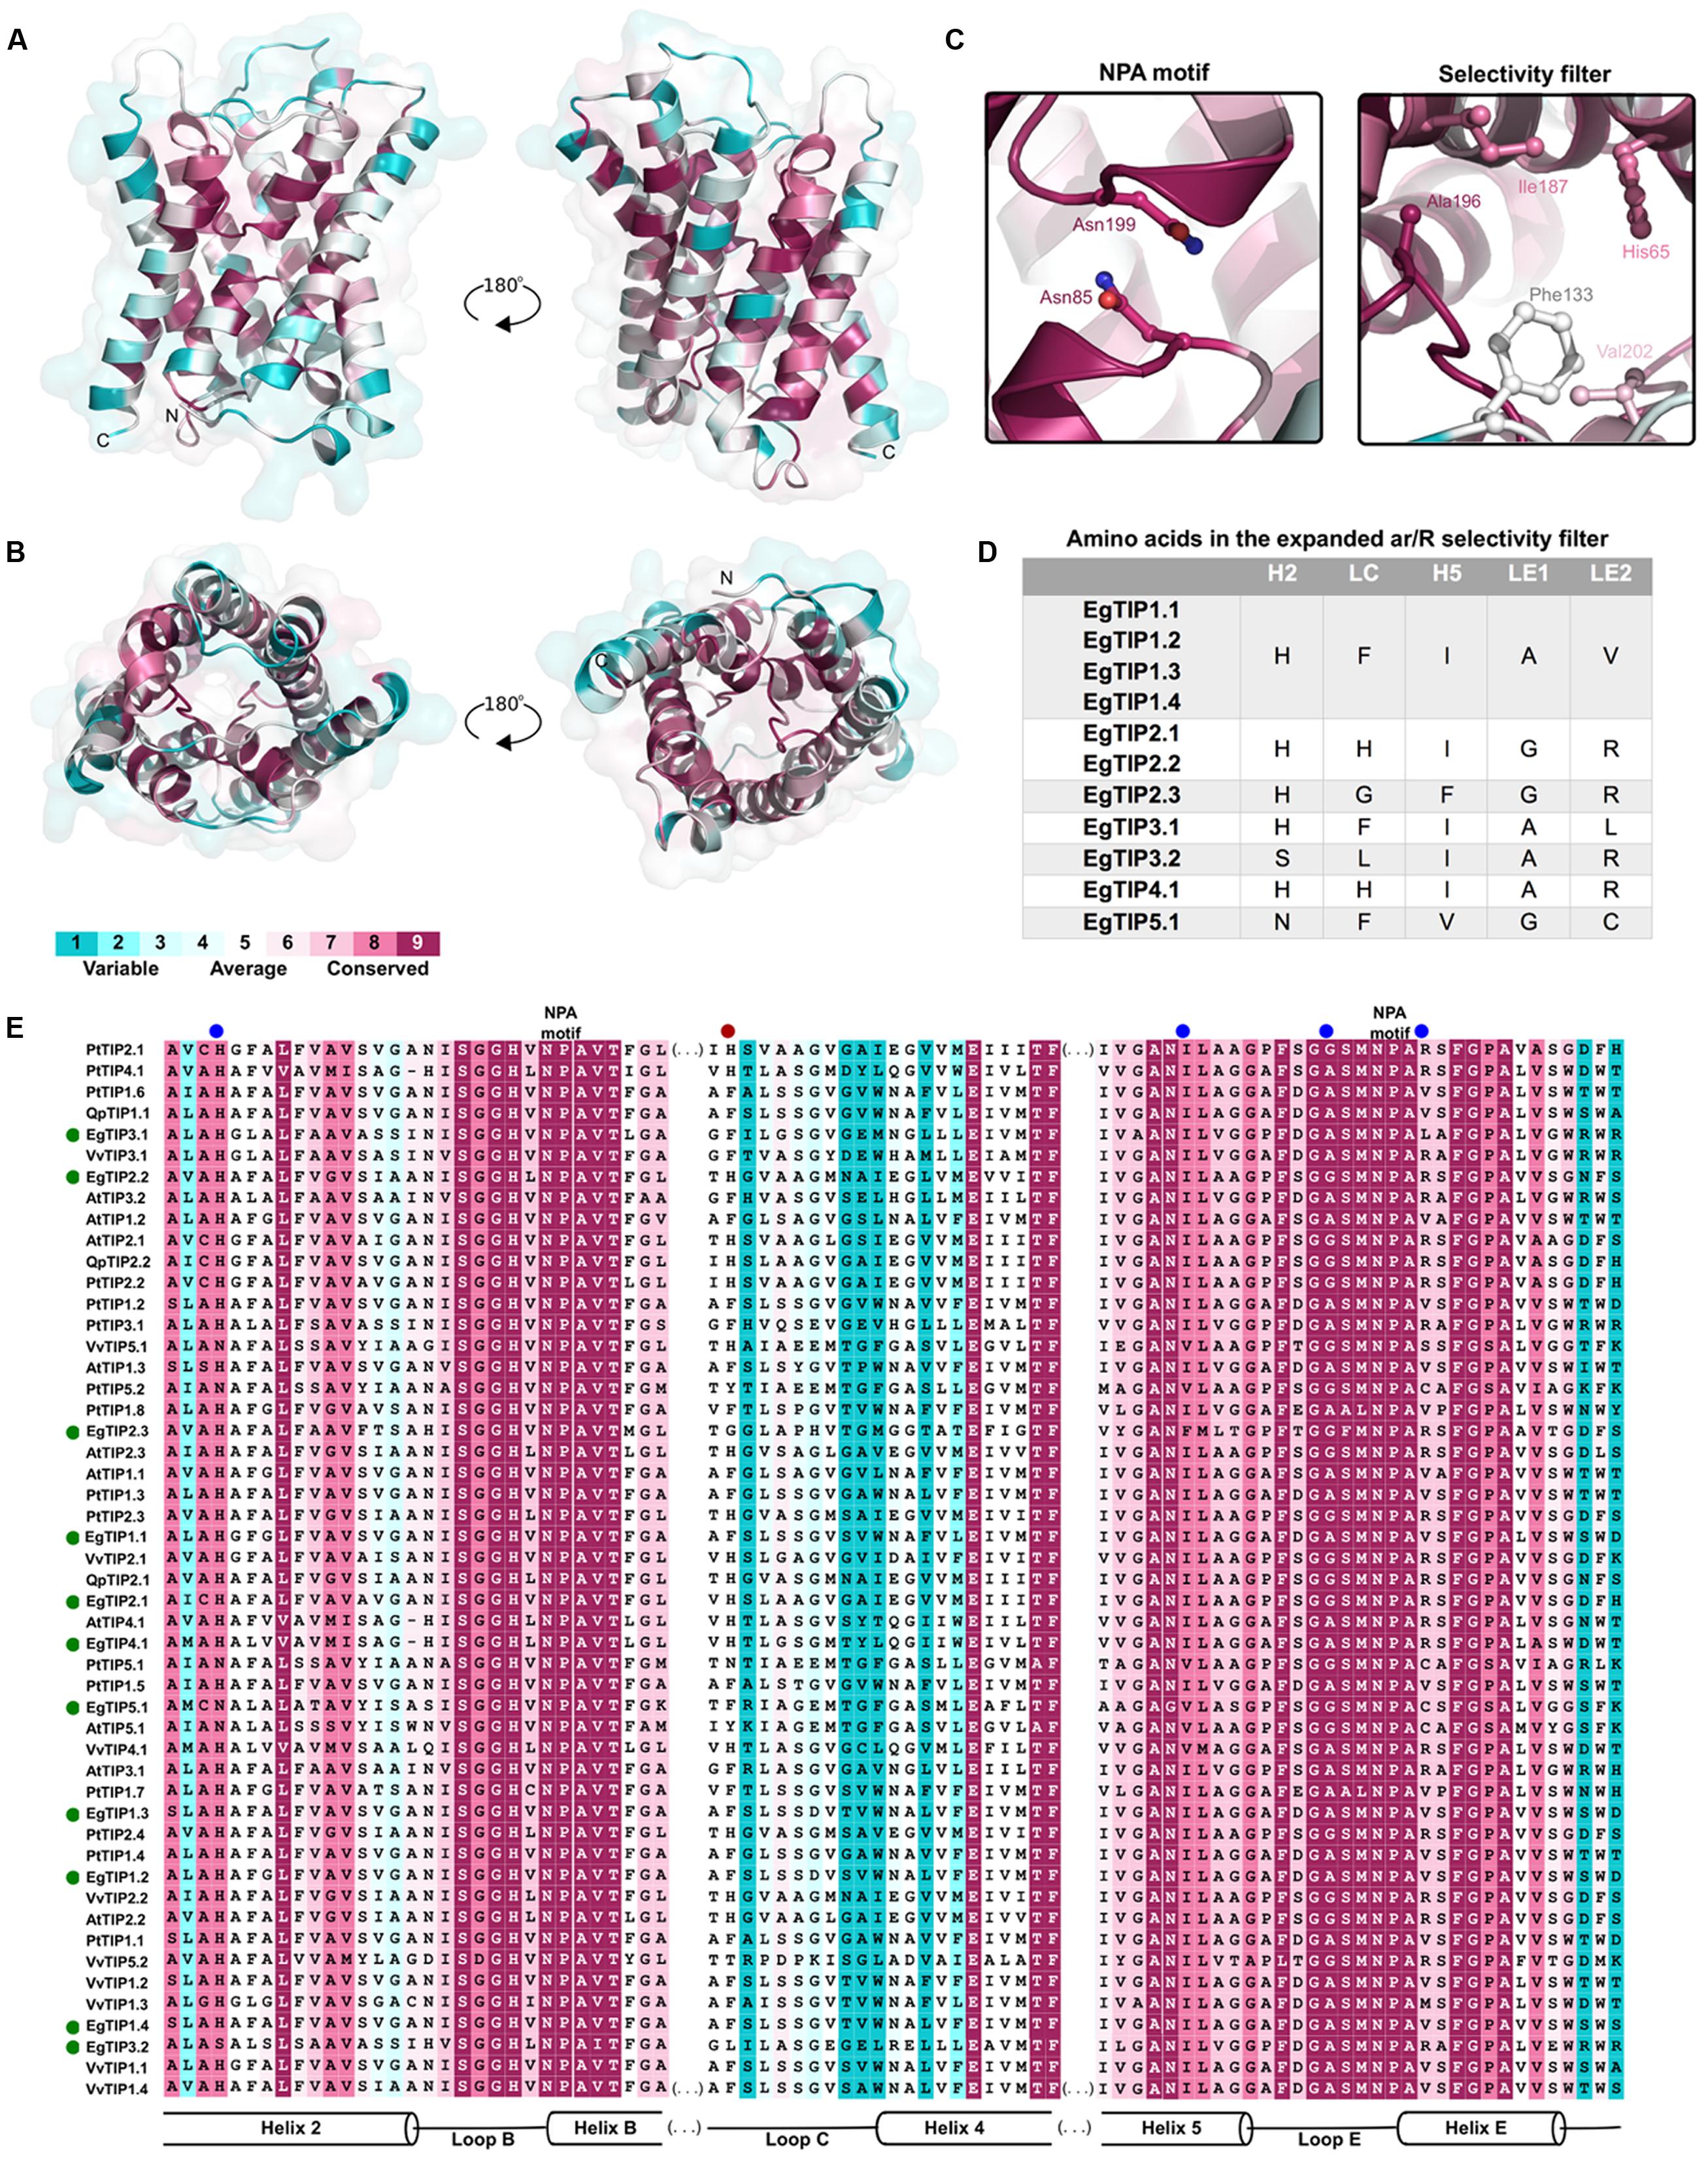
FIGURE 3. Conservation of the EgTIP proteins. The protein sequences employed for the construction of the phylogenetic tree were used and residues were colored according to conservation. (A) Lateral view of EgTIP1.1 shown in ribbon representation in two positions. (B) Top and bottom views of EgTIP1.1. (C) Residues of the NPA motif and selectivity filter shown in stick representation. (D) Residues of the expanded selectivity filter. (E) Multiple sequence alignment colored according to the surfacing mapping of the EgTIP1.1 model. The green and blue dots indicate EgTIP sequences and residues of the selectivity filter, respectively. The red dot corresponds to the residue from the expanded selectivity filter.
Further comparison of the EgTIP-deduced aa sequences with those of other plant TIPs revealed that TIP members of groups 1 and 2 have the most conserved selectivity filters, including the H residue located in loop C (LC) of the proposed extended ar/R filter (Kirscht et al., 2016) (Figures 3D,E). VvTIP1.3 from V. vinifera, that possesses an M residue instead of a V in the LE2 position, is the only exception. The members of group 3 have most conserved residues in the H5 and LE1 positions and small variations in the H2 and LE2 positions. On the other hand, group 4 members have differences mainly in the LC and H5 positions, while EgTIP5.1 have the most variable LC positions.
The EgTip Genes Show Enriched Organ/Tissues Profiles
To investigate the spatiotemporal expression profiles of the identified EgTIP genes, we first assessed their relative expression over a panel of different Eucalyptus organs/tissues using RT-qPCR. As shown in Figure 4, all members of the EgTIP subfamily, except EgTIP5.1, were transcribed. Among the genes investigated, solely EgTIP1.1 had a relatively broad distribution among organs/tissues, being expressed at moderate levels in the roots, stems, flowers and flower buds. In contrast, the other EgTIP genes surveyed showed distinctive organ/tissue-enriched expression. Of the genes grouped in the so-called group 1, EgTIP1.3 was preferentially expressed in vascular cambium and stems, EgTIP1.4 in flowers and flower buds, and EgTIP1.2 in leaves and stems. Of group 2, EgTIP2.1, and EgTIP2.2 were both moderately expressed in flowers and flower buds, but recapitulating previous data (Rodrigues et al., 2013), EgTIP2.2 was also highly expressed in roots. Of note, EgTIP2.3 was barely detected in leaves and stems and was not included in the heatmap. The duplicated gene pair EgTIP3.1 and EgTIP3.2 shared a similar fruit-enriched expression, but EgTIP3.2 was also detected at moderate levels in leaves. Finally, EgTIP4.1 was prominent in the stems.
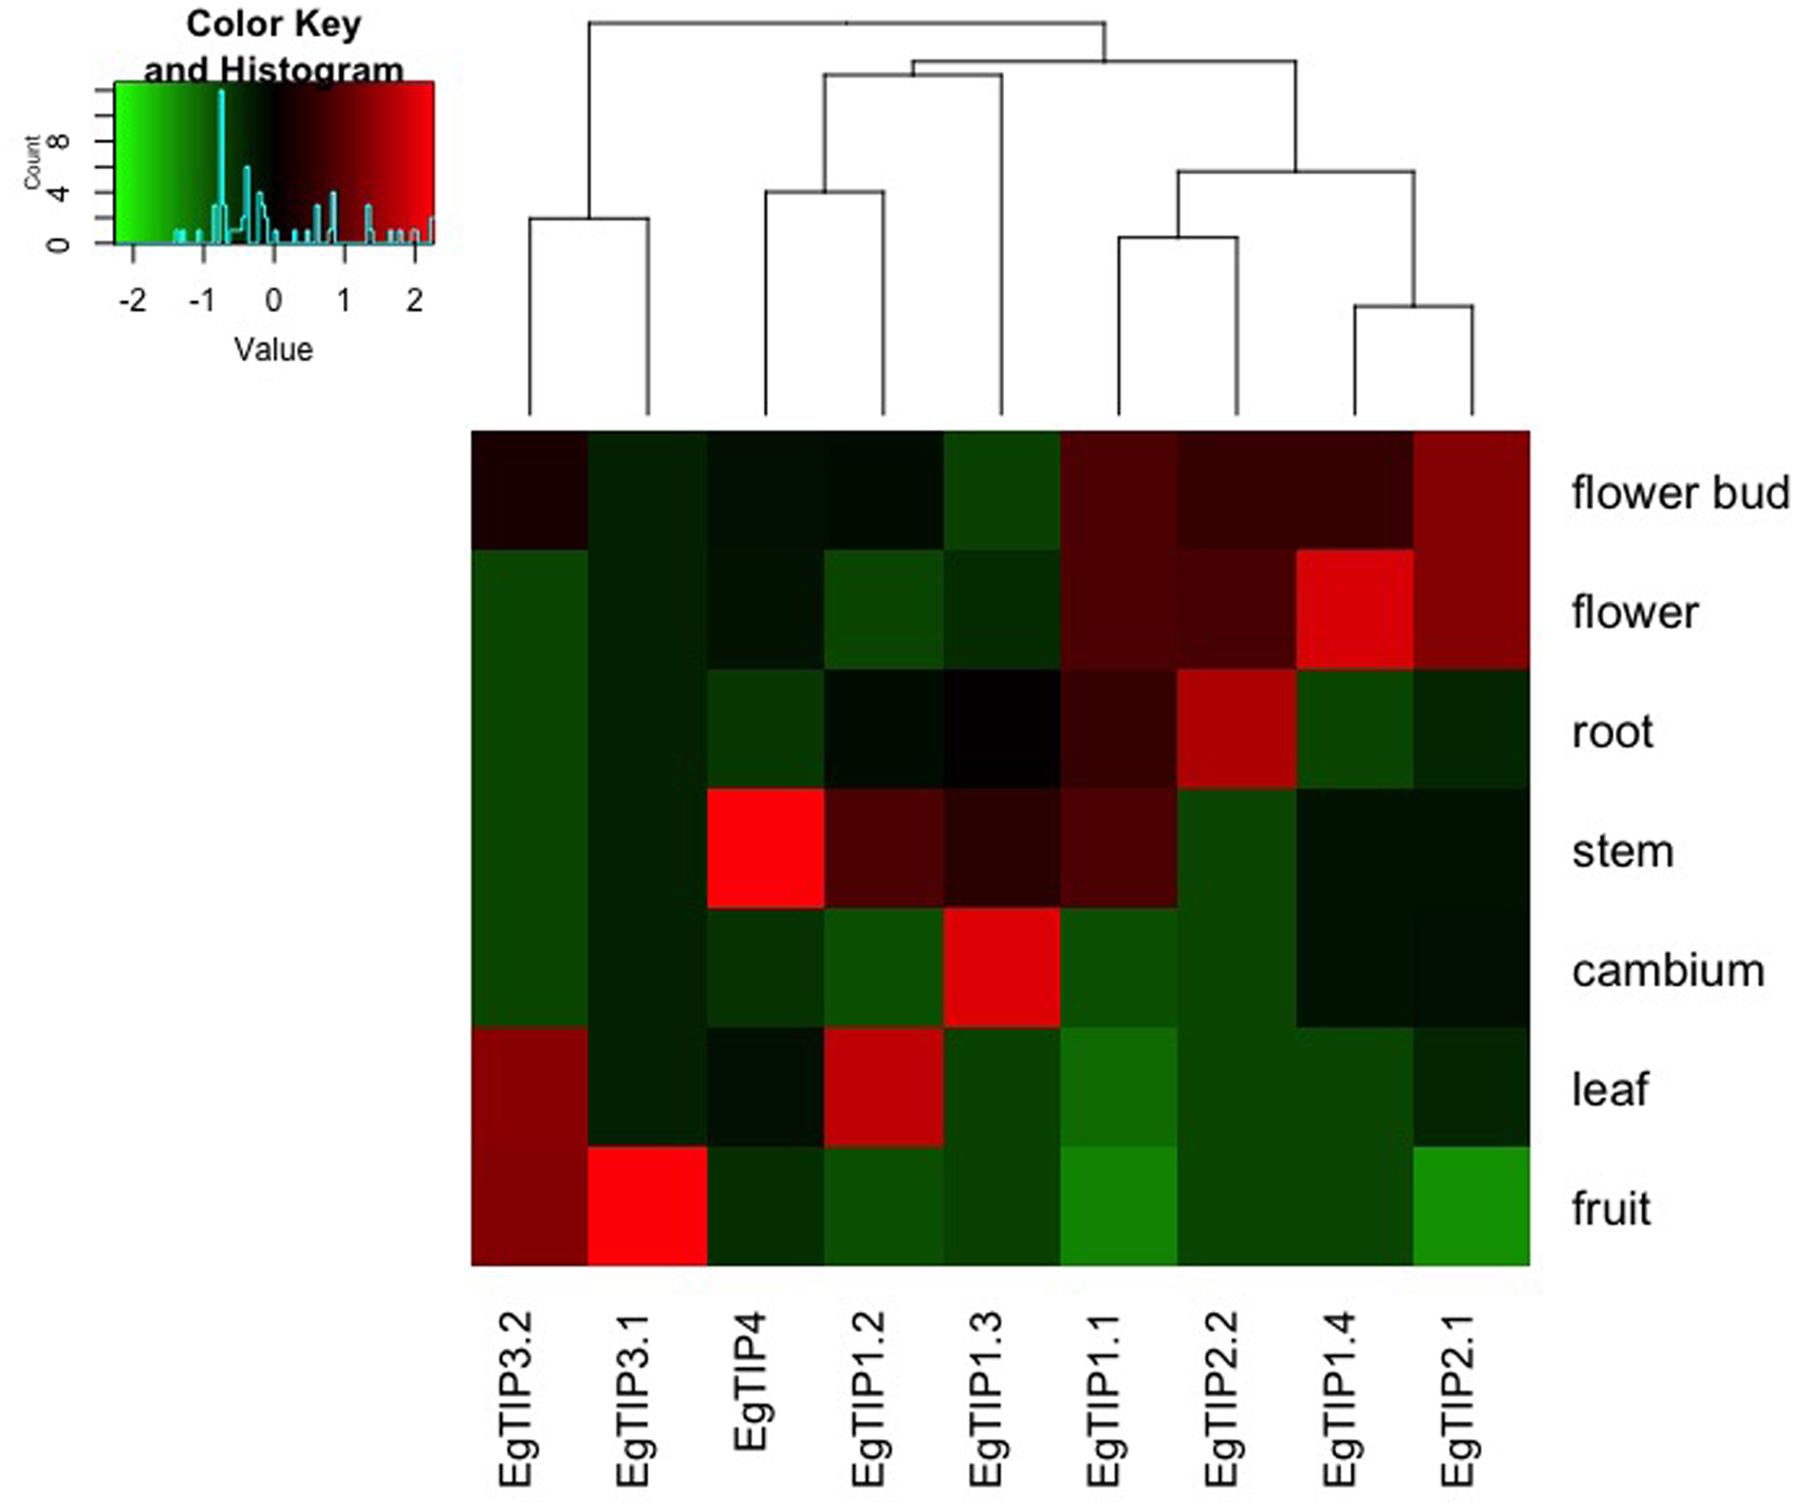
FIGURE 4. Expression profiles of EgTIP genes in different E. grandis organs/tissues. The heatmap was generated employing the relative expression of each EgTIP as determined by RT-qPCR normalized with the control sample (1-month-old plantlets). Red and green colors denote relatively high and lower expression compared to control, respectively. Genes were clustered according to their expression profiles. All samples were analyzed in triplicate.
EgTIP spatial expression patterns were further examined employing publicly available RNA-Seq data (FPKM values) from six different organs/tissues of a hybrid clone of Eucalyptus (Mizrachi et al., 2010). Interestingly, this dataset included vegetative and vascular tissue samples (such as phloem, xylem, and shoot tips) that were not represented in the previously performed RT-qPCR assays. According to the digital expression profiles generated (Figure 5), a wide expression pattern was observed for EgTIP2.1 and EgTIP1.1, which were detected at moderate to high levels in all organs/tissues examined. A similar pattern was observed for EgTIP1.2, except for its very low expression level in the phloem. According to our RT-qPCR assays, this gene was predominantly expressed in leaves (Figure 4). On the other hand, EgTIP1.4 was detected at moderate levels in mature leaves and at lower levels in young leaves and in shoot tips, while EgTIP4.1 was prominent in vascular tissues (phloem and xylem). This is consistent with the preferential expression of EgTIP4.1 in the stems as indicated by RT-qPCR (Figure 4). Contrasting with EgTIP5.1 that was not expressed, EgTIP2.3 was observed at very low levels in the phloem. The other EgTIP genes, including those mainly expressed in reproductive organs as determined by RT-qPCR, were almost undetectable in the RNA-Seq data surveyed. In this regard, the absence of EgTIP3.2 expression was particularly intriguing, especially because its transcripts were readily detectable in leaves by RT-qPCR (Figure 4). Overall, these results reveal a distinctive spatial distribution of the EgTIP genes, indicating that certain isoforms may act in a relatively organ-specific manner.
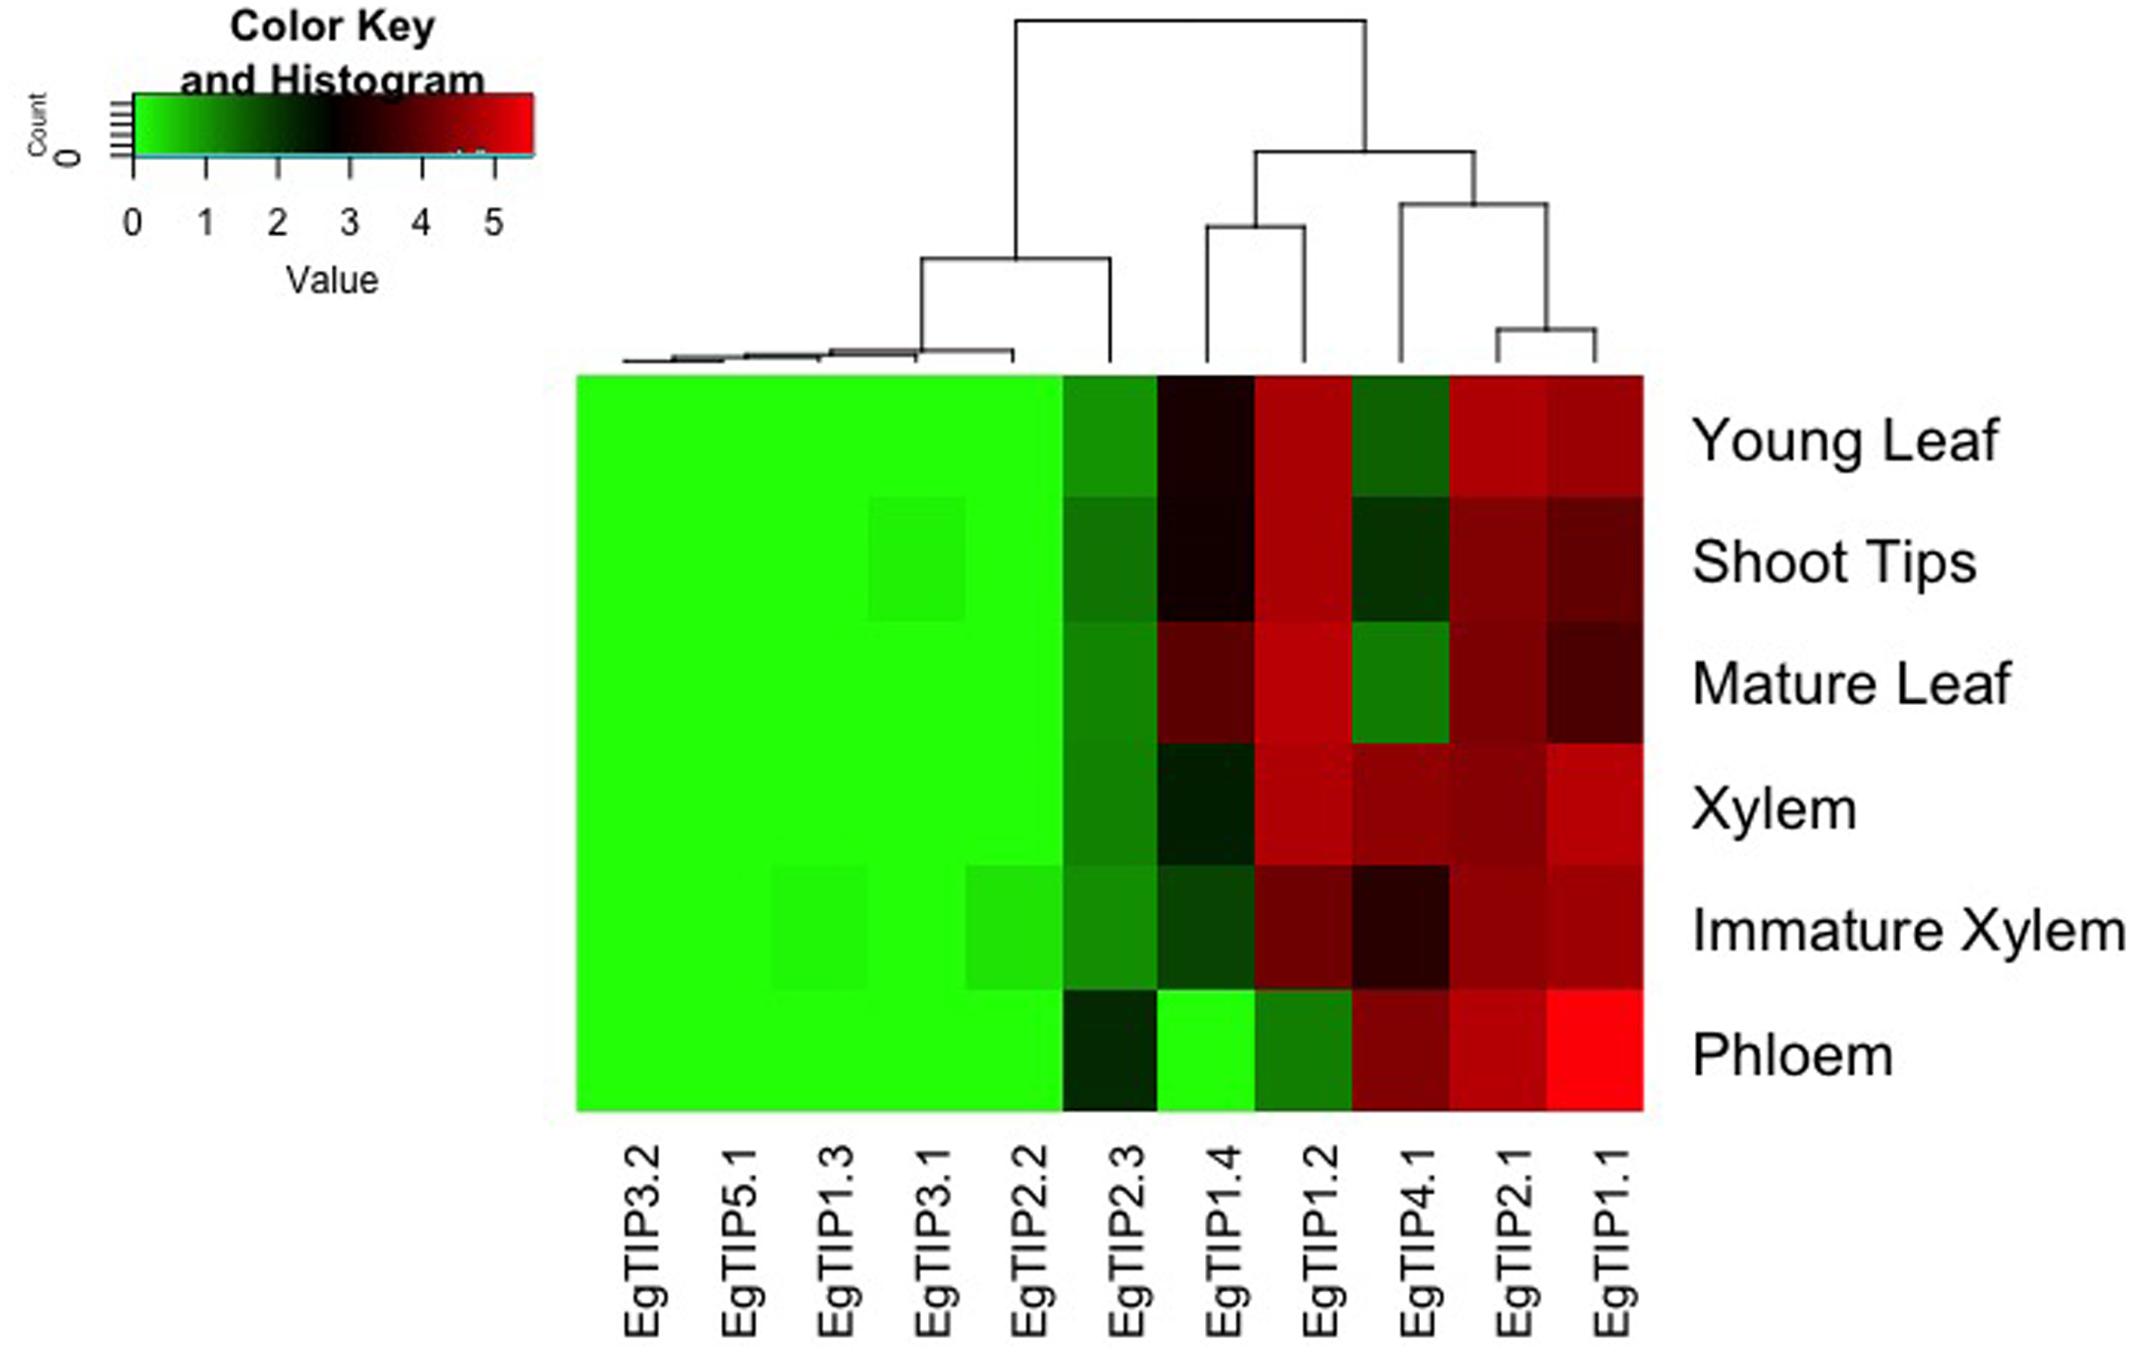
FIGURE 5. EgTIP expression profiles determined using the RNA-Seq data from different E. grandis organs/tissues. The heatmap was generated employing normalized FPKM values available at Phytozome. The color scale is the same as in Figure 4.
EgTIP Promoter Analysis Reveals the Presence of Stress-Related Regulatory Elements
Inspection of the 5′ upstream regions (1200 bp) of the EgTIP genes revealed the presence of several putative cis-regulatory elements mainly implicated in phytohormone and abiotic stress responses (Table 2). In this context, all EgTIP promoter regions, with the exception of EgTIP1.2, contained more than one ABA-responsive element (ABRE), involved in hormone responsiveness and in ABA-mediated abiotic stress signaling (Yamaguchi-Shinozaki and Shinozaki, 2005). The presence of ABRE in the promoters investigated suggests a possible role of ABA in the control of EgTIP expression as already reported for HvTIP1.2 and HvTIP3.1 in barley (Lee et al., 2015). Another well-represented regulatory element found in all the promoters investigated, except EgTIP2.3, was the TGACG-motif implicated in plant responses to methyl jasmonate (MeJA), a well-known primary signal in plant defense responses. Most EgTIP promoters (9 out of 11) also contained a MBS (MYB-binding site) motif generally recognized by MYB transcription factors implicated in drought and salt inducible gene expression. The circadian and SP1 elements known to play a role in circadian control and in light responses, respectively, were also detected in the majority of the EgTIP promoters. The circadian element is similarly over-represented in the promoter regions of aquaporin genes from sorghum (Reddy et al., 2015). Additional stress-related regulatory elements found in a small number of EgTIP promoters include TC-rich motifs, LTR, HSE and C-repeat/DRE (Table 2). Overall, these findings indicate that the EgTIP genes are regulated by phytohormones such as ABA and MeJA and differentially responsive to a set of abiotic stimuli. This prediction is supported by a previous study showing the modulation of EgTIP2.2 promoter activity by osmotic stress and ABA (Rodrigues et al., 2013). However, the functionality of such predicted elements requires further validation.
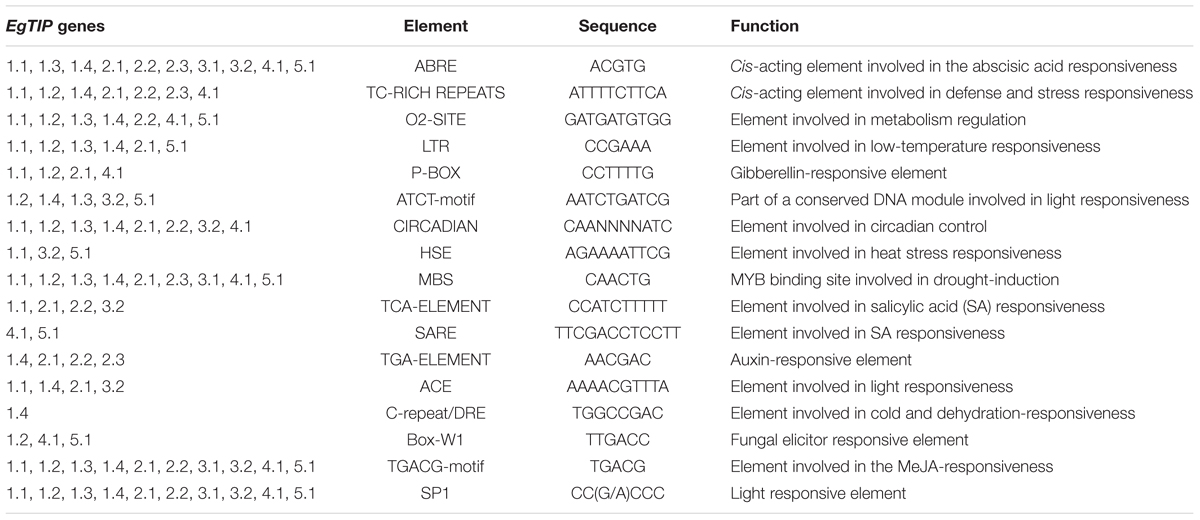
TABLE 2. Main cis-regulatory elements found in the EgTIP promoters.
EgTIP Expression Profiles Under PEG-Imposed Osmotic Stress
Taking into account the aforementioned promoter analysis, we decided to evaluate the stress-responsive expression of each EgTIP gene. For this, total RNA extracted from roots, stems and leaves of Eucalyptus plantlets treated with PEG 8000 for 6, 12, and 24 h was employed. Relative to the untreated control, the majority of the investigated EgTIPs, with the obvious exception of the fruit-enriched EgTIP3.1 and EgTIP3.2 genes (not shown), showed increased expression upon PEG-induced osmotic stress at one or more time points (Figure 6). The timing and magnitude of the observed changes in gene expression were quite diverse among the investigated organs. In roots, most EgTIPs showed moderate fold-changes and reached peak expression levels mainly at 12 h of stress imposition (Figure 6A). In contrast, the timing of maximal expression in the stems varied between the investigated genes and was most evident at 6 and 12 h of PEG treatment (Figure 6B). EgTIP1.2 showed maximum stress-induced fold-change in this organ at 12 h of PEG treatment. Compared to roots and stems, EgTIP expression was increased in leaves. In this organ, significant fold-changes were observed at 6 h, and more substantially, at 24 h of stress imposition (Figure 6C). At this time point, EgTIP1.1, EgTIP1.2, EgTIP1.3, and EgTIP2.3 appeared as the most responsive genes. Interestingly, despite being barely detectable in leaves and stems, EgTIP2.3 was moderately and highly induced by osmotic stress in the investigated organs. In addition, the expression of EgPIP2, which was used as an inducible control (Rodrigues et al., 2013), was monitored in parallel and shown to be induced by PEG in all organs examined.
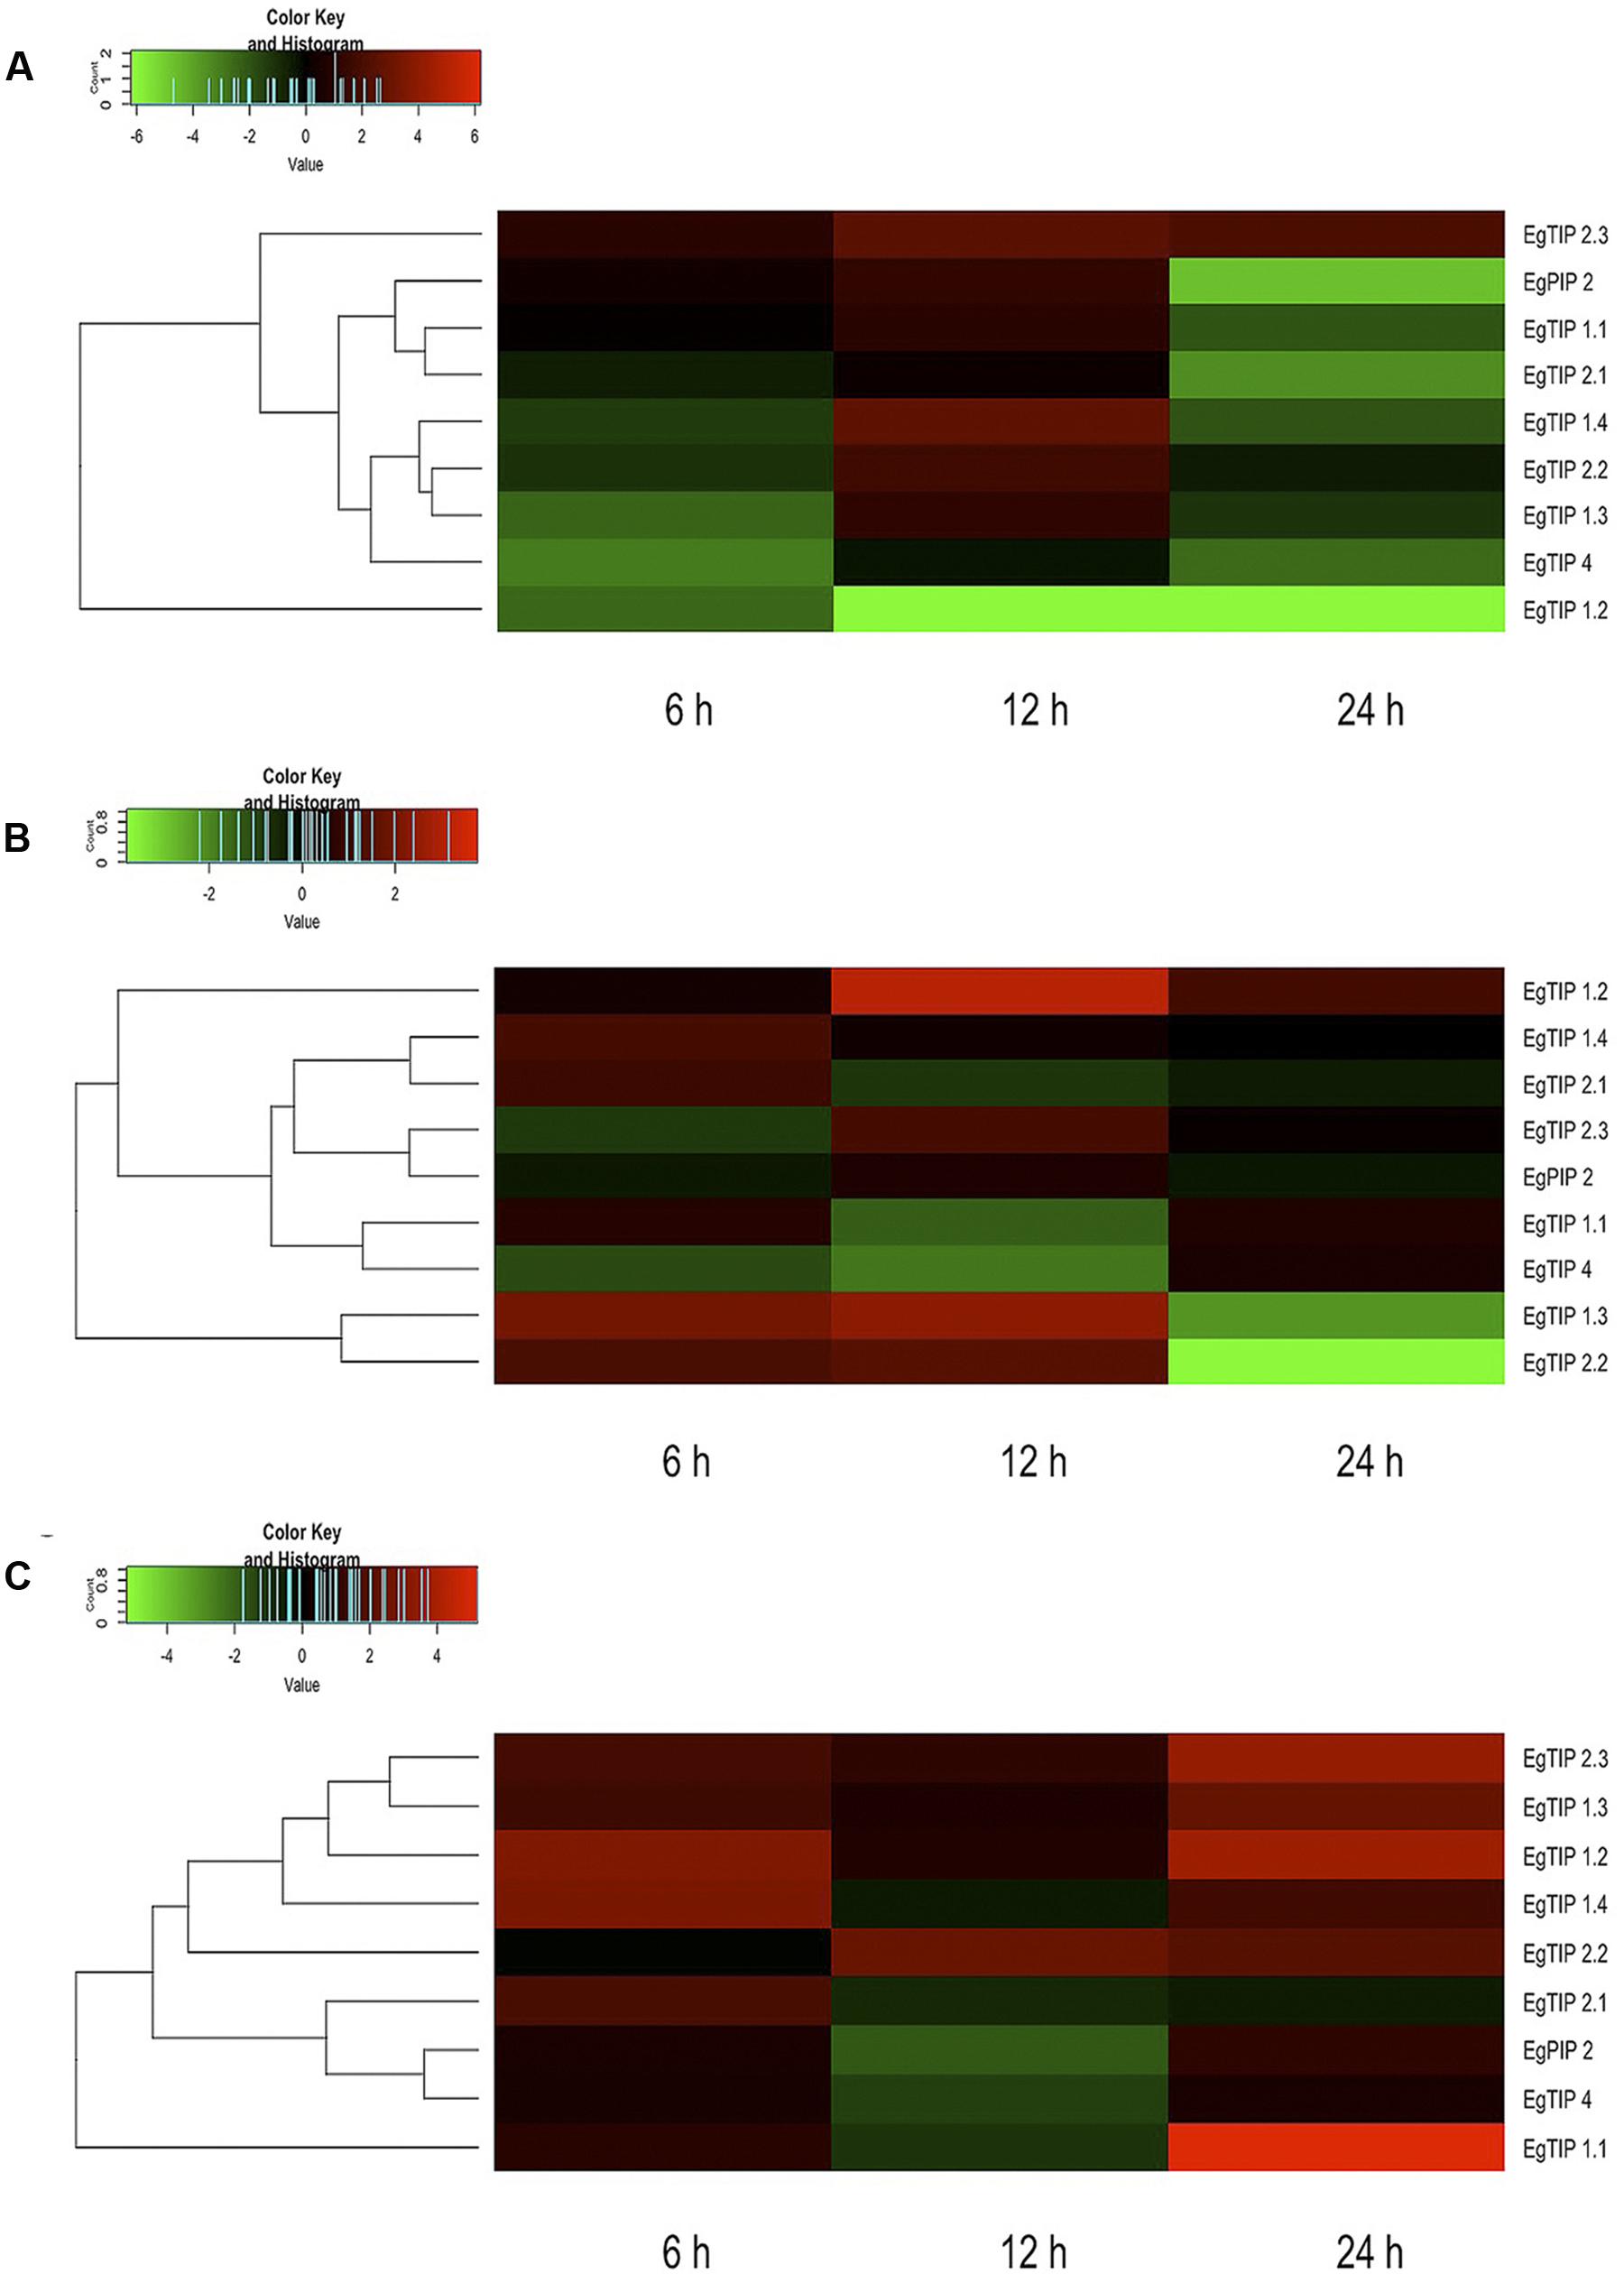
FIGURE 6. Expression patterns of EgTIP genes under osmotic stress. (A) Roots; (B) Stems; and (C) Leaves. The normalized fold change (log2 transformed) of EgTIP expression at each time point after PEG treatment was calculated relative to that of the untreated control at the same time point. The color scale is the same as in Figure 4. Genes were clustered according to their expression profiles. All samples were analyzed in triplicate.
Discussion
Although described throughout all kingdoms, aquaporins show a particularly high diversity and abundance in plants. Among the plant aquaporins, the members of the TIP subfamily are implicated in the control of tonoplast permeability to water and other solutes. Despite the accumulated knowledge in model species, much less is known about the organization of the TIP subfamily in woody species, especially in Eucalyptus, an economically important and high water-demanding forest tree.
In this study, we show that 11 members, which have been assigned to the five classical TIP groups of higher plants, compose the TIP subfamily of Eucalyptus. These data expand the results of Rodrigues et al. (2013), revealing the presence of six additional TIP genes in E. grandis. When compared to other woody species, the Eucalyptus TIP subfamily is almost the same size as those described in V. vinifera (10 genes) and C. sinensis (11 genes), but possess less members than Populus and rubber tree (17 genes each). The number of TIP genes in the Eucalyptus genome is also well conserved among other well-studied model species such as Arabidopsis (10 genes) and rice (10 genes). Thus, despite the occurrence of a whole-genome duplication (WGD) event and the reported large number of tandem duplications (Myburg et al., 2014), no major expansion of the eucalyptus TIP subfamily relatively to other woody and non-woody species was observed. This is in clear contrast with Populus, in which the expansion of the MIP superfamily, including the acquisition of several TIP genes, has been attributed to gene retention after a recent WGD event (Gupta and Sankararamakrishnan, 2009).
Concerning their structure, the EgTIP genes showed a similar pattern of exon/intron organization as reported for other TIP genes from dicot species that normally harbor three exons separated by two introns. The only exception is the single intron-containing EgTIP1.1 gene, which probably evolved from sequential loss of introns as previously suggested (Regon et al., 2014).
EgTIP Expression Patterns and Possible Functional Diversification
Based on our results, distinct organ/tissue expression profiles were observed for the EgTIP genes identified. Among them, EgTIP1.1 was the most widely expressed, indicating that it might play a more generalized role throughout the plant. This is in line with previous reports showing that TIP1.1 is widely distributed and the most abundantly expressed TIP isoform (Alexandersson et al., 2005; Knipfer et al., 2011; Regon et al., 2014). Conversely, the other EgTIP genes showed enriched-organ/tissue expression, a feature that was particularly evident in wood-related and reproductive organs/tissues. The only exception was EgTIP5.1, which appears to be nonfunctional since no transcripts or expression sequence tag evidences could be found for this gene. Interestingly, none of the identified EgTIP genes was found to be exclusively expressed in a specific organ/tissue.
Despite some partial overlaps, the observed divergences in their spatial expression patterns indicate that EgTIPs may have undergone functional diversification. This fact also suggests that certain isoforms might have acquired specific organ/tissue roles. Evidence from poplar trees, however, indicate that, in spite of their elevated tissue-specificity, a high level of functional redundancy exists amongst PtTIP members (Cohen et al., 2013). In this respect, the existence of functional redundancy between TIP genes was postulated in previous studies employing insertional Arabidopsis mutants (Schüssler et al., 2008). In general, current evidences indicate that TIP isoforms act redundantly to regulate water and solute transport. In contrast with this, Gattolin et al. (2009) demonstrated the existence of tissue- and cell-specific patterns of expression of some AtTIP genes in Arabidopsis roots. Similarly, a specific and developmentally regulated leaf expression pattern of some HvTIP subfamily members was observed in barley (Besse et al., 2011). These results highlight the existence of possible specialization of TIP isoforms, but further investigations are required to uncover possible functional specificity of the identified EgTIP genes.
In trees, the modulation of TIP expression in response to abiotic stress has been documented (Cohen et al., 2013; Rodrigues et al., 2013; Martins et al., 2015; Regon et al., 2014), and the major evidences point to a role for these proteins in stress adaptation. It is noteworthy that most of the EgTIP genes analyzed here displayed osmotic stress-responsive transcriptional profiles in three different organs. Although the timing and extent of their expression varied, these results indicate that the Eucalyptus responses to osmotic stress require the coordinated transcriptional regulation of most EgTIPs. The existence of cis-regulatory elements related to hormone and abiotic stress response in the EgTIP promoter regions lend further support to this idea. Consistently, we have previously shown the induction and repression of the EgTIP2.2 promoter activity by osmotic stress and ABA, respectively (Rodrigues et al., 2013). However, despite these reported evidences of transcriptional regulation, the possible contribution of the different EgTIP isoforms in the control of water flow under stress conditions requires further investigation.
EgTIP Substrate Selectivity
The selectivity filter of aquaporins comprises four residues located at the non-cytosolic portion of the pore. These residues are implicated in water translocation and in the selection of other substrate molecules such as glycerol, ammonia, boric acid, CO2, H2O2, and urea (reviewed in Maurel et al., 2015). Previous data have indicated that TIP subfamily members show the highest level of sequence divergence in the ar/R region among known plant aquaporins (Wallace and Roberts, 2004; Azad et al., 2012). Despite this, some residues are well conserved, particularly in the LE1 position, in which an A or G is present, and in the H2 position, in which an H residue has been associated with water specificity (Sui et al., 2001; Kirscht et al., 2016). Remarkably, this conserved H residue is found in most identified EgTIPs, with the exception of EgTIP3.2 and EgTIP5.1.
Concerning LE2, an R residue known to contribute to the mechanism of proton exclusion is usually present at this position (Wu et al., 2009; Kirscht et al., 2016). In TIPs, however, this residue can be replaced by polar residues such as C or nonpolar residues such as V, a feature that is observed in some EgTIPs. Intriguingly, a nonpolar L residue in found in this position in EgTIP3.1. According to Azad et al. (2012), the presence of a hydrophobic residue in this position in TIP1 homologs renders the proteins multifunctional aqua-glyceroporins. Thus, changes in aa charge and side chains lead to modifications in pore size and hydrophobicity that have direct consequences in TIP transport selectivity.
A still unresolved question concerns EgTIP2.3. Due to its clustering with known TIP5 isoforms, EgTIP2.3 could be also assigned as a member of group 5. However, EgTIP2.3 lack the tetrad NVGC commonly found in the ar/R filter of most TIP5 isoforms. Instead, it harbors a selectivity filter that resembles the one present in TIP2 isoforms, an attribute that justifies its nomination as a TIP2 in Phytozome. The closest homologue of EgTIP2.3, VvTIP5.2, also harbors a canonic TIP2-like ar/R filter (HIGR). Intriguingly, such an ambiguous classification was also observed for certain NOD26-like intrinsic proteins from different plant species (Zou et al., 2015b). Overall, our results suggest that both EgTIP2.3 and VvTIP5.2 represent unusual isoforms sharing phylogenetic relationships with TIP5s but transport selectivity of TIP2s.
Several studies have demonstrated that additional residues may contribute to TIP preference for the transport of other substrates than water (Froger et al., 1998; Hove and Bhave, 2011). A recent study that elucidated the crystal structure of AtTIP2.1 proposed the expansion of the selectivity filter with the inclusion of a flexible H residue in loop C (Kirscht et al., 2016), that has been implicated in ammonia transport. In this respect, EgTIP2.1, EgTIP2.2, and EgTIP4.1 have the same H residue in loop C as AtTIP2.1. Comparatively, several TIP2 orthologs from other plant species also have an AtTIP2.1-like extended selectivity filter (Zou et al., 2015a,b, 2016), thus suggesting that these proteins may be able to transport ammonia. Moreover, in view of the predictions for non-aqua transport profiles proposed by Azad et al. (2016), both EgTIP2 and EgTIP4.1 as well as all EgTIP1 fulfill the requirements to act as H2O2 transporters.
Previous reports have also included the analysis of nine specificity-determining positions (SDPs) to predict non-aqua substrates (Hove and Bhave, 2011) as well as the Froger’s positions (P1-P5) to discriminate TIP-mediated glycerol transport (Froger et al., 1998). All these positions were evaluated in the EgTIPs investigated in order to address possible transport specificity. Although the Froger’s positions remained highly conserved in EgTIPs compared to TIPs found in other plant species (Table 1), they do not fit the requirements for glycerol transport. Noteworthy, as reported earlier for TIPs from Ricinus communis and Jatropha curcas (Zou et al., 2015b, 2016), the SDP analysis indicated the presence of residues typically associated with urea transport in all EgTIPs (Supplementary Table S4). In particular, EgTIP1.1, EgTIP4.1, and EgTIP5.1 have classical urea-type SDPs (Supplementary Table S4). Overall, these results are valuable for future studies on the structure–function relationships of the identified EgTIPs.
Conclusion
In this work, an in depth analysis of the Eucalyptus TIP subfamily was performed using different molecular approaches. Eleven genes were identified based upon sequence similarity and phylogenetic relationships with known TIPs from other plant species. Among them, only EgTIP5.1 was not expressed and seems not to be functional. The structural and functional properties of the EgTIP isoforms were further investigated using bioinformatics tools, and their capacities to transport water and other substrates were predicted and discussed. Interestingly, distinctive spatial expression patterns and inducible expression under osmotic stress were observed. Although to be taken with caution, a possible involvement of the EgTIP products in abiotic stress responses was envisaged. The genes identified in this study represent an important resource for further functional analyses and use in biotechnological programs aiming Eucalyptus genetic improvement.
Author Contributions
Conceived and designed the experiments: MR, AT, and IM; performed the experiments: MR and AT; analyzed the data: JB and IM; wrote the paper: MR, AT, and IM.
Conflict of Interest Statement
The authors declare that the research was conducted in the absence of any commercial or financial relationships that could be construed as a potential conflict of interest.
Acknowledgments
We thank Dr. Paulo E. M. Ribolla (IBTEC - UNESP) for his precious help with heatmap construction. MR is a recipient of a Ph.D. fellowship from CNPq. AT is a recipient of a PNPD/CAPES postdoctoral fellowship. IM is recipient of a research fellowship from CNPq.
Supplementary Material
The Supplementary Material for this article can be found online at: http://journal.frontiersin.org/article/10.3389/fpls.2016.01810/full#supplementary-material
Footnotes
- ^http://www.phytozome.net/
- ^http://gsds.cbi.pku.edu.cn/
- ^http://chibba.agtec.uga.edu/duplication/
- ^http://www.csbio.sjtu.edu.cn/bioinf/plant-multi/\#
- ^http://www.clustal.org/
- ^http://www.megasoftware.net/
- ^www.phytozome.net
References
Afzal, Z., Howton, T. C., Sun, Y., and Mukhtar, M. S. (2016). The roles of aquaporins in plant stress responses. J. Dev. Biol. 4, 9. doi: 10.3390/jdb4010009
Alexandersson, E., Fraysse, L., Sjövall-Larsen, S., Gustavsson, S., Fellert, M., Karlsson, M., et al. (2005). Whole gene family expression and drought stress regulation of aquaporins. Plant Mol. Biol. 59, 469–484. doi: 10.1007/s11103-005-0352-1
Ashkenazy, H., Erez, E., Martz, E., Pupko, T., and Ben-Tal, N. (2010). ConSurf 2010: calculating evolutionary conservation in sequence and structure of proteins and nucleic acids. Nucleic Acids Res. 38, W529–33. doi: 10.1093/nar/gkq399
Azad, A. K., Ahmed, J., Alum, M. A., Hasan, M. M., Ishikawa, T., Sawa, Y., et al. (2016). Genome-wide characterization of major intrinsic proteins in four grass plants and their non-Aqua transport selectivity profiles with comparative perspective. PLoS ONE 11:e0157735. doi: 10.1371/journal.pone.0157735
Azad, A. K., Yoshikawa, N., Ishikawa, T., Sawa, Y., and Shibata, H. (2012). Substitution of a single amino acid residue in the aromatic/arginine selectivity filter alters the transport profiles of tonoplast aquaporin homologs. Biochim. Biophys. Acta 1818, 1–11. doi: 10.1016/j.bbamem.2011.09.014
Besse, M., Knipfer, T., Miller, A. J., Verdeil, J. L., Jahn, T. P., and Fricke, W. (2011). Developmental pattern of aquaporin expression in barley (Hordeum vulgare L.) leaves. J. Exp. Bot. 62, 4127–4142. doi: 10.1093/jxb/err175
Boursiac, Y., Chen, S., Luu, D. T., Sorieul, M., Van den Dries, N., and Maurel, C. (2005). Early effects of salinity on water transport in Arabidopsis roots. molecular cellular features of aquaporin expression. Plant Physiol. 139,k790–805.
Chou, K.-C., and Shen, H.-B. (2010). Plant-mPLoc: a top-down strategy to augment the power for predicting plant protein subcellular localization. PLoS ONE 5:e11335. doi: 10.1371/journal.pone.0011335
Cohen, D., Bogeat-Triboulot, M. B., Vialet-Chabrand, S., Merret, R., Courty, P. E., Moretti, S., et al. (2013). Developmental and environmental regulation of Aquaporin gene expression across Populus species: divergence or redundancy? PLoS ONE 8:e55506. doi: 10.1371/journal.pone.0055506
de Oliveira, L. A., Breton, M. C., Bastolla, F. M., Camargo Sda, S., Margis, R., Frazzon, J., et al. (2012). Reference genes for the normalization of gene expression in eucalyptus species. Plant Cell Physiol. 53, 405–422. doi: 10.1093/pcp/pcr187
Finn, R. D., Coggill, P., Eberhardt, R. Y., Eddy, S. R., Mistry, J., Mitchell, A. L., et al. (2016). The Pfam protein families database: towards a more sustainable future. Nucleic Acids Res. 44, D279–D285. doi: 10.1093/nar/gkv1344
Froger, A. C., Tallur, B. C., Thomas, D. C., and Delamarche, C. (1998). Prediction of functional residues in water channels and related proteins. Protein Sci. 7, 1458–1468. doi: 10.1002/pro.5560070623
Gattolin, S., Sorieul, M., Hunter, P. R., Khonsari, R. H., and Frigerio, L. (2009). In vivo imaging of the tonoplast intrinsic protein family in Arabidopsis roots. BMC Plant Biol. 9:133. doi: 10.1186/1471-2229-9-133
Goicoechea, M., Lacombe, E., Legay, S., Mihaljevic, S., Rech, P., Jauneau, A., et al. (2005). EgMYB2, a new transcription activator from Eucalyptus xylem, regulates secondary cell wall formation and lignin biosynthesis. Plant J. 43, 553–567. doi: 10.1111/j.1365-313X.2005.02480.x
Gupta, A. B., and Sankararamakrishnan, R. (2009). Genome-wide analysis of major intrinsic proteins in the tree plant Populus trichocarpa: characterization of XIP subfamily of aquaporins from evolutionary perspective. BMC Plant Biol. 9:134. doi: 10.1186/1471-2229-9-134
Hove, R. M., and Bhave, M. (2011). Plant aquaporins with non-aqua functions: deciphering the signature sequences. Plant Mol. Biol. 75, 413–430. doi: 10.1007/s11103-011-9737-5
Johanson, U., Karlsson, M., Johansson, I., Gustavsson, S., Sjövall, S., Fraysse, L., et al. (2001). The complete set of genes encoding major intrinsic proteins in Arabidopsis provides a framework for a new nomenclature for major intrinsic proteins in plants. Plant Physiol. 126, 1358–1369. doi: 10.1104/pp.126.4.1358
Kelley, L. A., Mezulis, S., Yates, C. M., Wass, M. N., and Sternberg, M. J. E. (2015). The Phyre2 web portal for protein modeling, prediction and analysis. Nat. Protoc. 10, 845–858. doi: 10.1038/nprot.2015.053
Khan, K., Agarwal, P., Shanware, A., and Sane, V. A. (2015). Heterologous expression of two Jatropha aquaporins imparts drought and salt tolerance and improves seed viability in transgenic Arabidopsis thaliana. PLoS ONE 10:e0128866. doi: 10.1371/journal.pone.0128866
Kirscht, A., Kaptan, S. S., Bienert, G. P., Chaumont, F., Nissen, P., de Groot, B. L., et al. (2016). Crystal structure of an ammonia-permeable aquaporin. PLoS Biol. 14:e1002411. doi: 10.1371/journal.pbio.1002411
Knipfer, T., Besse, M., Verdeil, J. L., and Fricke, W. (2011). Aquaporin-facilitated water uptake in barley (Hordeum vulgare L.) roots. J. Exp. Bot. 62, 4115–4126. doi: 10.1093/jxb/err075
Landau, M., Mayrose, I., Rosenberg, Y., Glaser, F., Martz, E., Pupko, T., et al. (2005). ConSurf 2005: the projection of evolutionary conservation scores of residues on protein structures. Nucleic Acids Res. 33, W299–W302. doi: 10.1093/nar/gki370
Lee, S. E., Yim, H. K., Lim, M. N., Yoon, I. S., Kim, J. H., and Hwang, Y. S. (2015). Abscisic acid prevents the coalescence of protein storage vacuoles by upregulating expression of a tonoplast intrinsic protein gene in barley aleurone. J. Exp. Bot. 66, 1191–1203. doi: 10.1093/jxb/eru467
Li, J., and Cai, W. (2015). A ginseng PgTIP1 gene whose protein biological activity related to Ser(128) residue confers faster growth and enhanced salt stress tolerance in Arabidopsis. Plant Sci. 234, 74–85. doi: 10.1016/j.plantsci.2015.02.001
Lin, W., Peng, Y., Li, G., Arora, R., Tang, Z., Su, W., et al. (2007). Isolation and functional characterization of PgTIP1, a hormone-autotrophic cells-specific tonoplast aquaporin in ginseng. J. Exp. Bot. 58, 947–956. doi: 10.1093/jxb/erl255
Liu, L. H., Ludewig, U., Gassert, B., Frommer, W. B., and von Wirén, N. (2003). Urea transport by nitrogen-regulated tonoplast intrinsic proteins in Arabidopsis. Plant Physiol. 133, 1220–1228. doi: 10.1104/pp.103.027409
Livak, K., and Schmittgen, T. D. (2001). Analysis of relative gene expression data using real time quantitative PCR and the 2-ΔΔCt method. Methods 25, 402–408. doi: 10.1006/meth.2001.1262
Loqué, D., Ludewig, U., Yuan, L., and von Wirén, N. (2005). Tonoplast intrinsic proteins AtTIP2;1 and AtTIP2;3 facilitate NH3 transport into the vacuole. Plant Physiol. 137, 671–680. doi: 10.1104/pp.104.051268
Lovell, S. C., Davis, I. W., Arendall III, W. B., de Bakker, P. I. W., Word, J. M., Prisant, M. G., et al. (2003). Structure validation by Calpha geometry: phi, psi and Cbeta deviation. Proteins 50, 437–450. doi: 10.1002/prot.10286
Maeshima, M. (2001). TONOPLAST TRANSPORTERS: organization and function. Annu. Rev. Plant Physiol. Plant Mol. Biol. 52, 469–497. doi: 10.1146/annurev.arplant.52.1.469
Martins, C., de, P., Pedrosa, A. M., Du, D., Gonçalves, L. P., Yu, Q., et al. (2015). Genome-wide characterization and expression analysis of major intrinsic proteins during abiotic and biotic stresses in sweet orange (Citrus sinensis L. Osb.). PLoS ONE 10:e0138786. doi: 10.1371/journal.pone.0138786
Marti-Renom, M. A., Stuart, A., Fiser, A., Sánchez, R., Melo, F., and Sali, A. (2000). Comparative protein structure modeling of genes and genomes. Annu. Rev. Biophys. Biomol. Struct. 29, 291–325. doi: 10.1146/annurev.biophys.29.1.291
Maurel, C., Boursiac, Y., Luu, D. T., Santoni, V., Shahzad, Z., and Verdoucq, L. (2015). Aquaporins in plants. Physiol. Rev. 95, 1321–1358. doi: 10.1152/physrev.00008.2015
Mizrachi, E., Hefer, C. A., Ranik, M., Joubert, F., and Myburg, A. A. (2010). De novo assembled expressed gene catalog of a fast-growing Eucalyptus tree produced by Illumina mRNA-Seq. BMC Genomics 11:681. doi: 10.1186/1471-2164-11-681
Myburg, A. A., Grattapaglia, D., Tuskan, G. A., Hellsten, U., Hayes, R. D., Grimwood, J., et al. (2014). The genome of Eucalyptus grandis. Nature 510, 356–362. doi: 10.1038/nature13308
Peng, Y., Lin, W., Cai, W., and Arora, R. (2007). Overexpression of a Panax ginseng tonoplast aquaporin alters salt tolerance, drought tolerance and cold acclimation ability in transgenic Arabidopsis plants. Planta 226, 729–740. doi: 10.1007/s00425-007-0520-4
Ramakers, C., Ruijtera, J. M., Ronald, H., Lekanne, D., and Moormana, A. F. M. (2003). Assumption-free analysis of quantitative real-time polymerase chain reaction (PCR) data. Neurosci. Lett. 339, 62–66. doi: 10.1016/S0304-3940(02)01423-4
Reddy, P. S., Rao, T. S. R. B., Sharma, K. K., and Vadez, V. (2015). Genome-wide identification and characterization of the aquaporin gene family in Sorghum bicolor (L.). Plant Gene. 1, 18–28. doi: 10.1016/j.plgene.2014.12.002
Regon, P., Panda, P., Kshetrimayum, E., and Panda, S. K. (2014). Genome-wide comparative analysis of tonoplast intrinsic protein (TIP) genes in plants. Funct. Integr. Genomics 14, 617–629. doi: 10.1007/s10142-014-0389-9
Reinhardt, H., Hachez, C., Bienert, M. D., Beebo, A., Swarup, K., Voß, U., et al. (2016). Tonoplast aquaporins facilitate lateral root emergence. Plant Physiol. 170, 1640–1654. doi: 10.1104/pp.15.01635
Rodrigues, M. I., Bravo, J. P., Sassaki, F. T., Severino, F. E., and Maia, I. G. (2013). The tonoplast intrinsic aquaporin (TIP) subfamily of Eucalyptus grandis: characterization of EgTIP2, a root-specific and osmotic stress-responsive gene. Plant Sci. 213, 106–113. doi: 10.1016/j.plantsci.2013.09.005
Sade, N., Vinocur, B. J., Diber, A., Shatil, A., Ronen, G., Nissan, H., et al. (2009). Improving plant stress tolerance and yield production: is the tonoplast aquaporin SlTIP2;2 a key to isohydric to anisohydric conversion? New Phytol. 181, 651–661. doi: 10.1111/j.1469-8137.2008.02689.x
Sali, A., and Blundell, T. L. (1993). Comparative protein modelling by satisfaction of spatial restraints. J. Mol. Biol. 234, 779–815. doi: 10.1006/jmbi.1993.1626
Schrödinger, L. C. C. (2011). The PyMol Molecular Graphics System. Version 1.3. Available at: http://www.pymol.org/
Schüssler, M. D., Alexandersson, E., Bienert, G. P., Kichey, T., Laursen, K. H., Johanson, U., et al. (2008). The effects of the loss of TIP1;1 and TIP1;2 aquaporins in Arabidopsis thaliana. Plant J. 56, 756–767. doi: 10.1111/j.1365-313X.2008.03632.x
Shelden, M. C., Howitt, S. M., Kaiser, B. N., and Tyerman, S. D. (2009). Identification and functional characterisation of aquaporins in the grapevine, Vitis vinifera. Funct. Plant Biol. 36, 1065–1078. doi: 10.1071/FP09117
Sui, H., Han, B. G., Lee, J. K., Walian, P., and Jap, B. K. (2001). Structural basis of water-specific transport through the AQP1 water channel. Nature 414, 872–878. doi: 10.1038/414872a
Wallace, I. S., and Roberts, D. M. (2004). Homology modeling of representative subfamilies of Arabidopsis major intrinsic proteins. Classification based on the aromatic/arginine selectivity filter. Plant Physiol. 135, 1059–1068. doi: 10.1104/pp.103.033415
Wang, X., Li, Y., Ji, W., Bai, X., Cai, H., Zhu, D., et al. (2011). A novel Glycine soja tonoplast intrinsic protein gene responds to abiotic stress and depresses salt and dehydration tolerance in transgenic Arabidopsis thaliana. J. Plant Physiol. 168, 1241–1248. doi: 10.1016/j.jplph.2011.01.016
Wu, B., Steinbronn, C., Alsterfjord, M., Zeuthen, T., and Beitz, E. (2009). Concerted action of two cation filters in the aquaporin water channel. EMBO J. 28, 2188–2194. doi: 10.1038/emboj.2009.182
Yamaguchi-Shinozaki, K., and Shinozaki, K. (2005). Organization of cis-acting regulatory elements in osmotic- and cold-stress-responsive promoters. Trends Plant Sci. 10, 88–94. doi: 10.1016/j.tplants.2004.12.012
Yu, H., Soler, M., Mila, I., San Clemente, H., Savelli, B., Dunand, C., et al. (2014). Genome-wide characterization and expression profiling of the AUXIN RESPONSE FACTOR (ARF) gene family in Eucalyptus grandis. PLoS ONE 9:e108906. doi: 10.1371/journal.pone.0108906
Zou, Z., Gong, J., An, F., Xie, G., Wang, J., Mo, Y., et al. (2015a). Genome-wide identification of rubber tree (Hevea brasiliensis Muell. Arg.) aquaporin genes and their response to ethephon stimulation in the laticifer, a rubber-producing tissue. BMC Genomics 16:1001. doi: 10.1186/s12864-015-2152-6
Zou, Z., Gong, J., Huang, Q., Mo, Y., Yang, L., and Xie, G. (2015b). Gene structures, evolution, classification and expression profiles of the aquaporin gene family in castor bean (Ricinus communis L.). PLoS ONE 10:e0141022. doi: 10.1371/journal.pone.0141022
Zou, Z., Yang, L., Gong, J., Mo, Y., Wang, J., Cao, J., et al. (2016). Genome-wide identification of Jatropha curcas aquaporin genes and the comparative analysis provides insights into the gene family expansion and evolution in Hevea brasiliensis. Front. Plant Sci. 7:395. doi: 10.3389/fpls.2016.00395
Keywords: aquaporin, tonoplast intrinsic protein, gene structure, gene expression, abiotic stress, Eucalyptus
Citation: Rodrigues MI, Takeda AAS, Bravo JP and Maia IG (2016) The Eucalyptus Tonoplast Intrinsic Protein (TIP) Gene Subfamily: Genomic Organization, Structural Features, and Expression Profiles. Front. Plant Sci. 7:1810. doi: 10.3389/fpls.2016.01810
Received: 15 August 2016; Accepted: 16 November 2016;
Published: 30 November 2016.
Edited by:
Rupesh Kailasrao Deshmukh, Laval University, CanadaReviewed by:
P. Kannapiran, Mepco Schlenk Engineering College, IndiaB. N. Devanna, National Research Centre on Plant Biotechnology, India
Copyright © 2016 Rodrigues, Takeda, Bravo and Maia. This is an open-access article distributed under the terms of the Creative Commons Attribution License (CC BY). The use, distribution or reproduction in other forums is permitted, provided the original author(s) or licensor are credited and that the original publication in this journal is cited, in accordance with accepted academic practice. No use, distribution or reproduction is permitted which does not comply with these terms.
*Correspondence: Ivan G. Maia, igmaia@ibb.unesp.br