 Won Yong Jung1
 Hyun Ji Park
 Areum Lee
 Youn-Sung Kim
 Hye Sun Cho
- 1Plant Systems Engineering Research Center, Korea Research Institute of Bioscience and Biotechnology, Daejeon, Korea
- 2Biosystems and Bioengineering Program, University of Science and Technology, Daejeon, South Korea
- 3Department of Biotechnology, NongHyup Seed, Anseong, South Korea
Late bolting after cold exposure is an economically important characteristic of radish (Raphanus sativus L.), an important Brassicaceae root vegetable crop. However, little information is available regarding the genes and pathways that govern flowering time in this species. We performed high-throughput RNA sequencing analysis to elucidate the molecular mechanisms that determine the differences in flowering times between two radish lines, NH-JS1 (late bolting) and NH-JS2 (early bolting). In total, 71,188 unigenes were identified by reference-guided assembly, of which 309, 788, and 980 genes were differentially expressed between the two inbred lines after 0, 15, and 35 days of vernalization, respectively. Among these genes, 218 homologs of Arabidopsis flowering-time (Ft) genes were identified in the radish, and 49 of these genes were differentially expressed between the two radish lines in the presence or absence of vernalization treatment. Most of the Ft genes up-regulated in NH-JS1 vs. NH-JS2 were repressors of flowering, such as RsFLC, consistent with the late-bolting phenotype of NH-JS1. Although, the functions of genes down-regulated in NH-JS1 were less consistent with late-bolting characteristics than the up-regulated Ft genes, several Ft enhancer genes, including RsSOC1, a key floral integrator, showed an appropriate expression to the late-bolting phenotype. In addition, the patterns of gene expression related to the vernalization pathway closely corresponded with the different bolting times of the two inbred lines. These results suggest that the vernalization pathway is conserved between radish and Arabidopsis.
Introduction
Radish (Raphanus sativus L.), an annual plant belonging to the Brassicaceae family, is a familiar root vegetable crop around the world, especially in eastern Asia. The main edible portion of the plant is the fleshy taproot, which has an upper part originating from the hypocotyl and a lower part consisting of true root tissue. The taproot exhibits huge variation in terms of skin color and shape (Tsuro et al., 2008; Zaki Hem and Yokoi, 2012). Some cultivars of radish have been exploited as oilseed crops, silique vegetables, and leafy vegetables. The taproot is an excellent source of carbohydrates and dietary fiber, high levels of glucosinolates and secondary metabolites for human beings: consequently, the properties of the root are the primary determinants of the crop's economic value (Nakamura et al., 2001; Wang et al., 2002). Comparative genomics revealed that the Brassicaceae species exhibit complex genomic syntenies (Panjabi et al., 2008; Li et al., 2011), indicating that a wide range of whole-genome rearrangements occurred during or after species divergence. By contrast, genome syntenies are well conserved in Poaceae (International Brachypodium, 2010) and Solanaceae crops (Tomato Genome, 2012). The genome of the radish is relatively small and diploid (2n = 2x = 18), and analysis of genetic map construction and comparative mapping based on EST-SSR (Shirasawa et al., 2011) or EST-SNP markers (Li et al., 2011) revealed that it is closely related to Brassica rapa. Two whole draft genome sequences of radish were recently reported: the 402 Mb sequence of Japanese cultivar “Aokubi” and 510 Mb sequence of Korean cultivar “WK10039” (Kitashiba et al., 2014; Mun et al., 2015). However, establishment of the more accurate chromosome pseudomolecules by clone-end and BAC-end sequences remains to be accomplished.
In flowering plants, proper timing of the transition from vegetative to reproductive development is important to ensure reproductive success and seed production (Srikanth and Schmid, 2011); accordingly, this trait has considerable economic value. Regulation of Ft is controlled by a diverse range of environmental and internal signals (Koornneef et al., 1998). Environmental signals, which are strongly influenced by season, day length, and temperature adaptation, are integrated with endogenous signals such as developmental stage and age (Zhai et al., 2015). In the model plant Arabidopsis, the majority of key Ft genes have been identified and characterized through genetic and molecular analyses. These genes can be categorized into five main flowering pathways: the photoperiod, vernalization, gibberellin, autonomous, and endogenous pathways (Putterill et al., 2004; Fornara et al., 2010; Srikanth and Schmid, 2011). However, these genetically established pathways are not rigorously distinguished. Instead, a growing body of evidence indicates that extensive crosstalk occurs between the pathways, and that the resultant signals are ultimately integrated by a small number of common target genes (central floral pathway integrator genes) that quantitatively regulate the development of shoot apical meristem. Consequently, control of Ft is plastic and diverse (Simpson and Dean, 2002). Functional genetic analysis in Arabidopsis revealed that the FLOWERING LOCUS T (FT), SUPPRESSOR OF OVEREXPRESSION OF CONSTANS1 (SOC1), and LEAFY (LFY) genes are central floral integrators (Blazquez et al., 1998; Nilsson et al., 1998; Samach et al., 2000). FT has been known for florigen, a mobile signal that transfers the flowering induction signal from leaves into shoot apical meristems through the phloem (Tamaki et al., 2007; Turck et al., 2008), and this protein is highly conserved in most flowering plants (Andrés and Coupland, 2012). SOC1 encodes a MADS box protein that acts as a floral activator to control floral patterning and floral meristem, as well as Ft (Liu et al., 2007, 2009; Melzer et al., 2008). LFY, a unique plant transcription factor that also contains a MADS box, is indispensable for determining the identity of male and female reproductive organs during flower development (Weigel et al., 1992). Together, these key integrator genes interpret signals from a global network of multiple flowering pathways, and their expression levels precisely modulate the expression of floral meristem-specific genes and ultimately determine the exact Ft (Simpson and Dean, 2002; Parcy, 2005).
Throughout the plant life cycle, bolting and flowering are key life-history traits that exercise far-reaching influence on reproductive suitability, mating patterns and opportunities, gene flow, and evolution (Franks, 2015). Currently, due to global warming, a shift toward early flowering is underway in a wide variety of plant species around the world (Parmesan and Yohe, 2003). Premature bolting and flowering pose a serious problem for production because they decrease both yield and economic value of leafy vegetables; therefore, Ft is a vital trait and a target of selection in crop breeding. A number of studies uncovered the genetic basis of Ft through a quantitative trait locus mapping approach in Brassica crops. The BoFLC2 locus controls Ft in Brassica oleracea (Okazaki et al., 2007). The BrFLC1 and BrFLC2 genes are associated with variation in Ft in B. rapa (Yuan et al., 2009; Zhao et al., 2010). BnFRI.A3 is associated with Ft in Brassica napus (Wang et al., 2011). These studies indicate that homologs of FLC and FRI play vital roles in the control of Ft in Brassica species. In a previous study, we characterized two radish inbred lines, generated by a conventional breeding approach, that exhibit different bolting times under the vernalization conditions. NH-JS1, a late-bolting radish inbred line, is less sensitive to cold treatment than the early-bolting line NH-JS2. Expression of genes related to Ft differs between NH-JS1 and NH-JS2: the repressor RsFLC1 is expressed at higher levels in NH-JS1, whereas the positive integrator RsSOC1 is relatively up-regulated in NH-JS2. Although flowering is the most important agricultural trait in cultivation, Ft genes and their associated mechanisms have not been extensively analyzed at a whole-genome scale in radish. Recently, bolting-related miRNAs and their targets were identified in radish using small RNA libraries from leaves at vegetative and reproductive stages (Nie et al., 2015). In addition, differentially expressed genes (DEGs) involved in the transition from vegetative growth to flowering, as well as flowering itself, were identified in radish by RNA-Seq (Nie et al., 2015).
In this study, we performed RNA-Seq and comparative analysis of transcriptomes between two inbred lines with different bolting times, with the goal of identifying regulators of late flowering under vernalization conditions. Our analysis of DEGs related to Ft indicated that most DEGs involved in the vernalization pathway were expressed in patterns that corresponded closely with the different bolting times of the two lines. Negative regulators of the vernalization pathway, such as RsFLC, RsMAF2, RsSPA1, and RsAGL18, were highly expressed in the late-bolting inbred line NH-JS1, whereas positive regulators of vernalization such as RsVRN1, RsVIN3, and RsAGL19 were relatively highly expressed in the early-bolting line NH-JS2. Based on our findings from RNA-Seq and qPCR analysis, we propose a model regulatory network for the flowering pathway.
Materials and Methods
Bolting Trait Analysis of Two Radish Inbred Lines
NH-JS1 and NH-JS2, two radish inbred lines developed by NongHyup Seed in Korea (Gyeonggi-do, Anseong, Korea), were used as samples of late-bolting and early-bolting radish plants, respectively. Seeds of each line were sown in sterilized soil and grown under normal growth conditions (23°C, 16 h light/8 h dark) for 2 weeks. For vernalization treatment, 2-week-old plants were grown in the cold room (5 ± 1°C, 12 h light/12 h dark) for 15 or 35 days. After the vernalization periods, the plants were transferred to a normal growth room and grown for 30 days under the same condition. The percentage of bolting plants was measured by counting the bolting plants when the length of the floral axis was ≥1 cm. Ten plants were used for each bolting test, with two biological replicates.
Plant Materials and Treatments
To generate samples for RNA-Seq analysis, 2-week-old plants of the NH-JS1 and NH-JS2 inbred lines were exposed to the cold (5 ± 1°C, 12 h light/12 h dark) for 0, 15, or 35 days. Six samples of shoot tissue were collected from each line at the same point in the light/dark cycle. To obtain adequate RNA for each extraction, shoot tissues from three different plants were pooled. Two biological replicates were performed for each vernalization time point. Thus, a total of 12 samples were collected from the two inbred lines. Following harvest, samples were snap-frozen in liquid nitrogen and stored at −80°C until further processing. Total RNA isolation from shoot tissue was performed as described (Jung et al., 2014).
RNA-Seq Library Construction and Sequencing
Total RNA was prepared for RNA-Seq library construction. mRNA collected from shoot tissues of the two inbred lines was fragmented and used as a template for synthesis of first-strand cDNA using random hexamers and reverse transcriptase. Second-strand cDNA was synthesized using DNA polymerase I (New England BioLabs, Ipswich, MA, USA) and RNase H (Invitrogen, Carlsbad, CA, USA). The resultant cDNA fragments were purified, end-repaired, polyA-tailed, and ligated to index adapters following the Illumina protocol. The ligation products were amplified by PCR and sequenced on an Illumina HiSeq 2000 sequencer system; a 101 bp paired-end sequencing protocol was employed, and two biological replicates were performed for each sample. All raw read data generated in this study were deposited in the GEO of NCBI under accession number GSE89312
Radish Reference-Guided Assembly and Mapping
Raw sequencing data were filtered using standard RNA-Seq parameters (Illumina pipeline). Adapter contamination, low-quality regions, and N-base reads were trimmed from the raw reads, and then reads with a Phred quality score of 31 (Q ≥ 20) or 25 base pairs (bp) were filtered out. These steps were performed using the DynamicTrim and LengthSort programs of the SolexaQA (v.1.13) package (Cox et al., 2010). The cleaned datasets were pooled and mapped to the radish reference gene set. To obtain assembly results, reference-guided assembly was performed using 46,512 genes from the coding sequence regions of the reference genome (Mun et al., 2015). Using the TopHat program, 71,188 assembled unigenes were identified and imposed on the radish reference gene sets. These datasets were pooled and mapped to the radish reference gene set. Mapping was performed using the Bowtie2 (v2.1.0) program (Langmead and Salzberg, 2012) allowing only unique mapping with a maximum of two mismatches; otherwise, the default options were used. The expression levels in each sample were calculated with an in-house script, and read counts for each gene were normalized against library size and rounded to the nearest whole number.
Functional Annotation
Transcripts from RNA-Seq were validated by comparison with gene sequences in the Phytozome database (http://www.phytozome.net/) using BLASTP with E-values of at least 1E-10 (BLAST v.2.2.28+) (Altschul et al., 1997). The Blast2GO software v2.8.0 was further used to compare transcripts (≥200 bp) to the non-redundant (NR) databases with thresholds of E-value ≤ 1E-05 and 20 BLAST hits (Conesa and Götz, 2008). For Gene Ontology (GO) analysis, the GO database (http://www.geneontology.org/) was downloaded, and the transcripts were annotated to the GO database using BLASTP (E-value ≤ 1E-06). GO term annotation was performed using GO classification results from the Map2Slim.pl script. Protein sequences with the highest sequence similarities and cutoffs were retrieved for analysis. Functional enrichment analysis was carried out using DAVID (http://david.abcc.ncifcrf.gov/) and AgriGO (FDR ≤ 0.05) (Du et al., 2010). The transcript lists were further annotated using the TAIR database, and filtered according to default criteria (counts ≥ 2 and EASE score ≤ 0.1). In addition, KEGG pathways were assigned to the sequences by the single-directional best hit method using the KEGG Automatic Annotation Server (Moriya et al., 2007) and DAVID (counts ≥ 10, FDR ≤ 0.05).
DEGs Analysis
Gene expression data were generated from 12 samples from each of two inbred lines. To identify genes differentially expressed during vernalization treatments of each line, raw counts were normalized and analyzed using the DESeq library in R (v3.0) (Anders and Huber, 2010). For a gene to be considered as a DEG, we required |log2 (fold change)| ≥ 1. In addition, DEGs were filtered by requiring the adjusted p-value (FDR) to be ≤ 0.01. Two types of comparisons were performed: (1) DEGs between the two lines at each time point of vernalization (0, 15, and 35 days); and (2) expression changes of transcripts between vernalization time points: 15 vs. 0 days, and 35 vs. 0 days. Up- and down-regulated transcripts were subjected to a Venn diagram analysis in R.
Identification of Radish Homologs of FT
To discover genes related to Ft in our transcriptome, a set of 174 Ft genes was selected as a reference set based on previous literature and studies in A. thaliana (Nilsson et al., 1998; Amasino and Michaels, 2010). Published sequences were obtained from the TAIR database (http://www.arabidopsis.org/index.jsp) based on the Arabidopsis accession numbers of Ft genes. BLASTn was used to query the 174 Ft genes against the assembled 71,188 genes of radish. Top hits were filtered based on the highest percentage of hit coverage and sequence similarity. Cutoffs were E-values ≤ 1E-25 and identity ≥ 65%. Also, the sequences of Ft genes were used to query the protein sequences of radish using BLASTx methods (E-value ≤ 1E-20, identity ≥ 50%).
Validation of a Subset of DEGs by qPCR
Expression data obtained by RNA-Seq were validated by quantitative real-time PCR (qPCR) using cDNA synthesized from the same RNA samples used for RNA-Seq analysis. Total RNA was treated with DNase I (Thermo Fisher Scientific, Waltham, MA, USA) to remove genomic DNA. cDNA was synthesized using reverse transcriptase (RevertAid First-strand cDNA Synthesis Kit; Fermentas, Burlington, Canada). qPCR was performed on a CFX Connect™ Real-Time PCR Detection System (Bio-Rad, Hercules, CA, USA) using SYBR Premix Ex Taq (TaKaRa, Tokyo, Japan). DEGs and Ft genes were determined by qPCR using gene-specific primers (Table S3) and were normalized against the corresponding level of RsACT1. Three technical repeats were performed for each experiment.
Results
Phenotypic Variation in Bolting Time between Two Radish Inbred Lines
First, we recorded the bolting time of the two inbred lines with or without vernalization. After vernalization treatments (0, 15, or 35 days), plants were grown under standard conditions (16 h light/8 h dark, 23°C) for 30 days in soil, and then we examined variations in flowering phenotypes between the two lines. In the absence of vernalization, the two lines were phenotypically similar, i.e., they did not bolt at all. By contrast, 30 days after vernalization treatment, the two lines exhibited dramatic differences, with NH-JS1 exhibiting a relatively late-bolting phenotype (Figure 1A). To further investigate the bolting of the two lines under different conditions, we compared the behavior of the two lines following vernalization treatments of various lengths. When grown for 30 days after 15 days of vernalization treatment, 60% of NH-JS2 bolted, whereas no NH-JS1 plants did. Following 35 days of vernalization conditions, all plants of both lines bolted after 30 days of normal growth. At 20 days of growth after 35 days of vernalization, only 63.5% of NH-JS1 plants bolted, whereas almost all (94.5%) of the NH-JS2 plants did. These results confirmed that NH-JS2 bolts earlier than NH-JS1 in response to vernalization (Figure 1B).
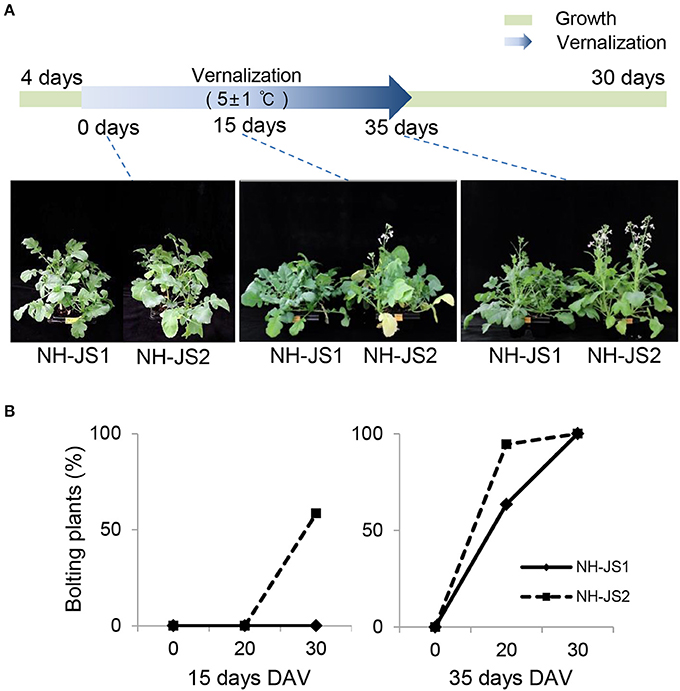
Figure 1. Phenotypes of NH-JS1 and NH-JS2 inbred lines after vernalization. (A) Bolting phenotypes of NH-JS1 and NH-JS2 following a vernalization period (0, 15, and 35 days). Seedlings of two inbred lines were germinated in a 23°C growth room for 4 days. The 0 day vernalization time point indicates that the two inbred lines were grown in the 23°C growth room for 30 days without vernalization. For the vernalization treatment, germinated seedlings were grown in a cold room (5 ± 1°C, 12 h light/12 h dark) for 15 or 35 days, and then transferred to a 23°C growth room for 30 days. (B) Percentage of bolting plants after vernalization (n = 20 plants). DAV, days after vernalization.
A phenotype is an observable trait caused by differential expression of genes and/or environmental factors. In both inbred lines, vernalization had the most significant effect on the bolting phenotype during growth. Therefore, we predicted that the expression patterns of Ft genes, which we assumed would be closely related to bolting, would differ between the two lines.
RNA-Seq Analysis
To identify transcriptome changes between the two radish inbred lines, we isolated total RNAs from shoot tissues, subjected them to cDNA library construction, and sequenced the libraries on an Illumina HiSeq 2000 Sequencing System (Figure S1). In total, 587,119,316 paired-end reads (101 bp in length) were generated from 12 libraries generated from the two inbred lines. Raw reads were subjected to quality control, and adapter sequences and low-quality reads were trimmed out. Over 79% of clean reads satisfied the following criteria: quality score Q < 20; minimum read length ≥ 25 bp. In total, 237,331,729 and 228,587,020 clean reads were obtained from NH-JS1 and NH-JS2, respectively (Table S1); the average length of clean reads was 87.85 bp. To verify the similarity between two replicate data, normalized counts were used to created a plot of pairs repeat samples (Figure S2). Most samples were highly reproducible between pairs. To assess the proportion of unigenes among the 12 transcriptomes, all clean reads were mapped to the reference set of 71,188 unigenes: 94.35% (241,530,265 reads) reads of NH-JS1 and 94.04% (311,512,975 reads) reads of NH-JS2 mapped to the reference unigenes (Table S2). Among all mapped reads, 284,096,662 (48.45%) reads mapped exactly to the reference unigenes, whereas 268,946,578 (45.75%) reads could map to multiple locations in the reference; only 5% of all reads were unmapped. Overall, these results indicated that all of the transcriptome sets had a high proportion of unigenes and were therefore suitable for further DEG and expression profiling analysis.
DEGs between Two Inbred Lines during Vernalization
The total set of expressed genes was subjected to DEG analysis using the DESeq package in R to identify individual characteristics of the transcriptomes of the inbred lines. DEGs were selected using the following criteria: FDR ≤ 0.01 and |log2(fold change)|≥1. In total, 3491 DEGs were identified between the two inbred lines at each vernalization time point (0, 15, and 35 days). Of these, 154 genes were shared among the three time points, whereas 309, 788, and 980 genes were specific to samples subjected to 0, 15, and 35 days of vernalization, respectively (Figure 2A). Moreover, in both inbred lines, we investigated genes differentially regulated between two time points (vs. 0 days). Between 15 days and 0 days, 1077 genes (662 up-regulated, 415 down-regulated) were differentially expressed in NH-JS1, and 2552 genes (1429 up-regulated, 1123 down-regulated) were differentially expressed in NH-JS2. Between 35 and 0 days, 3253 (1633 up-regulated, 1620 down-regulated) and 2278 (952 up-regulated, 1326 down-regulated) genes were identified as DEGs in NH-JS1 and NH-JS2, respectively (Figure 2B). In the comparison of DEGs between day 15 and day 0, 2.4-fold more DEGs were identified in NH-JS2 than NH-JS1. By contrast, in the comparison between 35 and 0 days, 1.4-fold more DEGs were identified in NH-JS1.
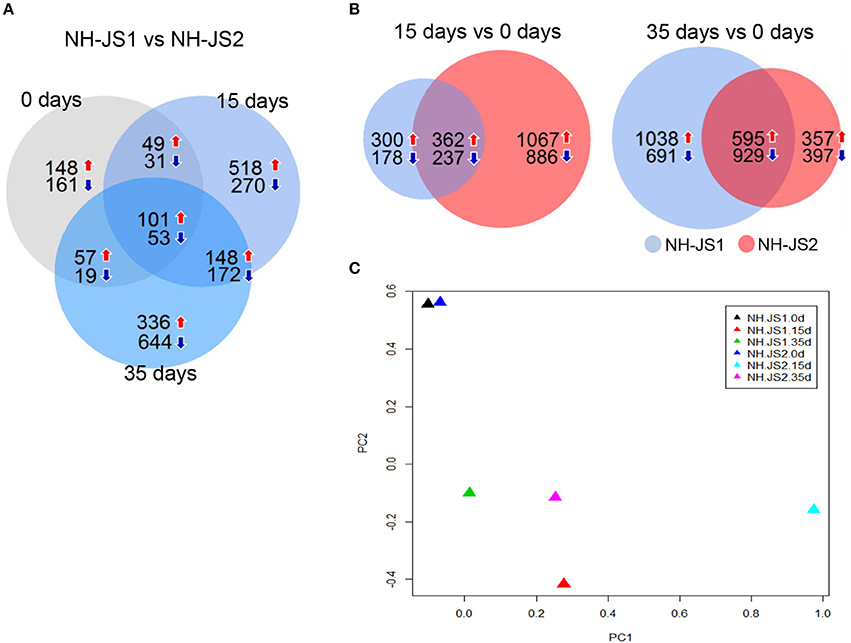
Figure 2. Comparison of genes differentially expressed between two inbred lines under vernalization conditions. (A) Differentially expressed genes (DEGs) between the two inbred lines at each vernalization time (0, 15, and 35 days). (B) Comparisons of DEGs between 15 and 0 days, and between 35 and 0 days between two inbred lines. Red and blue arrows indicate up-regulation and down-regulation, respectively. Numbers indicate genes differentially expressed in NH-JS1 relative to NH-JS2. (C) Principal component analysis of DEGs between two inbred lines under normal and vernalization conditions. Triangles of each color correspond to a different time point. The largest variation between NH-JS1 and NH-JS2 was observed at 15 days of vernalization.
To identify the sets of DEGs that are most relevant to differences in the lines' responses to vernalization, we performed principal component analysis (PCA). The 0 day datasets were similar between the two lines, whereas the 15 and 35 day datasets were dissimilar. The 15 day set from NH-JS2 was the most different from the others. For each inbred line, the results of PCA analysis were consistent with the number of DEGs between the two time points following vernalization treatment, relative to the non-vernalized sample. This suggests that, in both lines, different vernalization times had significantly different effects on the transcription of a subset of transcripts. Thus, these two inbred lines clearly exhibited different expression patterns in response to vernalization treatments of various lengths, as reported in previous studies (Greenup et al., 2011; Villacorta-Martin et al., 2015).
To further investigate the biological pathways active in the two inbred lines, we assigned DEGs from the 15 vs. 0 days comparisons to pathways in the KEGG database. We identified no significantly enriched pathways in NH-JS1, whereas, in NH-JS2, 94 genes were assigned to three pathways: “glycolysis/gluconeogenesis” (45 transcripts), “pyruvate metabolism” (30 transcripts), and “nitrogen metabolism” (19 transcripts). Next, the DEGs from 35 vs. 0 days comparisons were also mapped to the KEGG database. The 352 DEGs from NH-JS1 and the 168 genes from NH-JS2 mapped to 11 and 6 pathways, respectively (Table 1). Five pathways were shared between the two inbred lines, whereas six and one were specific to NH-JS1 and NH-JS2, respectively. The six specific pathways in the NH-JS1 were “arginine and proline metabolism,” “tryptophan metabolism,” “glutathione metabolism,” “pentose phosphate pathway,” “photosynthesis2,” and “valine, leucine, and isoleucine biosynthesis.” The specific pathway in NH-JS2, “circadian rhythm,” included 29 transcripts. Further investigation of the DEGs in the two inbred lines may provide clues about phenotypic variation in response to vernalization.
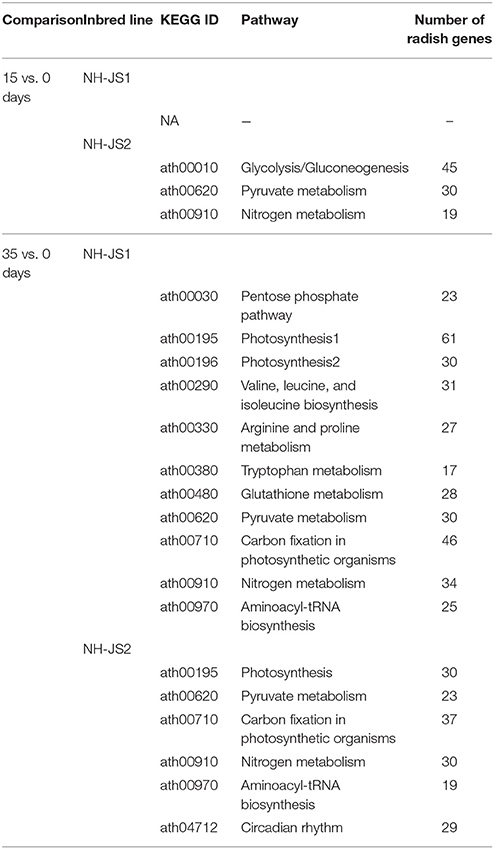
Table 1. Significantly enriched KEGG pathways among differentially expressed genes.
Identification and Expression Profiling of Ft Genes
To discover radish Ft genes in our transcriptome datasets, we examined Ft genes identified in previous flowering studies in Arabidopsis. This analysis revealed 174 Ft genes in Arabidopsis, which were confirmed to be involved in flowering pathways. Of 218 putative Ft genes with known homologs in Arabidopsis, BLAST search identified 109 Ft genes in our transcriptomes (Table 2). The radish Ft genes were classified into five flowering pathways: “A” (autonomous), “V” (vernalization), “C/L/P” (circadian clock, light signaling, and photoperiod), “D/M” (development and meristem response), and “G/M” (gibberellin signaling and metabolism) (Weigel et al., 1992). The percentages and numbers of genes in each of these pathways were as follows: “C/L/P” (50%, 109 transcripts), “V” (26.1%, 57 transcripts), “A” (10.5%, 23 transcripts), “G/M” (5.9%, 13 transcripts), and “D/M” (5.5%, 12 transcripts).

Table 2. Radish homologs of flowering-time genes.
To identify DEGs related to the flowering pathway, we identified DEGs between the two inbred lines from among the 218 putative Ft genes. In total, 26 and 58 Ft genes were identified as DEGs at the three vernalization time points in the NH-JS1 and NH-JS2, respectively: 11 and 14 genes at 0 days, 5 and 20 genes at 15 days, and 10 and 24 genes at 35 days (Figure 3A). Interestingly, 12 transcripts were consistently detected as DEGs at all vernalization time points. Furthermore, in both lines, we identified DEGs between vernalization time points; in the comparison between 15 and 0 days, 35 and 45 genes were up-regulated and 20 and 11 were down-regulated in NH-JS1 and NH-JS2, respectively. In the comparison between 35 and 0 days, 46 and 55 transcripts were up-regulated, and 23 and 11 were down-regulated in NH-JS1 and NH-JS2, respectively (Figure 3B). These six sets of Ft-related DEGs were analyzed by PCA. This analysis revealed that the datasets from 0 and 15 days of vernalization were similar between the two inbred lines, whereas the sets from 35 days of vernalization were divergent. The 35 day set from NH-JS2 was the most different from the others (Figure 3C). These results were consistent with the results of DEG analysis of Ft genes between the two lines. Interestingly, most of the up-regulated genes (16 of the 19 genes) in NH-JS1 were repressors of flowering, whereas the down-regulated genes in NH-JS1 consisted of 18 enhancer and 12 repressor genes. RsMAF2 (TBIU060196) and RsSPA1 (TBIU023088), which are repressors of the flowering pathway, were always up-regulated, whereas the positive regulators of flowering RsAGL19 (TBIU033101, TBIU033103, and TBIU040817), RsNFYA4 (TBIU046301 and TBIU046298), and RsSOC1 (TBIU065173 and TBIU057467) were consistently down-regulated in NH-JS1, regardless of vernalization time. In addition, most down-regulated genes in NH-JS1 were flowering enhancers (18 of 30 genes), with the exception of RsELF3 (5 of 30 genes) and RsELF4 (3 of 30 genes) (Table 3).
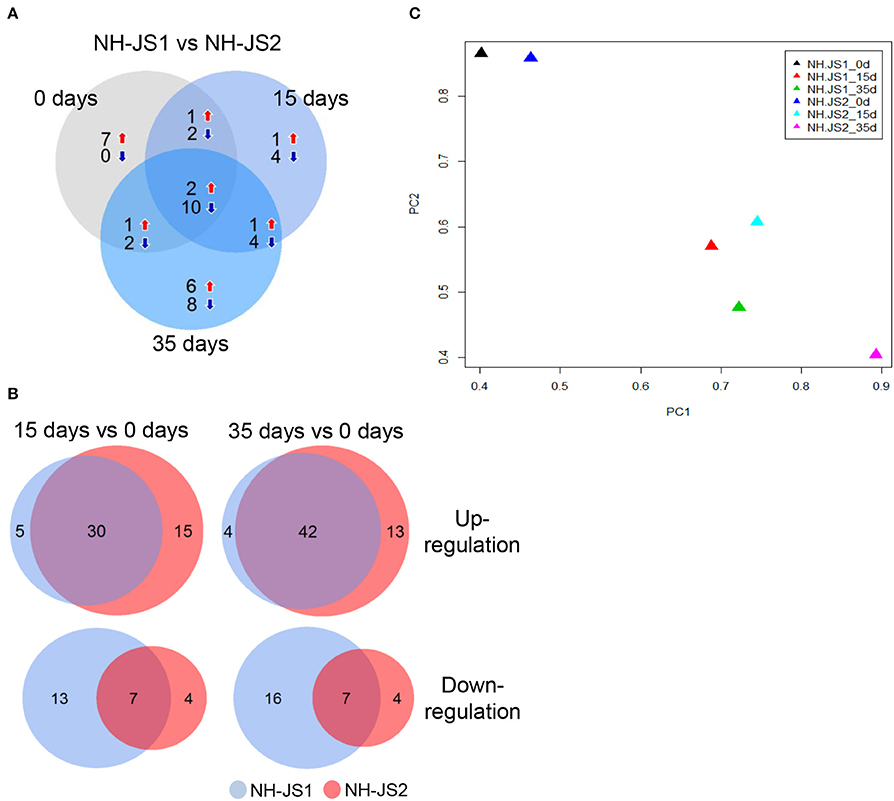
Figure 3. Comparison of flowering-time genes differentially expressed between two inbred lines under vernalization conditions. (A) Differentially expressed genes (DEGs) compared between the two inbred lines at each vernalization time (0, 15, and 35 days). (B) Comparisons of flowering-time DEGs between 15 and 0 days, and between 35 and 0 days, in the two inbred lines. Red and blue arrows indicate up-regulation and down-regulation, respectively. Numbers indicate genes differentially expressed in NH-JS1 relative to NH-JS2. (C) Principle component analysis of flowering-time DEGs between two inbred lines in the normal and vernalization conditions. Each color of triangle corresponds to a different time point in the two inbred lines. The largest variation between NH-JS1 and NH-JS2 was observed at 35 days of vernalization.
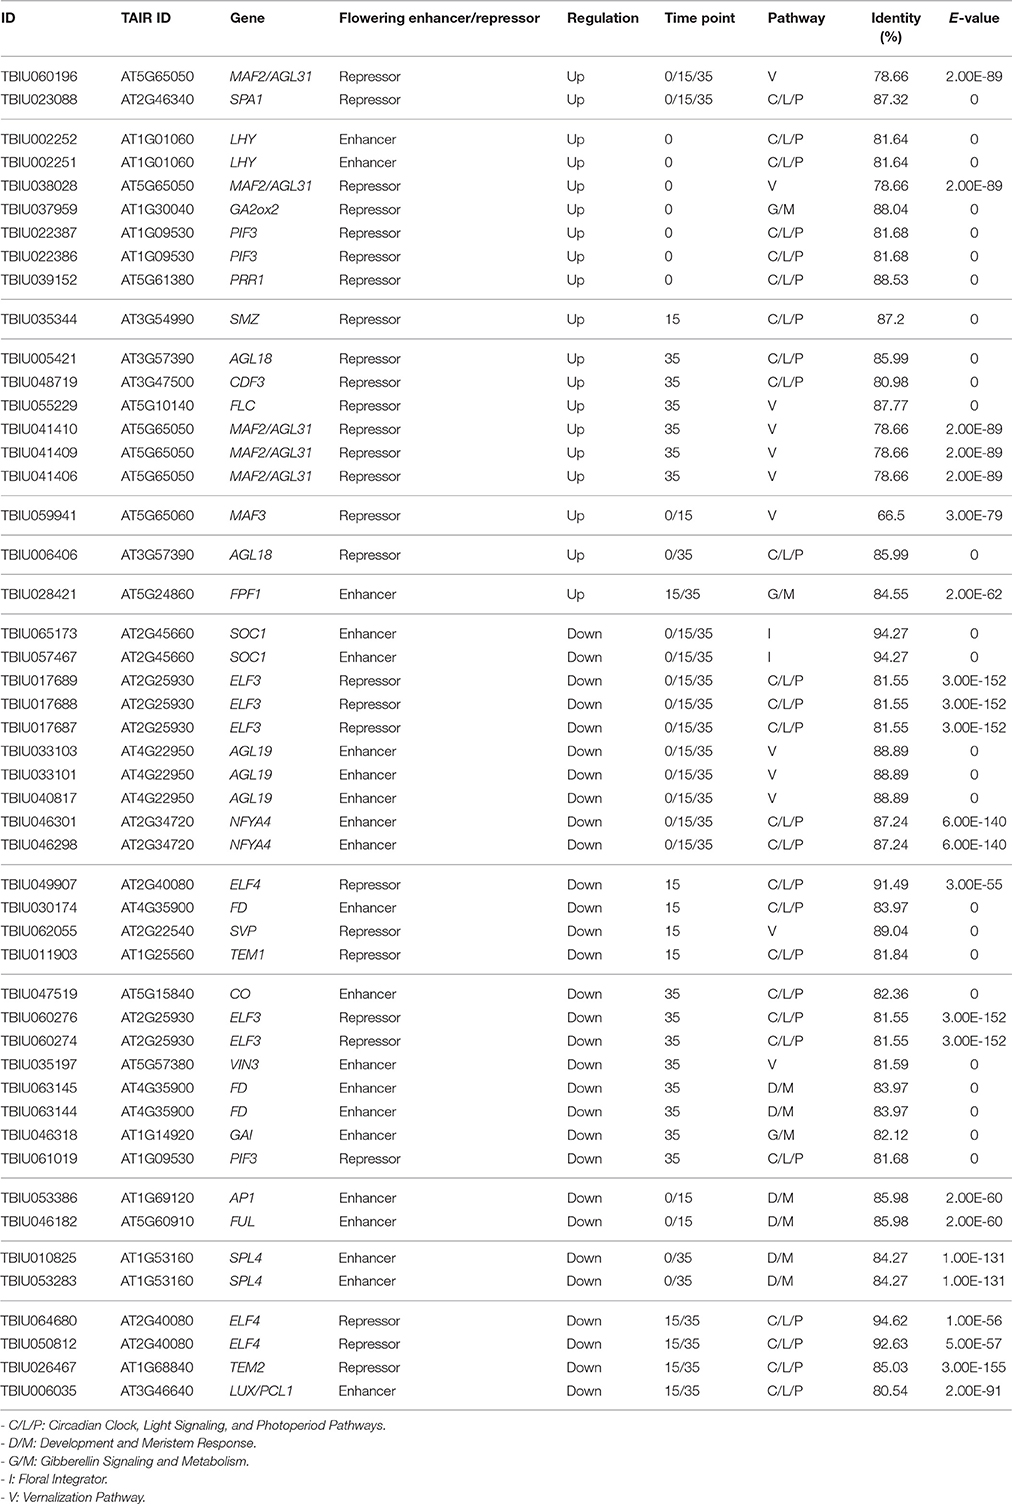
Table 3. Radish genes related to flowering time and their expression profile during vernalization.
To identify Ft genes that were differentially regulated between each time point among the Ft DEGs, we investigated the expression profiles of the Ft DEGs based on RNA-Seq data. Fourteen Ft genes were identified based on sequential expression changes between the lines during vernalization (Table 4). RsNFYA4, RsSOC1, and RsSPA1 exhibited > 2-fold expression differences between the two lines at all-time points. RsFUL, RsMAF3, RsPIF3, and RsSPL4 exhibited expression differences between the lines at 0 days: RsELF4, RsLUX/PCL1, and RsSVP were differentially expressed at 15 days; and RsCDF3, RsELF3, RsMAF2/AGL31, and RsVIN3 genes were differentially expressed at 35 days. The resultant changes in Ft gene transcription are likely to be involved in differences in bolting in response to vernalization.
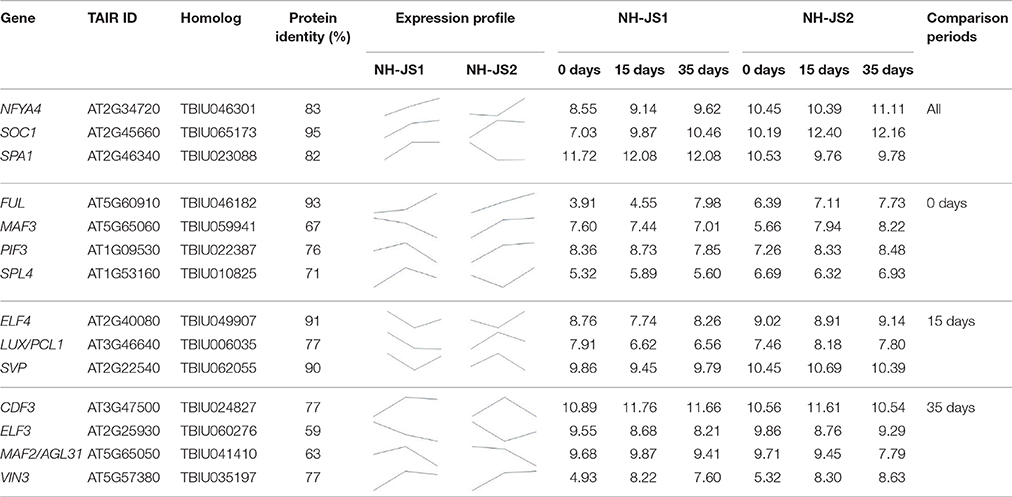
Table 4. Differential expression of flowering time–related genes during cold exposure (0, 15, and 35 days).
Validation of DEGs and Expression Profiling of Ft DEGs by qPCR
To evaluate the DEGs identified by RNA-Seq analysis, we performed qPCR. For this purpose, we selected 12 genes that exhibited the highest difference in expression levels between NH-JS1 and NH-JS2. Six of these transcripts (TBIU039665, TBIU054834, TBIU048562, TBIU062462, TBIU047119, and TBIU057835) were up-regulated, and the other six (TBIU057397, TBIU017689, TBIU016676, TBIU056908, TBIU065173, and TBIU057467) were down-regulated, in NH-JS1 vs. NH-JS2. With the exceptions of TBIU048562 and TBIU016676, all of these genes were strongly influenced by vernalization treatments. The qPCR analysis yielded expression patterns consistent with the RNA-Seq data. In particular, the transcript levels of RsELF3 (TBIU017689) and RsSOC1 (TBIU065173, TBIU057467), which are intimately involved in flowering, were, respectively, 43- and 8-fold more highly expressed in NH-JS2 than in NH-JS1 (Figure 4).
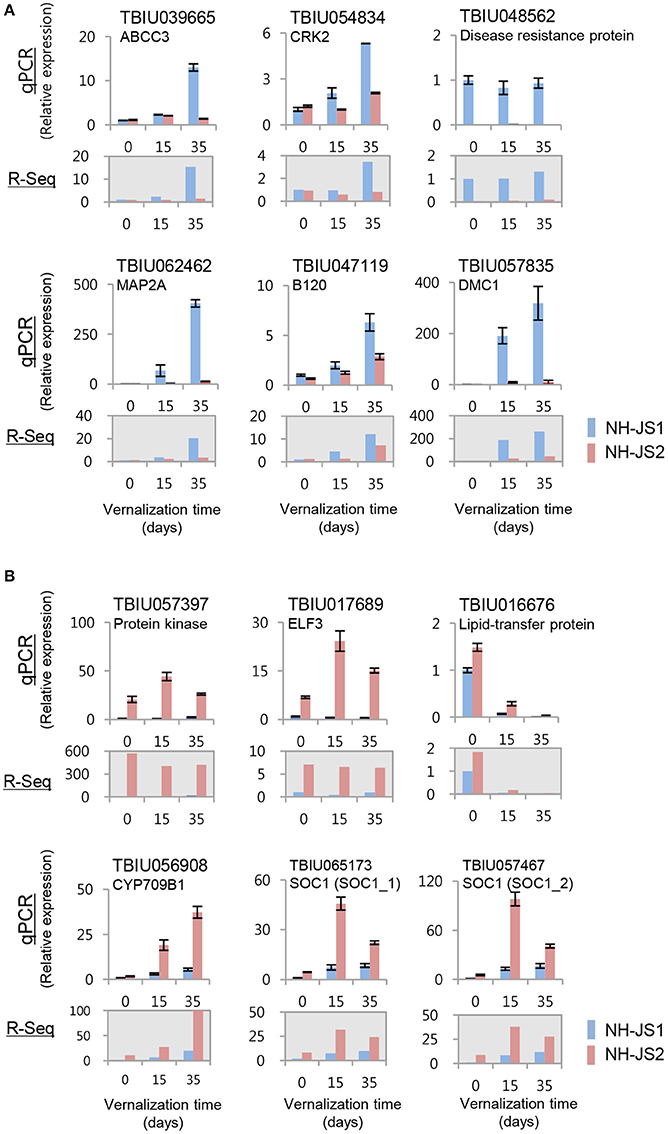
Figure 4. Validation of RNA-Seq data by qPCR. cDNA synthesized from total RNA extracted from shoots of NH-JS1 and NH-JS2 inbred lines, following vernalization for 0, 15, or 35 days. (A) Up-regulated and (B) down-regulated genes in NH-JS1 vs. NH-JS2 were selected from RNA-Seq data for validation. qPCR values were normalized against the corresponding level of RsACT1 (actin). For each gene in both the qPCR and RNA-Seq analysis, the expression level from NH-JS1 on day 0 was defined as “1.”
In addition, we performed qPCR analysis to investigate the expression levels of major Ft-regulating genes, which play essential roles in various flowering pathways. A major determinant of Ft, RsFLC1 (FLOWER LOCUS C; suppressor of flowering), was reduced during vernalization in both lines. Before vernalization treatment, RsFLC1 was 2-fold more highly expressed in NH-JS1; however, the difference in expression level was gradually reduced after 15 and 35 days of vernalization. As in the Ft DEG analysis, most DEGs involved in the vernalization pathway matched with the different bolting phenotype between the lines. Therefore, we also performed qPCR to investigate the expression levels of major Ft genes involved in the vernalization pathway. Interestingly, RsVRN1 and RsVRN2, which are positive regulators of flowering, exhibited different expression levels and opposing expression patterns between the NH-JS1 and NH-JS2 lines. In NH-JS2, the expression levels of these genes increased after vernalization, whereas in NH-JS1 they remained constant or decreased. VRN1, an essential regulator of the floral transition, is gradually up-regulated by vernalization and negatively regulates VRN2 expression (Yan et al., 2003). In particular, RsVRN1 was 3 to 7-fold more highly expressed in NH-JS2 than NH-JS1 during vernalization, but its expression was not induced in NH-JS1 in response to cold exposure or in the absence of vernalization (Figure 5). Expression levels of RsVIN3, a flowering enhancer, as well as the GA pathway-regulated genes RsGID1A, RsAGL19, and RsNFYA4, were highly induced by vernalization treatment in both lines. Moreover, differences in the expression levels between the two lines were increased up to 3-fold during vernalization treatment in NH-JS2. In addition, we checked the expression levels of photoperiod pathway genes (RsELF3, RsCCA1, RsGI, RsLHY, and RsFPA). These genes were expressed in patterns similar to those previously described, and most were more highly expressed in NH-JS2 than NH-JS1. Expression of RsFPA and RsLHY was induced similarly by vernalization treatment in both lines (Figure 5). To address the role of the major FT-regulating genes, RsFLC and RsSOC1, in the GA-regulated flowering pathway, the gene expression levels were analyzed following exogenous GA treatment in two inbred lines under or not under vernalization conditions. The expression levels of the genes differed very little between the two lines in the early GA response, whereas they significantly differed between the two lines when the bolting phenotype was exhibited. NH-JS2 reacted more sensitively to GA treatment than late-bolting NH-JS1 at 20 days after GA application (data not shown). High-throughput RNA-Seq analysis is now underway to investigate the difference in response to GA treatment between the two lines.
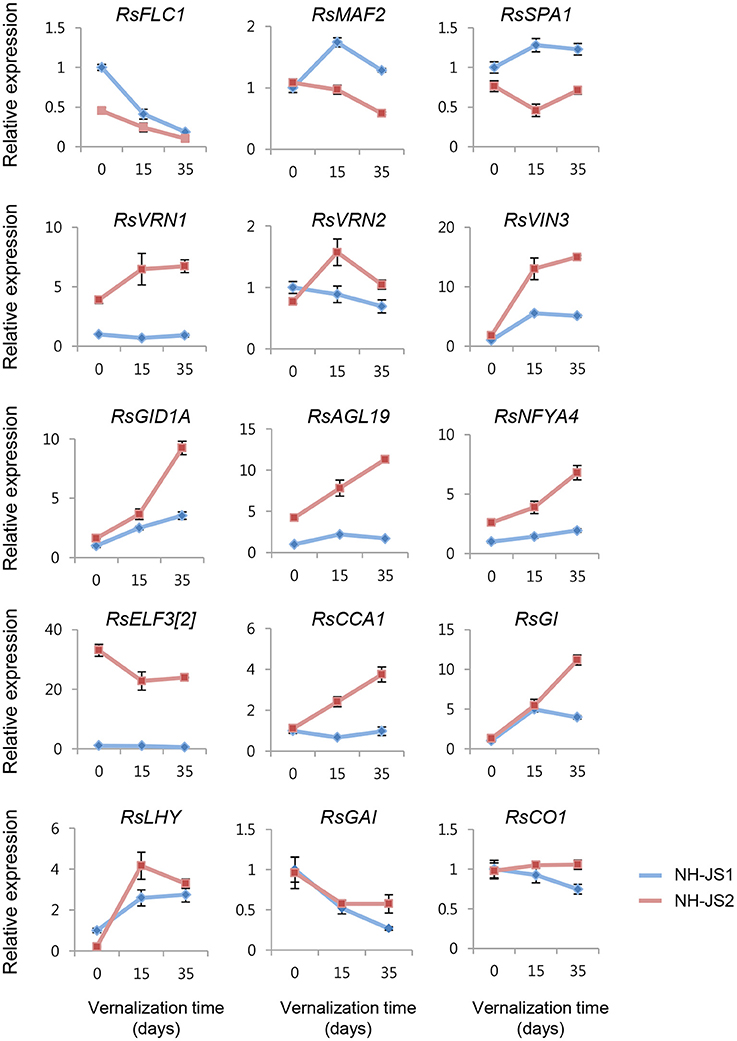
Figure 5. Differential expression between the two inbred lines of major flowering-time genes during vernalization. cDNA synthesized from total RNA extracted from the shoots of NH-JS1 and NH-JS2 inbred lines after vernalization times of 0, 15, or 35 days. qPCR expression level was normalized against the corresponding level of RsACT1. For each, the expression level from NH-JS1 on day 0 was defined as “1.”
The Transcriptional Regulatory Network Underlying Differences in Bolting Time between the Two Lines
To elucidate the overall flowering pathway governing differences in bolting time, we propose a model regulatory network based on differences in Ft gene expression (as determined by qPCR) between the two inbred lines. We divided the Ft DEGs into three major flowering pathways: vernalization, photoperiod/circadian, and gibberellin. RsFLC was negatively regulated under vernalization and was expressed at higher levels in the late-bolting NH-JS1, whereas another repressor, RsMAF2, was positively regulated in response to vernalization and was also highly expressed in the NH-JS1 line. On the other hand, the enhancers of the vernalization pathway, RsVRN1, RsVIN3, and RsAGL19, were positively regulated upon vernalization and expressed more highly in the early-bolting NH-JS2 line. RsVRN2, a floral repressor, did not exhibit significant changes in expression. Most DEGs involved in the photoperiod pathway (RsCCA1, RsLHY, RsELF3, and RsGI) were remarkably highly expressed in early-bolting NH-JS2; however, RsCO was not highly expressed. RsNFYA4, an enhancer of the photoperiod pathway, also exhibited elevated expression in the early-bolting line. The DELLA domain protein RsGAI, a negative regulator of flowering, exhibited reduced expression in NH-JS1, and a repressor of DELLA proteins, RsGID1A, was also down-regulated in this line (Figure 6).
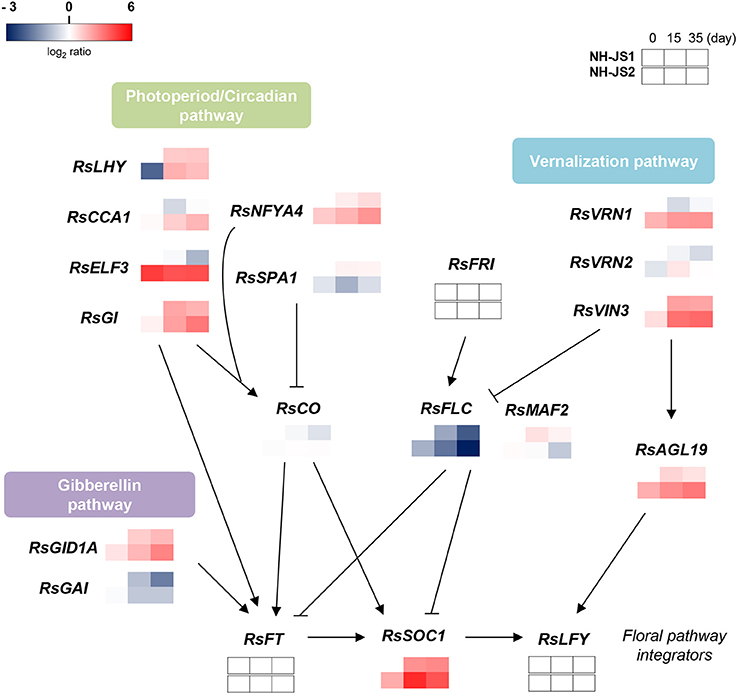
Figure 6. Gene regulatory network controlling flowering time in radish. The schema represents the regulatory network of Ft-related genes in late-bolting NH-JS1, in comparison with NH-JS2, under the differential vernalization conditions. The model is based on data obtained by qPCR. Gene expression levels were normalized to the expression levels in non-vernalized NH-JS1 plants. Red indicates higher expression and blue indicates lower expression relative to NH-JS1 on day 0. Arrows indicate transcriptional activation, whereas bars indicate transcriptional repression.
Discussion
In this study, we investigated the flowering traits of two radish inbred lines under vernalization conditions. Line NH-JS1 was late-bolting following vernalization treatment, whereas NH-JS2 was early-bolting. Our results confirmed that vernalization was necessary for radish bolting and that the vernalization periods required to induce flowering differed between the two inbred lines (Figure 1). RNA-Seq was conducted to identify important genes involved in late bolting and elucidate the molecular network that regulates the flowering pathway in this crop plant. Using radish shoot tissue from young plants, we analyzed individual transcriptomes during vernalization by high-throughput RNA sequencing. Comparative analysis among the radish transcriptomes revealed significant characteristics that were biologically reproducible (Figure S2). From 40 to 71 million reads were generated per samples (100 bp, paired-end), representing 11 × coverage of the radish genome. Previous studies reported approximately 70,000 unigenes in radish (Wang et al., 2013a,b; Wu et al., 2015). Consistent with this, our transcriptome analysis identified 71,188 genes despite using only shoot tissue for the RNA-Seq analysis.
Differential Expression of Ft-Related Genes Governs Bolting in Response to Vernalization
Genome-wide DEG analysis revealed that vernalization treatments of 15 and 35 days had significantly different effects on the transcription of a subset of genes between the two inbred lines (Figure 2), and KEGG pathway analysis revealed similar trends (Table 1). The pathway analysis showed that gene expression related to nitrogen and pyruvate metabolism is significantly up-regulated during vernalization in radish. Further investigation of DEGs in the two inbred lines may provide clues about phenotypic variations related to vernalization.
By comparison with known Ft-related genes in Arabidopsis, we identified 218 radish Ft genes in our transcriptome analysis (Nilsson et al., 1998; Table 2), of which 49 were differentially expressed between NH-JS1 and NH-JS2. Thus, about 80% of Ft genes were expressed at similar levels in both lines, suggesting that the 49 Ft-related DEGs provide several hints regarding the molecular basis of late-bolting time in NH-JS1. First, expression of repressors of flowering such as RsFLC1 was elevated in NH-JS1, and 16 of 19 up-regulated Ft genes in NH-JS1 were flowering repressors. In addition, 18 of 30 down-regulated Ft genes in NH-JS1 were flowering enhancers. This expression pattern was well correlated with the NH-JS1 phenotype. However, there were some exceptions. For example, the expression levels of RsELF3 and RsELF4, both of which repress flowering, were reduced in NH-JS1. These two genes are components of the circadian clock (Covington et al., 2001; Doyle et al., 2002), suggesting that circadian rhythms may be partly responsible for the differences in Ft between the two lines. Alternatively, these specific circadian clock components may function differently than they do in Arabidopsis. This idea is supported by the observation that RsELF3 was expressed 20-fold more highly in NH-JS2 than in NH-JS1. In Arabidopsis, ELF3 negatively regulates the expression of CO, FT, and GI (Kim et al., 2005). If RsELF3 has similar functions in Ft control, then the expression level of CO, FT, and GI should be lower in NH-JS2 than in NH-JS1. However, RsCO and RsGI were more highly expressed in NH-JS2 than in NH-JS1, suggesting that RsELF3 may function differently than its Arabidopsis counterpart. Second, pathway analysis revealed that several pathways, including photoperiod and vernalization, were altered in NH-JS1. The expression pattern of genes in the vernalization pathway was well correlated with the NH-JS1 phenotype, suggesting that the radish vernalization pathway is similar to that of Arabidopsis. Interestingly, no autonomous pathway genes were found in the DEG list, even though 23 genes in this pathway were identified in radish (Table 3).
Regardless of vernalization treatment times, two repressor genes and 10 enhancer genes were up- and down-regulated in NH-JS1 vs. NH-JS2, respectively (Figure 3). In radish, these Ft genes are responsible for regulating bolting under vernalization. The expression profile of Ft genes exhibited that most of common Ft DEGs at any time of vernalization (above 12 genes) are overlapped (12 of 14 genes), indicating they expressed quantitatively and temperature-timely to develop different bolting time in the lines. Furthermore, pathway analyses of Ft DEGs suggested that the expression patterns of genes involved in the vernalization pathway perfectly matched the bolting characteristics of the two lines: seven repressors of the vernalization pathway were highly expressed, and five enhancers involved in the vernalization pathway were less expressed, in the late-bolting NH-JS1 line (Table 4). The 12 common Ft DEGs were biologically confirmed by qPCR analysis (Figures 4, 5).
Possible Divergence of Flowering-Time Regulators between Arabidopsis and Radish
FRI of Arabidopsis is a well-known repressor of Ft that positively regulates FLC expression (Choi et al., 2011). In our data set, we did not detect a radish FRI homolog. This may be because it is not abundantly expressed, or alternatively because there is simply no FRI homolog in radish. To resolve this issue, we performed BLAST analysis of the whole radish genome (Mun et al., 2015) using Arabidopsis FRI as a query sequence. However, we could not identify a candidate FRI ortholog with high homology and similar size to the Arabidopsis gene. One gene had 77% nucleotide sequence identity, but the region of homology spanned only half of the Arabidopsis FRI gene (data not shown). At present, we cannot exclude the possibility that this gene acts like Arabidopsis FRI, but it is also possible that yet another gene serves this function in radish. Recently, Nie et al. reported genes associated with bolting in radish based on de novo transcriptome analysis (Nie et al., 2015). They found one FRI gene in radish, but it is not clear whether its sequence is also present in the current version of the radish genome. Further research is required to resolve this discrepancy. A similar situation also arose regarding LFY, which is an integrator of Ft signaling (Weigel et al., 1992). LFY expression was not detected in our transcriptome data. As with FRI, this could have been either due to low expression or to the absence of such a gene in the genome. When we tried to find the gene using BLAST, we identified two homologous genes, but their cDNAs (5283 and 2490 bp) were much larger than that of Arabidopsis LFY (1263 bp). Most of the LFY sequence was present in the homologous region of the radish genes. Therefore, there may be some errors in gene prediction. Recently, Nie et al. reported three radish LFY genes (Nie et al., 2015). cDNA cloning and detailed analysis may help resolve the apparent discrepancy between our studies.
A Gene Regulatory Network for Control of Bolting Time in Radish
Three major flowering pathways, which differ in their response to vernalization treatment, have been defined, namely, vernalization, photoperiod, and gibberellin, based on Ft DEGs (Figure 6). Vernalization promotes flowering in response to a prolonged period of growth at low temperature, and we detected five Ft DEGs related to the vernalization pathway. FLOWERING LOCUS C (FLC, TBIU004737) is central to the vernalization process (Sung and Amasino, 2005). Two floral repressors, RsFLC and RsMAF2, an RsFLC homolog, were less expressed in the early-bolting NH-JS2, whereas three enhancers of the vernalization pathway were highly expressed in the early-bolting line. We propose that the vernalization pathway is closely associated with the difference in bolting time between the two inbred lines. Ft DEGs in the photoperiod pathway, CCA1, LHY, ELF3, and GI, play a role in facilitating the expression of CONSTANS as floral enhancers (Sawa et al., 2007; Imaizumi, 2010). Although RsCO was weakly expressed in the two lines, most genes related to the photoperiod pathway were highly expressed in the late-bolting line. Similar to the vernalization pathway, the photoperiod pathway showed coincidence with the bolting phenotype between the two lines. In Arabidopsis, the gibberellin pathway promotes flowering by up-regulating the SOC1 genes (Bernier and Périlleux, 2005). GA hormone signaling occurs through proteolytic and non-proteolytic mechanisms when the GA receptor GID1 binds to GA (Murase et al., 2008). In proteolytic GA signaling, GID1 binds to negative regulators of GA responses called DELLA proteins, and the GID1-GA-DELLA complex is formed for destruction via the ubiquitin-proteasome pathway. Both radish DELLA protein and GA receptor genes, RsGAI and RsGID1A, were less expressed in the late-bolting line. However, further DEG analysis related to the GA pathway is needed to understand the relevancy to bolting time. Autonomous pathway-related genes were expressed at very low levels in all samples, suggesting that this pathway may not influence the difference in Ft between NH-JS1 and NH-JS2. These Ft DEGs from the flowering pathways converge on a key floral integrator, RsSOC1, and ultimately regulate LFY to determine the timing of the floral transition (Lee and Lee, 2010). However, we did not detect RsLFY in our transcriptomic analysis. Another floral integrator, RsFT, was also expressed at a low level, possibly because the samples we analyzed were derived from early-stage shoots. RsSOC1 expression differed significantly between the two lines in a manner that depended on vernalization time, and its transcript levels may have an important impact on bolting in these two lines.
Conclusions
This study demonstrates that differences in flowering traits between two inbred lines were consistent with the expression patterns of flowering-time genes involved in the vernalization pathway. In addition, our comparative transcriptome analysis elucidated the molecular basis of this divergence in bolting time. This is the first genome-wide comparative transcriptome analysis related to flowering traits in the radish.
Author Contributions
HC, YK conceived and designed the study and wrote the manuscript. WJ performed the data analysis and wrote the initial manuscript. HP, AL conducted bolting phenotyping and qPCR analysis and wrote the manuscript. SL contributed research materials.
Conflict of Interest Statement
The authors declare that the research was conducted in the absence of any commercial or financial relationships that could be construed as a potential conflict of interest.
Acknowledgments
This work was supported by Agricultural Biotechnology Developmental Program (nos. 114061-3 and 115076-2) grants from the Ministry of Agriculture, Food and Rural Affairs and KRIBB Research Initiative Program awarded to HC.
Supplementary Material
The Supplementary Material for this article can be found online at: http://journal.frontiersin.org/article/10.3389/fpls.2016.01844/full#supplementary-material
Figure S1. Experimental design and data analysis. Samples of the NH-JS1 and NH-JS2 inbred lines subjected to various vernalization treatments, used for RNA-Seq analysis. Ver, vernalization period; 1st and 2nd, independent biological replicates. The work-flow and algorithm used for detecting DEG and flowering-time genes are shown schematically.
Figure S2. Pairs plot between the two replicate radish transcriptomes.
Table S1. Summary of RNA-Seq in two radish inbred lines.
Table S2. Results of read mapping in radish transcripts.
Table S3. Gene-specific primers used for qPCR analyses.
References
Altschul, S. F., Madden, T. L., Schäffer, A. A., Zhang, J., Zhang, Z., Miller, W., et al. (1997). Gapped BLAST and PSI-BLAST: a new generation of protein database search programs. Nucleic Acids Res. 25, 3389–3402. doi: 10.1093/nar/25.17.3389
Amasino, R. M., and Michaels, S. D. (2010). The timing of flowering. Plant Physiol. 154, 516–520. doi: 10.1104/pp.110.161653
Anders, S., and Huber, W. (2010). Differential expression analysis for sequence count data. Genome Biol. 11:R106. doi: 10.1186/gb-2010-11-10-r106
Andrés, F., and Coupland, G. (2012). The genetic basis of flowering responses to seasonal cues. Nat. Rev. Genet. 13, 627–639. doi: 10.1038/nrg3291
Bernier, G., and Perilleux, C. (2005). A physiological overview of the genetics of flowering time control. Plant Biotechnol. J. 3, 3–16. doi: 10.1111/j.1467-7652.2004.00114.x
Blazquez, M. A., Green, R., Nilsson, O., Sussman, M. R., and Weigel, D. (1998). Gibberellins promote flowering of arabidopsis by activating the LEAFY promoter. Plant Cell 10, 791–800. doi: 10.1105/tpc.10.5.791
Choi, K., Kim, J., Hwang, H. J., Kim, S., Park, C., Kim, S. Y., et al. (2011). The FRIGIDA complex activates transcription of FLC, a strong flowering repressor in Arabidopsis, by recruiting chromatin modification factors. Plant Cell 23, 289–303. doi: 10.1105/tpc.110.075911
Conesa, A., and Götz, S. (2008). Blast2GO: a comprehensive suite for functional analysis in plant genomics. Int. J. Plant Genomics 2008:619832. doi: 10.1155/2008/619832
Covington, M. F., Panda, S., Liu, X. L., Strayer, C. A., Wagner, D. R., and Kay, S. A. (2001). ELF3 modulates resetting of the circadian clock in Arabidopsis. Plant Cell 13, 1305–1315. doi: 10.1105/tpc.13.6.1305
Cox, M. P., Peterson, D. A., and Biggs, P. J. (2010). SolexaQA: At-a-glance quality assessment of Illumina second-generation sequencing data. BMC Bioinformatics 11:485. doi: 10.1186/1471-2105-11-485
Doyle, M. R., Davis, S. J., Bastow, R. M., Mcwatters, H. G., Kozma-Bognar, L., Nagy, F., et al. (2002). The ELF4 gene controls circadian rhythms and flowering time in Arabidopsis thaliana. Nature 419, 74–77. doi: 10.1038/nature00954
Du, Z., Zhou, X., Ling, Y., Zhang, Z., and Su, Z. (2010). agriGO: a GO analysis toolkit for the agricultural community. Nucleic Acids Res. 38, W64–W70. doi: 10.1093/nar/gkq310
Fornara, F., de Montaigu, A., and Coupland, G. (2010). SnapShot: control of flowering in Arabidopsis. Cell 141:550.e2. doi: 10.1016/j.cell.2010.04.024
Franks, S. J. (2015). The unique and multifaceted importance of the timing of flowering. Am. J. Bot. 102, 1401–1402. doi: 10.3732/ajb.1500234
Greenup, A. G., Sasani, S., Oliver, S. N., Walford, S. A., Millar, A. A., and Trevaskis, B. (2011). Transcriptome analysis of the vernalization response in barley (Hordeum vulgare) seedlings. PLoS ONE 6:e17900. doi: 10.1371/journal.pone.0017900
Imaizumi, T. (2010). Arabidopsis circadian clock and photoperiodism: time to think about location. Curr. Opin. Plant Biol. 13, 83–89. doi: 10.1016/j.pbi.2009.09.007
International Brachypodium, I. (2010). Genome sequencing and analysis of the model grass Brachypodium distachyon. Nature 463, 763–768. doi: 10.1038/nature08747
Jung, W. Y., Lee, S. S., Kim, C. W., Kim, H. S., Min, S. R., Moon, J. S., et al. (2014). RNA-seq analysis and de novo transcriptome assembly of Jerusalem artichoke (Helianthus tuberosus Linne). PLoS ONE 9:e111982. doi: 10.1371/journal.pone.0111982
Kim, W. Y., Hicks, K. A., and Somers, D. E. (2005). Independent roles for EARLY FLOWERING 3 and ZEITLUPE in the control of circadian timing, hypocotyl length, and flowering time. Plant Physiol. 139, 1557–1569. doi: 10.1104/pp.105.067173
Kitashiba, H., Li, F., Hirakawa, H., Kawanabe, T., Zou, Z., Hasegawa, Y., et al. (2014). Draft sequences of the radish (Raphanus sativus L.) genome. DNA Res. 21, 481–490. doi: 10.1093/dnares/dsu014
Koornneef, M., Alonso-Blanco, C., Peeters, A. J., and Soppe, W. (1998). Genetic control of flowering time in Arabidopsis. Annu. Rev. Plant Physiol. Plant Mol. Biol. 49, 345–370. doi: 10.1146/annurev.arplant.49.1.345
Langmead, B., and Salzberg, S. L. (2012). Fast gapped-read alignment with Bowtie 2. Nat. Methods 9, 357–359. doi: 10.1038/nmeth.1923
Lee, J., and Lee, I. (2010). Regulation and function of SOC1, a flowering pathway integrator. J. Exp. Bot. 61, 2247–2254. doi: 10.1093/jxb/erq098
Li, F., Hasegawa, Y., Saito, M., Shirasawa, S., Fukushima, A., Ito, T., et al. (2011). Extensive chromosome homoeology among Brassiceae species were revealed by comparative genetic mapping with high-density EST-based SNP markers in radish (Raphanus sativus L.). DNA Res. 18, 401–411. doi: 10.1093/dnares/dsr027
Liu, C., Xi, W., Shen, L., Tan, C., and Yu, H. (2009). Regulation of floral patterning by flowering time genes. Dev. Cell 16, 711–722. doi: 10.1016/j.devcel.2009.03.011
Liu, C., Zhou, J., Bracha-Drori, K., Yalovsky, S., Ito, T., and Yu, H. (2007). Specification of Arabidopsis floral meristem identity by repression of flowering time genes. Development 134, 1901–1910. doi: 10.1242/dev.003103
Melzer, S., Lens, F., Gennen, J., Vanneste, S., Rohde, A., and Beeckman, T. (2008). Flowering-time genes modulate meristem determinacy and growth form in Arabidopsis thaliana. Nat. Genet. 40, 1489–1492. doi: 10.1038/ng.253
Moriya, Y., Itoh, M., Okuda, S., Yoshizawa, A. C., and Kanehisa, M. (2007). KAAS: an automatic genome annotation and pathway reconstruction server. Nucleic Acids Res. 35, W182–W185. doi: 10.1093/nar/gkm321
Mun, J. H., Chung, H., Chung, W. H., Oh, M., Jeong, Y. M., Kim, N., et al. (2015). Construction of a reference genetic map of Raphanus sativus based on genotyping by whole-genome resequencing. Theor. Appl. Genet. 128, 259–272. doi: 10.1007/s00122-014-2426-4
Murase, K., Hirano, Y., Sun, T. P., and Hakoshima, T. (2008). Gibberellin-induced DELLA recognition by the gibberellin receptor GID1. Nature 456, 459–463. doi: 10.1038/nature07519
Nakamura, Y., Iwahashi, T., Tanaka, A., Koutani, J., Matsuo, T., Okamoto, S., et al. (2001). 4-(Methylthio)-3-butenyl isothiocyanate, a principal antimutagen in daikon (Raphanus sativus; Japanese white radish). J. Agric. Food Chem. 49, 5755–5760. doi: 10.1021/jf0108415
Nie, S., Xu, L., Wang, Y., Huang, D., Muleke, E. M., Sun, X., et al. (2015). Identification of bolting-related microRNAs and their targets reveals complex miRNA-mediated flowering-time regulatory networks in radish (Raphanus sativus L.). Sci. Rep. 5:14034. doi: 10.1038/srep14034
Nilsson, O., Lee, I., Blázquez, M. A., and Weigel, D. (1998). Flowering-time genes modulate the response to LEAFY activity. Genetics 150, 403–410.
Okazaki, K., Sakamoto, K., Kikuchi, R., Saito, A., Togashi, E., Kuginuki, Y., et al. (2007). Mapping and characterization of FLC homologs and QTL analysis of flowering time in Brassica oleracea. Theor. Appl. Genet. 114, 595–608. doi: 10.1007/s00122-006-0460-6
Panjabi, P., Jagannath, A., Bisht, N. C., Padmaja, K. L., Sharma, S., Gupta, V., et al. (2008). Comparative mapping of Brassica juncea and Arabidopsis thaliana using Intron Polymorphism (IP) markers: homoeologous relationships, diversification and evolution of the A, B and C Brassica genomes. BMC Genomics 9:113. doi: 10.1186/1471-2164-9-113
Parcy, F. (2005). Flowering: a time for integration. Int. J. Dev. Biol. 49, 585–593. doi: 10.1387/ijdb.041930fp
Parmesan, C., and Yohe, G. (2003). A globally coherent fingerprint of climate change impacts across natural systems. Nature 421, 37–42. doi: 10.1038/nature01286
Putterill, J., Laurie, R., and Macknight, R. (2004). It's time to flower: the genetic control of flowering time. Bioessays 26, 363–373. doi: 10.1002/bies.20021
Samach, A., Onouchi, H., Gold, S. E., Ditta, G. S., Schwarz-Sommer, Z., Yanofsky, M. F., et al. (2000). Distinct roles of CONSTANS target genes in reproductive development of Arabidopsis. Science 288, 1613–1616. doi: 10.1126/science.288.5471.1613
Sawa, M., Nusinow, D. A., Kay, S. A., and Imaizumi, T. (2007). FKF1 and GIGANTEA complex formation is required for day-length measurement in Arabidopsis. Science 318, 261–265. doi: 10.1126/science.1146994
Shirasawa, K., Oyama, M., Hirakawa, H., Sato, S., Tabata, S., Fujioka, T., et al. (2011). An EST-SSR linkage map of Raphanus sativus and comparative genomics of the Brassicaceae. DNA Res. 18, 221–232. doi: 10.1093/dnares/dsr013
Simpson, G. G., and Dean, C. (2002). Arabidopsis, the Rosetta stone of flowering time? Science 296, 285–289. doi: 10.1126/science.296.5566.285
Srikanth, A., and Schmid, M. (2011). Regulation of flowering time: all roads lead to Rome. Cell. Mol. Life Sci. 68, 2013–2037. doi: 10.1007/s00018-011-0673-y
Sung, S., and Amasino, R. M. (2005). Remembering winter: toward a molecular understanding of vernalization. Annu. Rev. Plant Biol. 56, 491–508. doi: 10.1146/annurev.arplant.56.032604.144307
Tamaki, S., Matsuo, S., Wong, H. L., Yokoi, S., and Shimamoto, K. (2007). Hd3a protein is a mobile flowering signal in rice. Science 316, 1033–1036. doi: 10.1126/science.1141753
Tomato Genome, C. (2012). The tomato genome sequence provides insights into fleshy fruit evolution. Nature 485, 635–641. doi: 10.1038/nature11119
Tsuro, M., Suwabe, K., Kubo, N., Matsumoto, S., and Hirai, M. (2008). Mapping of QTLs controlling root shape and red pigmentation in radish, Raphanus sativus L. Breed. Sci. 58, 55–61. doi: 10.1270/jsbbs.58.55
Turck, F., Fornara, F., and Coupland, G. (2008). Regulation and identity of florigen: FLOWERING LOCUS T moves center stage. Annu. Rev. Plant Biol. 59, 573–594. doi: 10.1146/annurev.arplant.59.032607.092755
Villacorta-Martin, C., Nunez De Caceres Gonzalez, F. F., De Haan, J., Huijben, K., Passarinho, P., Lugassi-Ben Hamo, M., et al. (2015). Whole transcriptome profiling of the vernalization process in Lilium longiflorum (cultivar White Heaven) bulbs. BMC Genomics 16, 550. doi: 10.1186/s12864-015-1675-1
Wang, L., Wei, L., Wang, L., and Xu, C. (2002). Effects of peroxidase on hyperlipidemia in mice. J. Agric. Food Chem. 50, 868–870. doi: 10.1021/jf011130+
Wang, N., Qian, W., Suppanz, I., Wei, L., Mao, B., Long, Y., et al. (2011). Flowering time variation in oilseed rape (Brassica napus L.) is associated with allelic variation in the FRIGIDA homologue BnaA.FRI.a. J. Exp. Bot. 62, 5641–5658. doi: 10.1093/jxb/err249
Wang, Y., Pan, Y., Liu, Z., Zhu, X., Zhai, L., Xu, L., et al. (2013a). De novo transcriptome sequencing of radish (Raphanus sativus L.) and analysis of major genes involved in glucosinolate metabolism. BMC Genomics 14:836. doi: 10.1186/1471-2164-14-836
Wang, Y., Xu, L., Chen, Y., Shen, H., Gong, Y., Limera, C., et al. (2013b). Transcriptome profiling of radish (Raphanus sativus L.) root and identification of genes involved in response to Lead (Pb) stress with next generation sequencing. PLoS ONE 8:e66539. doi: 10.1371/journal.pone.0066539
Weigel, D., Alvarez, J., Smyth, D. R., Yanofsky, M. F., and Meyerowitz, E. M. (1992). LEAFY controls floral meristem identity in Arabidopsis. Cell 69, 843–859. doi: 10.1016/0092-8674(92)90295-N
Wu, G., Zhang, L., Yin, Y., Wu, J., Yu, L., Zhou, Y., et al. (2015). Sequencing, de novo assembly and comparative analysis of Raphanus sativus transcriptome. Front. Plant Sci. 6:198. doi: 10.3389/fpls.2015.00198
Yan, L., Loukoianov, A., Tranquilli, G., Helguera, M., Fahima, T., and Dubcovsky, J. (2003). Positional cloning of the wheat vernalization gene VRN1. Proc. Natl. Acad. Sci. U.S.A. 100, 6263–6268. doi: 10.1073/pnas.0937399100
Yuan, Y. X., Wu, J., Sun, R. F., Zhang, X. W., Xu, D. H., Bonnema, G., et al. (2009). A naturally occurring splicing site mutation in the Brassica rapa FLC1 gene is associated with variation in flowering time. J. Exp. Bot. 60, 1299–1308. doi: 10.1093/jxb/erp010
Zaki, H. E. M., Takahata, Y., and Yokoi, S. (2012). Analysis of the morphological and anatomical characteristics of roots in three radish (Raphanus sativus) cultivars that differ in root shape. J. Hortic. Sci. Biotech. 87, 172–178. doi: 10.1080/14620316.2012.11512849
Zhai, Q., Zhang, X., Wu, F., Feng, H., Deng, L., Xu, L., et al. (2015). Transcriptional mechanism of jasmonate receptor COI1-mediated delay of flowering time in Arabidopsis. Plant Cell 27, 2814–2828. doi: 10.1105/tpc.15.00619
Keywords: flowering time-related gene, late bolting, radish (Raphanus sativus L.), RNA sequencing, vernalization
Citation: Jung WY, Park HJ, Lee A, Lee SS, Kim Y-S and Cho HS (2016) Identification of Flowering-Related Genes Responsible for Differences in Bolting Time between Two Radish Inbred Lines. Front. Plant Sci. 7:1844. doi: 10.3389/fpls.2016.01844
Received: 23 June 2016; Accepted: 22 November 2016;
Published: 09 December 2016.
Edited by:
Chengdao Li, Murdoch University, AustraliaReviewed by:
Girdhar Kumar Pandey, University of Delhi, IndiaLiezhao Liu, Southwest University, China
Copyright © 2016 Jung, Park, Lee, Lee, Kim and Cho. This is an open-access article distributed under the terms of the Creative Commons Attribution License (CC BY). The use, distribution or reproduction in other forums is permitted, provided the original author(s) or licensor are credited and that the original publication in this journal is cited, in accordance with accepted academic practice. No use, distribution or reproduction is permitted which does not comply with these terms.
*Correspondence: Youn-Sung Kim, yskim0907@hanmail.net
Hye Sun Cho, hscho@kribb.re.kr