
- Statistical Cognition Laboratory, School of Psychological Science, La Trobe University, Melbourne, VIC, Australia
A statistically significant result, and a non-significant result may differ little, although significance status may tempt an interpretation of difference. Two studies are reported that compared interpretation of such results presented using null hypothesis significance testing (NHST), or confidence intervals (CIs). Authors of articles published in psychology, behavioral neuroscience, and medical journals were asked, via email, to interpret two fictitious studies that found similar results, one statistically significant, and the other non-significant. Responses from 330 authors varied greatly, but interpretation was generally poor, whether results were presented as CIs or using NHST. However, when interpreting CIs respondents who mentioned NHST were 60% likely to conclude, unjustifiably, the two results conflicted, whereas those who interpreted CIs without reference to NHST were 95% likely to conclude, justifiably, the two results were consistent. Findings were generally similar for all three disciplines. An email survey of academic psychologists confirmed that CIs elicit better interpretations if NHST is not invoked. Improved statistical inference can result from encouragement of meta-analytic thinking and use of CIs but, for full benefit, such highly desirable statistical reform requires also that researchers interpret CIs without recourse to NHST.
We investigated how researchers interpret the pattern of results discussed by Gelman and Stern (2006) , whose argument is summarized by their title: “The difference between ‘significant’ and ‘not significant’ is not itself statistically significant” (p. 328). We report two email studies of how researchers interpret such results when presented in null hypothesis significance testing (NHST), or confidence interval (CI) formats.
Statistical Reform
Statistical reformers argue that CIs have strong advantages over NHST (e.g., Kline, 2004 , Chapter 3; Cumming and Finch, 2005 ). The reformers’ case is compelling, although most of the criticism of NHST and advocacy of CIs and other techniques to supplement or even replace NHST has focused mainly on theoretical arguments and expected or predicted misconceptions, rather than on empirical evidence.
The dearth of cognitive evidence to help guide the NHST debate may be one reason why weak and misleading arguments have appeared. For example Hagen (1997) argued that “it is unlikely that we will ever be able to divorce ourselves from that [NHST] logic” (p. 22). Thompson (1998) made convincing ripostes to Hagen’s support of NHST and his criticism of Cohen’s (1994) famous critique of NHST. Further, Knapp and Sawilowsky (2001) contended that “criticism of null hypothesis testing and subsequent advocacy of confidence intervals is simply illogical” (p. 73). Again Thompson (2001) replied persuasively, while also reiterating a point that is important for the present article: “If we mindlessly interpret a confidence interval with reference to whether the interval subsumes zero, we are doing little more than nil hypothesis statistical testing” (Thompson, 1998 , p. 799). In contrast, Leventhal and Huynh (1996) provided in their discussion section a detailed and well-informed comparison of NHST and CIs. However they too did not draw on any empirical evidence about how researchers use or understand the different techniques.
There is some experimental evidence about deficiencies of NHST, as reported for example by Oakes (1986) and Haller and Krauss (2002) , and such cognitive evidence has been cited in support of statistical reform by some scholars, for example Kline (2004 , Chapter 3). On the other hand there is little evidence about how CIs are understood, and even less that compares NHST and CIs. Fidler and Loftus (2009) conducted one of the few direct comparisons of NHST and CIs. They reported empirical evidence that CIs can give better interpretations than NHST in some situations. Otherwise there has been little experimental study of whether CIs can in practice lead to better inference, as reformers claim. The aim of the two experiments reported here was to seek evidence about how researchers think about and interpret a simple pattern of results, as a function of the reporting format – especially NHST and CI formats.
From Dichotomous Thinking to Estimation Thinking
Two of the advantages claimed for CIs are especially relevant. First, Meehl (1978) and Gigerenzer (1998) argued that the focus of NHST on dichotomous reject or do-not-reject decisions restricts how researchers think. They claimed dichotomous thinking, as reinforced by NHST, limits the questions researchers ask and even the theories they develop. They argued that using an inference technique (NHST) whose primary outcome is a statement that a result is or is not statistically significant leads researchers to formulate questions that are similarly impoverished, for example “does the treatment produce an improvement?” By contrast, CIs provide point and interval estimates, which could prompt researchers to ask quantitative questions and develop better, more quantitative, theories (Cumming and Fidler 2009 ). Researchers may be prompted to ask ‘how large an improvement does the treatment give?” (Of course the answer may be zero or negative.) Further, asking and answering such questions may prompt development of theories that are more quantitative, for example postulating a particular functional relationship between amount of treatment and size of effect, rather than theories that merely postulate an unspecified improvement. CIs may thus offer a release from dichotomous thinking, and may help researchers move beyond that to estimation thinking, which emphasizes the sizes of effects.
The argument of Meehl (1978) and Gigerenzer (1998) in favor of CIs is appealing, but has not yet, so far as we know, been subjected to empirical test. It is possible, for example, that at least some researchers think in terms of effect sizes and amounts, even when using NHST. Also, it seems plausible that, if CIs are used merely to note whether zero is excluded and therefore a null hypothesis can be rejected, habits of dichotomous thinking may suffer little disturbance. Empirical investigation is required.
Meta-Analytic Thinking
The second advantage of CIs that is especially relevant here is their provision of a measure of precision. Obtaining statistical significance can give a seductive but unwarranted sense of certainty. Stating a result is “significant” too easily suggests the effect truly exists and even that it is important or large. It is easy to overlook the role of sampling variability and the possibility the NHST decision is wrong. By contrast, CI width is a measure of precision that provides an accurate quantification of remaining uncertainty. A narrow CI justifies confidence we have reasonably precise knowledge about the effect under study. Unfortunately, in psychology power is usually low and our CIs are wide, indicating that uncertainty is large, whether or not an effect can be pronounced statistically significant. As Cohen (1994) stated: “I suspect that the main reason they [CIs] are not reported is that they are so embarrassingly large!” (p. 1002).
Obtaining wide CIs may prompt researchers to design better and higher-powered studies – which would be an excellent outcome (Maxwell, 2004 ). In addition, appreciating the large extent of uncertainty should encourage researchers to focus on cumulation of evidence over studies. Schmidt (1996) argued that “any single study is rarely adequate by itself to answer a scientific question. Therefore each study should be considered as a data point to be contributed to a later meta-analysis” (p. 124). Wilkinson and the Task Force on Statistical Inference (1999) made a similar point by stating that “Comparing confidence intervals from a current study to intervals from previous, related studies helps focus attention on stability across studies… [and] also helps in constructing plausible regions for population parameters.” (p. 599). For all these reasons, researchers should adopt meta-analytic thinking (Cumming and Finch, 2001 ), which recognizes that a single study contributes evidence that needs to be considered along with evidence from other studies, past and future. Meta-analytic thinking is highly desirable, and CIs may help it displace dichotomous thinking.
The Rationale for Our Experiments
We designed the two experiments reported in this article to provide cognitive evidence related to the CI and NHST issues described above. In both experiments, the set of results we presented to participants comprised results from two similar fictitious studies. The two results were in the same direction and of comparable size, but one was clearly statistically significant at the 0.05 level, whereas the other was not. Results were presented in various NHST or CI formats. In our Experiment 1 we first asked an open-ended question about how the respondent interpreted the set of results we presented. We next asked for ratings on a 1–7 scale in reply to more specific questions about what overall conclusion is warranted, and the extent to which the respondent thought the two results conflicted, or were similar. We then asked for comments about how the respondent thought about and answered our questions. The results of the first experiment helped us design Experiment 2, which asked more specifically about how respondents thought about particular questions we asked. Note that all our questions, in both experiments, asked about interpretation of the whole set of results, rather than about either individual study.
We expected dichotomous thinking would prompt respondents to see the two studies as conflicting, or not similar, and to regard the two studies together as giving poor, or equivocal, evidence of an effect. On the other hand, we reasoned that respondents who thought quantitatively and adopted meta-analytic thinking would be likely to see the two studies as agreeing, rather than conflicting, and together as offering quite strong evidence of an effect. We presented the results in one of four formats –each respondent saw only one format – so that any differential prompting of dichotomous or meta-analytic thinking by different formats might be revealed. We were particularly interested to test the claims of statistical reformers that NHST tends to elicit dichotomous thinking, whereas CIs are more likely to prompt meta-analytic thinking.
We were mindful of the possibility a respondent could see results in one format, yet think at least partly in terms of some other representation of the results. For example, a respondent might see CIs, yet think primarily in terms of whether or not zero is excluded from the interval, and thus whether or not a null hypothesis of zero can be rejected. We hoped the discursive answers to our initial open-ended question, and the responses to our later invitation for general comments, would throw additional light on respondents’ thinking.
In Experiment 1, researchers who had published in psychology (PSY), behavioral neuroscience (BN), and medical (MED) journals were asked by email to interpret the results of our two fictitious studies. We chose the three disciplines because of their different statistical practices: MED routinely uses CIs but usually not in figures, BN routinely uses SE bars in figures but seldom uses CIs. PSY makes comparatively little use of either CIs or SE bars (Belia et al., 2005 ). Our respondents saw results presented in one of four formats, being the four combinations of NHST or CIs, and as a figure or in text.
Experiment 1: Researchers in the Three Disciplines
We asked respondents to interpret two similar studies. One gave a statistically significant (p = 0.02), and the other a non-significant (p = 0.22) result in the same direction. NHST and dichotomous thinking may suggest the two studies gave conflicting results. By contrast, CIs show large overlap, so CIs and meta-analytic thinking may suggest the two gave consistent results and together gave stronger evidence of an effect than either study alone.
Method
Figure 1 presents a vignette describing two fictitious studies that compared a new treatment for insomnia with the current treatment. Each used two independent equal-sized groups. The results are shown in four formats: CI figure, CI text, NHST figure, or NHST text. The data were the same in every case. Comparison of the two studies gives p = 0.55, so the difference between the two is consistent with sampling variability, and the results should not be regarded as conflicting. Figure 2 shows the two results, and their meta-analytic combination calculated using a random effects model by Comprehensive Meta-Analysis 1 . The combined result was 95% CI [0.81, 5.29], p = 0.008, which indicates quite strong evidence the new treatment is more effective.
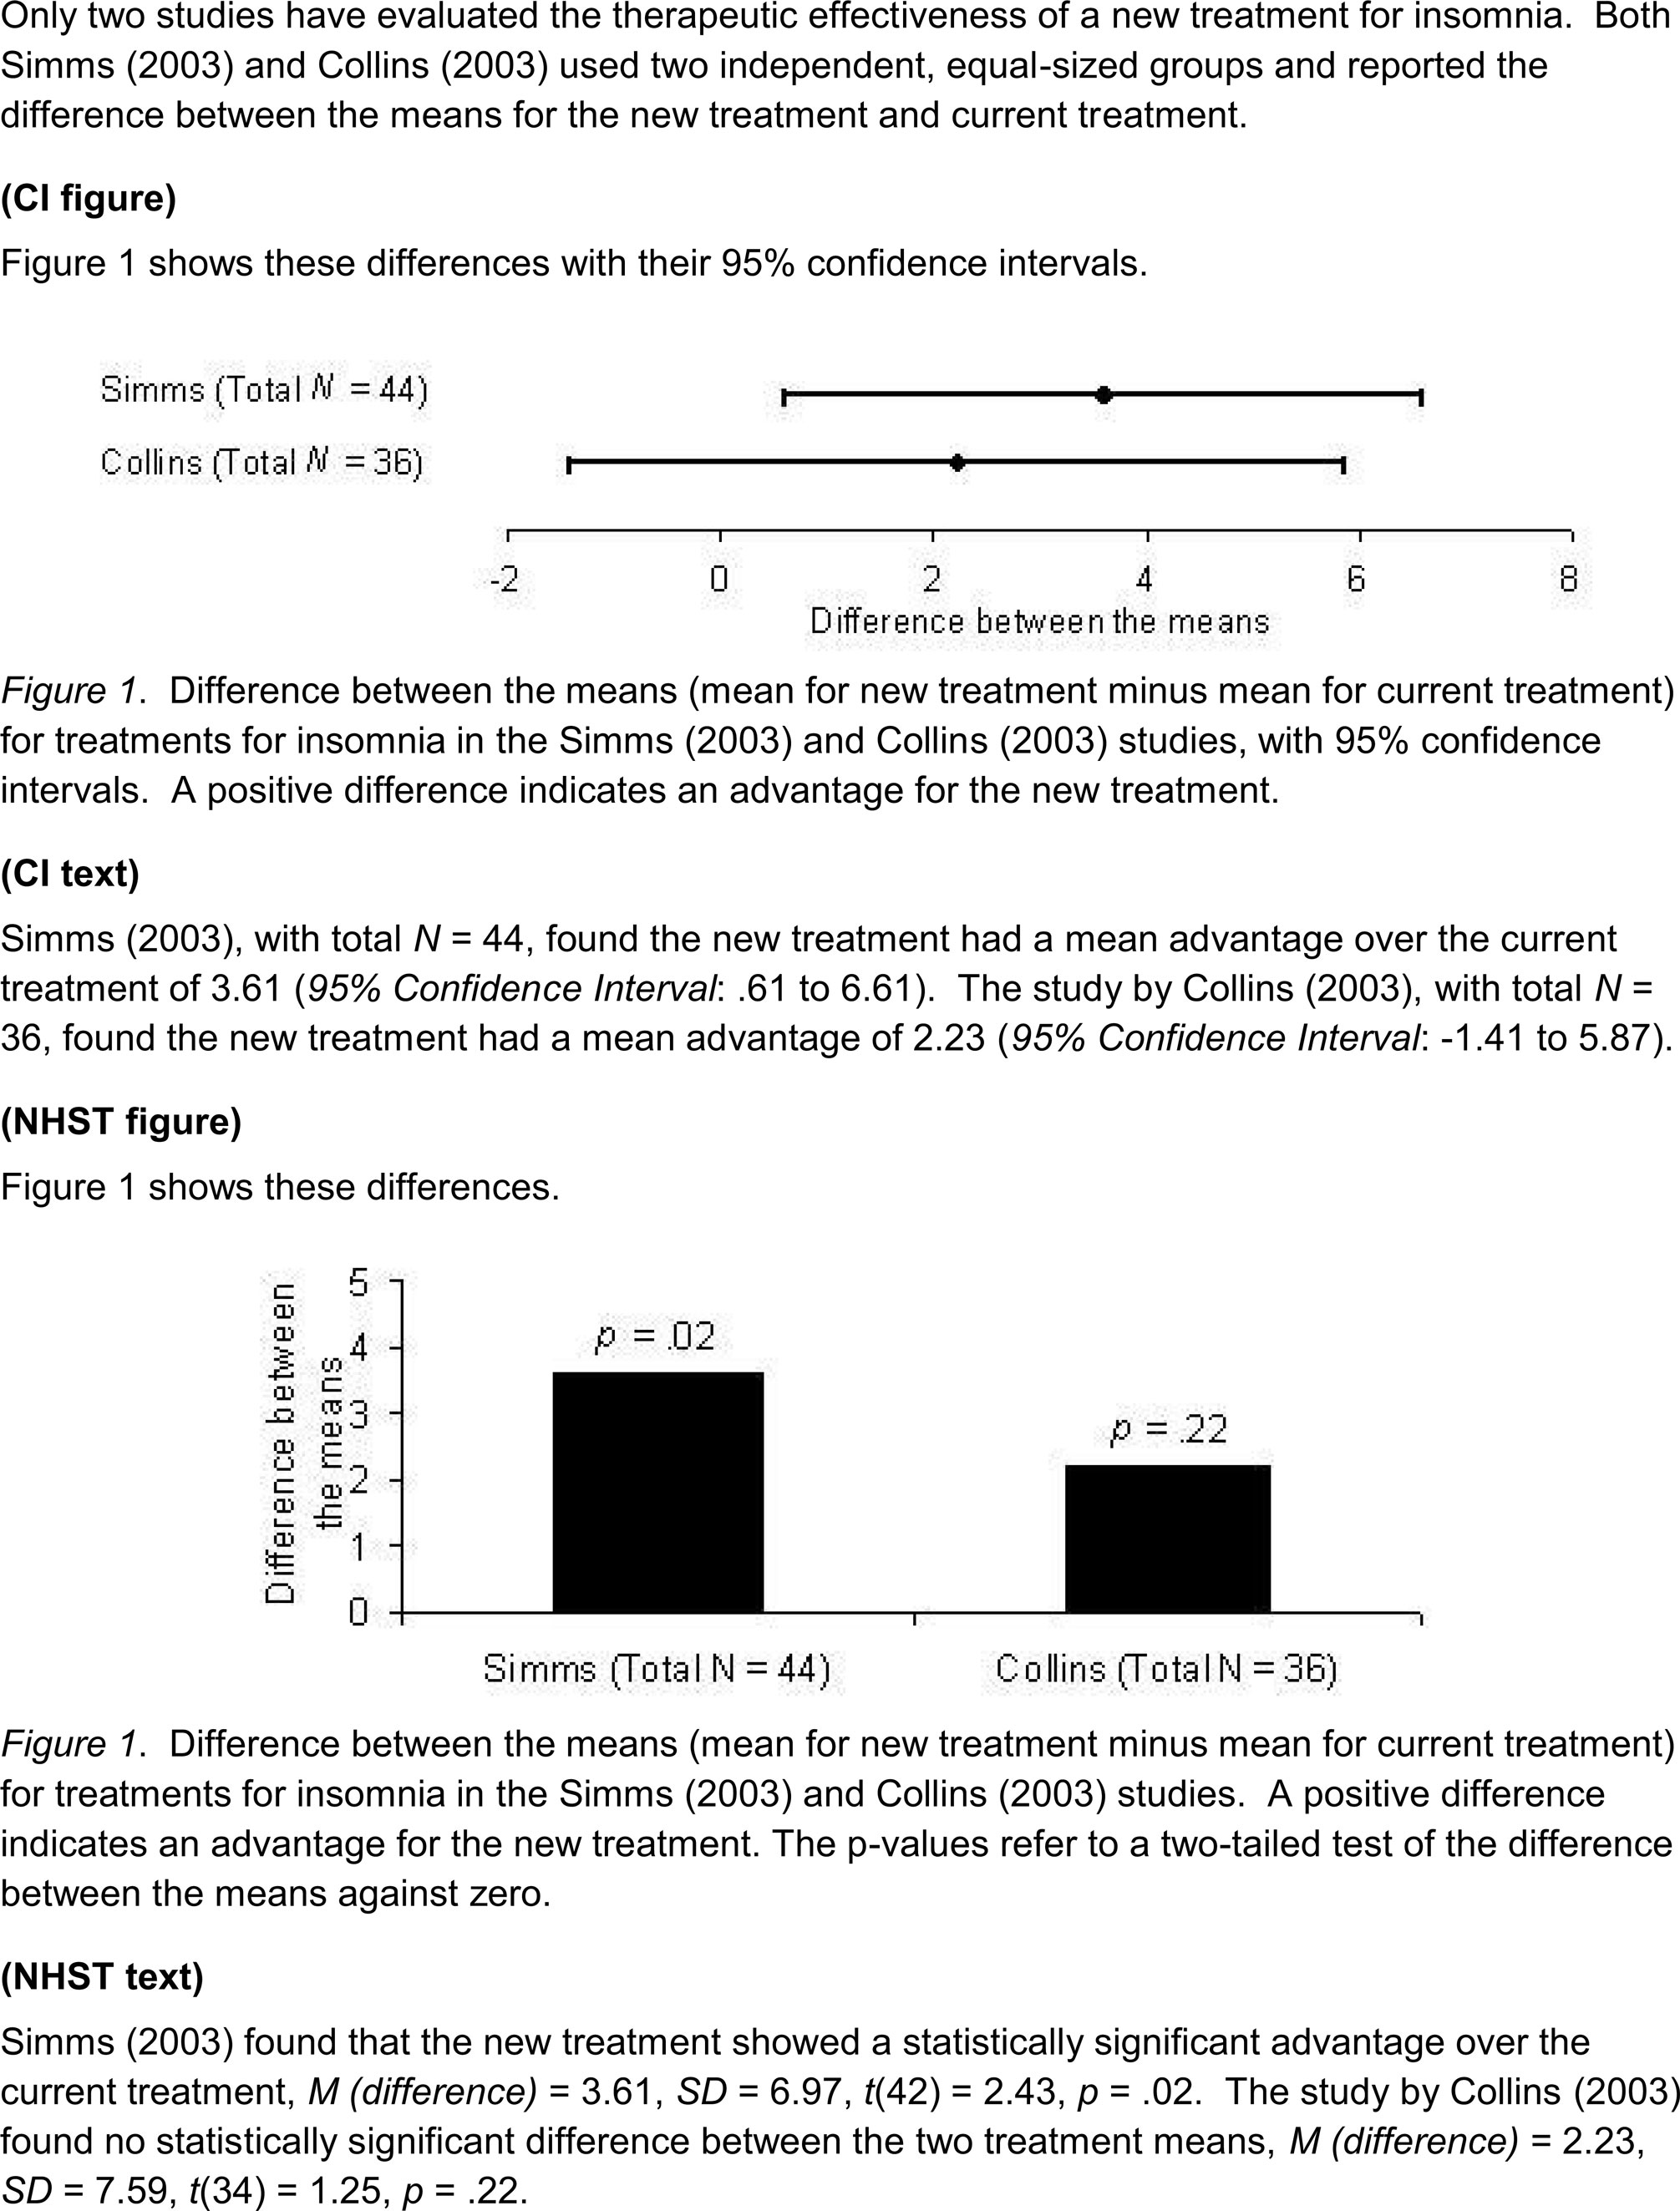
Figure 1. The vignette and four results formats used in Experiment 1. Each email included the top introductory description of two fictitious studies, then just one of the presentations of results, without the label in parentheses.
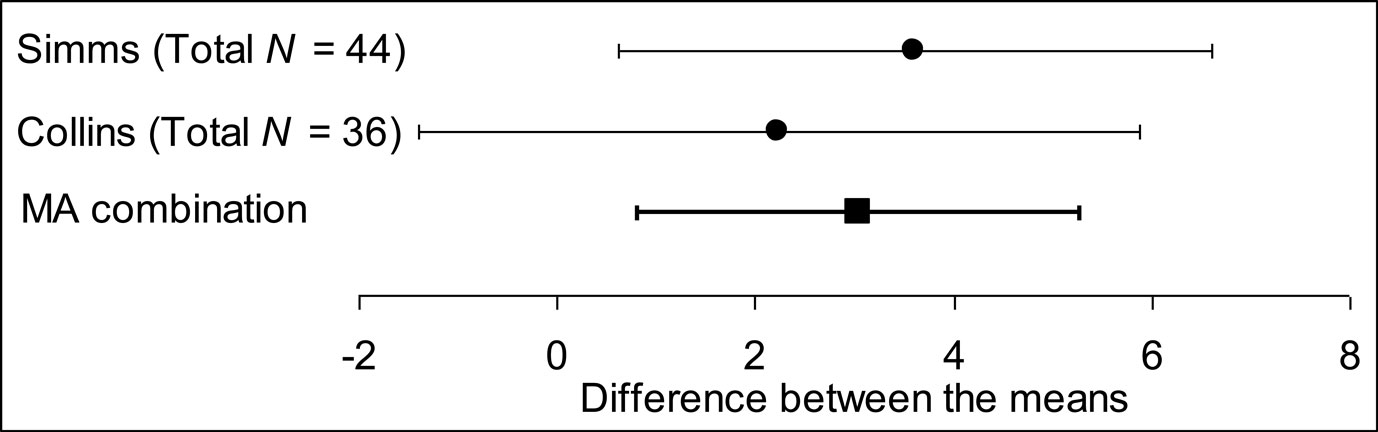
Figure 2. Results of the two studies described in the experimental vignette (see Figure 1 ), together with the meta-analytic (MA) combination of these results. Error bars are 95% CIs.
We sent emails to authors of recent articles in leading PSY, BN, and MED journals. Any author saw one of the four formats. Authors were asked, first, to answer in their own words the question “what do you feel is the main conclusion suggested by these studies?”, then were asked to rate, on a scale from 1 = strongly disagree, to 7 = strongly agree, their attitude to statements S1 “the results of the two studies are broadly consistent”, S2 “there is reasonable evidence the new treatment is more effective”, and S3 “there is conflicting evidence about the effectiveness of the new treatment”. We then asked “how many years ago did you publish your first research paper?”
Results
We sent 2,322 emails, approximately equal numbers to each discipline in each format; 190 (8.2%) bounced. Just 330 (15.5% of 2,132 assumed received) elicited usable replies.
‘Consistent’ scores
As expected, the S1 (“broadly consistent”) and S3 (“conflicting evidence”) scores were negatively correlated, r = −0.64, so we averaged the S1 and a reversal of the S3 scores, to give a Consistent score, with 1 = strong disagreement and 7 = strong agreement the studies are consistent and not conflicting. Means and 95% CIs suggested any differences between figure and text formats were small, so results presented here are combined over that variable. Figure 3 shows mean Consistent scores; the overall mean was 4.27 [4.07, 4.46]. Figure 4 shows the histograms of Consistent scores, which varied greatly over respondents (SD = 1.77). All values of the rating scale were well-used.
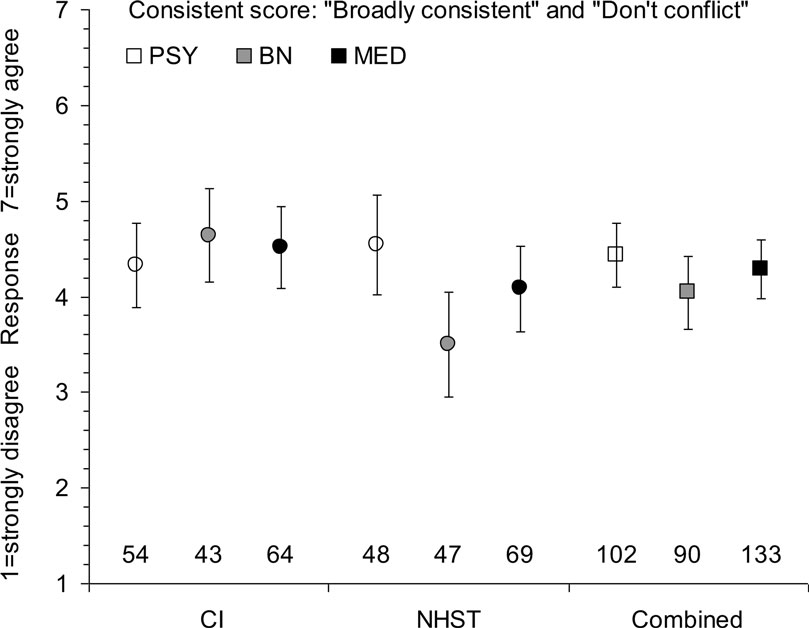
Figure 3. Means and 95% CIs of the Consistent score in Experiment 1, for six independent groups of respondents combining figure and text formats, and for the three disciplines – psychology (PSY), behavioral neuroscience (BN), and medicine (MED) – combining all formats. Responses indicate strength of agreement the two studies described in Figure 1 are consistent and do not conflict. Sample sizes are shown at the bottom.
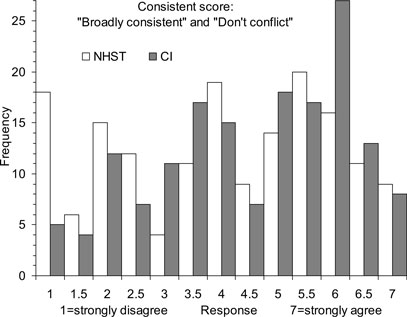
Figure 4. Frequency histograms of Consistent scores in Experiment 1. Responses indicate strength of agreement the two studies described in Figure 1 are consistent and do not conflict. Histograms are shown for the two NHST display formats combined, and the two CI formats combined – in each case for all three disciplines combined.
Combining over disciplines, the difference between the CI mean of 4.49, and NHST mean of 4.05 was 0.44 [0.05, 0.82]. This is a small difference in the expected direction: CI formats were slightly more likely than NHST to suggest the two studies gave consistent results. The difference can be expressed as a Cohen’s d value by dividing it by 1.76, the pooled standard deviation within CI conditions and NHST conditions, to give d = 0.25, which we regard as small. Figure 3 suggests this difference might be attributable to BN and, perhaps MED, but cautions that any disciplinary differences have not been clearly established. Also, any overall difference between disciplines would be small.
The two leftmost columns in Figure 4 show there were 18 (11%) Consistent scores of 1 to NHST formats, but only 5 (3.1%) to CI formats. Such a Consistent score of 1 can only arise when both S1 and S3 elicited extreme ratings; in other words, the response to S1 (“broadly consistent”) was 1, and the response to S3 (“conflicting evidence”) was 7. These are the strongest responses that the two studies are inconsistent and conflicting – as dichotomous thinking suggests. As those columns of Figure 4 show, there were considerably more such scores to NHST formats than to CI formats.
‘Effective’ scores
Figure 5 shows the mean S2 scores (Effective scores). Again, inspection of data led us to combine figure and text formats. The overall mean was 3.36 [3.16, 3.56]. Figure 5 suggests any discipline or format differences were small. The means for the CI (3.42) and NHST formats (3.30) were similar.
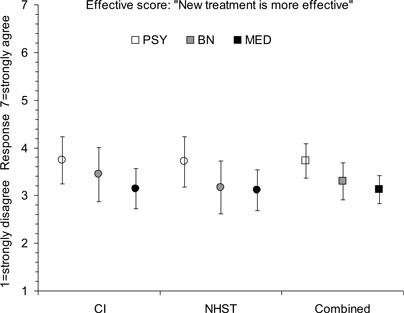
Figure 5. Means and 95% CIs of the Effective score in Experiment 1, for six independent groups of respondents combining figure and text formats, and for the three disciplines – psychology (PSY), behavioral neuroscience (BN), and medicine (MED) – combining all formats. Responses indicate strength of agreement there is evidence the new treatment is more effective. Sample sizes are as shown in Figure 3 .
Figure 6 shows that again there was great variability over respondents (SD = 1.80). The histograms shown in Figure 6 for the CI and NHST formats are similar, both showing great variability.
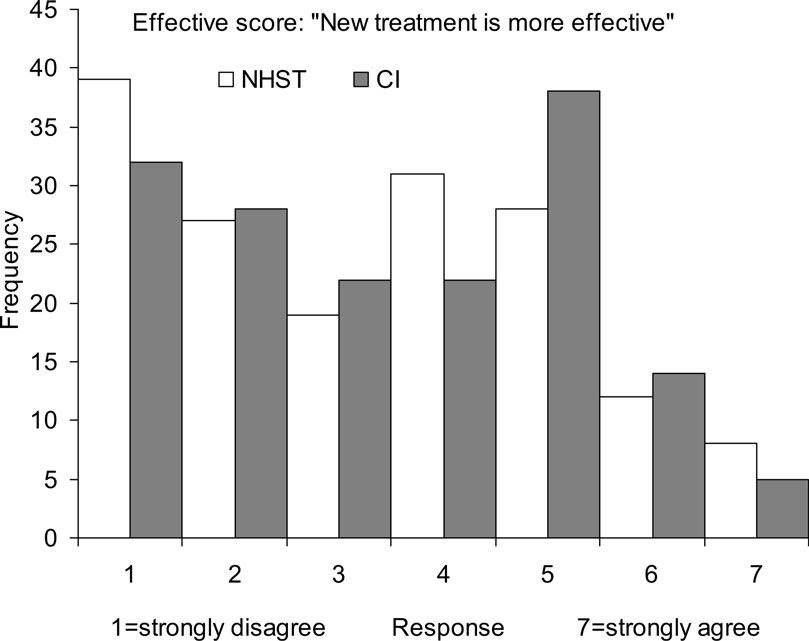
Figure 6. Frequency histograms of Effective scores in Experiment 1. Responses indicate strength of agreement the two studies described in Figure 1 together provide evidence the new treatment is more effective. Histograms are shown for the two NHST display formats combined, and the two CI formats combined – in each case for all three disciplines combined.
The correlation between Consistent and Effective scores was r = 0.46, and was similar for each discipline, indicating a moderate positive relation between seeing the studies as consistent, and agreeing there is evidence the new treatment is more effective. The correlation of number of years since first publication with Consistent scores was negligible, r = 0.07 [−0.04, 0.18], as was the corresponding correlation with Effective scores, r = .04 [−0.07, 0.15]. These correlations were similar for each discipline.
Text responses
Text responses to the initial question were very diverse. Many gave evidence of misconception, especially about p values or NHST. We content analyzed the responses, and decided that two classifications would best represent them in relation to our primary aim of comparing CI and NHST approaches to inference. First, we coded each response as stating or implying the two studies gave similar – or consistent or the same – results (e.g., “Both studies found some effectiveness of treatment.”, “There is an improved way of treating insomnia.”), or gave different or conflicting results (e.g., “…two essentially contradictory results”, “conflicting finding”), or did not justify either of these options.
Second, we coded responses to the CI formats as mentioning NHST (CI-as-NHST, including any mention of p values, significance, a null hypothesis, or whether or not a CI includes zero), or not (Not-CI-as-NHST). Responses in the latter category may have referred to CIs in some other way, perhaps mentioning intervals or overlap, or may have made no reference to CIs. We developed detailed coding rules, and took care the two classifications relied on different terms and so were based on different aspects of a response. Two coders independently coded all responses. For each coder, the two classifications were undertaken more than a week apart, to reduce any influence of memory for particular responses. When making the second classification, the coder was blind to the first.
The two coders classified the 330 text responses as similar, different or unclassifiable, and agreed in 302/330 (91.5%) cases, Cohen’s κ = 0.86. We labeled a response Similar or Different if both coders identified it as such. There were 140 text responses labeled Similar and 108 labeled Different, in similar proportions for each discipline. Of these, 81/126 (64.3%) text responses to CI formats were Similar, slightly more than the 59/122 (48.4%) Similar responses to NHST. The difference was 15.9 percentage points [3.6, 27.6]. The correlation of Similar-Different with Consistent scores was r = 0.63. The corresponding correlation with Effective scores was r = 0.47, confirming Similar text responses tended to go with ratings the new treatment is more effective.
For our second classification, the two coders classified the 161 text responses to CI formats as CI-as-NHST, or Not-CI-as-NHST, and agreed in 145/161 (90.1%) cases, Cohen’s κ = 0.80. We labeled a text response CI-as-NHST, or Not-CI-as-NHST if the coders agreed. There were 64 CI-as-NHST, and 81 Not-CI-as-NHST text responses, in similar proportions for each discipline. Even though the CI format emails made no mention of NHST, in 64/145 (44.1%) cases the respondent mentioned NHST in his or her text comments. The correlation of this classification of text responses with Consistent scores was small, r = −0.22 [−0.37, −0.06], and with Effective scores negligible, r = −0.08 [−0.24, 0.08]. There was thus only a small tendency for text responses that mentioned NHST when interpreting a CI format to go with ratings indicating the two results conflicted.
We examined the association between the two classifications of text responses, for the 112 responses assigned values on both. Figure 7 shows that 40.0% of CI-as-NHST responses were classified as Similar, whereas 94.7% of Not-CI-as-NHST responses were classified as Similar. This striking difference of 54.7 percentage points [38.7, 67.1] indicates that a respondent interpreting CI results who made any mention of NHST in his or her text comment most likely (in 60% of cases) also stated the two results differed. In contrast, if no mention was made of NHST the respondent almost certainly (95%) stated or implied the two results were similar.
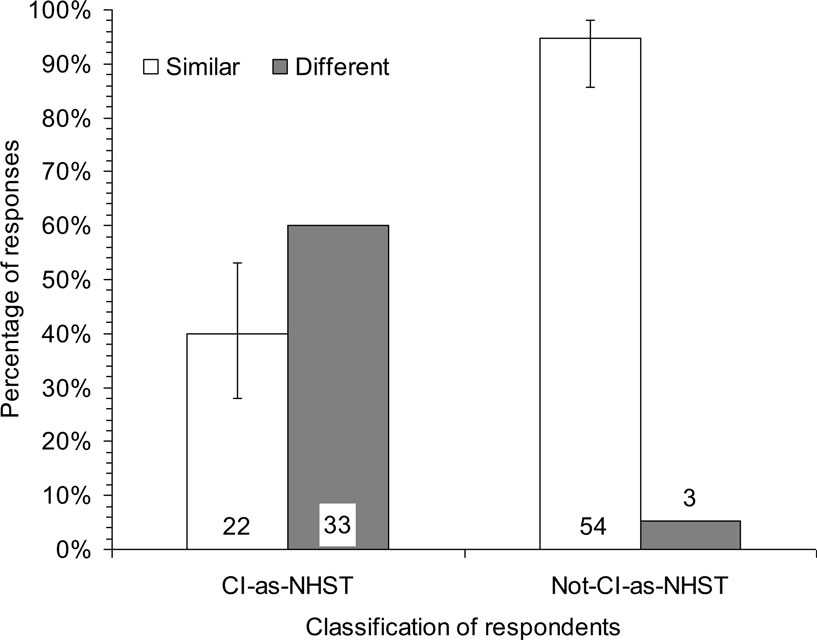
Figure 7. Percentages of text responses in Experiment 1 classified as indicating the two studies gave Similar or Different results, for respondents classified as referring to NHST (CI-as-NHST), or not referring to NHST (Not-CI-as-NHST), when interpreting CI results. Numbers of respondents are shown at the bottom. Results are combined for all three disciplines and the two CI formats. For each group of respondents, the Similar and Different percentages sum to 100, so 95% CIs are shown for only one percentage.
Discussion
The best interpretation of our vignette is that the two studies are consistent, and together give strong evidence the new treatment is more effective. The means in Figures 3 and 5 should have been near 6 or 7, rather than 3.5–4.5. Only 29/325 (8.9%) of respondents gave 6 or above on both ratings, and only 81/325 (24.9%) gave any degree of agreement – scores of 5 or more – on both. The histograms in Figures 4 and 6 indicate ratings were very widely spread, and there was a great diversity of text responses. Researchers in every discipline, for every format, interpreted the vignette in ways that ranged from justifiable judgments, to strong but unjustified judgments that the two studies conflict and do not give reasonable evidence the new treatment is more effective.
Mean Consistent ratings were slightly higher for CI than NHST formats, partly because a number of respondents to NHST formats gave extreme ratings to indicate they judged the two results to conflict. There was also a tendency for more CI than NHST respondents to give text responses classified as Similar. However both these differences were small, and many CI respondents gave ratings and text responses indicating difference or conflict between the two results in the vignette.
We designed the four formats to be as distinct as possible, while still typical of what journals publish. We chose the three disciplines because they have different CI and error bar practices. Yet Figures 3 and 4 show little variation over format or discipline. Also, the lack of correlation with number of years since first publication is consistent with a conclusion that our findings hold across the range from recently trained to highly experienced researchers.
We classified 75% of text responses as suggesting the two studies gave Similar or Different results. For the CI formats we classified 90% of text responses as mentioning NHST in some way, or not doing so. Figure 7 shows there was a large and striking relation between the two classifications. The emails that presented results using CIs in a figure or text made no mention anywhere of statistical significance. Even so, around half (49%) of the text responses included in Figure 7 referred to a null hypothesis, a p value, or significance as part of the interpretation. Those responses were more likely (60%) to suggest the two results in the vignette differed. The other half made no reference to NHST, and almost all (95%) of those text responses justifiably suggested the two results were similar.
Our classifications of text responses were designed post hoc. We had not expected the CI formats to generate so many interpretations framed in terms of statistical significance. Given that one of our main conclusions, illustrated in Figure 7 , is based on these classifications, we designed a second experiment to focus on the same task, with presentation of the same results vignette just in the CI figure format, and ask more specifically about information used by respondents to choose their ratings.
Experiment 2: Academic Psychologists
We sent emails to academic staff in departments of psychology in Australian universities, and asked them questions about results presented in the CI figure format.
Method
We used a single email, which included the vignette and results in CI figure format, as shown in Figure 1 . For each of the S1, S2, and S3 statements the respondent was asked to give a 1–7 rating as in Experiment 1. For each statement the respondent was also asked to give a free text response that described the information on which they based their rating.
We obtained from department websites the email addresses of academic staff, lecturer and above, for 48 departments of psychology of Australian universities. We randomized the combined list, then sent emails progressively until we had 50 usable responses.
Results and Discussion
We sent 640 emails of which 72 (11.2%) bounced; 50 (8.8% of 568 assumed received) elicited usable replies. S1 and S3 scores correlated negatively, r = −0.44, so we formed Consistent scores as in Experiment 1. The Consistent mean was 4.34 [3.81, 4.86], SD = 1.70; and the effective mean 3.95 [3.42, 4.48], SD = 1.72. These values are similar to those in Experiment 1.
Two coders independently coded the text responses to the three statements. While coding, the coders were blind to the respondents’ ratings. We classified each response as emphasizing NHST (e.g., mentions of significance, a p value, or a null hypothesis), or CIs (e.g., mentions of intervals, interval extent, or overlap), or showing neither emphasis. We refer to responses emphasizing NHST or CIs as NHST or CI responses, respectively. The coders agreed in 128/145 (88.3%) cases, Cohen’s κ = 0.79, then resolved disagreements by discussion. For the S1 and S3 items, 26/96 (27.1%) had NHST text responses, 61/96 (63.5%) had CI text responses, and 9/96 (9.4%) showed neither emphasis. Figure 8 shows the frequency histograms of ratings, for the S1 and – after reversal – S3 items. Of NHST responses, only 2/26 (7.7%) were ratings of 5, 6, or 7, indicating the two results in the vignette were judged similar. Of CI responses 48/61 (78.7%) were ratings of 5, 6, or 7. The difference between the two percentages was 71.0 [50.7, 81.1].
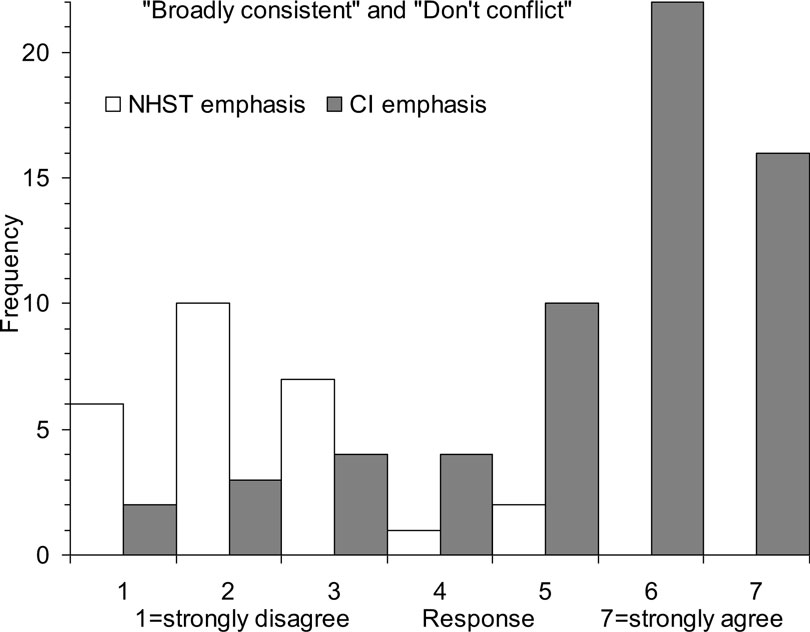
Figure 8. Frequency histograms of rating responses in Experiment 2 to the “broadly consistent” and – after reversal – “there is conflicting evidence” statements (that together yield the Consistent score), separately for text responses classified as showing an NHST emphasis, or a CI emphasis. Responses indicate strength of agreement the two studies described in Figure 1 are consistent and do not conflict.
The disjunction shown in Figure 8 is consistent with, and even more marked than that in Figure 7 . If a respondent interpreted the CI figure mainly with reference to NHST, they were very likely (88%) to interpret the two results as inconsistent or conflicting, but if they mainly referred to interval information they were likely (79%) to interpret the two results as similar. The relation pictured in Figures 7 and 8 is correlational: An NHST interpretation of CIs is associated with difference. It seems more plausible to attribute causality to the NHST interpretation, rather than the judgment of difference, but experimental investigation would be valuable.
Discussion and Conclusions
Our conclusions must be qualified by the low response rates, although respondents possibly tended to be more statistically confident and knowledgeable than non-respondents. If so, our results may underestimate the extent of misconception.
Four Initial Findings
Our first main finding is that respondents interpreted the vignette in a great variety of ways. The wide histograms of Figures 4 and 6 and the great diversity of text comments indicate that respondents not only reached diverse conclusions, but also thought about the results in numerous different ways. Some ratings and comments were fully consistent with dichotomous thinking, whereas others were consistent with meta-analytic thinking. A researcher who reports even the simple and common pattern of results we presented should be aware that readers may interpret such a presentation in any of a wide range of ways.
Second, most researchers interpreted the vignette poorly. Respondents should have interpreted the two results as consistent and as, together, giving quite strong evidence of effectiveness. Figure 2 illustrates both those correct inferences. Mean ratings should have been around 6 or 7, but Figures 3 and 5 show they were around 3–4.5, near the middle of the scale. Only a small proportion of respondents gave both high Consistent scores and high Effective scores, as the most justifiable interpretation of the results – and meta-analytic thinking – would elicit. Few respondents seemed to think meta-analytically and thus see the two results as consistent, and together giving quite strong evidence of an effect.
Third, the four presentation formats made only small differences. We expected the CI formats, especially CI figure, would prompt better interpretation and less influence of dichotomous thinking, but there was only a small difference of 0.44 for the Consistent score in Experiment 1 in favor of CI over NHST formats. Interpretation by many researchers of CIs in terms of NHST is a likely contributor to the smallness of this difference. Moreover, a sizeable minority of respondents who saw NHST formats gave a Consistent score of 5 or more, indicating some level of agreement the two results were similar. Further study of their thinking may suggest how NHST can be interpreted well.
Fourth, overall results were similar for the three disciplines, so the different error bar and CI practices of the different disciplines seemed to have little influence. In particular, the presumably much greater experience of the MED respondents with CIs made little if any difference.
How Confidence Intervals are Interpreted
The above four conclusions were disappointing as well as somewhat surprising. Most respondents interpreted the simple pattern of results poorly, and our independent variables – presentation format and discipline – had little effect. CI formats did better than NHST, but only by a small amount (d = 0.25). Our next step was to seek insight into respondents’ thinking by examining the open-ended text responses in Experiment 1. We identified post hoc a striking and strong association between how respondents who saw CI formats interpreted the CIs, and their comments about whether the two studies conflicted or not. Results presented in a CI format included no reference to NHST, yet in fully 44% of cases the respondent invoked NHST, and was likely to see the results as conflicting. In stark contrast, as Figure 7 shows, if the respondent avoided reference to NHST they were very likely to see the results as consistent – a much more justifiable interpretation.
The finding that CIs are interpreted much better if NHST is not invoked appeared strongly in the text comments in Experiment 1. However it was post hoc. We therefore designed Experiment 2 to focus specifically on the CI figure format, and to seek open-ended text explanations for the ratings chosen by the respondent. Figure 8 shows that Experiment 2 strongly confirmed the association we identified in Experiment 1. When interpreting CIs, respondents did much better – gave much more justifiable ratings – if they avoided any reference to NHST and thought in terms of the intervals and the relation between the two intervals presented in the CI figure format.
We emphasize that our task asked respondents to interpret the two studies together, and all our discussion and conclusions relate to interpretation of the set of two results. Many of the respondents’ comments referred to one or other individual study, but all comments were made in response to our request for interpretation and ratings of the two results together. It was in the context of interpreting our two results, with p values of 0.02 and 0.22, that we found mentioning of NHST to be associated strongly with poor interpretation of CIs.
It is striking that respondents invoked NHST so frequently, even when they saw a figure comprising two intervals, and NHST was nowhere mentioned. It seems NHST and its dichotomous thinking are so deeply ingrained, at least for many researchers, that such a figure is not always sufficient to prevent NHST springing to mind. Alas, when it does intrude it is likely to prompt poor interpretation.
Implications for Statistical Reform
Our results suggest that statistical reform in relation to NHST and CIs may have to be a two-stage process. The first is to persuade, or require, researchers to report CIs wherever possible. This stage has often been the focus of reform efforts so far, but Byrd (2007) , Cumming et al. (2007) , and Cumming (2010) presented evidence that CIs are seldom reported in psychology and education journals. As Thompson (2002) noted, “researchers may not fully understand statistical methods that they (a) rarely read in the literature and (b) infrequently use in their own work” (p. 26). Therefore even this first stage requires further consistent effort, although an important recent advance is that the sixth edition of the American Psychological Association (APA) Publication Manual (APA, 2010 ) strongly recommends CIs and gives guidelines for reporting them.
Confidence intervals have been routinely reported in medical journals since the mid-1980s, yet our MED respondents did not perform notably better than BN and PSY respondents. Achieving the first stage of reform of routine use of CIs is thus unlikely to be sufficient. In addition researchers need to think of CIs as intervals, eschew NHST and, when considering more than one interval, think meta-analytically. Cumming and Finch (2005) explained four approaches to interpreting CIs, only one of which requires a null hypothesis or mentions p values. There is ample scope for CIs to inform interpretation without any thought of NHST. Especially valuable is meta-analytic thinking, which emphasizes the accumulation of evidence over multiple studies – a simple version of which we asked of our respondents.
Meta-analysis is rapidly becoming widely accepted and used, and this welcome development is encouraged by the greatly expanded attention given to meta-analysis in the sixth edition of the Manual (APA, 2010 ), compared with earlier editions. Familiarity with meta-analysis emphasizes the value of CIs and the near-irrelevance of NHST. Therefore it may be widespread acceptance of meta-analysis, rather than exhortation by reformers, that leads to a major swing of emphasis from NHST to CIs. However it is achieved, such a highly desirable reform could improve the efficiency and quality of research substantially. Our results define some of the challenges to be met, especially the need not only to use CIs, but to interpret them without recourse to NHST.
Conflict of Interest Statement
The authors declare that the research was conducted in the absence of any commercial or financial relationships that could be construed as a potential conflict of interest.
Acknowledgments
This research was supported by the Australian Research Council. The authors are very grateful to the respondents, and to Pav Kalinowski and Jerry Lai for valuable comments on drafts.
Footnote
References
American Psychological Association. (2010). Publication Manual of the American Psychological Association, 6th Edn. Washington, DC: American Psychological Association.
Belia, S., Fidler, F., Williams, J., and Cumming, G. (2005). Researchers misunderstand confidence intervals and standard error bars. Psychol. Methods 10, 389–396.
Cumming, G. (2010). “p values versus confidence intervals as warrants for conclusions that results will replicate,” in Research Methodologies for Conducting Research on Giftedness, eds B. Thompson and R. Subotnik (Washington, DC: APA Books), 53–69.
Cumming, G., and Fidler, F. (2009). Confidence intervals: better answers to better questions. Zeitschrift für Psychologie/J. Psychol. 217, 15–26.
Cumming, G., Fidler, F., Leonard, M., Kalinowski, P., Christiansen, A., Kleinig, A., and Wilson, S. (2007). Statistical reform in psychology: is anything changing? Psychol. Sci. 18, 230–232.
Cumming, G., and Finch, S. (2001). A primer on the understanding, use and calculation of confidence intervals that are based on central and noncentral distributions. Educ. Psychol. Meas. 61, 532–574.
Cumming, G., and Finch, S. (2005). Inference by eye: confidence intervals, and how to read pictures of data. Am. Psychol. 60, 170–180. Available at http://www.apastyle.org/manual/related/cumming-and-finch.pdf
Fidler, F., and Loftus, G. (2009). Why figures with error bars should replace p values: some conceptual arguments and empirical demonstrations. Zeitschrift für Psychologie/J. Psychol. 217, 27–37.
Gelman, A., and Stern, H. (2006). The difference between “significant” and “not significant” is not itself statistically significant. Am. Stat. 60, 328–331.
Haller, H., and Krauss, S. (2002). Misinterpretations of significance: a problem students share with their teachers? Methods Psychol. Res. 7, 1–20.
Kline, R. B. (2004). Beyond Significance Testing. Reforming Data Analysis Methods in Behavioral Research. Washington, DC: APA Books. Chapter 3 Available at http://www.apastyle.org/manual/related/kline-2004.pdf
Knapp, T. R., and Sawilowsky, S. S. (2001). Constructive criticisms of methodological and editorial practices. J. Exp. Educ. 70, 65–79.
Leventhal, L., and Huynh, C.-L. (1996). Directional decisions for two-tailed tests: power, error rates, and sample size. Psychol. Methods 1, 278–292.
Maxwell, S. E. (2004). The persistence of underpowered studies in psychological research: causes, consequences, and remedies. Psychol. Methods 9, 147–163.
Meehl, P. E. (1978). Theoretical risks and tabular asterisks: Sir Karl, Sir Ronald, and the slow progress of soft psychology. J. Consult. Clin. Psychol. 46, 806–834.
Oakes, M. W. (1986). Statistical Inference: A Commentary for the Social and Behavioural Sciences. Chichester, UK: Wiley.
Schmidt, F. L. (1996). Statistical significance testing and cumulative knowledge in psychology: implications for training of researchers. Psychol. Methods 1, 115–129.
Thompson, B. (1998). In praise of brilliance: where that praise really belongs. Am. Psychol. 52, 799–800.
Thompson, B. (2001). Significance, effect sizes, stepwise methods, and other issues: strong arguments move the field. J. Exp. Educat. 70, 80–93.
Thompson, B. (2002). What future quantitative social science research could look like: confidence intervals for effect sizes. Educat. Res. 31, 24–31.
Keywords: email survey, statistical inference, cognition, meta-analytic thinking, confidence intervals
Citation: Coulson M, Healey M, Fidler F and Cumming G (2010) Confidence intervals permit, but do not guarantee, better inference than statistical significance testing. Front. Psychology 1:26. doi: 10.3389/fpsyg.2010.00026
This article was submitted to Frontiers in Quantitative Psychology and Measurement, a specialty of Frontiers in Psychology.
Received: 16 March 2010;
Paper pending published: 18 April 2010;
Accepted: 09 June 2010;
Published online: 02 July 2010
Edited by:
Lisa Lix, University of Saskatchewan, CanadaReviewed by:
Ian Clara, University of Manitoba, CanadaBruce Thompson, Texas A&M University, USA
Copyright: © 2010 Coulson, Healey, Fidler and Cumming. This is an open-access article subject to an exclusive license agreement between the authors and the Frontiers Research Foundation, which permits unrestricted use, distribution, and reproduction in any medium, provided the original authors and source are credited.
*Correspondence: Geoff Cumming, Statistical Cognition Laboratory, School of Psychological Science, La Trobe University, VIC 3086, Australia. e-mail: g.cumming@latrobe.edu.au