
- Centre for Vision Research, York University, Toronto, ON, Canada
A great challenge to the field of visual neuroscience is to understand how faces are encoded and represented within the human brain. Here we show evidence from functional magnetic resonance imaging (fMRI) for spatially distributed processing of the whole face and its components in face-sensitive human visual cortex. We used multi-class linear pattern classifiers constructed with a leave-one-scan-out verification procedure to discriminate brain activation patterns elicited by whole faces, the internal features alone, and the external head outline alone. Furthermore, our results suggest that whole faces are represented disproportionately in the fusiform cortex (FFA) whereas the building blocks of faces are represented disproportionately in occipitotemporal cortex (OFA). Faces and face components may therefore be organized with functional clustering within both the FFA and OFA, but with specialization for face components in the OFA and the whole face in the FFA.
Introduction
The primate brain evolved within the context of a highly social environment wherein the ability to recognize kin, identify potential mates, and understand social cues from conspecific faces greatly influenced reproductive success and basic survival. Perhaps not surprisingly then, the primate visual system contains a specialized neural architecture to handle the myriad tasks involved in the perception and recognition of face stimuli (Kanwisher and Yovel, 2006 ; Pascalis and Kelly, 2009 ). Previous physiological studies suggest that face-sensitive regions in the monkey contain independent neural populations that are tuned to the internal features of the face, the shape of the head, or the whole face, i.e., the conjunction of the features and the head outline (Yamane et al., 1988 ; Kobatake and Tanaka, 1994 ). Given the many similarities between the monkey and human visual systems, we asked whether faces and the components of faces, namely the internal features and the outline of the head, are similarly represented in the human visual cortex.
Many neuroimaging studies in humans have investigated the brain areas involved in face perception. Particular attention has been paid to the middle fusiform gyrus in the temporal lobe (the fusiform face area, or FFA) (Kanwisher et al., 1997 ) and the inferior-occipital gyrus (the occipital face area, or OFA) (Gauthier et al., 2000 ; Haxby et al., 2000 ). There is a general consensus that these regions of interest are part of a “core” system primarily devoted to the visual analysis of facial stimuli (Haxby et al., 2000 ; Ishai, 2008 ; Rossion, 2008 ). Furthermore, these regions, and the FFA in particular, produce greater activation to stimuli that are arranged in the canonical face structure, i.e., individual elements in the upper visual field, contained within an oval or ellipse (Caldara et al., 2006 ; Caldara and Seghier, 2009 ; Liu et al., 2009 ). Several functional magnetic resonance imaging (fMRI) studies have revealed that these regions are sensitive to both whole faces and individual face components (Tong et al., 2000 ; Harris and Aguirre, 2008 ; Betts and Wilson, 2009 ; Liu et al., 2009 ). While fMRI adaptation results are consistent with separate neural populations that are selectively responsive to the whole face and the components of faces (Harris and Aguirre, 2008 ; Betts and Wilson, 2009 ), it is an indirect measure of the spatial distribution of the neural populations and does not allow for a direct comparison between the spatial distribution of different neural populations across brain areas.
Multi-voxel pattern analysis techniques (MVPA), which take into account spatial patterns of activation across all voxels of interest, have been successfully used to investigate the spatial distribution of fMRI responses to a variety of objects and simple stimuli across the entire brain as well as within specific regions of interest (Haynes and Rees, 2006 ; Norman et al., 2006 ). In the present series of experiments we used MVPA to directly test the hypothesis, suggested by previous fMRI adaptation studies (Harris and Aguirre, 2008 ; Betts and Wilson, 2009 ), that whole faces, facial features, and head outlines are represented in a spatially distributed manner within the functionally defined OFA and FFA regions. These regions were pre-selected for study because they have been extensively studied and are known to be part of the “core” face perception network (e.g., Haxby et al., 2000 ). Furthermore, we specifically compared the spatially distributed voxel activation patterns in the FFA and OFA to determine whether the MVPA analysis technique supports a functional distinction between these two regions during face processing, as suggested by previous neuroimaging studies (e.g., Liu et al., 2009 ).
Materials and Methods
Subjects
A total of 17 subjects (seven F; all right-handed; mean age = 26.54 years) were recruited from the Centre for Vision Research at York University in Toronto, Ontario, and from the general community in Hamilton, Ontario. All subjects had normal or corrected-to-normal vision. The experiments were conducted in accordance with the guidelines of the St. Joseph’s Healthcare Research Ethics Board and the York University Human Participants Review Committee. Subjects provided written informed consent and were remunerated $25/h for their time.
Stimuli and fMRI Experimental Design
Synthetic face stimuli were constructed from a database of 80 grayscale photographs (Wilson et al., 2002 ). In Experiment 1, we analyzed data from eight participants that were previously acquired in the context of a single-trial event-related fMRI adaptation study (Betts and Wilson, 2009 ). Whole faces, features, or outlines (Figure 1 A) were centrally presented for 5 s at the beginning of each trial. The average whole face was 10° tall and 7.5° wide. Observers performed a two-interval, forced choice task in response to an 8% change in stimulus size that occurred after 2.5 s. The activation within each voxel for these event-related trials was defined as the percent signal change from baseline averaged over 3.75 s, beginning 3.75 s after stimulus onset to compensate for the delay of the hemodynamic response function. Baseline was defined as the average activation of the 3.75 s prior to stimulus onset. Each stimulus type was randomly presented four times per scan in each of nine scans, for a total of 36 repetitions per condition. In Experiment 2 we presented blocks of synthetic face stimuli in which specific regions of the stimuli were scrambled in a grid-like fashion (Figure 1 B). Stimuli were created by independently scrambling the internal features and head outlines within squares of 16 and 24 pixels, respectively, which were constrained to lie within the locations occupied by the unscrambled contours. Stimuli for all categories had identical Fourier power spectra and contrast energy. Participants completed a 1-back face identity matching task. Stimulus blocks were 15 s in length and alternated with 15 s of a full field of mean luminance that contained a white fixation cross. The activation within each voxel for these blocks was defined as the percent signal change from baseline averaged over 11.25 s, beginning 6.25 s after stimulus onset. Baseline was defined as the average activation of the 3.75 s prior to stimulus onset. Subjects viewed three repetitions of four stimulus conditions in each of seven scans, for a total of 21 repetitions per condition. Experiment 3 used the same stimulus set as Experiment 1, but the faces were reduced to approximately 5° tall and were presented 3.75° in the periphery in one of four stimulus locations (Figure 1 C). The stimuli were blocked according to stimulus category (Whole Faces, Features, and Outlines) and position (Upper Left, Upper Right, Lower Left, and Lower Right quadrant). To maintain central fixation, subjects performed a 1-of-3 color discrimination task at the fovea during both stimulus and fixation blocks (15 s per block). Activation for each voxel was defined as the percent signal change from baseline averaged over 11.25 s, beginning 6.25 s after stimulus onset. Baseline activation was defined in the same manner as Experiments 1 and 2. The participants viewed one repetition of each stimulus/category combination per scan (12 stimulus blocks per scan) for five scans, which provided a total of 20 category and 15 position repetitions.
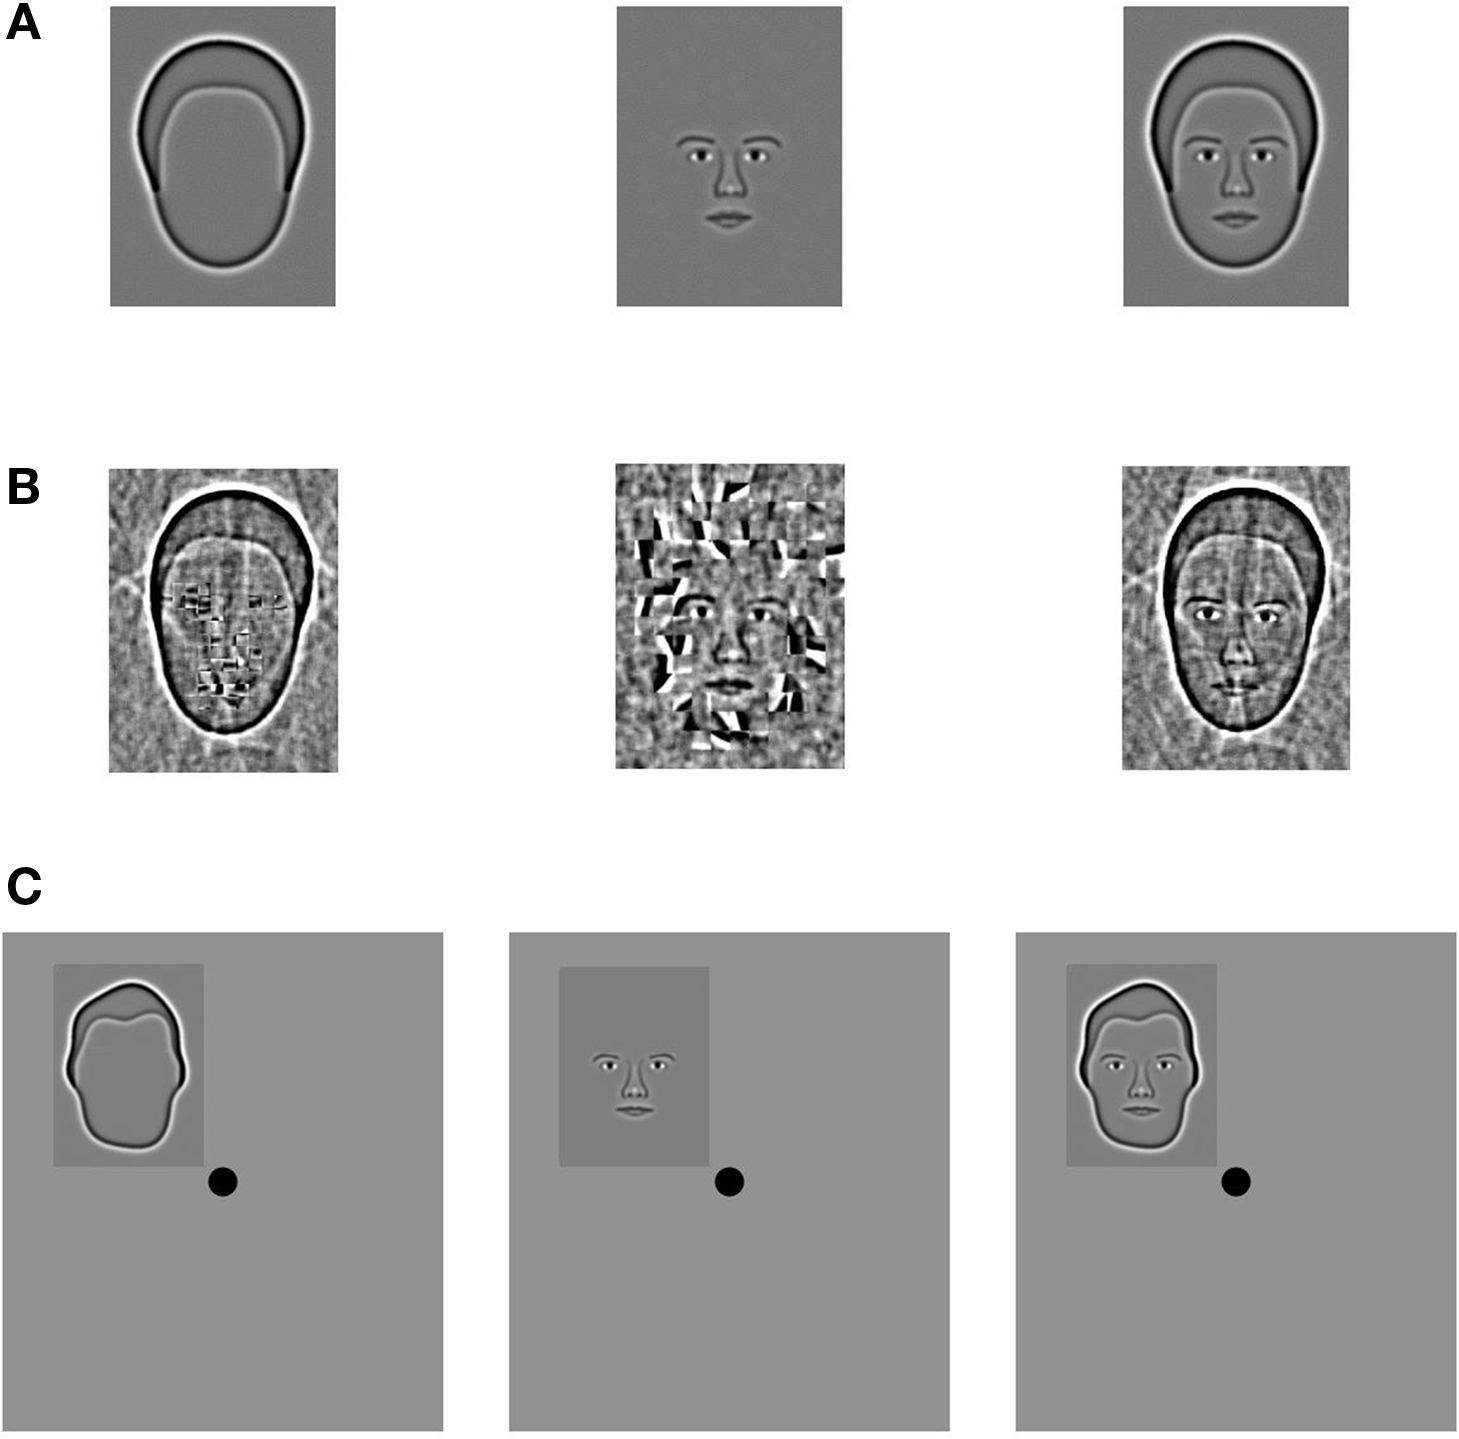
Figure 1. Stimuli from all three experiments. (A) In Experiment 1, synthetic face stimuli (Wilson et al., 2002 ) contained either the head shape (Outline condition), internal facial features (Features condition), or both the features and outline (Whole Face condition). (B) In Experiment 2 the stimuli were created by independently scrambling the internal features and head outlines within squares of 16 and 24 pixels, respectively, which were constrained to lie within the locations occupied by the unscrambled contours. Stimuli for all categories had identical Fourier power spectra and contrast energy. (C) The stimuli in Experiment 3 were constructed in an identical fashion as Experiment 1, but the images were reduced in size and assigned to one of four quadrants in the visual display.
fMRI Data Acquisition
Data were acquired from a research 3T short bore GE Excite-HD magnet equipped with a customized eight-channel head coil at the Imaging Research Centre, St. Joseph’s Hospital, Hamilton, Ontario, Canada. Functional 2D images (T2* weighted gradient echo (EPI), axial plane) consisted of 18–22 slices (4.0-mm thick) that extended from the top of the corpus callosum to the bottom of the temporal lobe (3.75 × 3.75 mm, 35 ms TE, 1250 ms TR, 90° FA, 24 cm FOV, interleaved acquisition, zero gap). Functional images were aligned to a high-resolution SPGR whole-brain anatomical scan (0.5 × 0.5 × 0.8 mm, FastIR prep, Zip512, T1 weighted, 12° FA, 24 cm FOV, 2.1 ms TE). The fMRI data were initially processed using Brain Voyager QX (v 1.10) and then analyzed in Matlab (v 7.4 R2007a).
Definition of Regions of Interest
Subjects participated in additional, independent functional scans that were designed to localize specific regions of interest. All subjects completed two runs of a Face-House localizer scan, which contained blocks of photographs of faces and houses (Loffler et al., 2005 ). Subjects were required to indicate whether pairs of faces (or houses) were matched in identity across frontal and 20° profile views. A general linear model (Brain Voyager QX, V. 1.10) was applied individually to each subject’s data in native, i.e., non-Talairach, brain space. The Bonferroni-corrected contrast between activation to Face and House blocks as well as anatomical markers were used to define the OFA and FFA regions of interest. A Talairach transformation applied to the native Brain Voyager coordinates confirmed that the identified regions of interest corresponded well to previously reported locations of face-selective visual cortex (Mean coordinates for 17 observers: OFALH (−37, −74, −9); OFARH (40, −71, −9); FFALH (−37, −50, −17); FFARH (39, −49, −15)). Fourteen subjects also participated in scans designed to localize early visual areas (i.e., rotation checkerboard wedges and expanding checkerboard rings) using the standard phase-lag analysis procedure (Sereno et al., 1994 ; Engel et al., 1997 ). The number of voxels in the identified ROIs for each subject are reported in Table 1 .
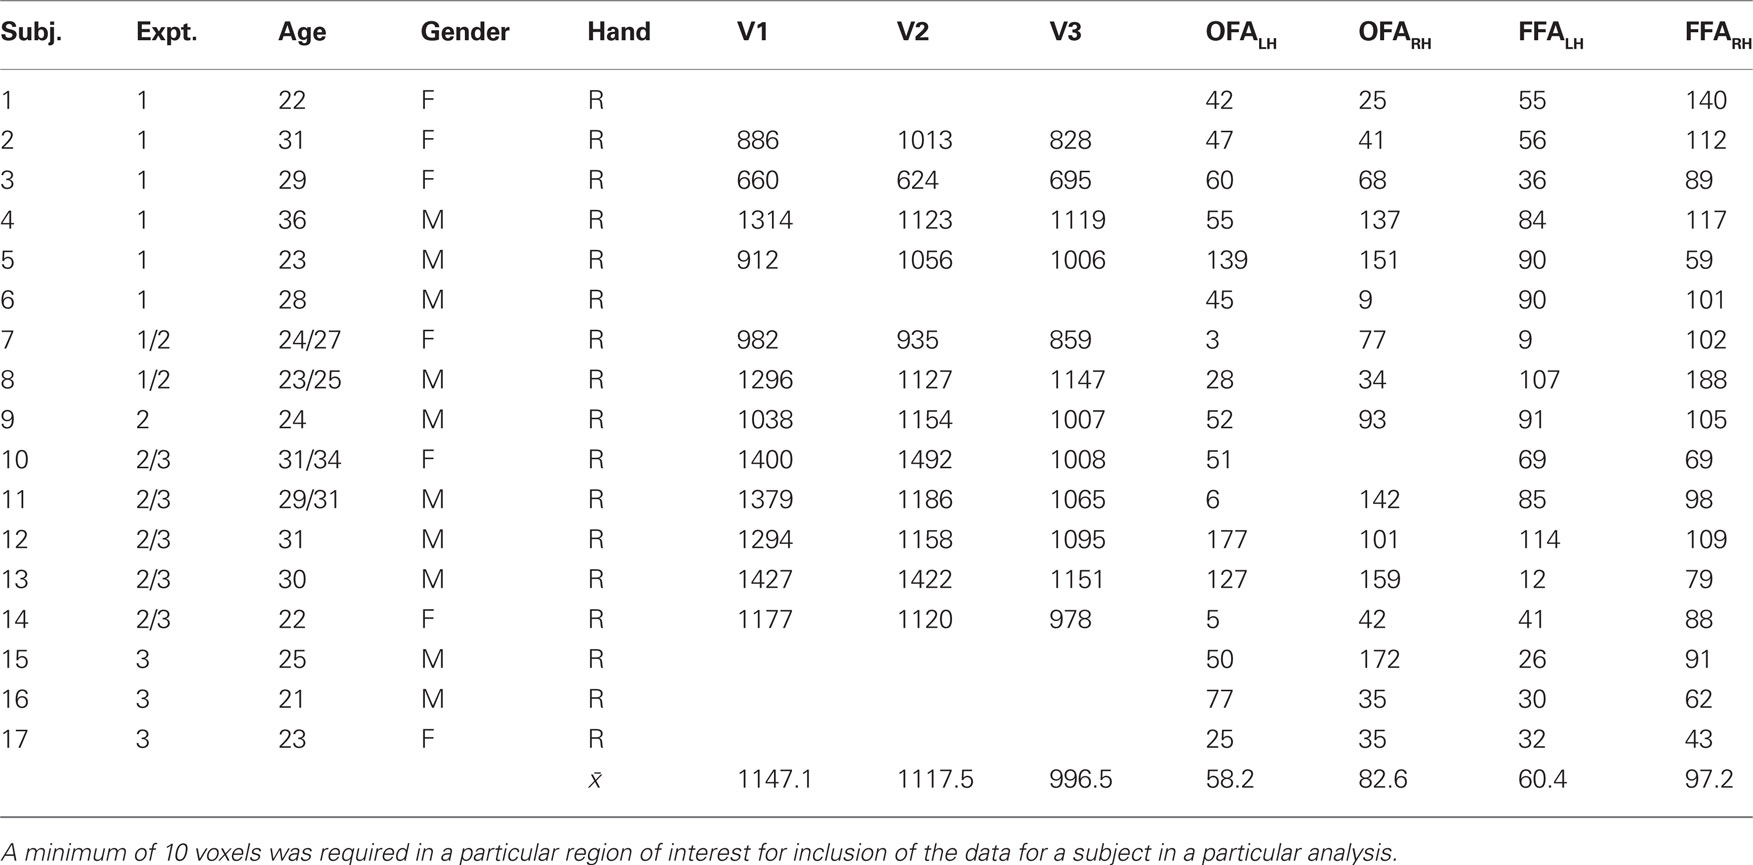
Table 1. Demographic information, including age, gender, and handedness for each subject, and the number of voxels in each of the different regions of interest.
Data Normalization
The data were normalized prior to the pattern classification analysis as follows. The signal for every sample, which was calculated from either a single event-related trial in Experiment 1 or a complete block of trials in Experiments 2 and 3, was converted to the percent signal change from baseline on a voxel-wise basis. The resulting values were then scaled such that the mean activation across the voxels for each sample was set to 0 and the variance was set to 1. In this way, any information due to mean activation differences between the different categories was removed, and only differences in the spatial pattern of activation could be used to classify the particular pattern of brain activation resulting from viewing a particular category. The effect of normalization is illustrated in Figure 2 . Figure 2 A shows the activation within each voxel to the three categories, rank ordered by the mean percent signal change after averaging across all categories. Note that the response to the Outline condition (red line) was consistently lower than to Whole Face or Features prior to normalization, which produced lower mean responses to the Outline stimuli than the other two conditions. Normalization eliminated the mean differences across conditions and centered the mean activation to zero for all categories (Figure 2 B).
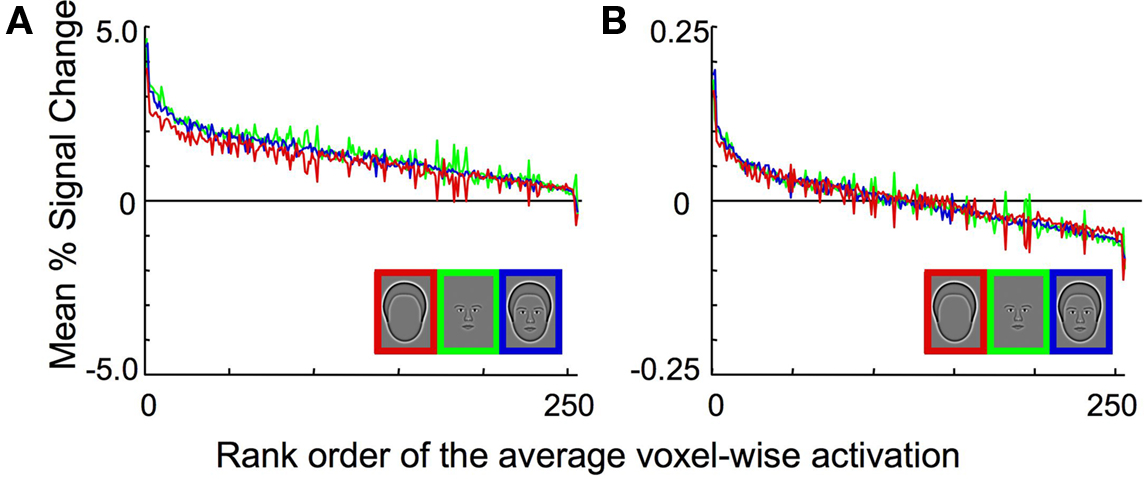
Figure 2. Experiment 1 average BOLD activation pre- and post-normalization in the combined OFA and FFA region of interest. (A) The activation within each voxel to the three categories, rank ordered based on the percent signal change after averaging across all categories on a voxel-by-voxel basis. Note that the response to the head outlines (red curve) is consistently lower than the response to the other two categories. (B) The activation within each voxel to the three categories, after normalization. Note that there are no longer differences in the mean level of activation across the three stimulus categories. However, differences in the pattern of activation across categories may still remain, which could provide the information necessary for reliable pattern classification.
Normalization of each sample prior to pattern classification analysis was done primarily to remove differences in mean activation levels across categories, in order to explicitly test whether the different categories of face-relevant stimuli resulted in distinct spatial patterns of activation. It should be noted that differences in mean activation levels that could arise from attentional factors were therefore also controlled by the normalization procedure (Wojciulik et al., 1998 ). However, as a technical aside, non-uniform differences in mean activation levels across voxels (such as with a family of Gaussian distributions, where some voxels have consistently higher activation than others; Figure 3 B) could cause discriminable patterns of activation following normalization. Despite identical underlying patterns of activation, responses to the three stimulus categories could be discriminated solely on the basis of additive and/or multiplicative scaling factors. Therefore, an alternative, albeit more complicated, method of normalization was also used to verify the results. The alternative method entailed subtracting the mean and dividing through by the root mean square of the response across voxels, either on an individual sample basis or on the mean pattern of activation of each category (Figure 3 ). For the actual data (Figure 3 A) classification of the category was above chance before normalization, and stayed above chance after both types of normalization (average percent correct, PC, is reported averaged across categories and subjects). Simulated data (Figure 3 B) included additive and multiplicative scaling of a single Gaussian spatial pattern of activation. Following independent normalization of each individual sample, classification was possible because of residual differences in the variance across samples. However, when normalization was done on the mean response pattern of each category, averaged across samples, with the same scaling then applied to each sample of a particular category, classification of the category was no longer possible (chance = 33%). This indicates that the additional normalization procedure successfully removed differences in patterns of activation that were due simply to additive and multiplicative scaling. Therefore, the successful classification of the category in the real data, which was found for both types of normalization, can be taken as true differences in the patterns of activation, irrespective of differences in mean response amplitude. Comparable levels of classification for the experimental data were obtained using the initial and alternative normalization procedures. The description of the procedures and the results are therefore based on the simpler, more straight forward initial normalization procedure described in Figure 2 .
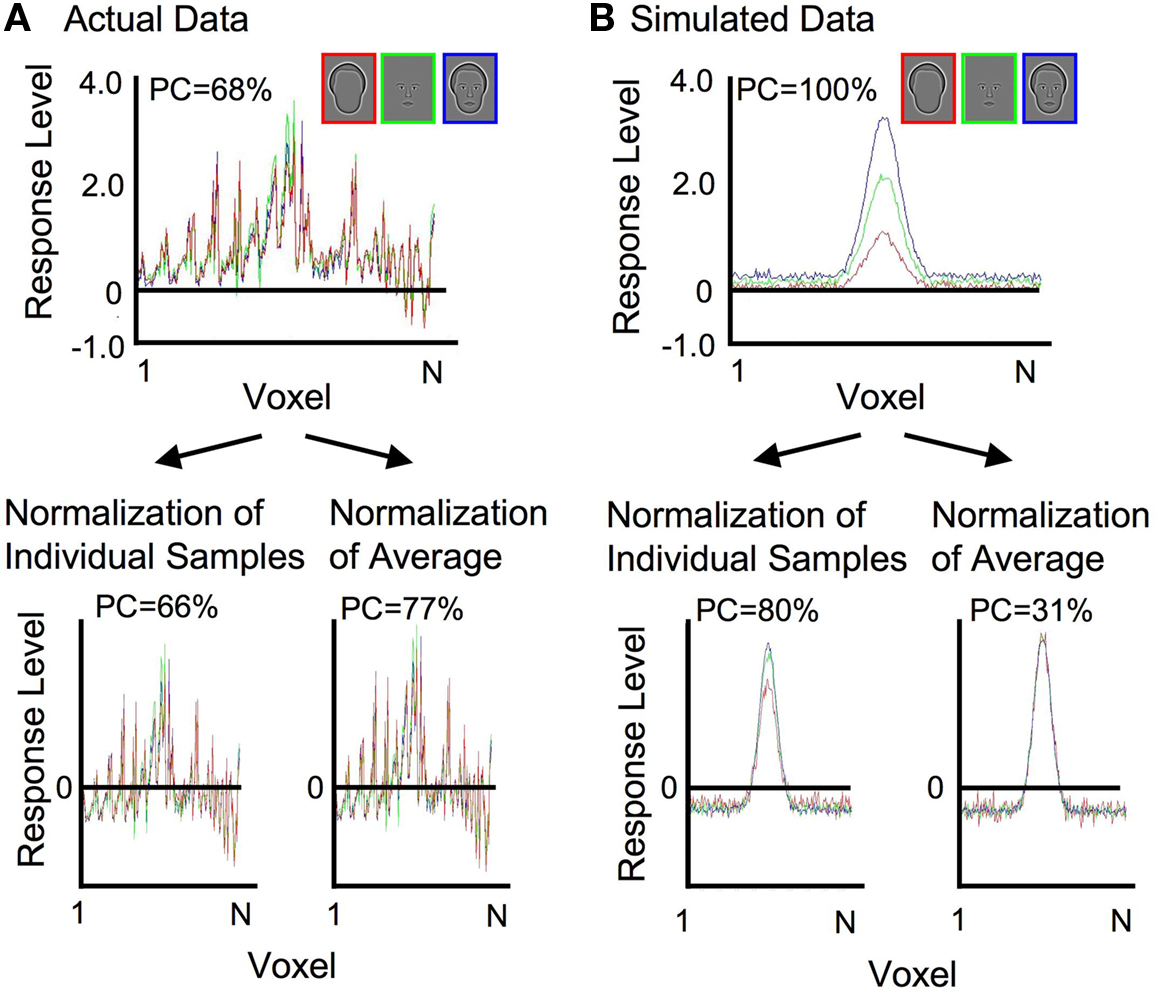
Figure 3. Demonstration of the effects of alternative normalization procedures on actual and simulated data. (A) Actual data from an individual subject is shown before normalization and following each of two different normalization procedures. Classification performance (PC = percent correct) remained high for both types of normalization. (B) The simulated data incorporated additive and multiplicative scaling of a single Gaussian spatial pattern of activation. Classification performance was preserved when normalization was conducted on each individual sample. Classification fell to chance levels when normalization was conducted on the mean response pattern of each category.
Construction of the Multi-Class Linear Classifier
A linear, multi-class SVM classifier was established using the leave-one-scan-out procedure detailed in Kamitani and Tong (2005) using custom-built Matlab code combined with freely distributed support vector machine (SVM) functions from Canu et al. (2005) . The specific procedure will be detailed utilizing an example from Experiment 1, though it was the same for all experiments. First, the samples from one entire scan (i.e., 12 samples consisting of four repetitions of each of the three conditions) were removed from the data set. The remaining samples were designated as training samples. Second, pair-wise classifiers were built by establishing the discriminatory information between two specified categories (Figure 4 A1), using all training samples of a particular pair of categories as input to the SVM. The SVM returned a set of weights, one for each voxel, and a bias, which together determined a decision boundary for the two stimulus categories. Positive outputs represented one stimulus category and negative outputs represented the other. The weights for each pair were then normalized to have a length of one (µ = 0, σ = 1). The divisive scaling of the normalization weights was also applied to the bias. Third, a multi-class linear classifier was established by summing together the weights and biases of the relevant pair-wise classifiers, with proper inversion of the sign of the weights based on whether the category was represented by a positive or negative response in the output of the pair-wise classifier (Figure 4 A2). Thus, each category had a single set of weights and a bias which together represented the multi-class linear classifier for each category for that particular set of training samples.
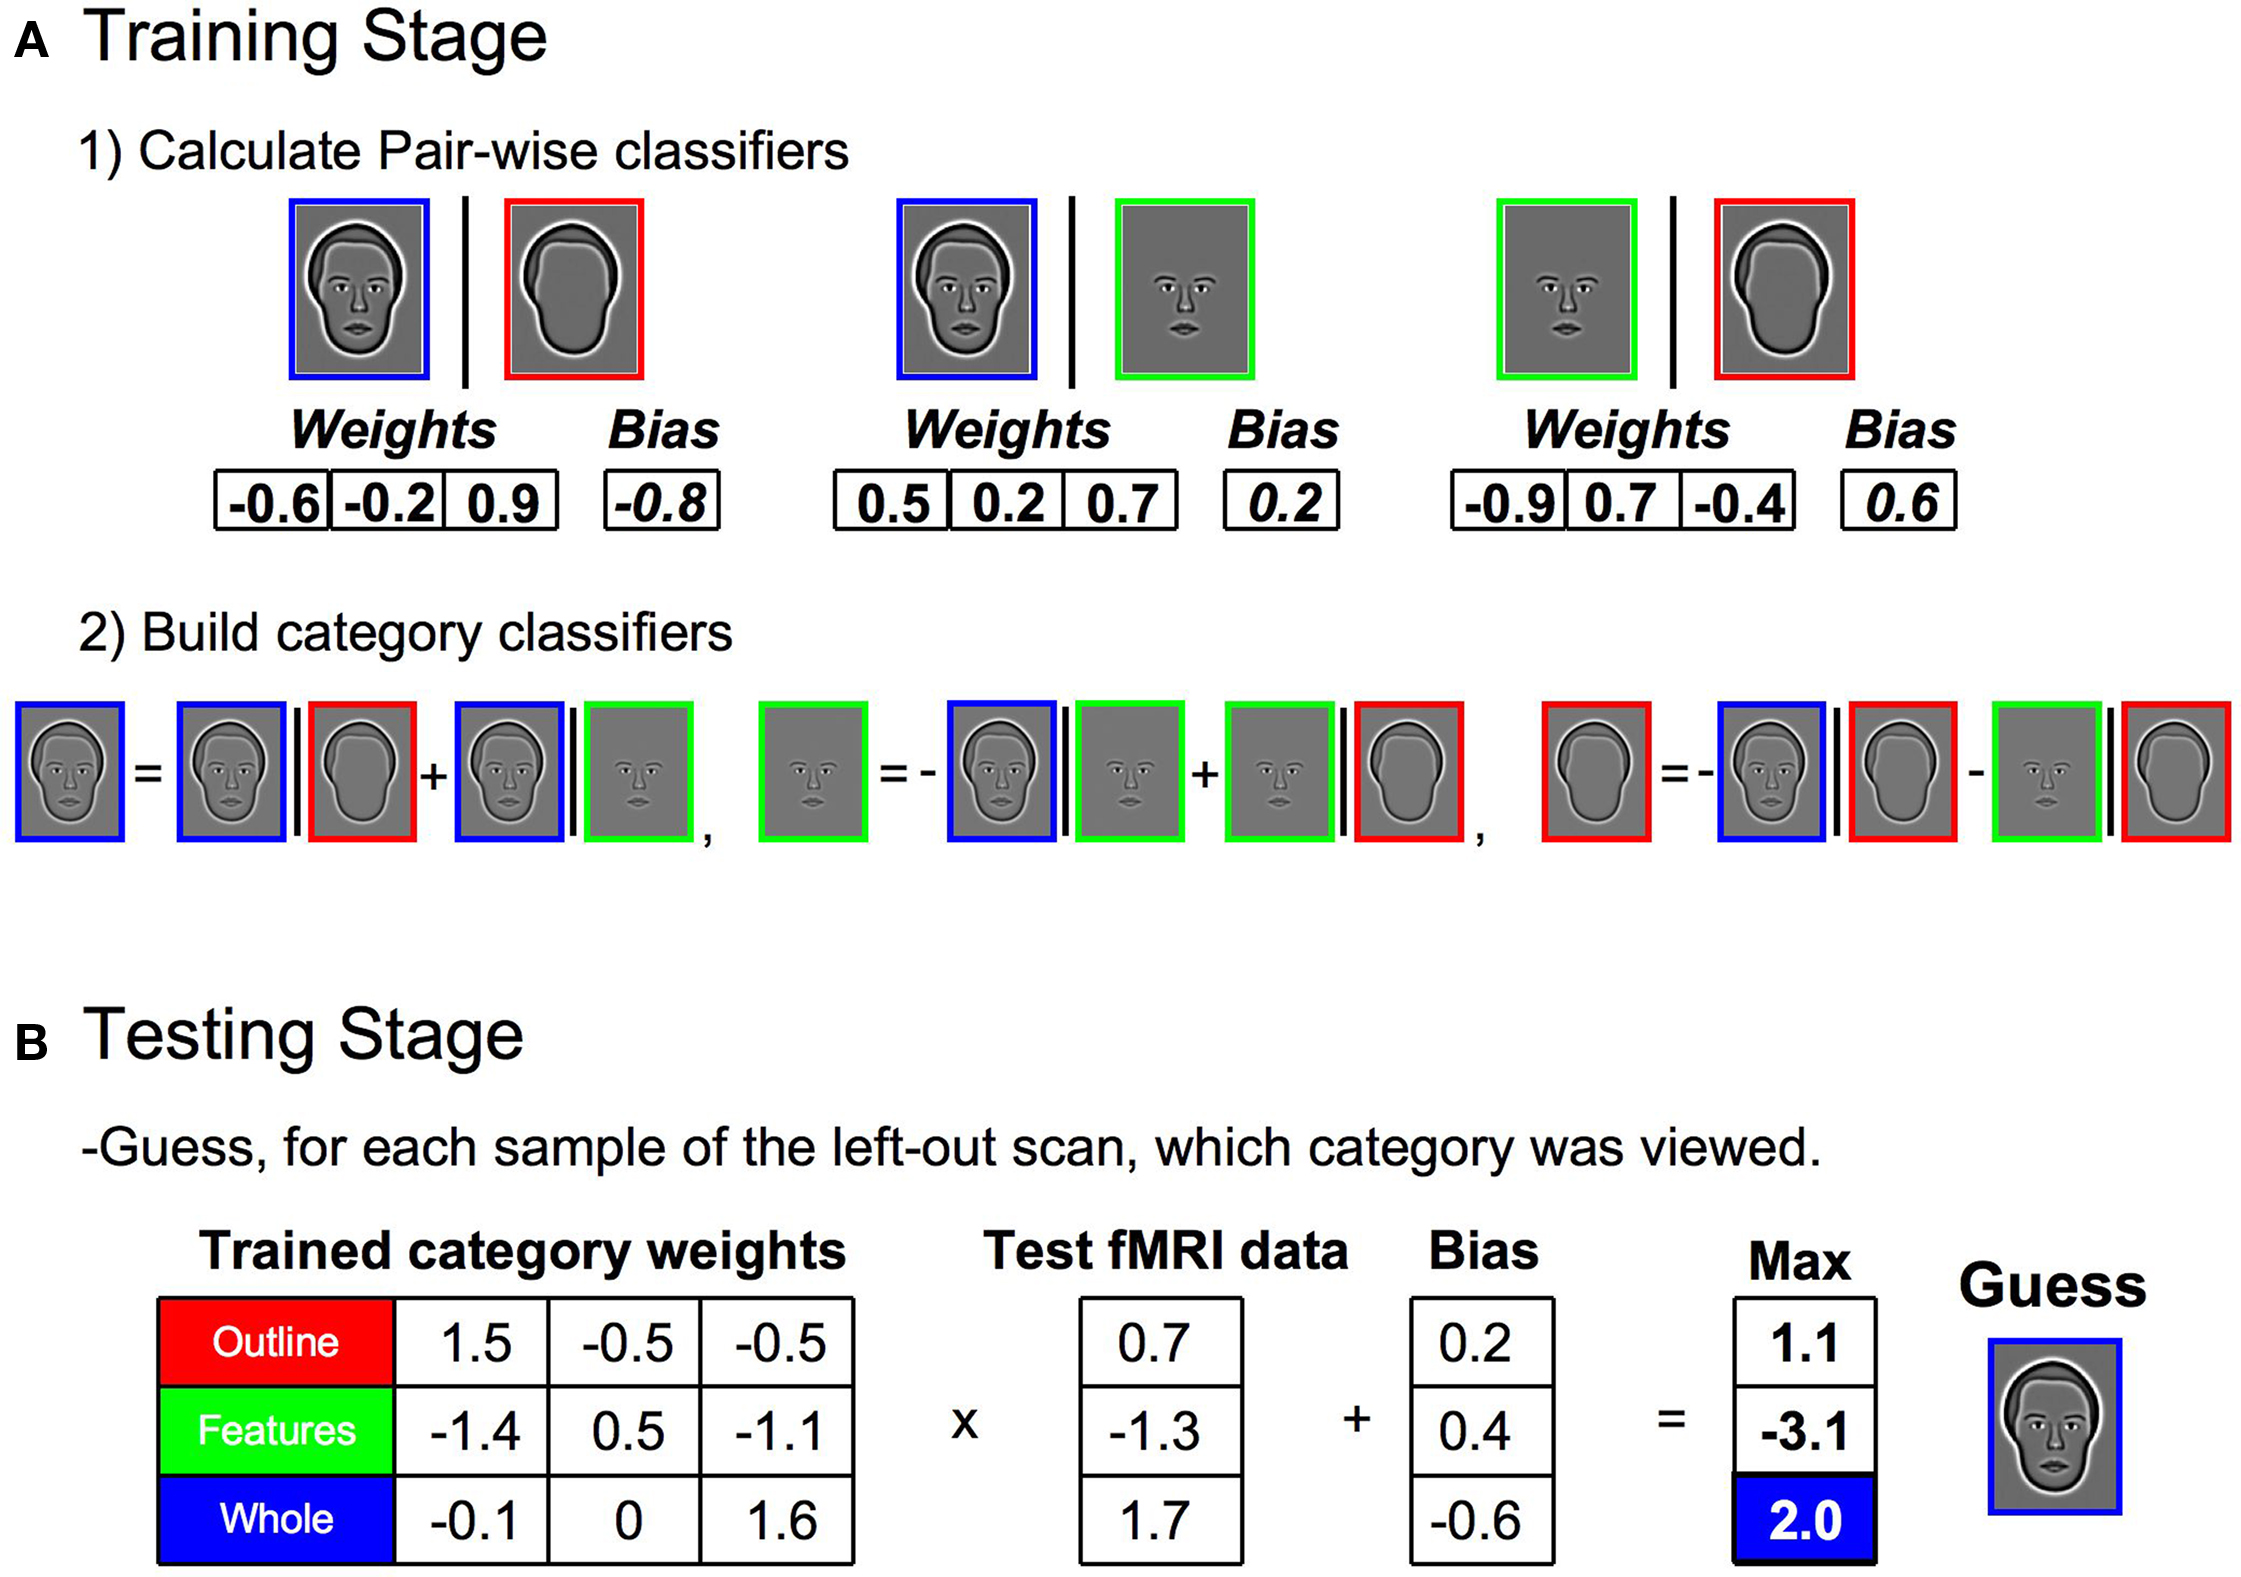
Figure 4. Steps in building the multi-class classifier for stimulus category and assessing classification accuracy. (A) During the training stage, samples from all but one scan of the data set were used (1) Pair-wise classifiers were built by inputting all training samples of a particular pair of categories into a SVM. The SVM returned a set of weights (one for each voxel) and a bias, which together determined a decision boundary for the two stimulus categories. (2) A single classifier was established for each stimulus category by summing together the weights and biases of the relevant pair-wise classifiers, with proper inversion of the sign of the weights. The three category classifiers together comprised the multi-class classifier. (B) During the testing stage, the samples from the left-out scan were independently classified through a matrix multiplication of the trained classifier weights and the sample response vector. The resulting product was adjusted by the biases and the maximum response was taken as the guess for the category to which a particular sample belonged. The entire process (A, B) was then repeated, leaving out a different scan each time, until all samples were part of a test set exactly once.
The performance of the multi-class linear classifiers was tested using the samples that were originally removed from the data set (the 12 test trials from one entire scan) (Figure 4 B). Each sample was classified through a matrix multiplication of the trained multi-class classifier weights and the vector of voxel responses. The resulting product for each sample was adjusted by the bias. The maximum positive response was taken as the guess for the category to which that particular sample belonged. The accuracy of the guess was recorded for each sample. The entire process was then repeated, i.e., a different scan was left out, a new multi-class linear classifier was created on the remaining data, and the accuracy of the classifier responses to the test trials were recorded, until all samples were part of a test set exactly once. The proportion of correctly classified samples was determined for each individual subject, and the average proportion correct across subjects was used to establish statistical significance in relation to chance.
Calculation of Voxel Distributions
Significant pattern classification provides evidence regarding the presence of consistent patterns in activation, but reveals little about the nature of those patterns. By examining the individual voxel weights of the classifiers, information can potentially be garnered about the spatial distribution of the patterns in different cortical regions of interest. The individual voxel weights from the SVM analysis reflect the relative contribution of each voxel to the discriminatory information between two or more categories, as opposed to the most representative information of a particular category that could be garnered through other multivariate analyses, such as principal component analysis. Although it is possible that classification using SVM is based on a small, idiosyncratic subset of voxels for each subject, consistent patterns in the relative distribution of the weight vectors would indicate systematic differential responses to whole faces and face components within face-selective ROIs.
Multiple steps were necessary to assess the distribution of classifier weights within a region of interest, though each was simple and straightforward (Figure 5 ). First, the normalized fMRI data were averaged across all samples and categories on a voxel-wise basis (Figure 5 A), and the resulting signs of the voxels recorded (Figure 5 B). The sign of a particular voxel therefore indicates whether the fMRI signal was greater (i.e., positive) or less (i.e., negative) than the mean response of all voxels. Next, the multi-class linear classifiers for each training set were averaged to determine the mean weights for each category (Figure 5 C). This was done because the trained weights varied slightly between training sets, though they were highly similar due to the large number of shared samples between sets. Furthermore, the trained weights were separately normalized for each category to remove differences in the variance, to ensure that only the relative magnitude of the weight for a particular voxel in contributing to the overall category classifier was compared across categories. The mean classifier weights were then multiplied by the signs of the normalized fMRI data so that positive weighted responses represented evidence for a particular category, and negative weighted responses represented evidence against a particular category (Figure 5 D). Lastly, each voxel was assigned to the category to which it contributed the most positively (Figure 5 E), and the distribution of categories across the voxels was determined for each individual subject (Figure 5 F).
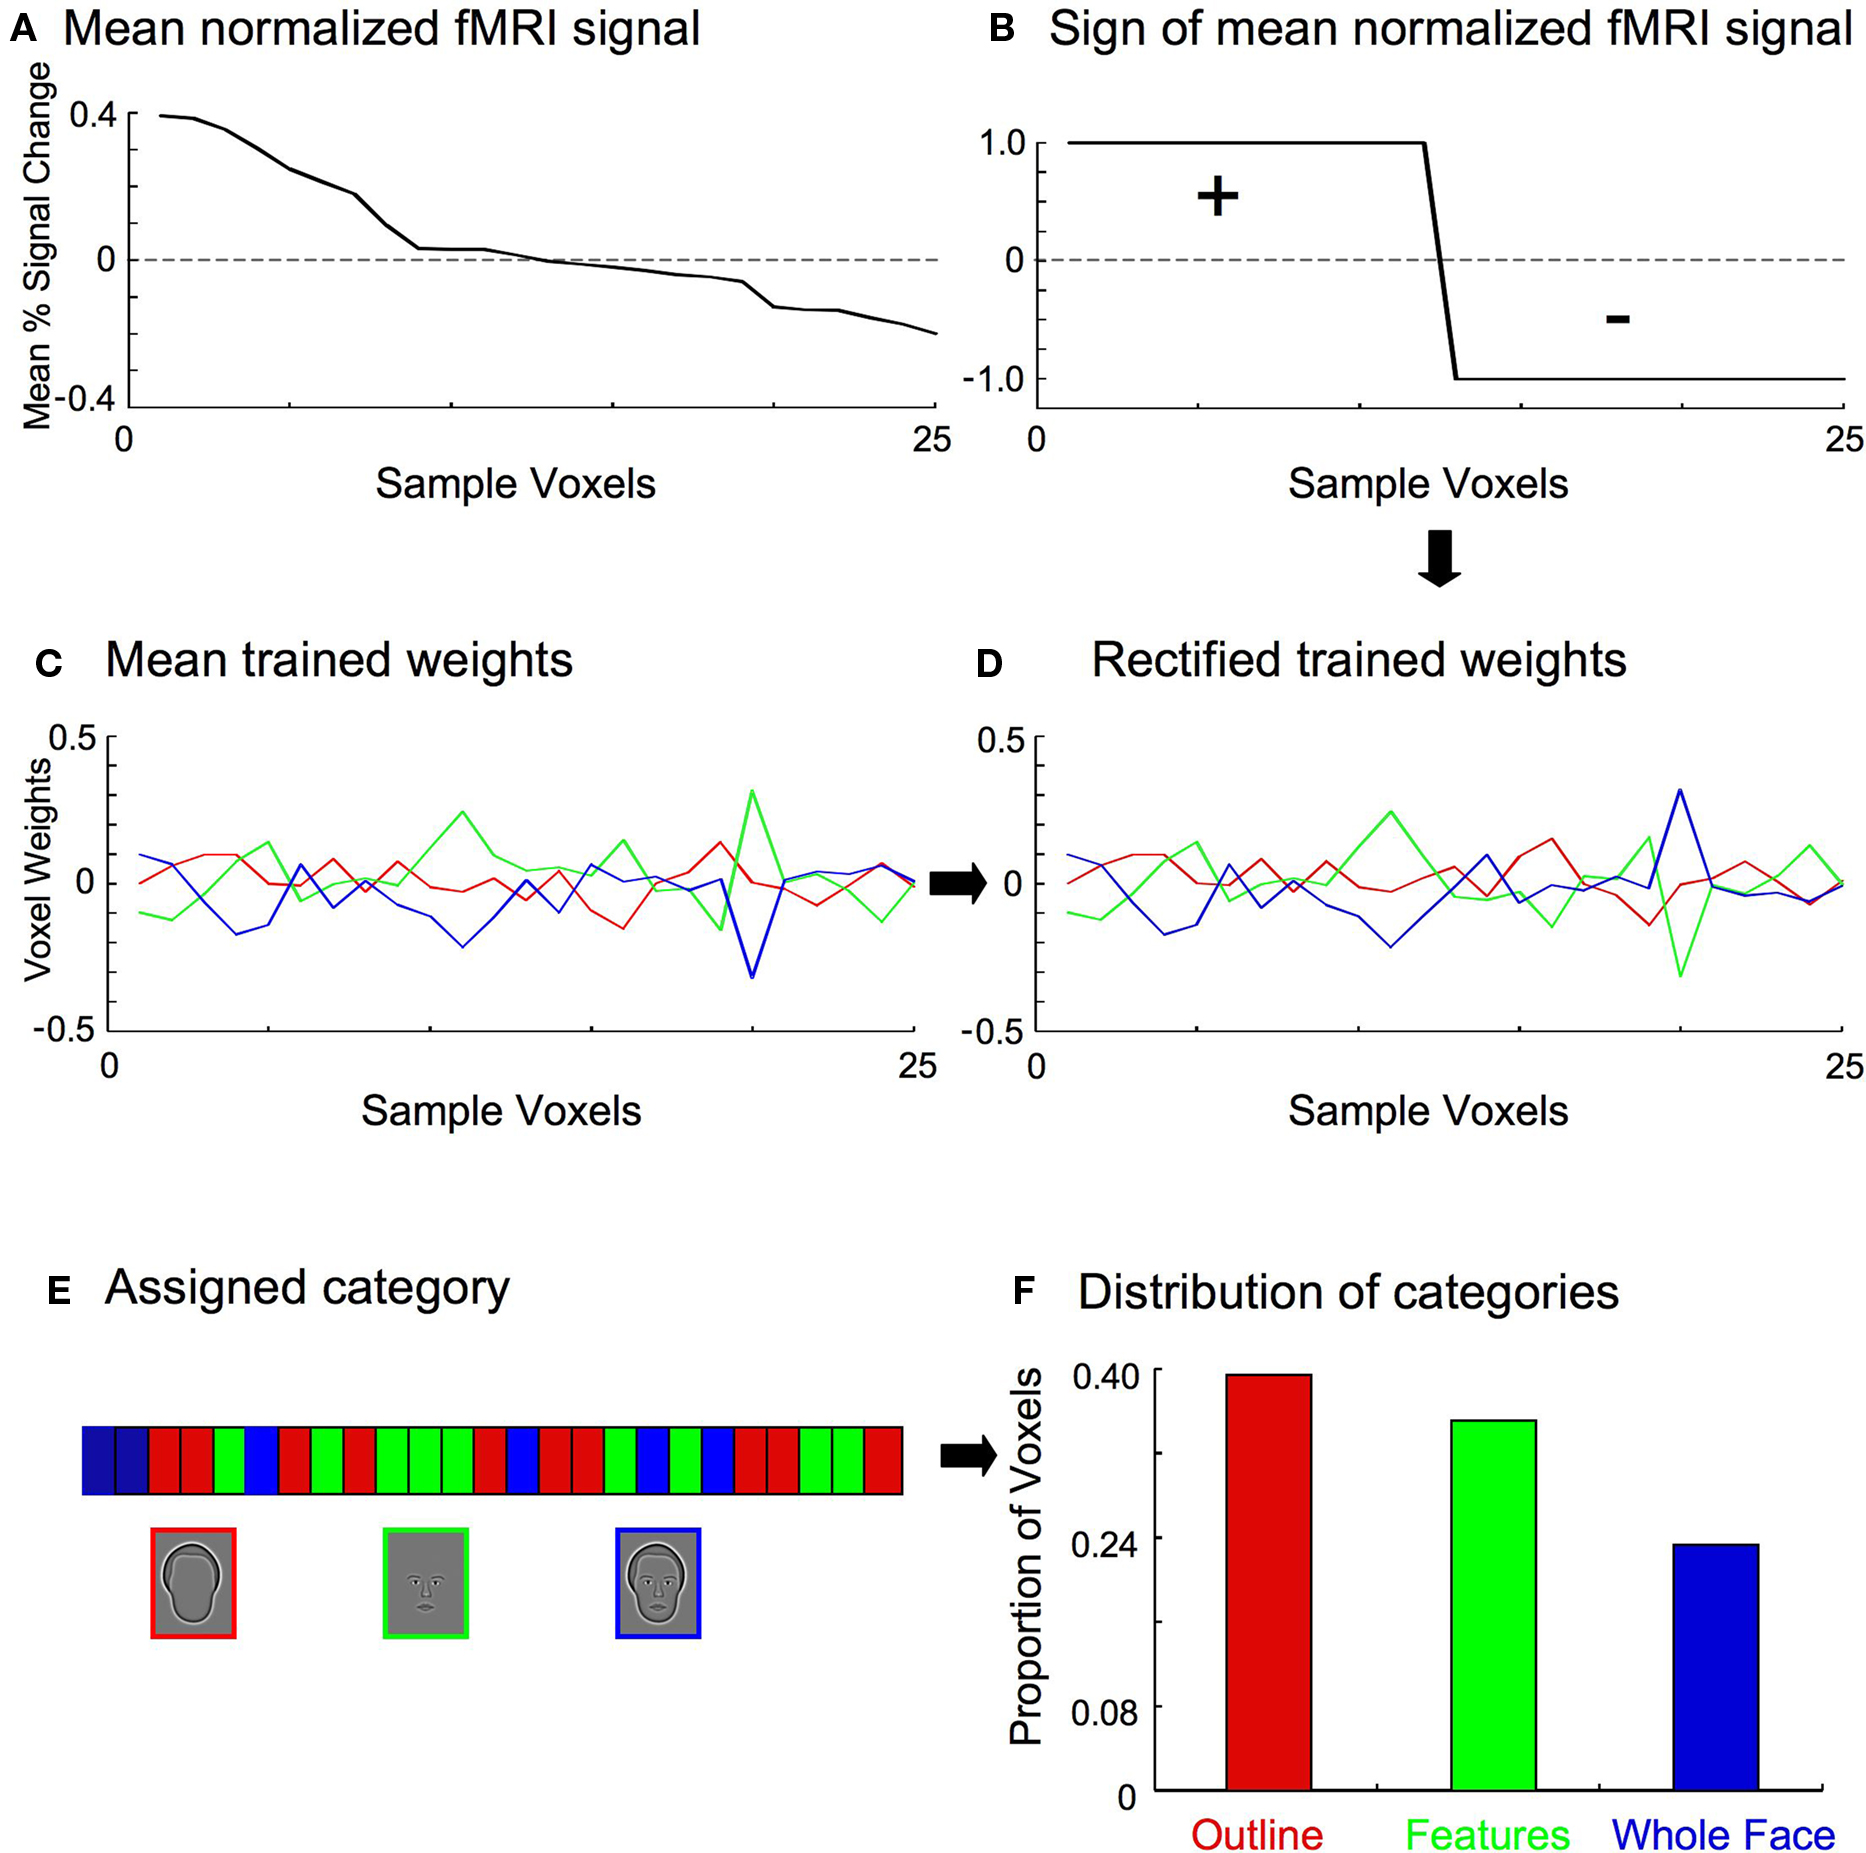
Figure 5. Stages in determining the category to which a particular voxel contributed most positively. For clarity, a small set of 25 example voxels is shown here. (A) The fMRI responses (percent signal change from baseline) for the 25 voxels were averaged across all training samples and categories. (B) The sign of the mean fMRI activation was recorded for each voxel. (C) The multi-class classifiers from all training sets (see Figure 4 ) were averaged to determine the mean weights for each category, indicating the relative contribution of each voxel to the discriminatory information for a particular category classifier. (D) The mean classifier weights were multiplied by the sign of the normalized fMRI data (B) on a voxel-by-voxel basis, so that positive weighted responses represented evidence for a particular category, and negative weighted responses represented evidence against a particular category. For the set of 25 example voxels shown here, the sign of the weights for voxels 13–25 are therefore flipped. (E) Each voxel was then assigned to the category to which it contributed the most positively. (F) The proportion of voxels in each category was tallied.
As noted above, the SVM weights indicate the relative contribution to the discriminatory information for one category against the other categories. A biased distribution of voxels contributing to one classifier more than another across ROIs would therefore indicate that the ROIs are involved differentially in processing a particular stimulus category. The SVM procedure picks up on correlated changes in activation across voxels when a stimulus is presented, but changes in activation that are consistent for all categories of stimuli will tend to be discounted in favor of differential changes in activation. That is, it is the changes that are indicative of the processing of a particular category which are assigned positive weighting. Therefore, ROIs with a large proportion of voxels positively weighted for a particular category can be interpreted as being disproportionately more involved in the processing of that category.
Results
Experiment 1
Differential activation patterns to whole faces and face parts
To investigate the representation of faces and face parts in the human visual cortex, we used fMRI to measure brain activation within the FFA and OFA regions of interest to synthetic face stimuli comprised of whole faces, the internal facial features, and the head outlines (Figure 1 A) (Wilson et al., 2002 ; Betts and Wilson, 2009 ). Normalization of the response across voxels ensured that classification was based on differences in the spatial pattern of the response across voxels rather than differences in mean overall response to the three stimulus categories (Figure 2 ). A linear, multi-class SVM classifier was created for each region of interest using the leave-one-scan-out procedure (FKamitani and Tong, 2005 ; igure 4). The classification accuracy for the spatial patterns within these areas was assessed separately for each participant, and statistics were performed on the average proportion correct across participants (Figure 6 A). Classification for all stimulus categories was significantly above chance (33% correct) in the OFA and FFA regions in both hemispheres. For example, in the left hemisphere OFA, outlines were distinguished from features and whole faces on 65% of trials (t(7) = 5.24, p < 0.01), features were distinguished from whole faces and outlines on 55% of trials (t(7) = 3.64, p < 0.01), and whole faces were distinguished from features and outlines on 61% of trials (t(7) = 4.54, p < 0.01). Classification performance, averaged across category and hemisphere, did not significantly differ between the OFA (64%) and the FFA (61%) regions (t(7) = 0.59, p > 0.55), indicating that similar levels of discriminatory information for the facial categories were present in both regions.
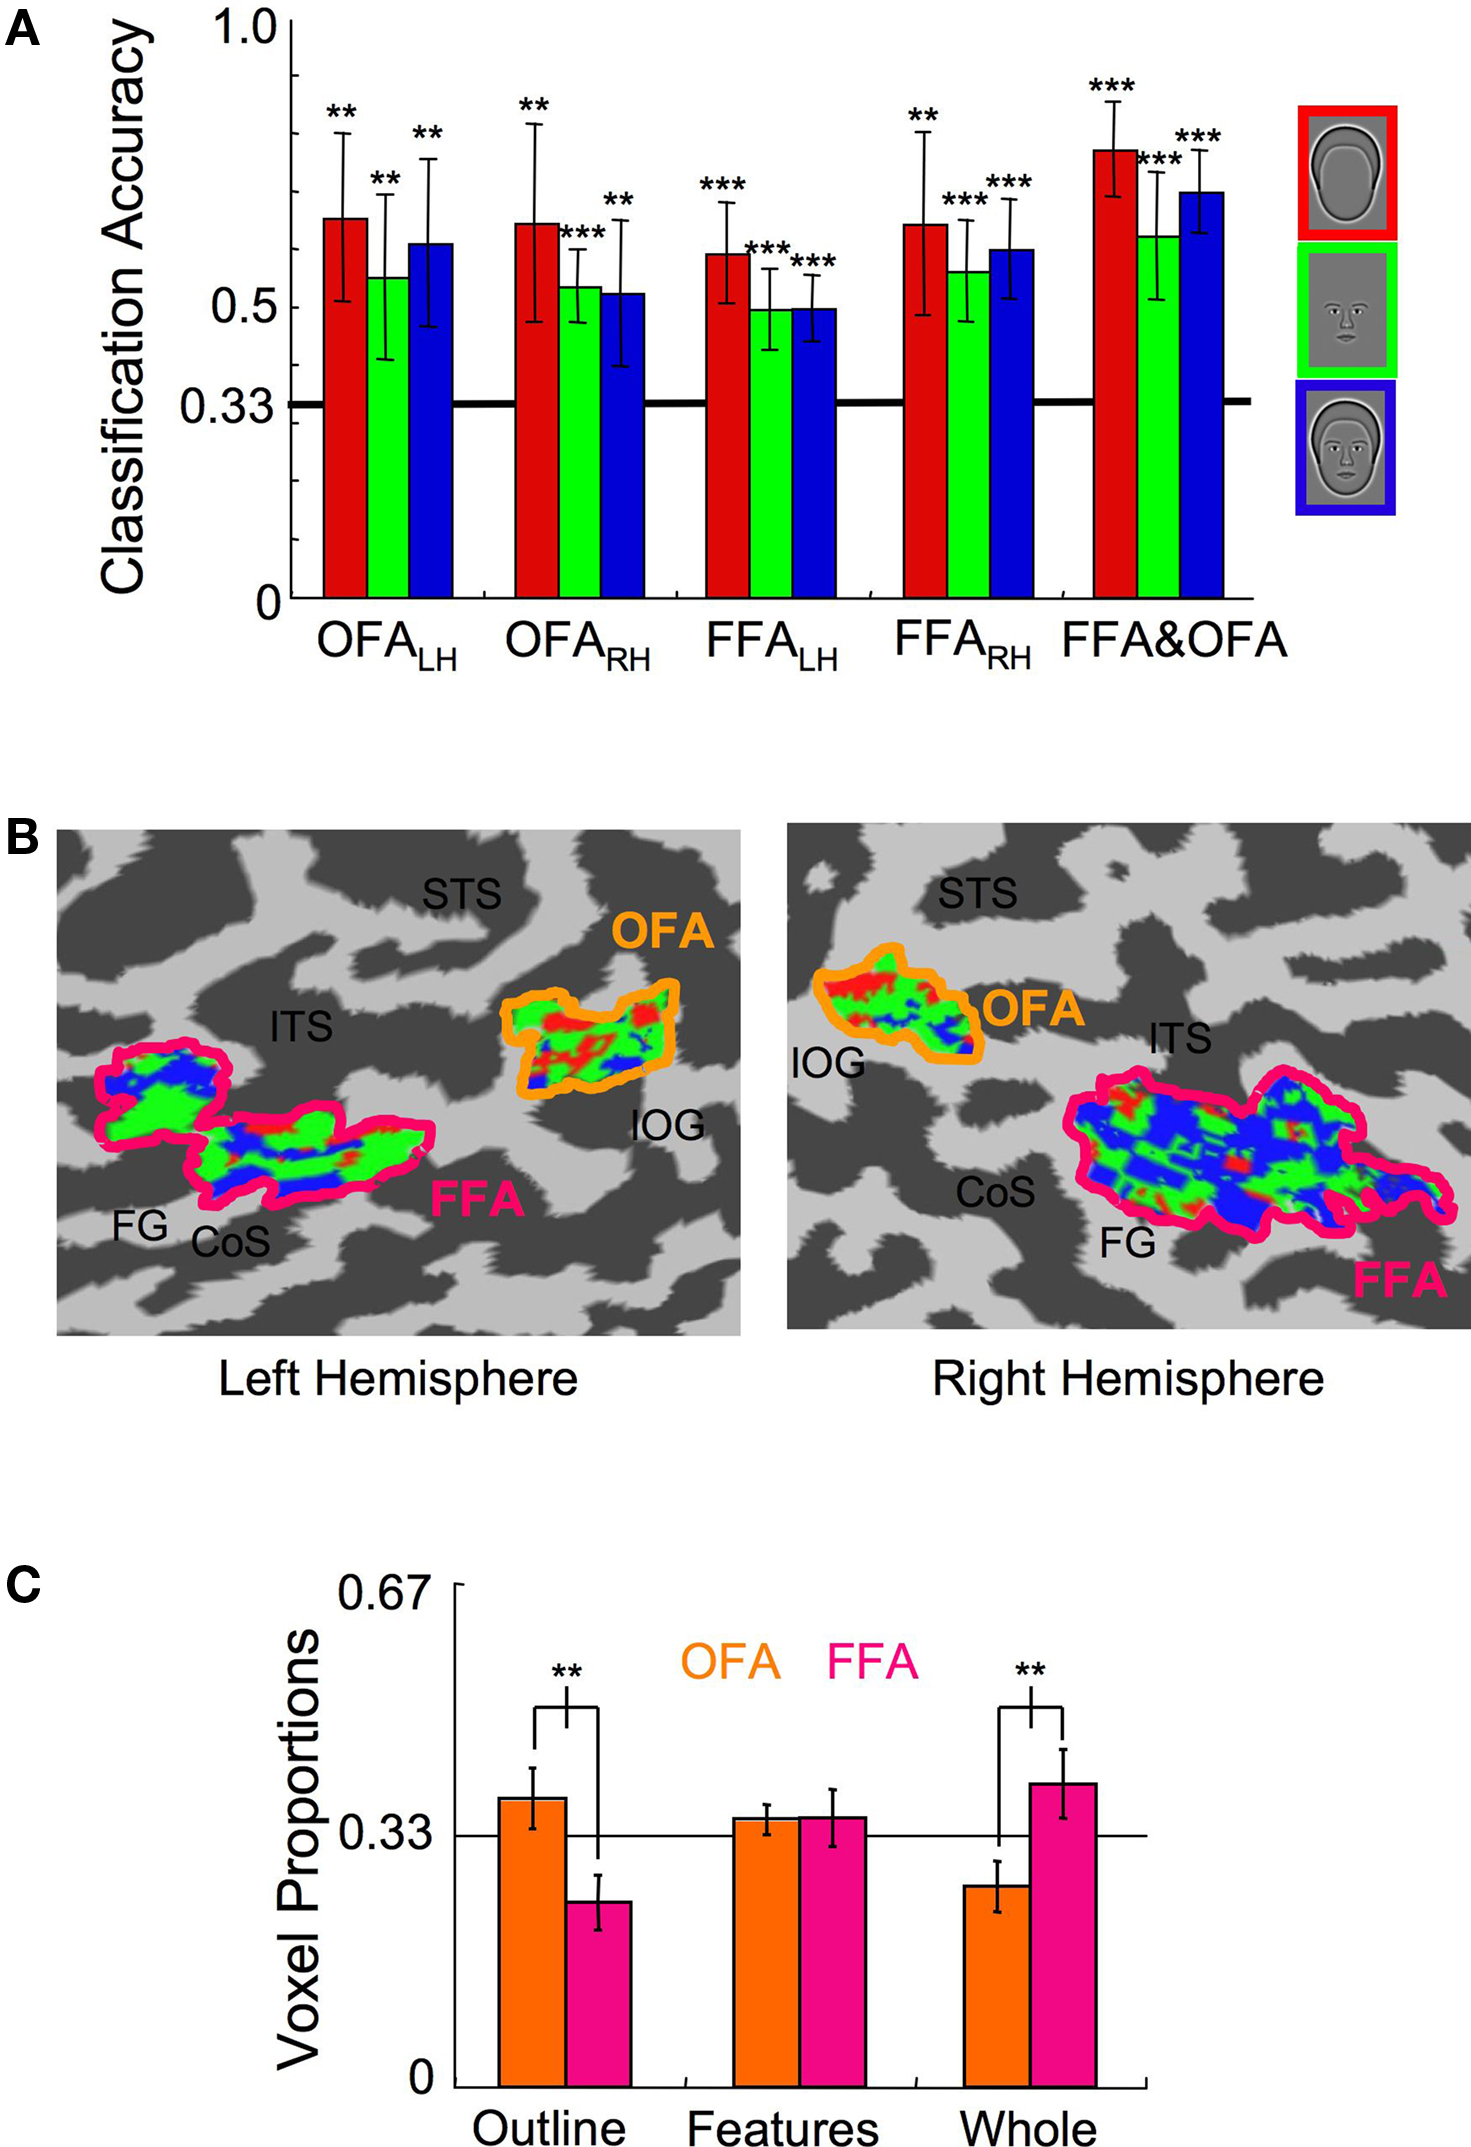
Figure 6. Experiment 1 results. (A) The multi-class SVM analysis within specific ROIs indicates that classification of each stimulus category was significantly above chance in both hemispheres of the OFA and FFA (error bars, 95% c.i.). (B) The color-coded distributions of voxels according to the stimulus category to which they maximally contributed are shown here on the flat map of face-sensitive cortex from a representative subject. Anatomical labels are as follows: superior temporal sulcus (STS), inferotemporal sulcus (ITS), inferior-occipital gyrus (IOG), collateral sulcus (CoS), fusiform gyrus (FG). (C) The relative proportion of voxels that maximally contributed to the three stimulus categories within the OFA and the FFA (error bars, 95% c.i.). Asterisks indicate the level of significance for independent t-tests in (A) and paired t-tests in (C) (*p < 0.05, **p < 0.01, ***p < 0.001).
The significant classification shown in Figure 6 A demonstrates that the differential patterns of activation were reliable, even after normalization removed the differences in the mean amplitude response. These results support the conclusions of previous fMRI adaptation studies that suggest whole faces and face parts are represented by different populations of neurons within face-selective visual cortex (Harris and Aguirre, 2008 ; Betts and Wilson, 2009 ), but demonstrate it in a much more direct manner.
Distribution of Voxels in the OFA and FFA
Significant classification indicates spatially distributed neural populations responsive to whole faces, internal facial features, and head outlines in both the OFA and FFA. We also asked whether the output of the linear pattern classifiers could reveal any differences in the way the OFA and FFA process the three categories of facial stimuli. First, a single SVM classifier for each of the three categories was constructed after combining all of the voxels in the left and right hemisphere OFA and FFA regions. Classification for all stimulus categories was marginally improved, with 73%, 60%, and 69% accuracy for outlines, features, and whole faces (t(7) > 6.0, p < 0.001 in all categories; Figure 6 A, rightmost bars). Each voxel was then labeled according to the category to which it contributed the strongest supportive weighting (Kamitani and Tong, 2005 ) (Figure 6 B; see also Figure 5 ). Next, the relative proportion of voxels contributing to each of the three categories was determined separately for the OFA and FFA regions by regrouping the voxels in the single SVM classifier into their respective ROIs for individual subjects. Finally, the representative proportion of voxels maximally contributing to each category was determined by averaging across subjects (Figure 6 C).
Inspection of the cortical maps of one subject (Figure 6 B) revealed a distinct difference in the distribution of red (Outline) and blue (Whole Face) voxels in the OFA and FFA. This pattern of results, with more red voxels in the OFA and more blue voxels in the FFA, was consistent across subjects. A repeated measures ANOVA, with ROI and stimulus category as factors, confirmed a significant interaction between ROI and the proportion of voxels contributing to each classifier (F(2,28) = 7.27, p < 0.001), without main effects for either ROI or stimulus category (F < 1). The interaction is explained by the fact that a greater proportion of voxels contributed to the Head Outline classifier in the OFA than the FFA (t(7) = 4.72, p < 0.01) and a greater proportion of voxels contributed to the Whole Face classifier in the FFA than the OFA (t(7) = 4.91, p < 0.01). The results also show that within the OFA, a greater proportion of voxels contributed to the Head Outline classifier than the Whole Face classifier (t(7) = 3.86, p < 0.01), and within the FFA, the opposite was true, as the greater proportion of voxels contributed to the Whole Face classifier (t(7) = 5.04, p < 0.01). The proportion of voxels assigned to the Internal Features classifier was not significantly different between areas (t(7) = 0.41, p > 0.65).
Our results directly support previous research that suggests the FFA is involved primarily in the processing of whole faces, whereas the OFA is more likely to be involved in processing face components (Liu et al., 2002 , 2009 ; Rotshtein et al., 2005 ; Pitcher et al., 2007 , 2008 ). The MVPA results propose that the face component primarily represented in OFA is the shape of the head, which dovetails with the OFA’s anatomical proximity to regions involved in the perception of contours, radial frequency patterns, and whole shapes, such as the Lateral Occipital Complex (Haxby et al., 2000 ; Kourtzi and Kanwisher, 2000 ; Wilkinson et al., 2000 ; Grill-Spector et al., 2001 ).
Do the classified voxels truly represent three separate categories of voxels, or are the features and outline voxels simply a subset of a broad category of voxels that responds to whole faces? The former would be consistent with a heterogeneous population of three distinct types of neurons, as schematized in Figure 5 of Betts and Wilson (2009) . The latter would be consistent with a homogenous population of neurons within the OFA and FFA that respond best to whole faces, but may partially respond to the other two categories of stimuli. The nature of the analysis used here, which forces a winner-take-all categorization on each voxel regarding the category classifier it contributes to the most (Figure 5 E), cannot distinguish between these possibilities. We therefore examined similarities in the relative responses to the different categories across voxels. The relative response was determined for each subject by subtracting out the mean response level on a voxel-by-voxel basis to all categories of stimuli. Similarities in the relative response to the different categories were then determined by correlating the relative response for all pairs of categories. If all voxels responded strongest to whole faces and less strongly to head outlines and internal features, one would expect positive correlations between whole faces and the other two stimulus types, and a negative correlation between head outlines and internal features. On average across subjects, we found no correlation (r = −0.17, t(7) = 0.70, n.s.) between the relative response of whole faces and internal features, but both the whole faces and internal features were negatively correlated with the relative response of head outlines (r = −0.68, t(7) = 5.04, p < 0.01, and r = −0.72, t(7) = 5.56, p < 0.001, respectively). These correlations are inconsistent with a single homogenous population of neurons/voxels. Rather, the results support three distinct types of voxels that are populated to different degrees by three proposed types of neurons, i.e., neurons selectively preferring head outlines, internal features, and whole faces.
Can the ability to classify the stimulus categories in the combined FFA and OFA ROI be explained simply by an interaction between the individual ROIs and the mean activation to the different stimulus categories? This would be implied if, for instance, the OFA responded the most to outlines while the FFA responded the most to whole faces. Inspection of the mean activation response, however, reveals that all ROIs yielded consistent relative responses to the different stimulus categories (Figure 7 A). Although outlines consistently elicited the lowest response (main effect of category, F(2,14) = 8.74, p < 0.01), there was no significant interaction between ROI and percent signal change to the different stimulus categories (F(6,42) = 1.60, p > 0.50). Overall response levels, therefore, could not explain why the OFA contributes disproportionately to the Outline category compared to the FFA.
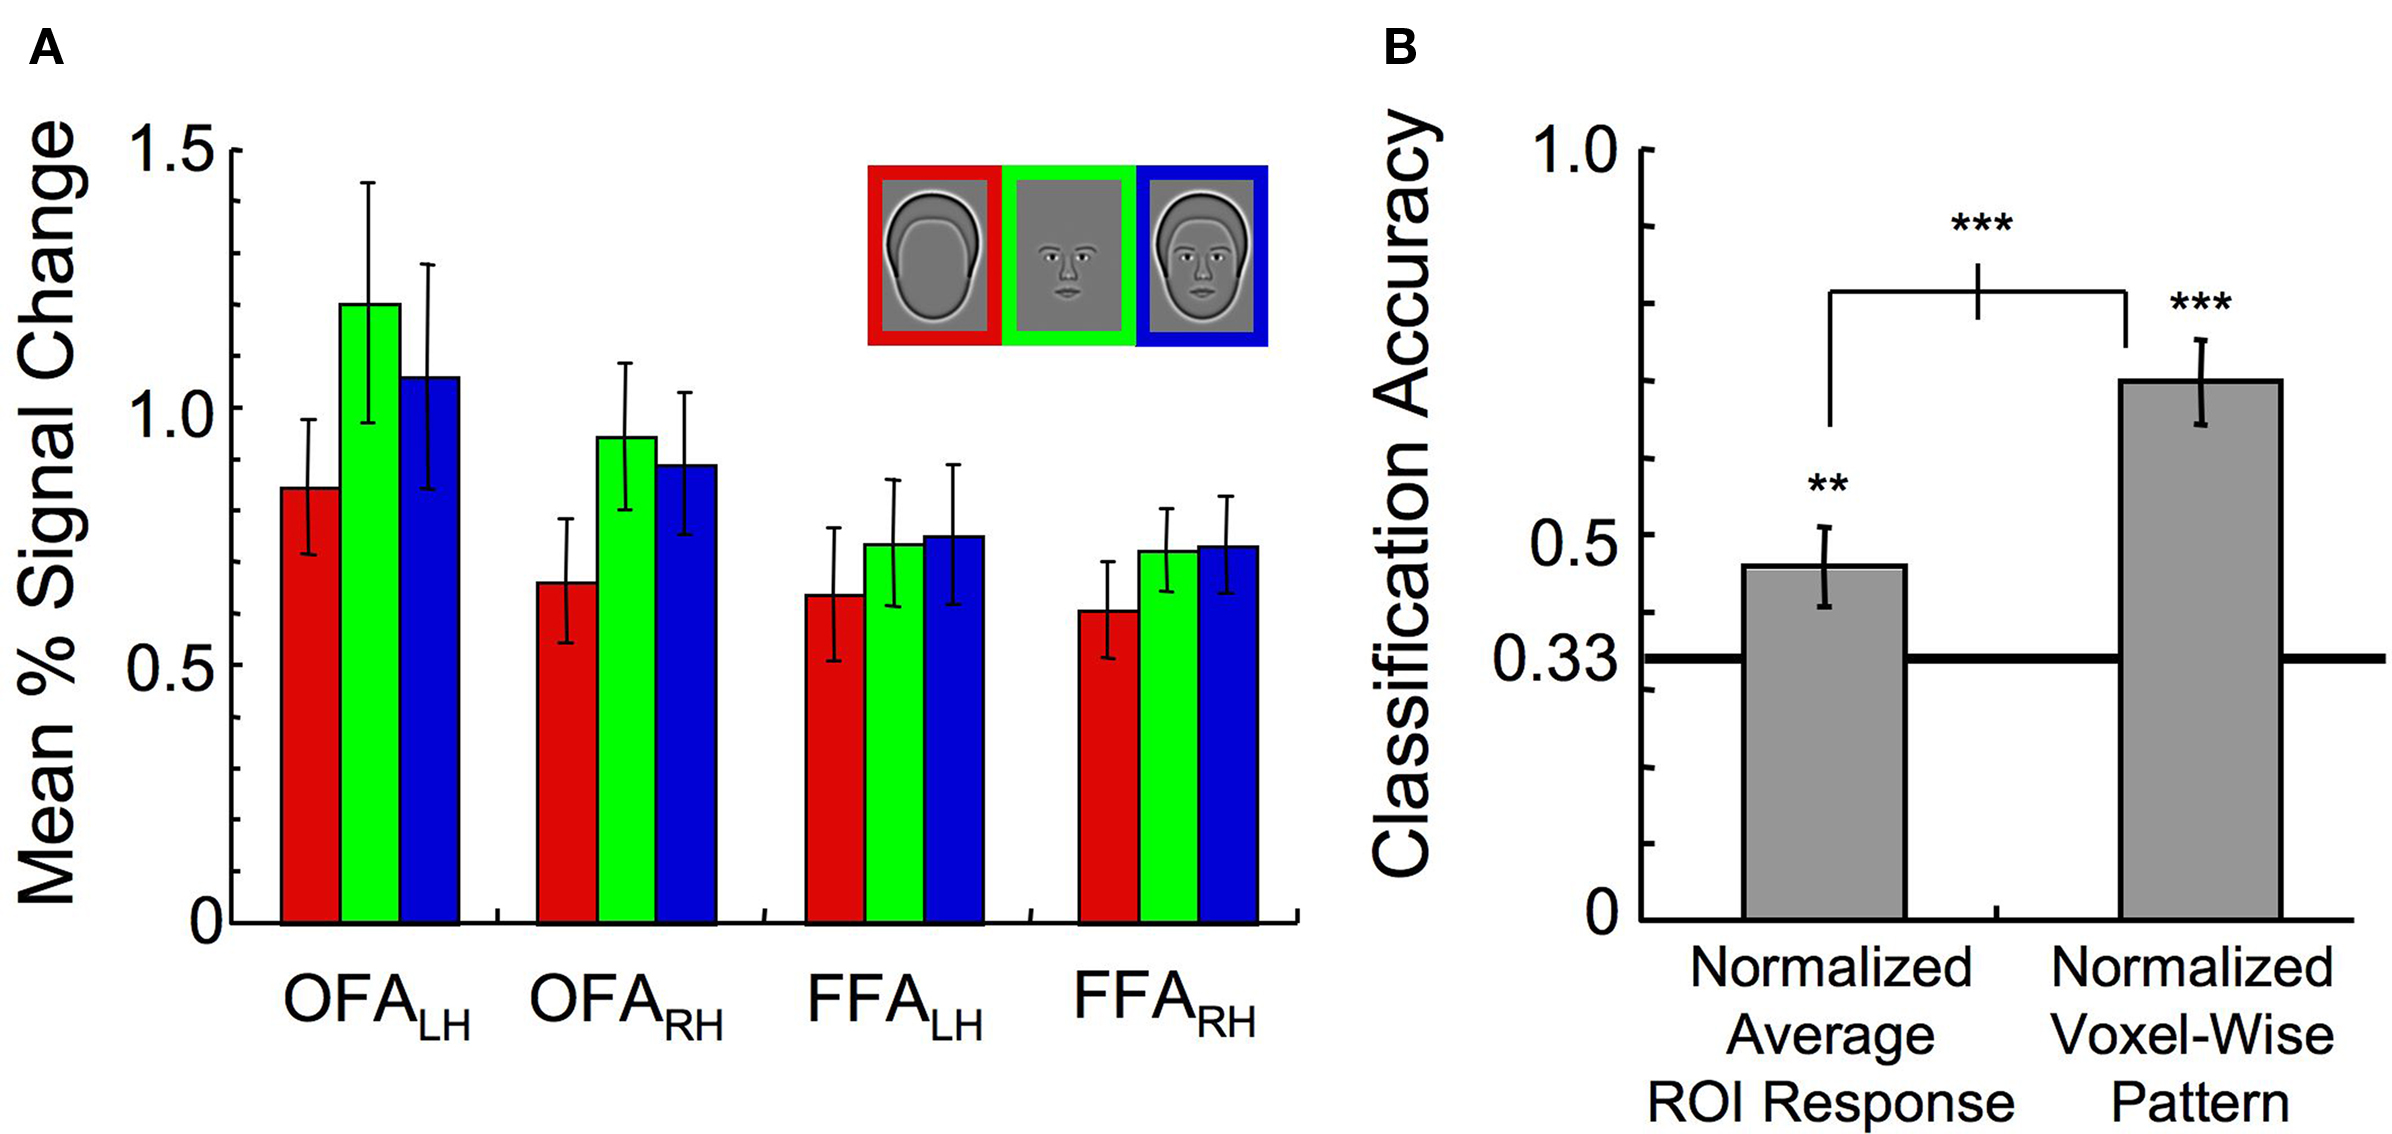
Figure 7. Exploration of interactions between the ROI and the average response level to the three stimulus categories. (A) Mean activation in all ROIs (error bars, 1 s.e.). (B) Classification of the stimulus category when either the normalized ROI response in each ROI was used as input to a pattern classifier, or the entire normalized voxel-wise pattern of activation across all ROIs was used as input to a pattern classifier (error bars, 95% c.i.). Asterisks indicate the level of significance for both independent t-tests and paired t-tests (*p < 0.05, **p < 0.01, ***p < 0.001).
To test for reliable differences in the relative responses to the different stimulus categories across ROIs on an individual subject basis, a new analysis was run with the average activation for voxels within a particular ROI to each stimulus category as the input to the SVM. This was done after normalization of the response across all voxels on a trial-by-trial basis to ensure that there were no differences in mean response to the different categories. Although the category could be classified at 46% accuracy, this was significantly lower than the classification performance of 70% correct when the entire pattern of activation across all voxels was maintained (t(7) = 6.58, p < 0.001, Figure 7 B). As classification performance was significantly lower following the averaging of the response across voxels, we concluded that differences in the spatial distribution of activation within the ROIs, rather than the mean amplitude itself, drove the differential contributions to the category classifiers across the OFA and FFA described in Figure 6 C.
As already noted above, the activation to outlines was consistently lower than to features or whole faces in the OFA and FFA, with no significant interaction between ROI and response amplitude to the different categories. While it may initially seem inconsistent that the OFA and FFA produced similar response magnitudes to the different stimulus categories and at the same time contributed differentially to the category classifiers, it is important to remember that the two measures are based on different information. The classifiers are based on discriminatory patterns in activation, across voxels, which do not need to correlate with differences in response level across the entire ROI. For instance, in responding to one category, most of the voxels might increase their activation, resulting in a strong mean response across the ROI. The presentation of a different stimulus might elicit strong activation in a subset of voxels and weak activation in the remaining voxels, producing a relatively weak mean response across the ROI, even though the pattern of activation across voxels represents a stable, predictable response to that stimulus. More to the point is the fact that it is consistent correlated changes in responses across a subset of voxels to one category that are also distinct in their pattern of changing relative to another category that are particularly used in defining the classifiers, whereas the activation of all voxels, regardless of how distinct their activation is, is used to determine the mean response level across the ROI.
In addition, the overall response level is based on both the total number of neurons that prefer each stimulus category and their relative sensitivity to the other categories. For instance, even if there are relatively more neurons involved in the processing of outlines in the OFA compared to the FFA, the presentation of a whole face is likely to activate all neurons, including those maximally responsive to features or outlines. On the other hand, the presentation of the outline could selectively activate the subset of neurons that prefers that particular category, which will necessarily be a smaller number. Thus, a lower mean response level across voxels would actually be expected for outlines compared to whole faces in both the OFA and FFA. Differences in the response level to outlines and features are therefore not necessarily indicative of the number of voxels that prefer each category. Given (a) the reduction in classification when average responses across ROIs were used, and (b) the similar relative activation levels for the three categories across ROIs, a significant amount of discriminatory information must be carried by the voxel-level patterns of response to the different categories.
Comparison of classification performance in face-selective versus retinotopic cortex
A basic property of the stimuli in Experiment 1, and of face organization in general, is that when a face is fixated, the facial features are central and the outline is peripheral. Thus, visual areas that are organized retinotopically would be expected to distinguish between these categories based solely on the spatial configuration of the facial elements. We tested this hypothesis by running the classification procedure on the activation in V1, V2, and V3. These early visual areas contain a much greater number of voxels compared to the FFA and OFA (Table 1 ). To control for the influence of ROI size, we repeated the classification process using several different sized subsets of randomly selected voxels, as well as a subset that matched the number of voxels in the OFA and FFA (Figure 8 ). A single random subset of voxels was selected for each subject, though results did not vary significantly when multiple subsets were averaged for each subject prior to group analyses. The results demonstrate (1) classification of stimulus category was possible in early visual areas, indicating clear differences in low-level stimulus features, (2) classification was possible using only a small subset of voxels (above chance for all retinotopic cortex ROIs using 10 or more voxels), (3) classification performance asymptotes by around 50 voxels. Classification performance was better in early retinotopic areas compared to face-sensitive areas even after matching the number of voxels for each subject to the number of voxels in FFA.
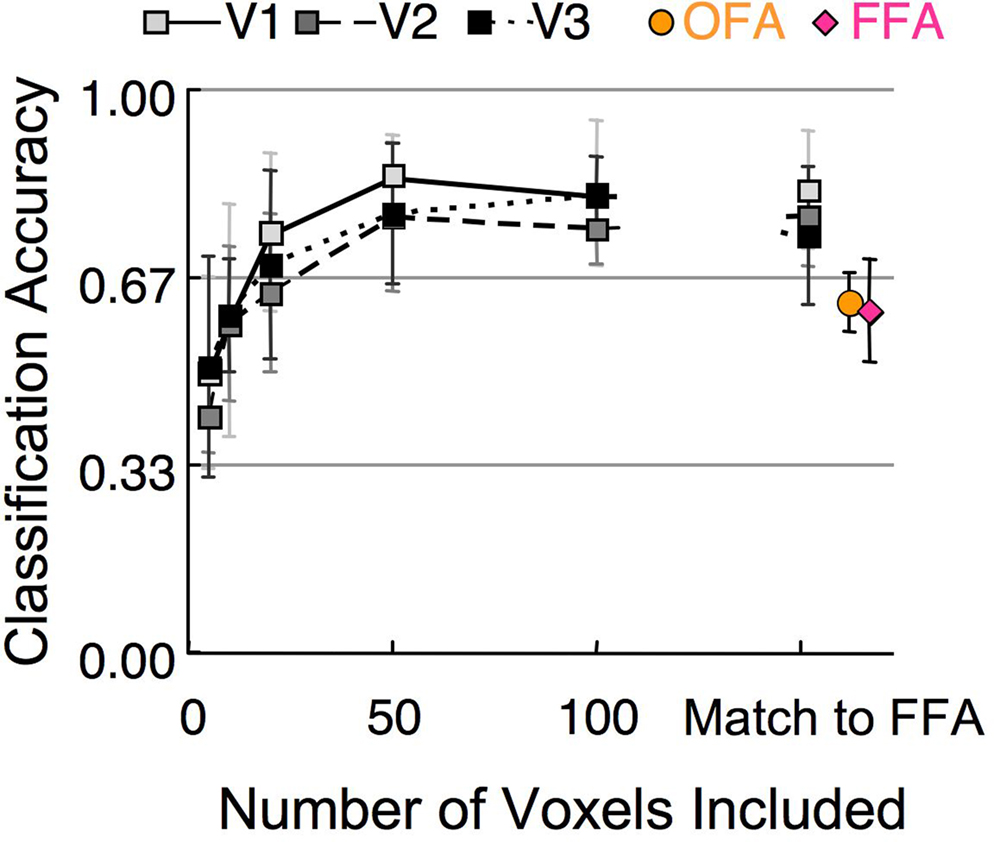
Figure 8. Mean classification of stimulus category in Experiment 1 based on different numbers of voxels in early visual cortex (V1–V3). The rightmost square symbols indicate where the number of V1–V3 voxels matched the number of voxels in the FFA (Table 1 ). The rightmost circle and diamond symbols indicate the classification performance within the OFA and FFA. (error bars, 95% c.i.).
Experiment 2
Control of low-level stimulus differences on pattern classification
As both the OFA and FFA are known to contain coarse eccentricity maps, with a bias towards the foveal visual field (Levy et al., 2001 ; Schwarzlose et al., 2008 ), it is possible that pattern classification in the face-sensitive regions could merely reflect responses to the spatial properties of the stimuli, rather than the actual encoding of whole faces, features and outlines. To rule out this possibility, we conducted an additional experiment (n = 8, three F) that provided strict control over the spatial distribution of the energy within the stimuli.
We first scrambled the stimulus regions corresponding to the feature and outlines to create the following three stimulus categories: (1) scrambled features, intact outline (SF/IO); (2) Intact Features, Scrambled Outline (IF/SO); and (3) Intact Features, Intact Outline (IF/IO) (Figure 1 B). The average Fourier amplitude spectra of the randomly selected set of eight faces used within a scan was then applied to each of the stimuli to ensure that all stimuli had the same spatial frequency and contrast energy. Additionally, a white rectangular grid was superimposed on the stimuli to minimize the effects of new local edges created during the scrambling procedure.
Both the OFA and FFA responded strongly to the IF/IO condition (which is similar to the Whole Face condition used in the above experiment, except with band-pass filtered noise and a grid added), but robust activation was also elicited by the IF/SO and SF/IO conditions (Figure 9 A). In fact, no response differences were observed between the stimulus categories (F(2,12) = 0.91, p > 0.40). The fMRI responses to a fourth condition, in which both the features and outlines were scrambled, were significantly lower than any of the other three conditions, indicating that the scrambling procedure successfully interfered with face processing in the OFA and FFA. Furthermore, the response amplitudes were all in the same range in early visual areas (V1–V3), as would be expected from the controlled low-level stimulus information. As predicted, category classification was heavily disrupted by the scrambling procedure in early visual cortex, as variations in the spatial position of local stimulus contrast no longer served as a strong cue to stimulus category (Figure 9 B). However, classification performance in face-selective visual areas remained similar to the levels observed in Experiment 1, indicating that the perception of the intact face components could still sufficiently activate the neural populations responding to outlines, features, and whole faces. This clearly demonstrates that the classification performance observed in Experiment 1 was not simply due to a residual retinotopic bias in higher visual areas.
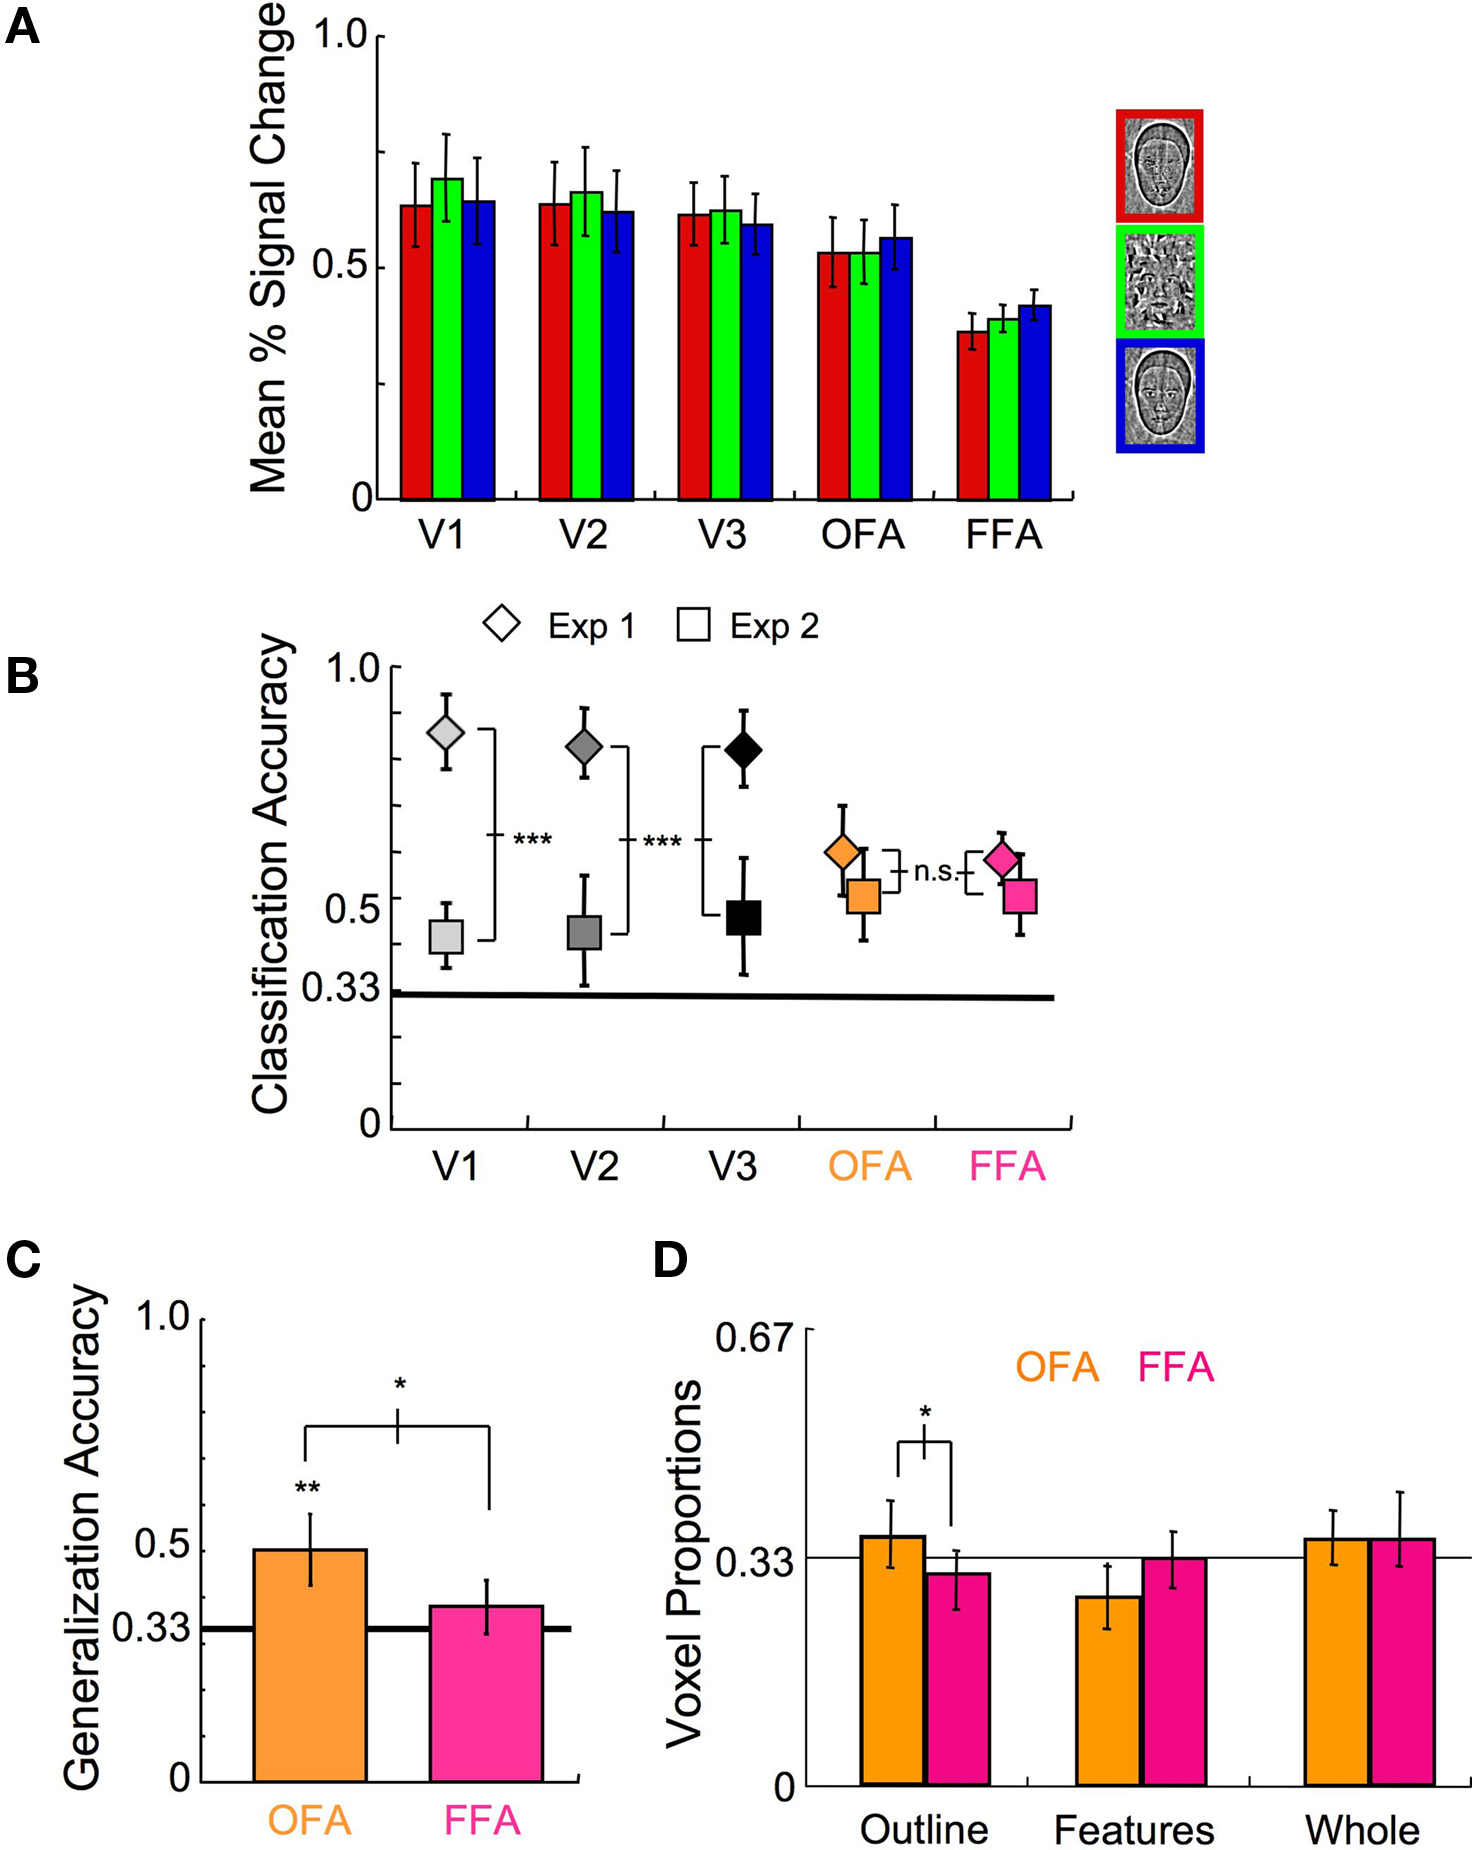
Figure 9. Experiment 2 results. (A) The mean response level to the different scrambled stimulus categories (21 samples each; error bars, 1 s.e.). (B) Results of the multi-class SVM analysis within early visual areas and face-selective cortex for Experiment 1 (◊) and Experiment 2 (□) (error bars, 95% c.i.). (C) Categorization accuracy of classifiers trained to discriminate fMRI responses to scrambled stimuli that were then tested on independent fMRI responses to unscrambled stimuli (error bars, 95% c.i.). (D) The relative proportion of voxels that maximally contributed to the three stimulus categories within the OFA and the FFA (error bars, 95% c.i.). Asterisks indicate the level of significance for paired t-tests in (B–D) and independent t-tests relative to chance in (C) (*p < 0.05, **p < 0.01, ***p < 0.001).
Comparison of experiment 2 classifiers to experiment 1 classifiers
Just how similar are the patterns of activation in face-sensitive cortex to the scrambled and unscrambled versions of the stimuli? This is akin to asking to what extent does face-irrelevant stimulus information affect processing of the individual face components. To address this question, we trained SVM multi-class classifiers on the OFA and FFA activation patterns elicited by the scrambled stimuli (Figure 1 B) in six subjects, and then tested these classifiers on fMRI responses to unscrambled versions of the stimuli (Figure 1 A) obtained during an independent set of scans. It is worth noting that while all of the experimental scans were run on the same day for three of the subjects, scrambled and unscrambled runs were taken 3 months apart for two subjects, and 20 months apart for one subject, with the generalization performance of similar magnitudes regardless of the temporal proximity of the scans. As shown in Figure 9 C, significant generalization was possible in the OFA (percent correct = 50%, t(5) = 5.65, p < 0.01), but not in the FFA (percent correct = 38%, t(4) = 2.12, p > 0.10). This indicates that the pattern of activation was more affected in the FFA than the OFA when face-irrelevant stimulus information was added, even though similar levels of classification were found in both areas for scrambled and unscrambled versions of the stimuli separately. Examining the relative distribution of voxels contributing maximally to the different category classifiers (Figure 9 D), there was again a greater proportion of voxels contributing to the Head Outline classifier within the OFA than within the FFA (t(7) = 2.67, p < 0.05), but the relative proportion of voxels contributing to the Whole Face classifier was not significantly different between the OFA and the FFA (t(7) = 0.01). Based on all of the results of Experiment 2 taken together, it appears that the discriminatory patterns of activation had a greater effect on the representation of the whole face than on the face components when scrambled stimuli were used, consistent with the representation of whole faces being more selective to stimulus conditions than the representation of the head outlines or internal features.
Experiment 3
Control of spatial sensitivity on pattern classification
We conducted a final experiment to rule out the possibility that the observed interaction between ROI and the distribution of voxels contributing to the Head Outline and Whole Face classifiers simply reflects a differential foveal versus peripheral processing bias in OFA and FFA. We scanned an additional eight subjects (five of whom were naïve; three F) who viewed unscrambled stimuli, as in Experiment 1, though reduced in size and presented in the periphery (Figure 1 C), while performing a moderately demanding fixation task. Presentation of the stimuli was in one of the four quadrants of the visual field on any given block, but position varied across blocks. One block of each category at each position was presented per scan, for five scans, resulting in a total of 20 samples per category and 15 samples per position for the SVM analysis. Given the known position sensitivity in the OFA and FFA (Schwarzlose et al., 2008 ), the peripheral stimulus presentation, and the focus of attention on an unrelated central fixation task, it is not surprising that classification of the stimulus category was substantially reduced compared to Experiments 1 and 2. However, the category classification performance was still above chance levels (Figure 10 A; OFA percent correct = 39%, p < 0.01; FFA percent correct = 43%, p < 0.05; combined OFA and FFA percent correct = 45%, p < 0.01). More importantly, even with the reduced bias for features being presented centrally and outlines peripherally through this stimulus manipulation, a similar pattern of voxel distributions to Experiment 1 was found (Figures 10 B,C; ROI × Category interaction of the voxel distribution: F(2,14) = 7.47, p < 0.01), with proportionally more voxels contributing to the Head Outline classifier in OFA compared to FFA (t(7) = 3.79, p < 0.01), and proportionally more voxels contributing to the Whole Face classifier in FFA compared to OFA (t(7) = 3.30, p < 0.05). These results again indicate that the OFA is more involved in processing the building blocks of faces, and particularly information regarding head shape, whereas the FFA is more involved in processing the final construction of a face. The finding that the distribution of voxels in the OFA and FFA was similarly biased with very different stimulus manipulations, different experimental methods, and across a total of 16 participants, indicates that the tendency towards representing outlines in the OFA and whole faces in the FFA is a robust phenomenon.
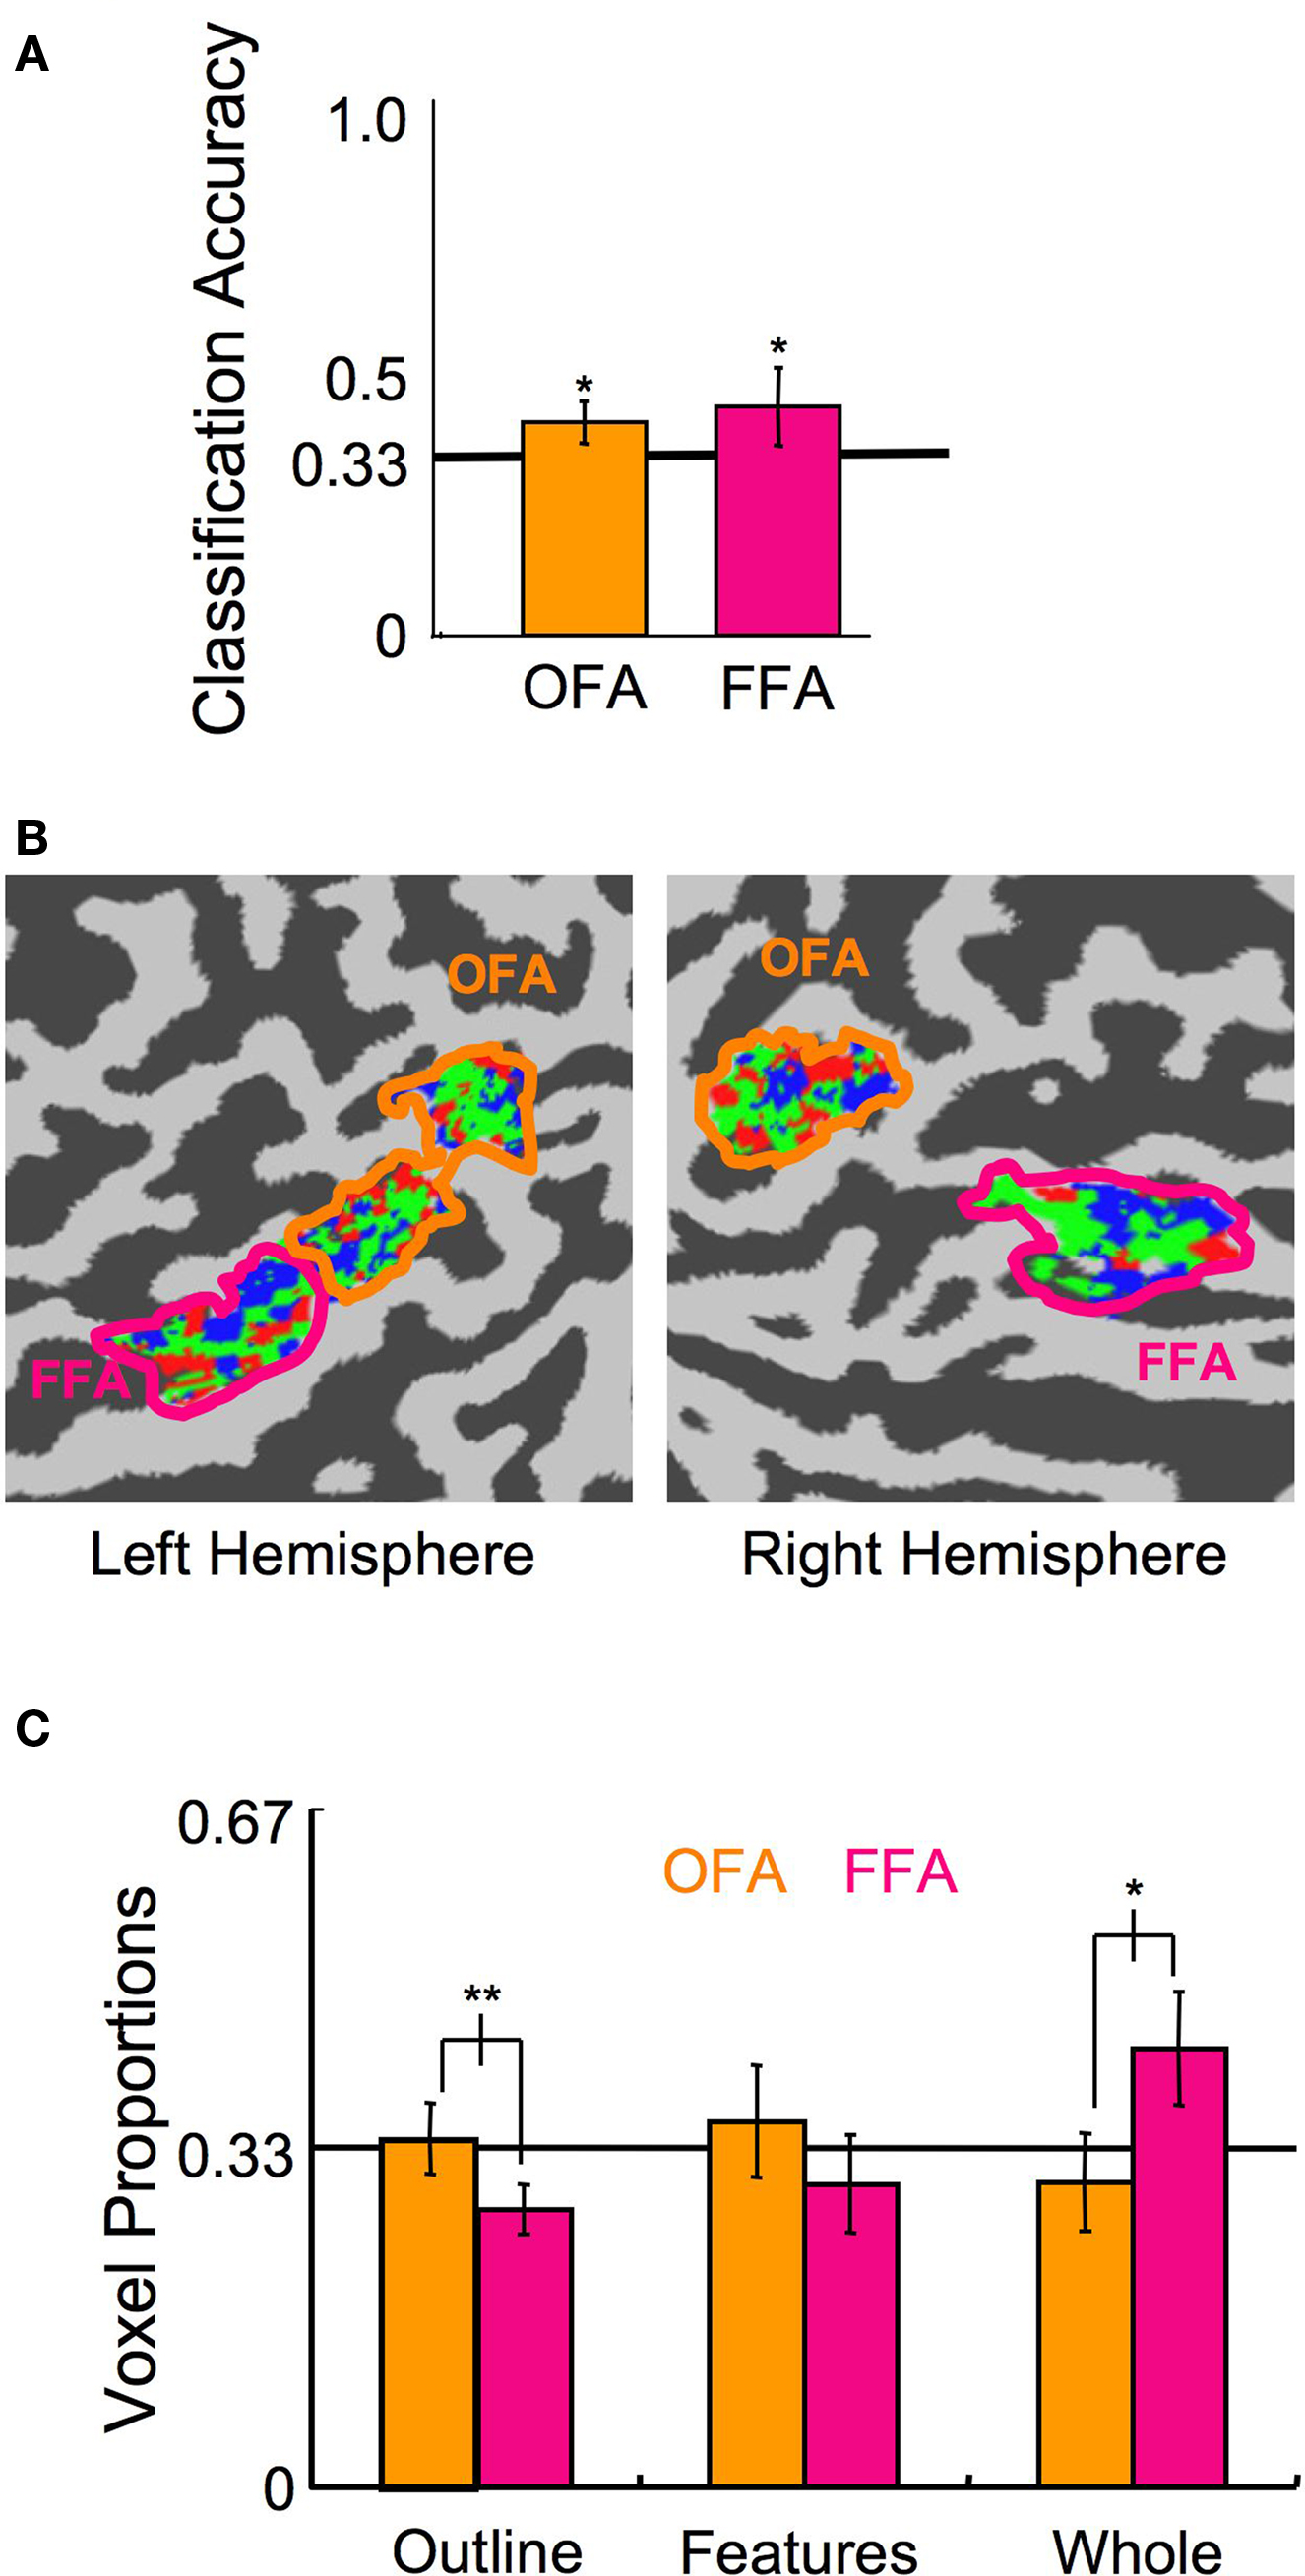
Figure 10. Experiment 3 results. (A) Classification of the stimulus category, ignoring the position (error bars, 95% c.i.). (B) A flat map of face-sensitive cortex from a representative subject showing the distribution of the categories to which each voxel maximally contributed. (C) Distribution of the proportion of voxels that maximally contributed to each of the three categories in the OFA and FFA (error bars, 95% c.i.). Asterisks indicate the level of significance for independent t-tests in (A) and paired t-tests in (C) (*p < 0.05, **p < 0.01, ***p < 0.001).
Discussion
In the present series of experiments, we used multi-voxel pattern analysis to demonstrate that whole faces, facial features, and head outlines are represented in a spatially distributed manner within the face-sensitive OFA and FFA regions. Additionally, by selectively scrambling parts of the image, we highlighted the ability of these face-sensitive areas to detect the presence of internal features and/or head outlines in the context of face-irrelevant information, which is precisely what is needed in a putative face detection mechanism. Thus, the high level of classifiability of the stimulus category in the OFA and FFA with either scrambled or unscrambled face parts is consistent with a functional clustering of neural populations that are selectively responsive to the building blocks and complete construction of faces.
The visual system is currently thought to comprise a hierarchy of visual areas that process increasingly complicated representations of the two dimensional luminance patterns that fall on the retina. As the visual information is processed by successively higher visual areas, more complex representations of stimulus properties are formed. In the 1970s and 1980s, single cell recordings from the inferotemporal (IT) cortex of monkeys revealed a patchy organization of face- and object-selective neurons (Bruce et al., 1981 ; Perrett et al., 1982 ; Logothetis and Sheinberg, 1996 ). More recently, large interconnected clusters of face-selective neurons in monkey IT, and also in frontal cortex, have been localized with fMRI (Tsao et al., 2006 ; Moeller et al., 2008 ). Further investigations into the response properties of such selective neurons suggest that object features are combined into whole object representations within monkey IT (Perrett et al., 1982 ; Kobatake and Tanaka, 1994 ). Importantly, Kobatake and Tanaka (1994) discovered neurons that responded selectively to individual components of facial stimuli, such as the internal features or an elliptical head shape, as well as a separate population of neurons that fired exclusively to the canonical arrangement of facial features contained within an ellipse. Our fMRI findings corroborate these physiological experiments and provide a framework for the construction of whole face objects from face components within the form and object-processing stream of the visual hierarchy.
Although both the OFA and FFA are generally deemed necessary for normal face perception (Sergent and Signoret, 1992 ; Barton et al., 2002 ; Rossion et al., 2003 ; Bouvier and Engel, 2006 ; Steeves et al., 2006 ), the differences in anatomical location and response properties suggest that these two regions play different roles. The OFA is positioned closer to the occipital pole than the FFA and shares many characteristics of retinotopic cortex, including increased position sensitivity and foveal-peripheral eccentricity maps (Grill-Spector et al., 1998 ; Levy et al., 2001 ; Schwarzlose et al., 2008 ). The particular types of stimuli that we used, internal facial features, external head outlines, and the whole face, were selected precisely because they are two building blocks and the final construction of a whole face percept.
Areas earlier in the face processing stream would be expected to contribute a greater amount to the representation of the building blocks, i.e., features and outline, whereas areas later in the processing stream would be expected to contribute a greater amount to the representation of the final construction, i.e., the whole face. Our results are consistent with OFA occurring earlier in the processing stream, with the output of OFA feeding to FFA for further analysis (Haxby et al., 2000 ; Liu et al., 2002 , 2009 ; Caldara et al., 2006 ; Harris and Aguirre, 2008 ; Caldara and Seghier, 2009 ). However, it has recently been suggested that the OFA is actually downstream from the FFA in the face processing hierarchy (Rossion, 2008 ) and that recurring feedback loops between the OFA and FFA serve to fine-tune the representation of facial characteristics such as identity, gender, head orientation, and emotion. Given the incredible interconnectivity of the brain, a strict hierarchical processing pathway for faces is unlikely. Additional studies using methods more sensitive to subtle timing differences in brain activation, like those using magnetoencephalography (MEG) (Liu et al., 2002 ), and transcranial magnetic stimulation (TMS) (Pitcher et al., 2007 ) may shed more light on the temporal order of processing within the putative face network. Yet, making strong conclusions on the order of temporal processing based on TMS results is also potentially problematic, given that the FFA may also be affected by a TMS pulse to the OFA due to the density of connections between the areas as demonstrated by diffusion tensor imaging (Kim et al., 2006 ). Therefore, the exact nature of the face processing hierarchy will likely remain open for debate, even as the brain regions that carry particular information about faces are elucidated.
Conflict of Interest Statement
This research was conducted in the absence of any commercial or financial relationships that could be construed as a potential conflict of interest.
Acknowledgments
The Canadian Institutes for Health Research (OP 172103), the Canadian Institutes for Health Research Training Grant in Vision Health Research, the Canadian Institute for Advanced Research, and the Natural Sciences and Engineering Research Council of Canada (OP 224227).
References
Barton, J. J., Press, D. Z., Keenan, J. P., and O’Connor, M. (2002). Lesions of the fusiform face area impair perception of facial configuration in prosopagnosia. Neurology 58, 71–78.
Betts, L. R., and Wilson, H. R. (2009). Heterogeneous Structure in face-selective human occipito-temporal cortex. J Cogn Neurosci. doi:10.1162/jocn.2009.21346
Bouvier, S. E., and Engel, S. A. (2006). Behavioral deficits and cortical damage loci in cerebral achromatopsia. Cereb. Cortex 16, 183–191.
Bruce, C., Desimone, R., and Gross, C. G. (1981). Visual properties of neurons in a polysensory area in superior temporal sulcus of the macaque. J. Neurophysiol. 46, 369–384.
Caldara, R., and Seghier, M. L. (2009). The Fusiform Face Area responds automatically to statistical regularities optimal for face categorization. Hum. Brain Mapp. 30, 1615–1625. doi:10.1002/hbm.20626
Caldara, R., Seghier, M. L., Rossion, B., Lazeyras, F., Michel, C., and Hauert, C. A. (2006). The fusiform face area is tuned for curvilinear patterns with more high-contrasted elements in the upper part. Neuroimage 31, 313–9. doi:S1053-8119(05)02537-1 [pii] 10.1016/j.neuroimage.2005.12.011
Canu, S., Grandvalet, Y., Guigue, V. and Rakotomamonjy, A. (2005) “SVM-KMToolbox,” in Perception Systemes et Information (Rouen, France: INSA de Rouen). http://asi.insa-rouen.fr/enseignants/~arakotom/toolbox/index.html
Engel, S. A., Glover, G. H., and Wandell, B. A. (1997). Retinotopic organization in human visual cortex and the spatial precision of functional MRI. Cereb. Cortex 7, 181–192.
Gauthier, I., Tarr, M. J., Moylan, J., Skudlarski, P., Gore, J. C., and Anderson, A. W. (2000). The fusiform “face area” is part of a network that processes faces at the individual level. J. Cogn. Neurosci. 12, 495–504.
Grill-Spector, K., Kushnir, T., Hendler, T., Edelman, S., Itzchak, Y., and Malach, R. (1998). A sequence of object-processing stages revealed by fMRI in the human occipital lobe. Hum. Brain Mapp. 6, 316–328.
Grill-Spector, K., Kourtzi, Z., and Kanwisher, N. (2001). The lateral occipital complex and its role in object recognition. Vision Res. 41, 1409–1422.
Harris, A., and Aguirre, G. K. (2008). The representation of parts and wholes in face-selective cortex. J. Cogn. Neurosci. 20, 863–878.
Haxby, J. V., Hoffman, E. A., and Gobbini, M. I. (2000). The distributed human neural system for face perception. Trends Cogn. Sci. (Regul. Ed.) 4, 223–233.
Haynes, J. D., and Rees, G. (2006). Decoding mental states from brain activity in humans. Nat. Rev. Neurosci. 7, 523–534.
Kamitani, Y., and Tong, F. (2005). Decoding the visual and subjective contents of the human brain. Nat. Neurosci. 8, 679–685.
Kanwisher, N., McDermott, J., and Chun, M. M. (1997). The fusiform face area: a module in human extrastriate cortex specialized for face perception. J. Neurosci. 17, 4302–4311.
Kanwisher, N., and Yovel, G. (2006). The fusiform face area: a cortical region specialized for the perception of faces. Philos. Trans. R. Soc. Lond., B, Biol. Sci. 361, 2109–2128.
Kim, M., Ducros, M., Carlson, T., Ronen, I., He, S., Ugurbil, K., and Kim, D. S. (2006). Anatomical correlates of the functional organization in the human occipitotemporal cortex. Magn. Reson. Imaging 24, 583–590. doi:S0730- 725X(05)00383-8 [pii] 10.(1016)/j.mri.2005.12.005.
Kobatake, E., and Tanaka, K. (1994). Neuronal selectivities to complex object features in the ventral visual pathway of the macaque cerebral cortex. J. Neurophysiol. 71, 856–867.
Kourtzi, Z., and Kanwisher, N. (2000). Cortical regions involved in perceiving object shape. J. Neurosci. 20, 3310–3318.
Levy, I., Hasson, U., Avidan, G., Hendler, T., and Malach, R. (2001). Center-periphery organization of human object areas. Nat. Neurosci. 4, 533–539.
Liu, J., Harris, A., and Kanwisher, N. (2002). Stages of processing in face perception: an MEG study. Nat. Neurosci. 5, 910–916.
Liu, J., Harris, A., and Kanwisher, N. (2009). Perception of face parts and face configurations: an fMRI study. J. Cogn. Neurosci. 22, 203–211.
Loffler, G., Yourganov, G., Wilkinson, F., and Wilson, H. R. (2005). fMRI evidence for the neural representation of faces. Nat. Neurosci. 8, 1386–1390.
Logothetis, N. K., and Sheinberg, D. L. (1996). Visual object recognition. Annu. Rev. Neurosci. 19, 577–621.
Moeller, S., Freiwald, W. A., and Tsao, D. Y. (2008). Patches with links: a unified system for processing faces in the macaque temporal lobe. Science 320, 1355–1359.
Norman, K. A., Polyn, S. M., Detre, G. J., and Haxby, J. V. (2006). Beyond mind-reading: multi-voxel pattern analysis of fMRI data. Trends Cogn. Sci. (Regul. Ed.) 10, 424–430. doi:S1364-6613(06)00184-7 [pii] 10.1016/j.tics.2006.07.005
Pascalis, O., and Kelly, D. J. (2009). The origins of face processing in humans: phylogeny and ontogeny. Perspect. Psychol. Sci. 4, 200–209.
Perrett, D. I., Rolls, E. T., and Caan, W. (1982). Visual neurones responsive to faces in the monkey temporal cortex. Exp. Brain Res. 47, 329–342.
Pitcher, D., Garrido, L., Walsh, V., and Duchaine, B. C. (2008). Transcranial magnetic stimulation disrupts the perception and embodiment of facial expressions. J. Neurosci. 28, 8929–8933. doi:28/36/8929 [pii] 10.(1523)/jneurosci.1450-08.2008.
Pitcher, D., Walsh, V., Yovel, G., and Duchaine, B. (2007). TMS evidence for the involvement of the right occipital face area in early face processing. Curr. Biol. 17, 1568–1573.
Rossion, B. (2008). Constraining the cortical face network by neuroimaging studies of acquired prosopagnosia. Neuroimage 40, 423–426.
Rossion, B., Caldara, R., Seghier, M., Schuller, A. M., Lazeyras, F., and Mayer, E. (2003). A network of occipito- temporal face-sensitive areas besides the right middle fusiform gyrus is necessary for normal face processing. Brain 126, 2381–2395.
Rotshtein, P., Henson, R. N., Treves, A., Driver, J., and Dolan, R. J. (2005). Morphing Marilyn into Maggie dissociates physical and identity face representations in the brain. Nat. Neurosci. 8, 107–113.
Schwarzlose, R. F., Swisher, J. D., Dang, S., and Kanwisher, N. (2008). The distribution of category and location information across object-selective regions in human visual cortex. Proc. Natl. Acad. Sci. U.S.A. 105, 4447–4452. doi:0800431105 [pii] 10.1073/pnas.0800431105
Sereno, M. I., McDonald, C. T., and Allman, J. M. (1994). Analysis of retinotopic maps in extrastriate cortex. Cereb. Cortex 4, 601–620.
Sergent, J., and Signoret, J. L. (1992). Varieties of functional deficits in prosopagnosia. Cereb. Cortex 2, 375–388.
Steeves, J. K., Culham, J. C., Duchaine, B. C., Pratesi, C. C., Valyear, K. F., Schindler, I., Humphrey, G. K., Milner, A. D., and Goodale, M. A. (2006). The fusiform face area is not sufficient for face recognition: evidence from a patient with dense prosopagnosia and no occipital face area. Neuropsychologia 44, 594–609.
Tong, F., Nakayama, K., Moscovitch, M., Weinrib, O., and Kanwisher, N. (2000). Response properties of the human fusiform face area. Cogn. Neuropsychol. 17, 257–279.
Tsao, D. Y., Freiwald, W. A., Tootell, R. B., and Livingstone, M. S. (2006). A cortical region consisting entirely of face-selective cells. Science 311, 670–674.
Wilkinson, F., James, T. W., Wilson, H. R., Gati, J. S., Menon, R. S., and Goodale, M. A. (2000). An fMRI study of the selective activation of human extrastriate form vision areas by radial and concentric gratings. Curr. Biol. 10, 1455–1458.
Wilson, H. R., Loffler, G., and Wilkinson, F. (2002). Synthetic faces, face cubes, and the geometry of face space. Vision Res. 42, 2909–2923.
Wojciulik, E., Kanwisher, N., and Driver, J. (1998). Covert visual attention modulates face-specific activity in the human fusiform gyrus: fMRI study. J. Neurophysiol. 79, 1574–1578.
Keywords: vision, face perception, functional magnetic resonance imaging, fusiform face area, occipital face area, multi-voxel pattern classification
Citation: Nichols DF, Betts LR and Wilson HR (2010) Decoding of faces and face components in face-sensitive human visual cortex. Front. Psychology 1:28. doi: 10.3389/fpsyg.2010.00028
This article was submitted to Frontiers in Perception Science, a specialty of Frontiers in Psychology.
Received: 27 January 2010;
Paper pending published: 20 February 2010;
Accepted: 12 June 2010;
Published online: 08 July 2010
Edited by:
Nikolaus Kriegeskorte, Medical Research Council Cognition and Brain Sciences Unit, UKReviewed by:
Edward Vul, Massachusetts Institute of Technology, USAArash Afraz, Massachusetts Institute of Technology, USA
Roberto Caldara, University of Glasgow, UK
Copyright: © 2010 Nichols, Betts and Wilson. This is an open-access article subject to an exclusive license agreement between the authors and the Frontiers Research Foundation, which permits unrestricted use, distribution, and reproduction in any medium, provided the originalauthors and source are credited.
*Correspondence: David F. Nichols, Department of Psychology, Roanoke College, 221 College Lane, Salem, VA 24153, USA. e-mail: dnichols@roanoke.edu