
- 1 Department of Psychology, New York University, New York, NY, USA
- 2 Center for Neural Science, New York University, New York, NY, USA
We designed an economic task to investigate human planning of routes in landscapes where travel in different kinds of terrain incurs different costs. Participants moved their finger across a touch screen from a starting point to a destination. The screen was divided into distinct kinds of terrain and travel within each kind of terrain imposed a cost proportional to distance traveled. We varied costs and spatial configurations of terrains and participants received fixed bonuses minus the total cost of the routes they chose. We first compared performance to a model maximizing gain. All but one of 12 participants failed to adopt least-cost routes and their failure to do so reduced their winnings by about 30% (median value). We tested in detail whether participants’ choices of routes satisfied three necessary conditions (heuristics) for a route to maximize gain. We report failures of one heuristic for 7 out of 12 participants. Last of all, we modeled human performance with the assumption that participants assign subjective utilities to costs and maximize utility. For 7 out 12 participants, the fitted utility function was an accelerating power function of actual cost and for the remaining 5, a decelerating power function. We discuss connections between utility aggregation in route planning and decision under risk. Our task could be adapted to investigate human strategy and optimality of route planning in full-scale landscapes.
Introduction
Navigating through the environment costs time and energy, and may incur danger. Many species show adaptive route selection, balancing different costs for effective foraging (Stephens and Krebs, 1986). However, studies of human route selection typically frame the problem in terms of distance minimization. Participants are asked to visit a novel set of spots sequentially and they typically minimize the total distance traveled (Säisä and Gärling, 1987; MacGregor et al., 2000; Vickers et al., 2001; Wiener et al., 2008).
But distance and obstacles are not the only concerns in planning routes. In planning a route from a starting point to a destination, people typically trade off several kinds of costs and benefits (Gärling and Gärling, 1988; Golledge, 1995). In Figure 1A, for example, it is plausible that a wise traveler would not go directly toward the marked destination but would instead take into account the difficulty associated with crossing different kinds of terrain.
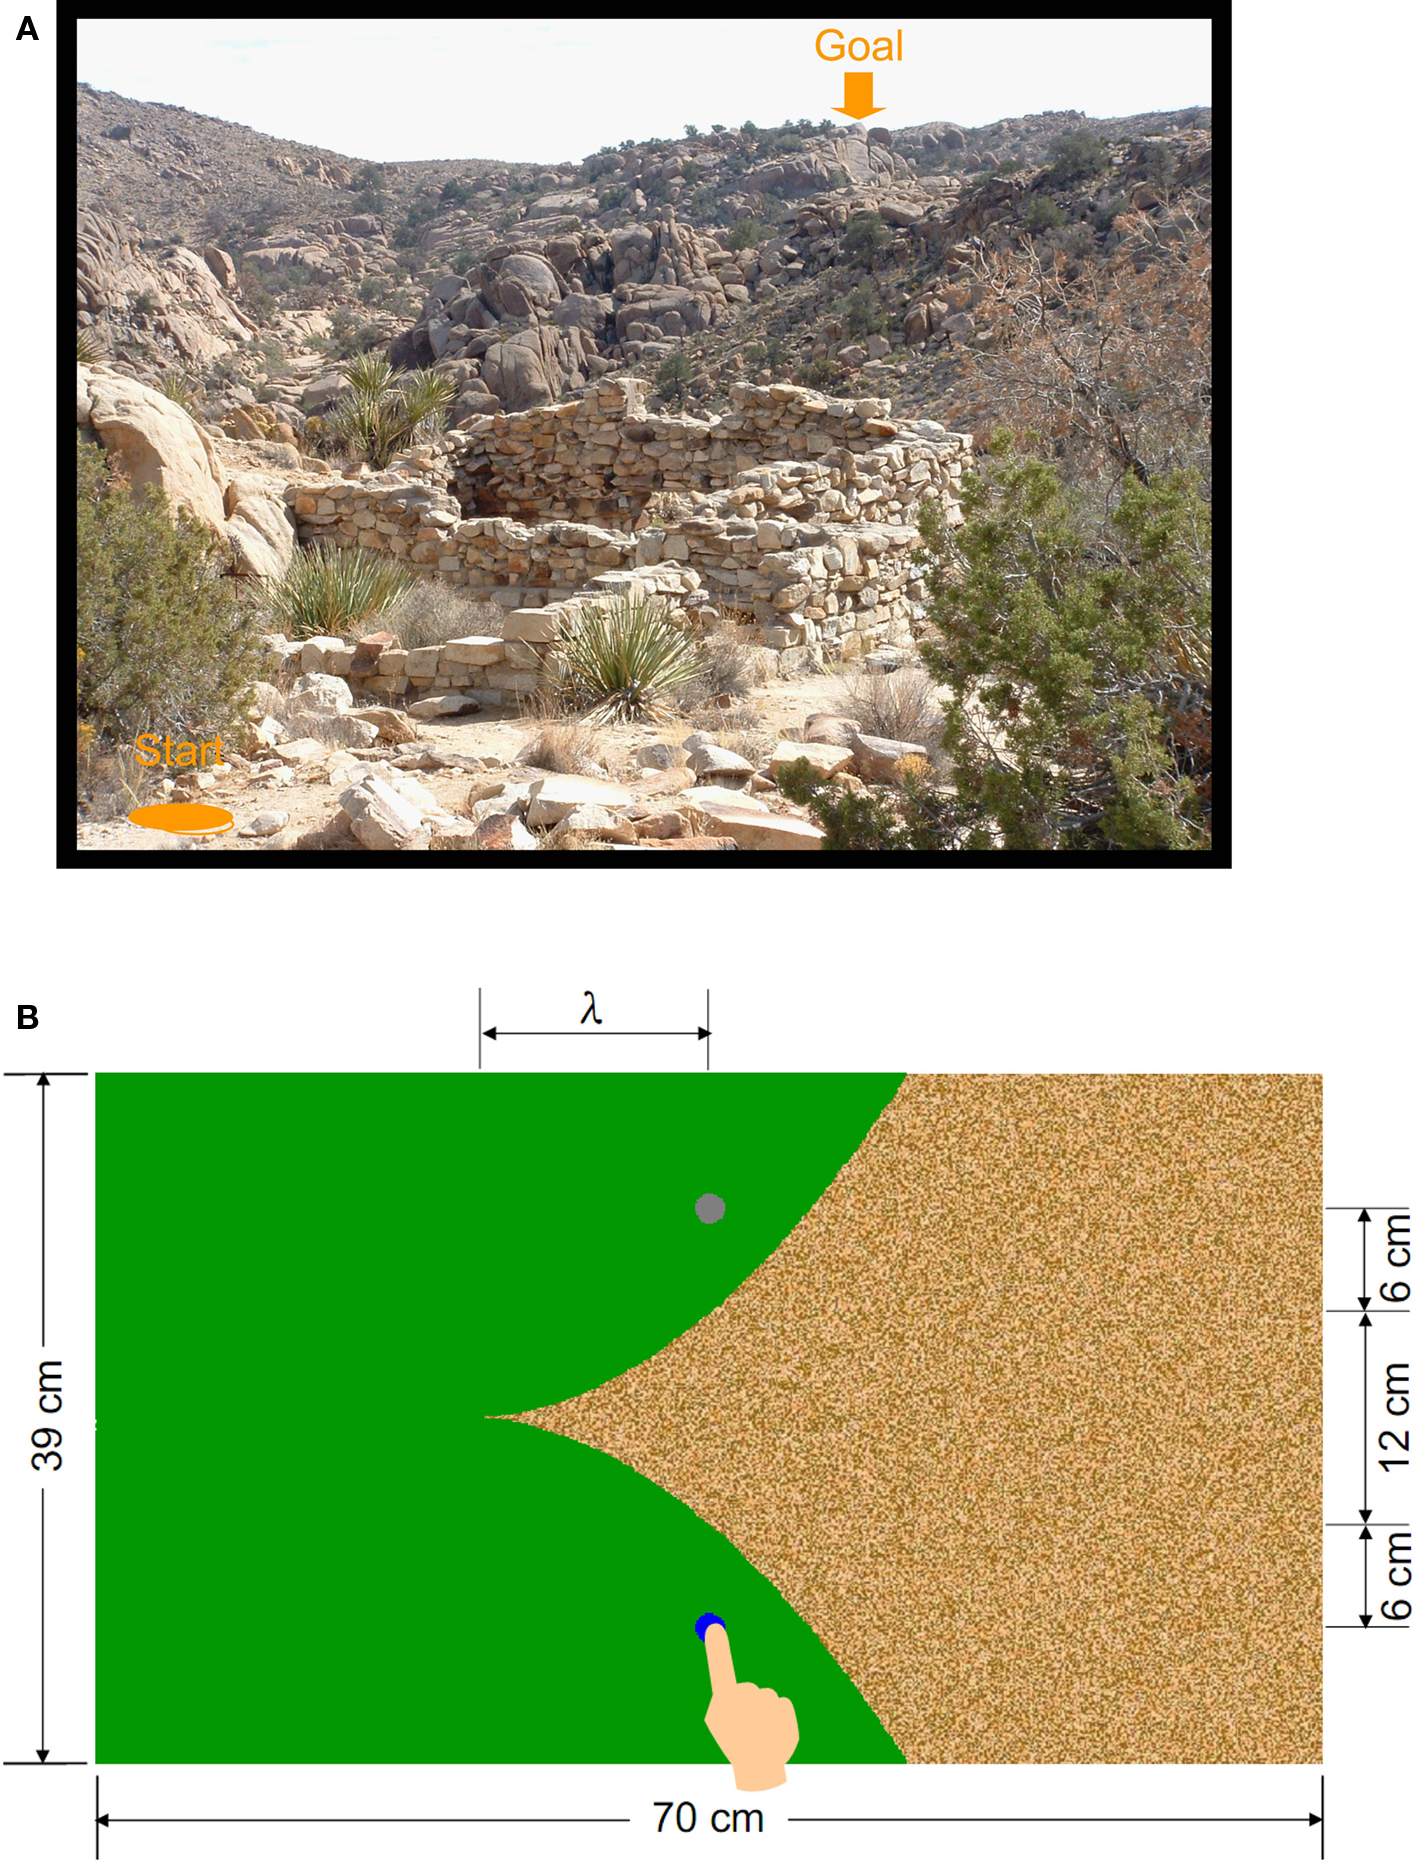
Figure 1. Route planning across terrains. (A) A landscape and a goal. The energy costs and risk associated with different paths in natural landscapes can vary markedly. A possible starting point and goal are marked. (B) Example of the economic route planning task. The task was to move one’s index finger along the surface of a touch screen from the starting point (blue circle) to the destination (gray circle). The screen consisted of two regions: desert (yellow or red) and field (green). Dimensions of the stimuli are shown on the margins. The parameter λ denotes the distance from the vertex of the desert to the vertical middle line joining start point and goal. Each unit of distance traveled incurred a cost. Traveling in the yellow desert cost three times more per unit distance than traveling in the field, while traveling in the red desert cost five times more. Participants received a fixed bonus minus the cost incurred in travel for each trial. See text.
The present study is focused on this important but neglected aspect of navigation. Terrains vary in cost to the organism and the minimum cost route is often not the route minimizing distance traveled. Costs associated with terrain are known to affect route selection: Sympatric spider monkeys and woolly monkeys (Di Fiore and Suarez, 2007) and human hunters (Yost and Kelley, 1983) tend to travel along ridge tops. This behavior is conjectured to be energetically less costly than crossing rivers and climbing hills (Milton, 2000). Moreover, monkeys can plan their routes in advance to take into account novel spatial distributions of food (Gallistel and Cramer, 1996; Janson, 2007; Valero and Byrne, 2007).
We designed a route selection task with explicit economic payoffs to simulate traveling across terrains differing in cost. Participants moved their finger along the surface of a touch screen from a starting point to a destination. Their trajectory could run across “field” terrain and “desert” terrain depending on the path they choose (see Figure 1B for an illustration). Traveling in different terrains imposed different costs per unit distance. Participants were informed of the cost rate of each terrain beforehand and practiced traveling within each type of terrain before the main route planning task.
During the planning task, participants received monetary bonuses on each trial that consisted of a fixed reward minus the cost of the route they traveled on that trial. A route R is composed of a series of sub-routes each of which lies within a kind of single terrain. We denote the distance traveled in the jth terrain by Ij and the cost per unit distance for that terrain as Cj. A route that visits n kinds of terrains in order can be summarized as a list R=(I1,C1;I2,C2;…;In,Cn) with overall cost

Participants were free to take any route from the starting point to the destination. We varied the geometric layout of the regions and cost ratio of travel in desert and field and compared participants’ actual routes to routes minimizing cost and thereby maximizing gain1. The route of least cost (and maximum gain) is unique, determined by the geometry and cost ratio of the two terrains. The costs and layout of the stimuli were chosen so that routes minimizing cost follow the pattern field-desert-field with n = 3.
We compared human performance to ideal performance maximizing gain by computing each participant’s efficiency, his or her actual winnings divided by the maximum winnings possible. In computing the maximum possible, we took into account each participant’s finger movement variability.
We were also interested in characterizing, in detail, the particular pattern of failure of each participant by investigating the participant’s use of or failure to use heuristics -- rules that are characteristic of optimal route planning. As we shall explain in detail in the Results, the optimal route should (1) only change direction when changing terrain and otherwise be straight (straight-line heuristic); (2) have a left–right flip if the terrains undergo a left–right flip (left–right symmetry heuristic, LR heuristic); and (3) have symmetry around the horizontal line bisecting the screen (up–down symmetry heuristic, UD heuristic). Each heuristic is a necessary but not a sufficient condition that a planned route maximizes gain. The pattern of the actual routes would reveal the use of, or failure to use, heuristics.
One last factor we considered is the participant’s assignment of subjective value or utility to costs and rewards imposed by the experimental task. The utility of a monetary gain or loss is typically modeled as a power function of the gain or loss (Luce, 2000, Eq. 3.18). We denote the exponential parameter of the utility function as α. For the specific terrain layouts in this experiment, there is a unique path minimizing cost weighted by utility for any choice of the utility parameter α. Conversely, if we assume that a participant is minimizing cost for some choice of α, then given the participant’s choices of path across experimental conditions, we can estimate the participant’s α.
Materials and Methods
Apparatus
Stimuli were presented in a dimly lit room on a 32′ Elo touch screen mounted in a Unistrut frame at 48° from the horizontal. The display was controlled by a Dell Pentium D Optiplex 745 computer using the Psychophysics Toolbox (Brainard, 1997; Pelli, 1997). Participants were seated at a comfortable viewing and touching distance about 37 cm away, wearing a single finger cut from a cloth glove to reduce the resistance of movement. A touch screen calibration procedure was performed for each participant before the experiment.
Stimuli
An example of the economic route planning task is shown in Figure 1B. The screen was 70 cm wide and 39 cm high. The starting point (in blue) and the destination (in gray), both circles of 0.8 cm radius, were 24 cm apart from each other on the vertical line bisecting the screen. The desert was a yellow or red textured area with two borders of quadric curves, symmetrical about a horizontal line bisecting the screen. The field was green and occupied the remaining area of the screen. The straight route from the starting point to the destination would pass through 6 cm of the field, then 12 cm of the desert, and then 6 cm more of the field.
On each trial, participants were required to place their index fingertip on the starting point and then move along the touch screen, maintaining contact, to the destination. The moving finger would leave behind a gray trace, and, once the finger arrived at the destination, the trace would turn blue. If the finger broke contact with the screen before the completion of the movement, the participant had to put the finger at the point where contact was lost (with an accuracy of 0.8 cm) to continue the trial.
Procedure and Design
The experiment took approximately an hour to complete and consisted of two phases: training and planning. For both phases, during the finger’s movement on the touch screen, the screen coordinates of the finger, (x, y), and the associated time, were recorded every 17 ms. There was no time limit imposed on initiating or completing the movement, either in training or in the main experiment.
Training
During training, participants were instructed to move their index finger along the touch screen in a straight line from a starting point to a destination, both of which were randomly chosen within a 60 cm × 24 cm rectangle area on the screen. During each trial, the entire screen either looked like field terrain (in green) or like desert (sandy in yellow or red). Participants were told that the traveling cost rates were 1, 3, and 5 points per cm, respectively for the field, yellow desert, and red desert. They were also told that similar terrains would be used in the planning phase, where 200 points would equal US$1.
Feedback of the length and the points of the actual trajectory were given after each trial. To encourage precise movement, if the length of trajectory in a trial exceeded 1.08 times of the linear distance between the starting point and destination, the trial would be repeated immediately. Both successful and unsuccessful trials entered later analysis.
The training gave participants practice in finger movement and allowed us to learn each participant’s motor variability. It also helped participants understand travel costs associated with different terrains.
Participants completed one training block for each type of terrain. The order for half of the participants was field, yellow desert, and red desert; for the other half, field, red desert, and yellow desert. The aimed distance could be 6, 12, 18, 24, or 30 cm. In each block, each distance condition had 10 repetitions. The training phase had 3 blocks × 5 distances × 10 = 150 trials in total.
Planning
Each trial began with the starting point on a green background. The desert and the destination (Figure 1B) appeared when participants put their finger on the starting point. The task was to move the finger on the screen from the starting point to the destination. Participants knew that they would receive a monetary reward if the cost of their trajectory was smaller than the cost of the straight route from the starting point to the destination. The amount of reward equaled to the difference of the two. The cost rates of terrains were the same as those they had learned in the training phase. No feedback was given for individual trials. The accumulated total of points for each block of 50 trials was reported after the block.
Two factors were manipulated: the geometry of the desert and the cost ratio of desert to field. The distance of the vertex of the desert to the vertical bisecting line, λ, could be 14, 18, 22, 26, or 30 cm. The cost ratio of desert to field was 3 (yellow) or 5 (red), as in training. The orientation of the desert was counterbalanced: the “sharp end” of the desert could be on the left (as in Figure 1B) or on the right (a left–right flip of Figure 1B).
There were six blocks, each for a single desert type. For half of the participants, the order of blocks was yellow, red, yellow, red, yellow, red; for the other half, red, yellow, red, yellow, red, yellow. In each block, trials of different λ and orientation were in random order, with each λ-by-orientation combination repeated five times. The planning phase had 6 blocks × 5 λ × 2 orientations × 5 = 300 trials in total.
Participants
Twelve participants, 18–32 years old, seven female and five male, participated. All had normal or corrected-to-normal vision and were not aware of the purpose of the experiment. Eleven of them were right-handed and one left–handed (P06). All used the index finger of the dominant hand for movements on the touch screen. The experiment had been approved by the University Committee on Activities Involving Human Subjects (UCAIHS) of New York University. All participants gave Informed consent prior to the experiment. They received US$12 per hour plus a performance-related bonus. Total payment ranged from US$29 to US$38.
Results
Unless otherwise stated, the significance level used was 0.05 with a Bonferroni correction for 12 participants (0.05/12 = 0.0042).
Influence of Motor Errors
Human motor errors might make the actual trajectory longer than the planned route. We estimated this influence based on data of the training phase, where participants were required to move their finger in a straight line. For each participant, we computed the length ratio of actual to straight of each trial, which we refer to as the actual-to-planned ratio. The mean actual-to-planned ratios, were 1.06, 1.01, 1.01, 1.02, 1.03, 1.03, 1.02, 1.01, 1.07, 1.04, 1.02, 1.06, respectively for Participants P01–P12. The ratio did not significantly vary with the aimed straight distance, according to a one-way ANOVA analysis for each participant.
Efficiency of Route Planning
Examples of the optimal route and the actual routes for one condition and one participant are provided in Figure 2A. To assess how close participants were to optimal, we defined efficiency as the monetary gain of the actual route divided by the maximum gain. The maximum gain is corrected for motor errors by multiplying the cost of the optimal route by the mean actual-to-planned ratio of the participant2. For each participant, we computed the efficiency for each trial and performed a two-tailed one-sample Student’s t-test to see whether the mean efficiency was different from 100%.
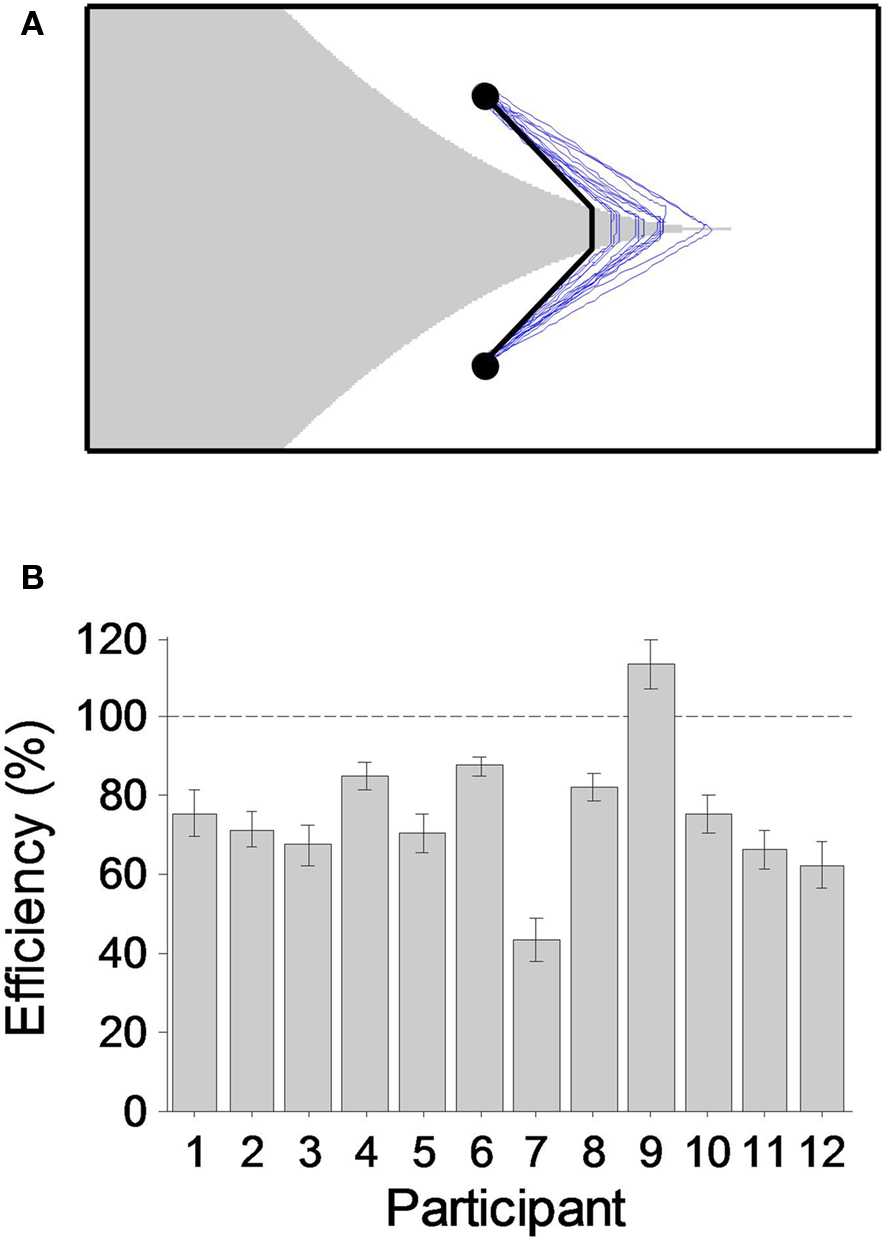
Figure 2. Efficiency of route planning. (A) Examples of optimal and actual routes. The condition shown had cost ratio 3:1 (yellow desert) and a λ value of 22 cm with the desert pointing to the right. The black trajectory is the optimal (minimum cost, maximum gain) route. The blue trajectories are Participants P02’s actual routes, trial by trial. (B) Mean efficiency for each participant. Efficiency was computed for each trial as the monetary gain of the actual route divided by the maximum possible gain. Efficiencies could exceed 100% because of a correction for motor error explained in the text. All participants were significantly sub-optimal except P09. Error bars mark 95% confidence intervals (with Bonferroni correction for 12 participants).
As shown in Figure 2B, all participants were significantly worse than optimal except P09. The median of the efficiency of the sub-optimal participants was 71%: for every $7 they won, they could have won about $3 more with better planning.
We tested whether participants’ efficiencies were improving during the experiment. The efficiencies of the first two, the second two, and the last two blocks for each participant were entered into a one-way ANOVA analyses. Only one participant (P01) had efficiencies that increased significantly in later blocks.
Use of Heuristics
A possible optimal route is illustrated in Figure 3A. We examined three underlying heuristics.
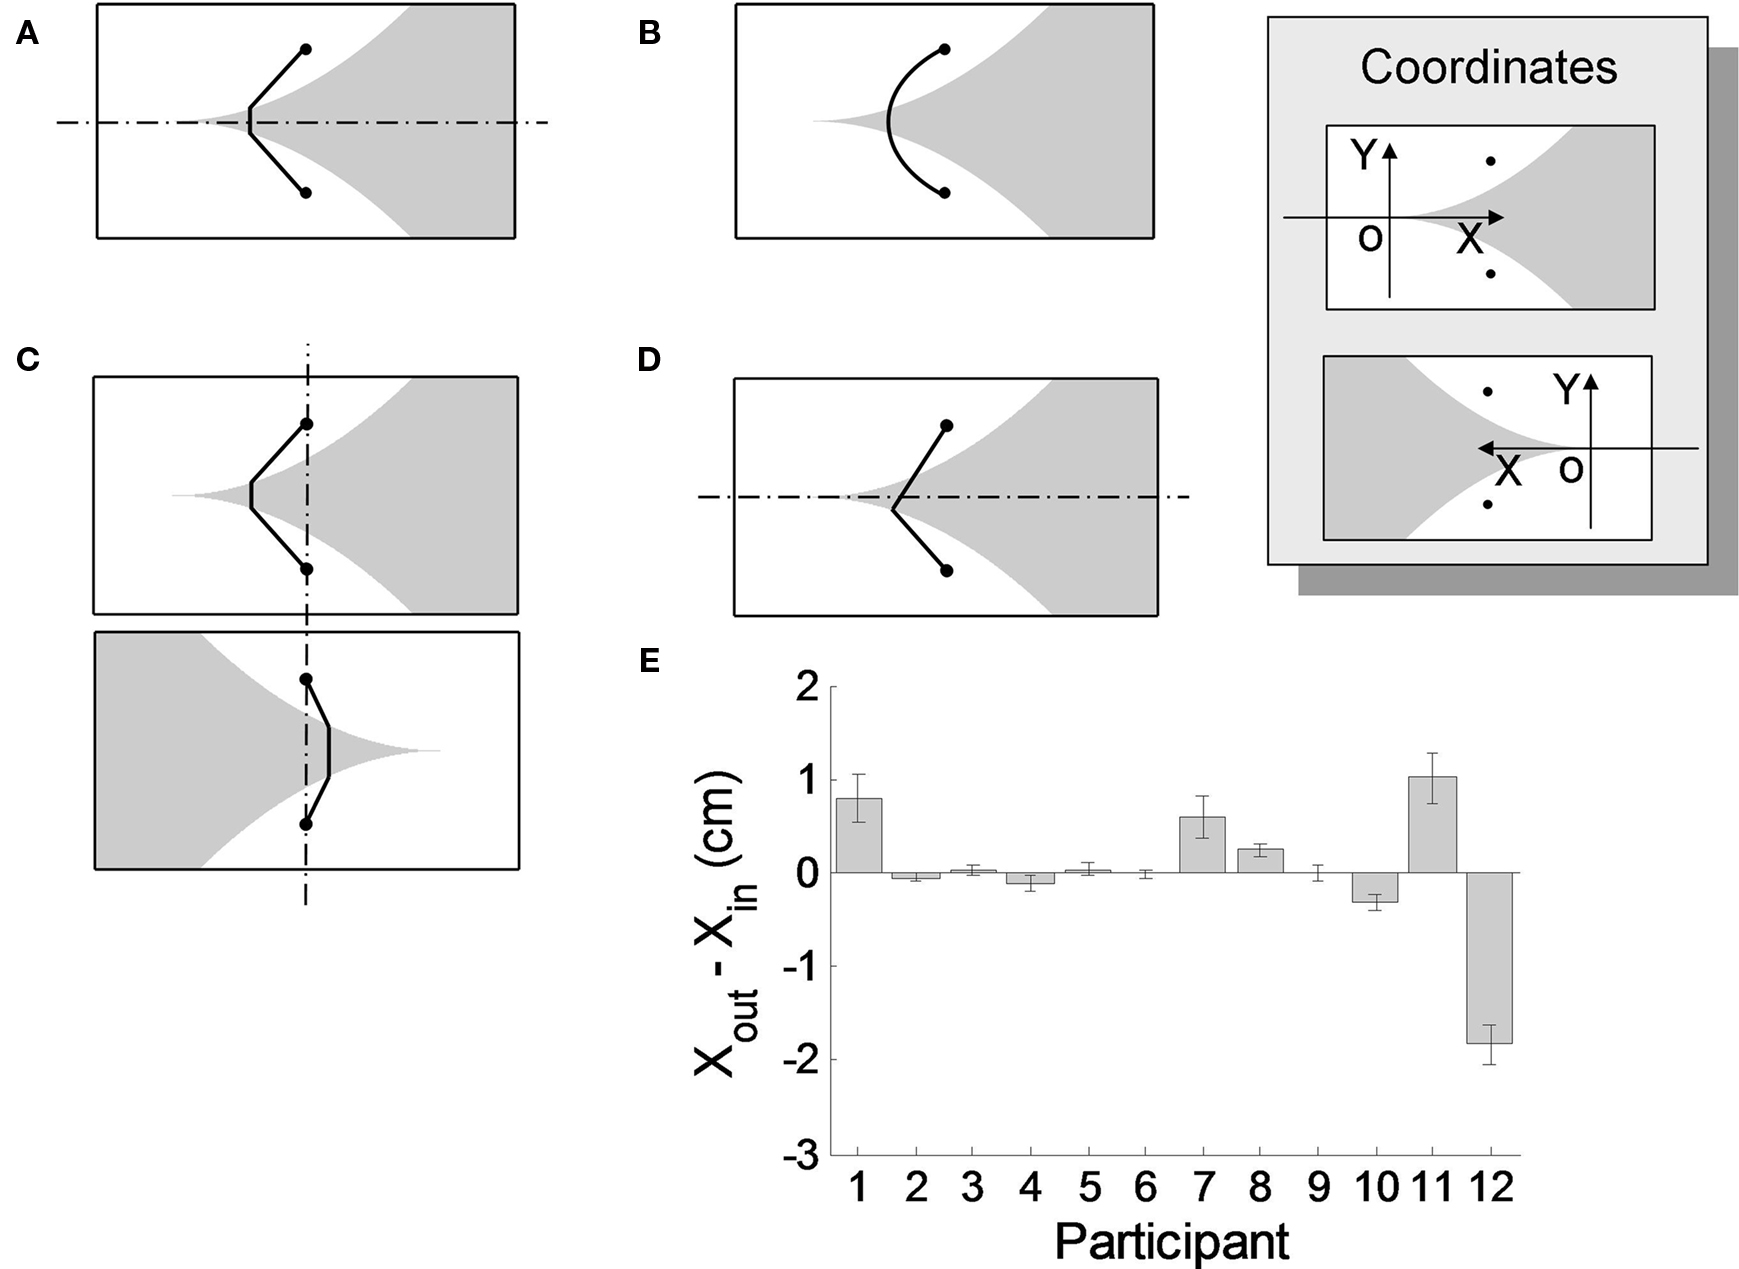
Figure 3. Use of heuristics. (A) A possible optimal route. The route illustrates two heuristics: the straight-line heuristic (within one type of terrain, the route should be a straight line, changing direction only when changing terrain), and the UD heuristic (the route should be symmetrical around the horizontal center line). (B) Hypothetical failure of the straight-line heuristic. Participants’ actual routes agreed well with the straight-line heuristic. (C) Hypothetical failure of the LR heuristic. Since the layout of the terrains of the lower panel is a left–right flip of that of the upper panel, the optimal route of one condition reflected around the vertical midline is always the optimal route of the other. The routes of one right-handed participant (P04) were significantly biased toward left. The routes of one left–handed participant (P06) were significantly biased toward right. See text. The performances of the other 10 participants were consistent with the LR heuristic. (D) Hypothetical failure of the UD heuristic. The path consists of two straight-line segments changing direction only at the lower edge of the desert. It is not symmetrical around the horizontal midline. (E) Index of the failure of the UD heuristic. A path consistent with the UD heuristic will enter and exit the desert at the same horizontal coordinate, Xin = Xout, traveling vertically through the desert. We plot the mean difference between ΔX = Xin − Xout for each participant. Perfect symmetry corresponds to zero difference. Seven of the 12 participants had differences ΔXsignificantly larger or smaller than zero, indicating a failure of symmetry. See text. Error bars mark 95% confidence intervals (with Bonferroni correction for 12 participants).
Straight-line heuristic
Since the shortest distance between two points is a straight line, it is intuitive that the optimal route should be a straight line within any single terrain. A curved route (Figure 3B) cannot be optimal.
For each participant, we examined whether the actual routes conformed to this straight-line heuristic. Given the points where an actual route intersected the desert, we could compute how long the route would be if it had the same intersecting points but accorded with the straight-line heuristic. We defined the actual length of the route divided by this would be length as the straight-line index. The mean straight-line indices were 1.06, 1.01, 1.01, 1.02, 1.03, 1.03, 1.02, 1.01, 1.07, 1.04, 1.02, 1.06, respectively for P01–P12. Taking into account motor error, we concluded that a participant failed the straight-line heuristic only if the mean straight-line index significantly exceeded his or her own actual-to-planned ratio measured during training. According to a one-tailed independent two-sample Student’s t-test, seven participants’ straight-line index was not significantly larger than their actual-to-planned ratio. For the other five, the difference, though significant, was small, resulting in an increase in route length no more than 2%. These small differences seemed to arise from an imperfect localization of the turning points at terrain borders. In summary, participants’ performances agreed well with the straight-line heuristic. Any deviations were small and had negligible effects on winnings.
This agreement made it simple to describe participants’ actual routes. Any route was determined by only two points, the points where the route entered and exited the desert. For convenience, we used their horizontal coordinates, denoted as Xin and Xout.
Left–right symmetry heuristic
In the experiment we had pairs of conditions whose layouts were just left–right flips of each other. Intuitively, the optimal routes should also be left–right flips of each other. Thus, the two routes in Figure 3C cannot both be optimal.
We tested the use of this LR heuristic by examining whether the routes in the left–oriented and right-oriented trials crossed the desert at flipped horizontal positions. For convenience, we changed the orientation of theX axis when we flipped the desert area around the vertical axis as shown in the inset to Figure 3.
A 2 (orientation) by 10 (2 cost ratios × 5 λ) ANOVA was run on (Xin + Xout)/2 for each participant. No interactions were significant. Only two participants had a significant main effect of orientation. The difference of (Xin + Xout)/2 between right-oriented and left–oriented trials gave a measure of their left–right bias. Participant P04 (right-handed) was biased 2.1 cm toward the left and the left–handed P06 was biased 0.9 cm toward the right.
We concluded that 10 out of 12 participants conformed to the LR heuristic.
Up–down symmetry heuristic
The starting point and the destination are symmetrically placed about the horizontal line bisecting the screen as are terrains. It is evident that the optimal route should have the same symmetry. Inspecting participants’ actual routes by eye, we identified one and only one patterned violation of the symmetry that we refer to as the one-turn bias (illustrated in Figure 3D). Instead of having two symmetric turns at the two desert borders, respectively, the route has only one turn, at one of the borders. During informal debriefings after the experiment, participants who had the one-turn bias commented that they did not make a second turn because “the shortest distance between two points is a straight line”. That is, the one-turn bias was a result of a misuse of the straight-line heuristic.
We computed the difference between Xin and Xout as an index of symmetry (Figure 3E). A one-tailed one-sample Student’s t-test was performed on the difference for each participant. Seven participants’ differences from zero were significant, implying a use of the one-turn bias. For the remaining five participants we could not reject the hypothesis that the routes they planned were symmetric.
We expected that the one-turn bias would reduce the participant’s monetary gain in the route planning task. Other things equal, it might be that the larger the difference between Xin and Xout, the lower the participant’s efficiency. To test this, we computed the Pearson’s correlation between the absolute value of the difference between Xin and Xout and the efficiency for the 12 participants, r = −0.46, p = 0.13. The correlation was negative as expected but failed to reach significance probably because the number of participants (12) was small so that the effects of their differences in other aspects, e.g., the utility function (discussed next), made the effect of the one-turn bias less visible.
Models of Utility
All but one participant failed to choose the least costly routes and half of the participants even failed to have symmetrical routes. However, the routes they planned did vary systematically with cost ratio and λ.
We considered the possibility that the systematic failures of route planning that we observed were due to non-linearities in participants’ utility functions. Following (Luce, 2000, Eq. 3.18), we modeled the utility function for losses as a power function with parameter α.
The actual routes across the desert were made up of three line segments3 R = (If1,Cf1;Id,Cd;df2,Cf2). Where If1, Id, If2 respectively denote the lengths of the segments from the starting point to desert, within the desert, and from desert to the destination, Cf and Cd denote cost rates of the field and the specific desert (Cd/Cf is the cost ratio), and α is a free parameter.
We formulated two models of utility for the economic route planning task. The two models differed in how the task was framed (Kahneman and Tversky, 1979). In the first model, the perceived total cost of a route was assumed to be the sum of the cost of each segment transformed by the utility function.

In the second model, the perceived total cost was the cost of a route that is of the same total length but is entirely in the field plus the extra cost of the segment that is in the desert,

These two models and possible framings are not exhaustive, but they are plausible. The former model regards the desert and the field as separate cost sources, while the latter model counts the cost of the desert as added to that of the field4. We refer to the models as the separate cost model and the added cost model, respectively. The three heuristics discussed above still correspond to necessary properties of the optimal path under either model.
Participants planned routes that were either up–down symmetrical or one-turn. In either case, the route could be captured by one variable, which we referred to as Xplan. For up–down symmetrical routes, we define Xplan = (Xin + Xout)/2; for one-turn routes, we define Xplan = min(Xin + Xout), that is, the horizontal coordinate of the turning point.
Concerning whether the route is up–down symmetrical or one-turn and whether the separate or added cost model is used, we now have four alternative models for the perceived cost: Symmetrical-Separate (SS), Symmetrical-Added (SA), One-turn-Separate (OS), One-turn-Added (OA). In each model, the perceived cost could be expressed as a function of the route parameter Xplan together with the utility parameter α.
We assume that in each specific condition of cost ratio and λ, participants chose the Xplan that minimized the perceived cost of the route. For each participant, we fitted the actual Xplan of the 10 conditions (2 cost ratio × 5 λ) with the four models one by one in the least-squares method. We set an upper limit of 3 for the fitted α since larger values produce little change in predicted behavior. As an index of goodness of fit, the proportion of data variance explained by each model is shown in Table 1. The maximum proportion of each participant is highlighted in bold. Except P12, all the maximum proportions were above 0.7, with a median of 0.85.
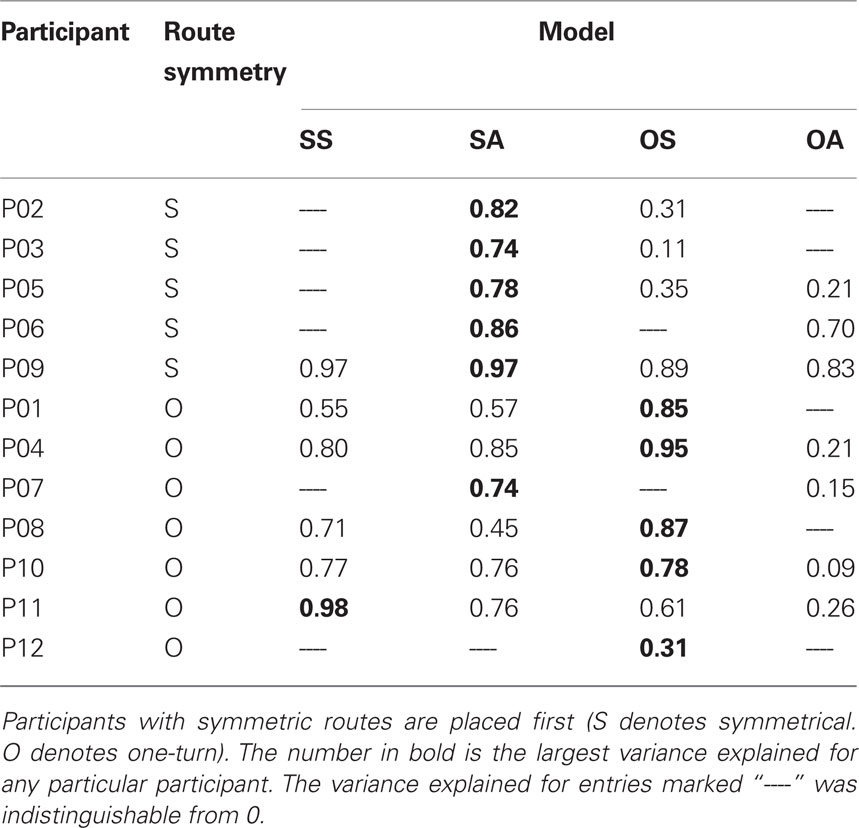
Table 1. Proportion of variance explained by different utility models.
We found that most participants’ choice of symmetrical or one-turn routes was consistent with their best model. For example, for P02 who had symmetrical routes, symmetrical model SA was the best model, which accounted for 82% of the variance. All the five participants with symmetrical routes was best fit with the SA model (which assumes a symmetrical route). Five of the seven participants with one-turn routes were best fit with the OS model (which assumes a one-turn route). This agreement validated our assumptions about the utility function. For the two participants who exhibited the one-turn bias but were best fit by a symmetrical model, we conjecture that they used the symmetrical model as an approximation to the one-turn model during the planning, possibly because the latter was easier to imagine.
Figure 4 shows the data and best fit of Xplan for each participant. The estimated α was less than one for five participants and greater than one for the remaining seven. We will discuss the interpretation of α in the Discussion.
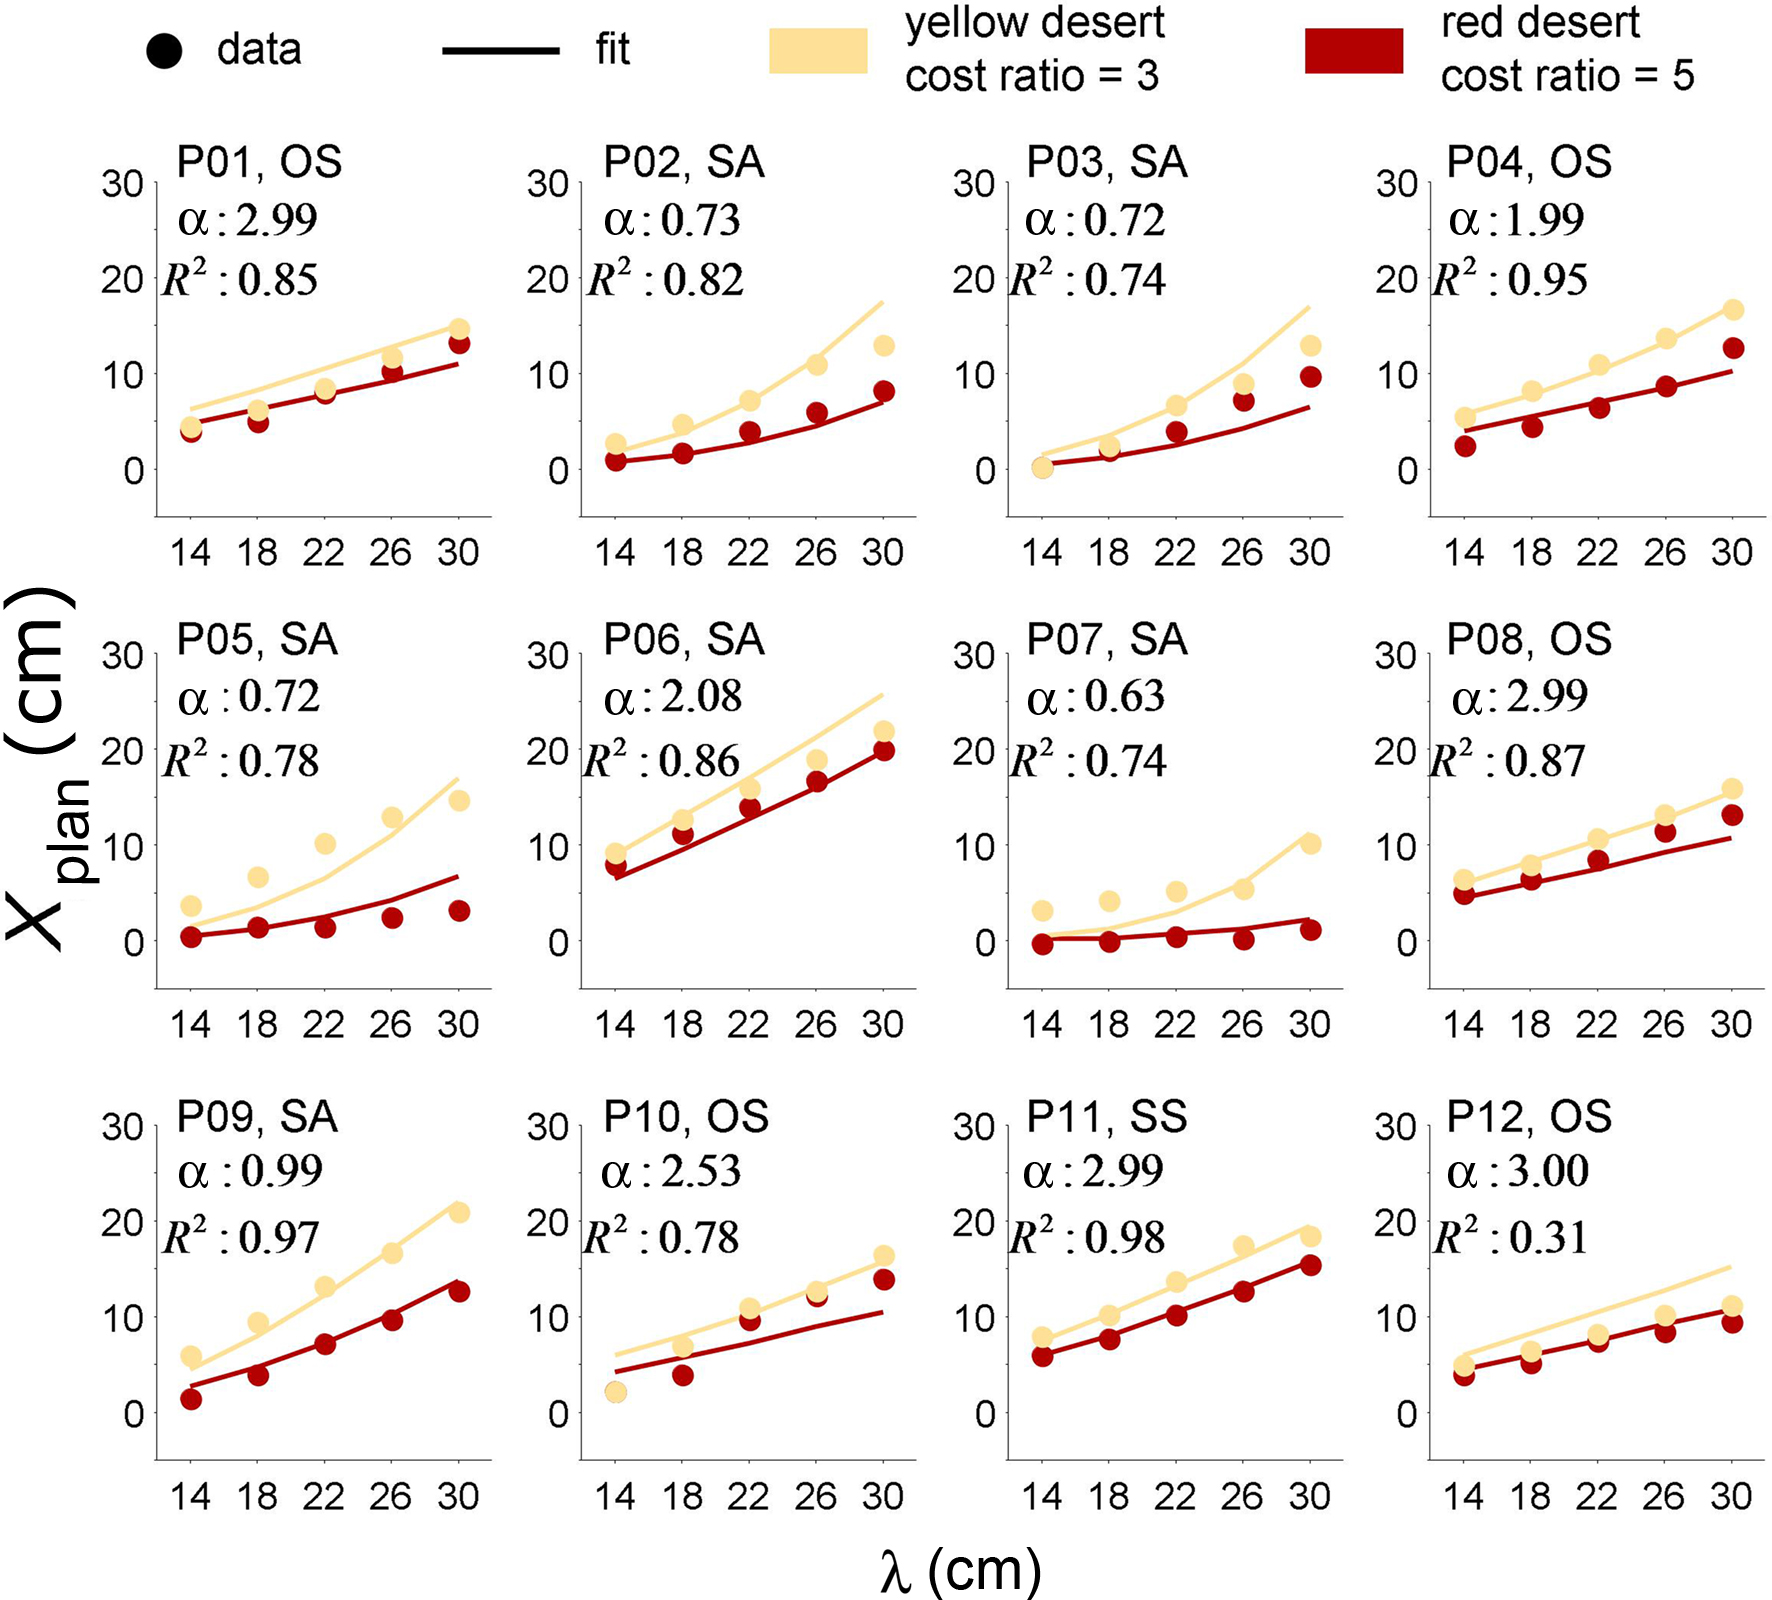
Figure 4. Fit of utility model. The mean of the route parameter Xplan is plotted against λ. Yellow and red respectively correspond to cost ratios of 3:1 and 5:1, respectively. Dots denote data. Lines denote the model fit to data. Each panel is for one participant. The model shown for each participant is labeled as one of OS, OA, SS, SA. See text. It is the model that with the highest variance accounted for (R2) for that participant. The R2 is also shown. For models SS and SA. the models that assume symmetrical routes with three segments, Xplan denotes (Xin + Xout)/2, where Xin, Xoutare the horizontal coordinates of the position where each route enters and exits the desert, respectively. Models OS and OA are based on one-turn routes that violate symmetry. For these models, Xplan denotes Xtum, the horizontal coordinate of the single turning position. The free parameter of the utility function, α, estimated from the data for each participant, is shown. See text for full descriptions of the models.
Biological Costs
It is possible that some of the participants chose a sub-optimal route or make only one turn because it would take less motor effort or require a shorter planning or movement time than would the optimal route. That is, participants might be trading off external economic costs with internal biological costs of effort or time (Trommershäuser et al., 2003a,b). We exclude these possibilities below.
Distance traveled
One possibility is people would prefer to travel a shorter distance. If so, we would expect that the lengths of the actual routes would be shorter than the optimal routes. To test this prediction, we computed the length ratio of actual to optimal route for each participant and each trial and divided it by the mean actual-to-planned ratio of the participant to correct for motor errors. The corrected length ratio of actual to optimal was predicted to be over than one. The mean corrected length ratios were 1.04, 1.20, 1.23, 1.05, 1.20, 0.84, 1.37, 1.02, 0.97, 1.06, 0.98, and 1.07, respectively, for P01–P12. We tested whether each participant’s length ratios were significantly less than 1 and found that only two participants’ (P06 and the optimal P09) corrected length ratio was significantly smaller than one. Therefore, less effort associated with a shorter moving distance was unlikely to be an explanation of route planning sub-optimality.
Time used
In each trial, the desert and destination appeared as soon as the participant put his finger on the starting circle of 0.8 cm radius. Movement initiation was defined as the time when the participant moved his finger out of the starting circle. We computed the time interval from stimuli appearance to movement initiation as the planning time and that from movement initiation to the time when the finger arrived at the destination as the movement time. Trials in which the finger lost contact with the screen before the completion of the movement were excluded from analysis (no more than 6% for any participant). The mean planning times were 3.14, 1.14, 2.32, 3.88, 1.10, 1.10, 1.28, 1.77, 2.37, 2.42, 2.53, and 1.16 s, respectively, for P01–P12. The mean movement times were 4.20, 2.18, 2.97, 1.85, 2.35, 2.47, 1.65, 2.49, 1.68, 3.50, 3.03, and 2.11 s, respectively, for P01–P12.
There was no time pressure in the experiment. If participants had an internal incentive to save time and this prohibited them from planning or executing the route of least economic cost, we might find that participants with higher efficiency had a longer planning or movement time. However, Pearson’s correlation analysis for the 12 participants revealed no significant correlation between efficiency and planning time, r = 0.33, p = 0.30, or between efficiency and movement time, r =−0.09, p = 0.79. We find no support for the conjecture that participants’ sub-optimal performances were the result of minimizing time spent on the task. Note that the optimal participant P09 had a mediocre planning time and a short movement time.
We also computed the Pearson’s correlation coefficients between the planning or movement time and the efficiency across trials for each participant. The correlation between the planning time and the efficiency was −0.24, 0.01, −0.06, −0.11, 0.01, −0.01, 0.02, 0.01, −0.08, 0.04, −0.27, −0.04, respectively for P01–P12, among which no positive correlations were significant. The correlation between the movement time and the efficiency was −0.24, −0.08, 0.03, −0.08, −0.28, 0.07, −0.14, −0.13, −0.28, −0.10, −0.31, −0.11, respectively for P01–P12. No positive correlations were significant. In summary, we see no indication of a tradeoff between time and efficiency.
Another possibility we explored was that participants used one-turn routes to minimize movement time. If true, we would expect a positive correlation between movement time and the absolute difference of Xin and Xout of each trial. The Pearson’s correlation between movement time and the absolute value of Xout − Xin across trials was −0.15, 0.02, 0.16, −0.04, 0.16, 0.17, −0.35, 0.16, −0.07, −0.01, −0.04, 0.01, respectively for P01–P12. Among them, only P06 had a significant but small positive correlation. However, since P06 did not exhibit the one-turn bias, the positive correlation probably rose out of chance. Thus the adoption of the one-turn bias was not the result of an attempt to minimize movement time.
Discussion
We designed an economic task to investigate how well humans plan routes across landscapes consisting of two different terrains (field and desert) that imposed different costs per unit distance on the traveler. The cost per unit distance of the desert was either three times greater that of the field (yellow desert) or five times greater (red desert). Participants received monetary rewards that depended on the routes they selected. They were motivated to find the least costly route.
Viewed in the abstract, we are investigating spatial cognition and human ability to reason geometrically (Gallistel, 1990). While our work builds on previous research ranging from that of Tolman (1948) to Shepard (1975), the economic route planning task we used allowed us to manipulate reward structures explicitly and evaluate both qualitatively and quantitatively the optimality of human performances. The use of reward structures to characterize terrain is highly innovative and at the same time it captures an important, and neglected, aspect of realistic navigational tasks in uneven terrain.
We first compared their performance to performance maximizing gain. We found that all but one participant failed to maximize gain (Figure 2B). Two thirds of the participants received more than 20% less than they might have earned with an optimal choice of route.
While there are tasks where human fail, notably in decision making under risk (Kahneman and Tversky, 1979; Luce, 2000) there are also tasks where they come close to maximizing expected gain, e.g., economic movement planning tasks (Trommershäuser et al., 2003a,b; Battaglia and Schrater, 2007; Dean et al., 2007). Certainly our task resembles the latter more than the former. Therefore it is surprising to find patterned failures in our task, given the past literature.
Participants’ failures were unlikely to be due to errors in estimating route length. People have been found to be very accurate in length estimation, whether for perceptually presented lines ranging from 1 cm to 1 m (Teghtsoonian, 1965), or for memory recall of large distances up to several kilometers (Gärling et al., 1991). Neither could the failure be attributed to motor errors, as we demonstrated in the Section “Results.” The errors represented failures to select routes that minimized cost across different terrains.
Optimal routes could be characterized by simple geometric properties that we refer to as heuristics. For example, an optimal route passing through terrain homogeneous in cost must be a straight line. Consequently, an optimal route must consist of a series of straight-line segments and can only change direction at boundaries between terrains differing in cost. We identified three heuristics including the straight-line heuristic just described, the LR heuristic, and the UD heuristic.
The evident usefulness of heuristics is to permit the traveler to narrow down the candidate routes before selecting the least expensive among those remaining. Our experimental design allows us to contrast overall maximization of reward and adherence to rules necessary but not sufficient for optimal performance.
We found that most participants correctly used the straight-line and LR heuristics. In real environments, with costs that gradually change across space, optimal routes are rarely straight lines. It is interesting that participants in our task, where maximum gain and maximum utility paths consist of straight-line segments, did select paths that were close to straight lines across uniform terrain.
However, almost half of the participants failed to follow the UD heuristic. Instead of choosing routes with two symmetrical turns at the borders of the desert, they chose routes with only one turn typically at an edge between field and desert (Figure 3D). As a consequence, one segment in the field and one segment in the desert were collinear, and comments during debriefing suggested that their failure was an over-generalization of the straight-line heuristic.
We also examined whether we could interpret participants’ failures as a consequence of assigning non-linear utilities to costs incurred in each terrain. The heuristics described above were also necessary characteristics of any route maximizing utility. We compared the individual fits of four possible models that differed in heuristics used and estimated the parameters of the utility function for each participant separately.
In studies using numerical lotteries, the exponential parameter of the utility function is estimated to be less than one for most people (Luce, 2000), which implies that people may prefer a single large loss to several small losses that sum to the same value as the large loss. For example, Thaler and Johnson (1990) found that 75% of people preferred losing $150 all at once to losing $100 and then $50. In our experiment, however, the number of participants with parameter values greater than 1 is slightly greater than the number of those with parameter values less than 1.
How would participants behave if they could actually walk within enlarged copies of our landscapes rather than just tracing a path? Previous research on route planning in full-scale landscapes has focused on the effect of impenetrable obstacles on route selection. The dynamical system model developed by Warren and colleagues (Fajen and Warren, 2003; Fajen et al., 2003) predicted routes in good agreement with human route selection while freely moving in landscapes with obstacles. The obstacle in their experiments was in the middle of the starting position and the destination. The predicted routes with obstacles deviated from those without obstacles only within a small range around the obstacle. That is, the walker would head straight toward the destination as if the obstacle was absent until he came very close to the obstacle. Their results suggest that routes are not fully planned ahead of time. While participants could readily plan each route as a whole in our experiment, the same cannot be said of the planning of extended routes in natural terrain.
In contrast to our results on the touch screen, the resulting routes described in Fajen and Warren (2003; Fajen et al., 2003) are typically curved and do not follow the straight-line heuristic even when alternative routes formed of line segments could be shorter and pass no closer to the obstacle. These deviations from linearity are possibly due to the absence of explicit costs on the length of the resulting route. It is plausible that participants prefer gently curved paths to piecewise linear paths with abrupt changes in direction due to the inertial costs associated with making sharp turns. If so, they may consider this biological cost (Trommershäuser, et al., 2003a,b) in planning routes and trade biological costs off against other costs. We conjecture that, with increasing costs per unit distance traveled, participants’ route will more and more resemble a joined series of straight lines as the relative importance of biological costs diminishes. Research is needed to see whether this prediction is borne out and to determine how to develop models that predict human performance in full-scale economic landscapes containing terrains differing in cost.
The economic navigation task described here provided us with a tool to probe visual cognition, the use of spatial heuristics and distortions of cost by human route planners. The unambiguously defined payoffs permitted us to uncover human fallacies that might not be accessible through other approaches.
Given the importance of navigation in human life, the investigation of possible fallacies in human navigation deserves the same attention as the fallacies in human cognition (Arrow, 1958; Tversky and Kahneman, 1974).
In the present study we examined human navigation in terrains with different costs associated with different terrains. We could certainly consider how the cost structure of the environment interacts with factors known to affect navigation such as external representation of spatial information (Zhang, 1997) or gender difference (Kim et al., 2007).
In terms of biological foraging, the costs we considered were analogous to energy and the optimal routes planned minimized “energy”. We could also consider route planning in environments where each unit of distance entailed a fixed risk. An animal traveling through heavily wooded terrain, for example, might avoid clearings precisely because crossing them entails a heightened risk of being observed by a predator, a risk that increases with time spent in the open. With this interpretation we could consider navigation problems where the terrain itself is uniform but the risks associated with different parts of the terrain are not, e.g., marine or aerial navigation (Hutchins and Lintern, 1995).
We have characterized human performance in terms of expected utility and adherence to heuristics, a computational theory corresponding to the first level of David Marr’s hierarchy (Marr, 1982). The next step would be to develop a detailed algorithmic description (Marr’s second level) of how humans plan routes across terrains differing in cost. As we noted above, heuristics serve to reduce the “search space”, but the question remains as to how humans select one route from among those that remain.
The current experiment captures important aspects of the structure of navigation tasks in realistic terrains. Given a map and asked to plan a route of a few kilometers across terrain varying in cost (see Figure 1), the participant would be engaged in a task very similar to ours. The geometric reasoning involved is an important aspect of visual cognition. We do not claim that our conclusions will necessarily generalize to speeded tasks similar to ours or large-scale tasks involving routes across hundreds of meters or kilometers. We conjecture that they will and, in any case, our work provides clear, testable hypotheses relevant to these richer, more complex problems.
Conflict of Interest Statement
The authors declare that the research was conducted in the absence of any commercial or financial relationships that could be construed as a potential conflict of interest.
Footnotes
- ^We refer to “maximum gain” and “maximum utility” rather than “maximum expected gain” or “maximum expected utility” since, except for a slight contribution from motor uncertainty, the cost or utility associated with a route is deterministic.
- ^Due to this correction, it is possible to get efficiencies greater than 100% if the participant’s trajectory, especially the part in the desert, was straighter in the planning phase than in the training.
- ^Even for those participants who exhibited one-turn bias we could model their path as three line segments two of which were collinear.
References
Battaglia, P. W., and Schrater, P. R. (2007). Humans trade off viewing time and movement duration to improve visuomotor accuracy in a fast reaching task. J. Neurosci. 27, 6984–6994.
Dean, M., Wu, S., and Maloney, L. (2007). Trading off speed and accuracy in rapid, goal-directed movements. J. Vis. 7, 1–12.
Di Fiore, A., and Suarez, S. (2007). Route-based travel and shared routes in sympatric spider and woolly monkeys: cognitive and evolutionary implications. Anim. Cogn. 10, 317–329.
Fajen, B. R., and Warren, W. H. (2003). Behavioral dynamics of steering, obstacle avoidance, and route selection. J. Exp. Psychol. Hum. Percept. Perform. 29, 343–362.
Fajen, B. R., Warren, W. H., Temizer, S., and Kaelbling, L. P. (2003). A dynamical model of visually-guided steering, obstacle avoidance, and route selection. Int. J. Comput. Vis. 54, 13–34.
Gallistel, C. R., and Cramer, A. E. (1996). Computations on metric maps in mammals: getting oriented and choosing a multi-destination route. J. Exp. Biol. 199, 211–217.
Gärling, T., Böök, A., Lindberg, E., and Arce, C. (1991). Evidence of a response-bias explanation of non-euclidean cognitive maps. Prof. Geogr. 43, 143–149.
Gärling, T., and Gärling, E. (1988). Distance minimization in downtown pedestrian shopping. Environ. Plan. A 20, 547–554.
Golledge, R. (1995). “Path selection and route preference in human navigation: a progress report,” in Spatial Information Theory: A Theoretical Basis for GIS, eds A. U. Frank and W. Kuhn (New York: Springer-Verlag), 207–222.
Janson, C. (2007). Experimental evidence for route integration and strategic planning in wild capuchin monkeys. Anim. Cogn. 10, 341–356.
Kahneman, D., and Tversky, A. (1979). Prospect theory: an analysis of decision under risk. Econometrica 47, 263–291.
Kim, B., Lee, S., and Lee, J. (2007). Gender differences in spatial navigation. World Acad. Sci. Eng. Technol. 31, 297–300.
Luce, R. D. (2000). Utility of Gains and Losses: Measurement – Theoretical and Experimental Approaches. London: Lawrence Erlbaum, 80–84.
MacGregor, J. N., Ormerod, T. C., and Chronicle, E. P. (2000). A model of human performance on the traveling salesperson problem. Mem. Cognit. 28, 1183–1190.
Marr, D. (1982). Vision: A Computational Investigation into the Human Representation and Processing of Visual Information. New York: Freeman.
Milton, K. (2000). “Quo vadis? Tactics of food search and group movement in primates and other animals,” in On the Move: How and Why Animals Travel in Groups, eds S. Boinski and P. A. Garber (Chicago: University of Chicago Press), 375–417.
Pelli, D. G. (1997). The videotoolbox software for visual psychophysics: transforming numbers into movies. Spat. Vis. 10, 437–442.
Säisä, J., and Gärling, T. (1987). Sequential spatial choices in the large-scale environment. Environ. Behav. 19, 614–635.
Shepard, R. N. (1975). “Form, formation, and transformation of internal representations,” in Information Processing and Cognition: The Loyola Symposium, ed. R. L. Solso (Hillsdale, NJ: Lawrence Erlbaum), 103–117.
Stephens, D. W., and Krebs, J. R. (1986). Foraging Theory. Princeton, NJ: Princeton University Press.
Thaler, R. H., and Johnson, E. J. (1990). Gambling with the house money and trying to break even: the effects of prior outcomes on risky choice. Manage. Sci. 36, 643–660.
Trommershäuser, J., Maloney, L. T., and Landy, M. S. (2003a). Statistical decision theory and the selection of rapid, goal-directed movements. J. Opt. Soc. Am. A 20, 1419–1433.
Trommershäuser, J., Maloney, L. T., and Landy, M. S. (2003b). Statistical decision theory and trade-offs in the control of motor response. Spat. Vis. 16, 255–275.
Tversky, A., and Kahneman, D. (1974). Judgment under uncertainty: heuristics and biases. Science 185, 1124–1131.
Valero, A., and Byrne, R. (2007). Spider monkey ranging patterns in Mexican subtropical forest: do travel routes reflect planning? Anim. Cogn. 10, 305–315.
Vickers, D., Butavicius, M., Lee, M., and Medvedev, A. (2001). Human performance on visually presented traveling salesman problems. Psychol. Res. 65, 34–45.
Wiener, J. M., Lafon, M., and Berthoz, A. (2008). Path planning under spatial uncertainty. Mem. Cognit. 36, 495–504.
Yost, J. A., and Kelley, P. M. (1983). “Shotguns, blowguns and spears: the analysis of technological efficiency,” in Adaptive Responses of Native Amazonians, eds R. B. Hames and W. T. Vickers (New York: Academic Press), 189–224.
Keywords: Bayesian decision theory, utility, optimality, heuristics, route selection, navigation, decision making
Citation: Zhang H, Maddula SV and Maloney LT (2010) Planning routes across economic terrains: maximizing utility, following heuristics. Front. Psychology 1:214. doi: 10.3389/fpsyg.2010.00214
Received: 16 August 2010;
Accepted: 10 November 2010;
Published online: 02 December 2010.
Edited by:
Dietmar Heinke, University of Birmingham, UKReviewed by:
Rick Thomas, University of Oklahoma, USABrett R. Fajen, Rensselaer Polytechnic Institute, USA
Copyright: © 2010 Zhang, Maddula and Maloney. This is an open-access article subject to an exclusive license agreement between the authors and the Frontiers Research Foundation, which permits unrestricted use, distribution, and reproduction in any medium, provided the original authors and source are credited.
*Correspondence: Hang Zhang, Department of Psychology, New York University, 6 Washington Place, 2nd Floor, New York, NY 10003, USA. e-mail: hang.zhang@nyu.edu