
- Boulder Center for Neurotechnology, Science Applications International Corporation, Louisville, CO, USA
Event-related potentials (ERPs) have been used extensively to study the processes involved in recognition memory. In particular, the early familiarity component of recognition has been linked to the FN400 (mid-frontal negative deflection between 300 and 500 ms), whereas the recollection component has been linked to a later positive deflection over the parietal cortex (500–800 ms). In this study, we measured the ERPs elicited by faces with varying degrees of familiarity. Participants viewed a continuous sequence of faces with either low (novel faces), medium (celebrity faces), or high (faces of friends and family) familiarity while performing a separate face-identification task. We found that the level of familiarity was significantly correlated with the magnitude of both the early and late recognition components. Additionally, by using a single-trial classification technique, applied to the entire evoked response, we were able to distinguish between familiar and unfamiliar faces with a high degree of accuracy. The classification of high versus low familiarly resulted in areas under the curve of up to 0.99 for some participants. Interestingly, our classifier model (a linear discriminant function) was developed using a completely separate object categorization task on a different population of participants.
Introduction
The neural substrates of recognition, an essential aspect of declarative memory, have been extensively studied with the use of event-related potentials (ERPs). Many of these studies attempt to dissect the two phenomenologically distinct processes involved in recognition: familiarity and recollection (Yonelinas, 2002; Yovel and Paller, 2004; Guo et al., 2005; Curran and Hancock, 2007; MacKenzie and Donaldson, 2007). A commonly accepted definition of familiarity is the sense of having previous experience with the probe stimulus (e.g., person, object, word) without any accompanying contextual information as to the nature of the previous encounter. Recollection, on the other hand, is when the memory of the probe stimulus is accompanied by contextual or associative detail. The neural correlates of familiarity have been linked to the early mid-frontal negativity (FN400) in the ERP. Specifically, the amplitude of the negative deflection between 300 and 500 ms is less for familiar as compared to novel stimuli (Rugg et al., 1998; Curran, 2000). Recollection, by contrast, has been linked to a later positive component over the central–parietal cortex. This positive deflection, between 500 and 800 ms, is greater for stimuli that have been consciously recollected (Smith, 1993). However, there is still an ongoing debate as to whether or not these ERP components are a reflection of two distinct neural processes (Yonelinas, 2002; Paller et al., 2007). In addition, the influences of conceptual priming (Voss and Paller, 2006; Voss et al., 2008, 2010) make some prior research on this question difficult to interpret.
For the purpose of this study we used the early (300–500 ms) and late (500–800 ms) windows, associated with familiarity and recollection respectively, as a means to quantity the gradations in the recognition response. Specifically, how does the magnitude of the recognition response change with the level of experience? And, does this change affect both early and late components in a similar fashion? Here, to manipulate level of experience with the stimuli, we used color photographs of faces from three distinct categories: novel individuals, famous persons or celebrities selected by the participant, and personal friends and family provided by the participant. In this way, we were able to quantify the effect of experience or knowledge of the depicted individual on the recognition response. While this study does not explicitly dissociate the neural processes involved in familiarity and recollection, the magnitude of the evoked responses (within the early and late integration windows) do have implications for the competing models of recognition.
In addition to this conventional analysis of the ERP, we also wanted to determine how accurately the recognition response could be classified on a single-trial basis. To accomplish this, we integrated the face stimuli into a real-time system that classifies the evoked response elicited by each stimulus, based on a linear model of the neural response pattern. The motivation for this approach stems from a potential application of the recognition response toward a novel brain–machine interface (BMI). BMI technologies often utilize the visual categorization response for binary output or classification (Parra et al., 2002; Sellers et al., 2006). An example of this is a rapid presentation of images or letters for which each P300 is classified as a “yes” or “no” response. This response can then be used to identify relevant objects in a stream of imagery or to select letters for building a word or phrase. Here, we sought to use a similar experimental paradigm to further quantify the recognition response. Specifically, can the recognition response be identified in a continuous presentation of faces where explicit recognition of each face is not required?
This unorthodox approach to measuring the recognition response utilized the rapid serial visual presentation (RSVP) paradigm (Chun and Potter, 1995). In this paradigm the participant viewed a continuous stream of rapidly presented faces for several minutes. The task was simply to identify, via button press, a small number of target faces from amongst the ensemble of images. There was no explicit study phase beyond the imagery that was provided by the participant. Likewise, there was no explicit test phase where the participants indicated which faces they recognized. Despite the less controlled nature of this study (relative to the prior research) we were able to clearly identify the recognition response both at an aggregate and trial-by-trial level.
Materials and Methods
Participants
Twenty-two individuals participated in the experiment for payment of $20 per hour. The participants (17 female and 5 male) ranged in age from 22 to 53, with a mean age of 28. Participants were both right-handed and left-handed (19 right-handed, 3 left-handed). Five of the 22 individuals participated in a second, experimentally identical session roughly a week after the initial session. None of the participants were excluded from the analysis due to noise (bad channels), movement artifacts, or low behavioral accuracy. However, the real-time classification system did exclude individual trials based on pre-defined noise and movement artifact thresholds.
Stimuli
Stimuli consisted of 256 × 320 pixel color photographs of single faces that were manually centered, scaled, and cropped. The eyes were centered just above the midline and the entire face was contained within the cropped region. Photographs were excluded from the experiment if the face was obscured by sunglasses, hats, or costumes. Novel faces, both male and female, were obtained from the Flickr Creative Commons database1. All 447 novel faces were used in every experiment. Famous faces of movie stars, singers, or celebrities were obtained from Getty Images2. There were 79 famous females and 80 famous males in total. Participants were allowed to select the 20–30 most familiar individuals, roughly balancing for gender. The average number of faces selected by the participant was 24.6 ± 4.5 (std). Personal faces were obtained from each participant prior to the experimental session. On average, 15.7 ± 4.1 faces provided by the participant met the above criteria and were included in the experiment. The target faces were the three most recent presidents (Obama, Bush, and Clinton), which were shown to the participant prior to the experiment.
Procedure
The participants were seated in front of a computer monitor at a distance of approximately 100 cm. All images were displayed at the center of the monitor and subtended a visual angle of about 7° horizontally and 9° vertically. The experiment consisted of 10–14 blocks, each containing roughly 200 faces presented in rapid sequence (i.e., the RSVP paradigm). Each face was presented in random order for 500 ms and there were no breaks between faces. The variation in block number was due to the dynamics of the real-time system. If the response corresponding to a particular face presentation contained EEG artifacts (blinks, eye movement, etc.) that face was then re-queued for subsequent presentation. The experiment was complete when all faces were shown to the participant, artifact free, at least four times. Participants were instructed to fixate at the center of the monitor and respond, via button press, when they saw a target face (Presidents Obama, Clinton, or Bush). There was a pause at the end of each block and the participant started the next block at their discretion. Thus, the participants experienced approximately 2 min of RSVP, followed by a self-paced rest period.
EEG Recording
Scalp EEG was collected with a 128-channel HydroCel Geodesic Sensor Net™ (Electrical Geodesics, Inc., Eugene, OR, USA) connected to an AC-coupled 128-channel, high-input impedance amplifier (200 MΩ, Net Amps™, Electrical Geodesics, Inc.). Individual sensors were adjusted until impedances were less than 50 kΩ. Amplified analog voltages (0.1–100 Hz bandpass) were digitized at 250 Hz and then low-pass filtered at 40 Hz. Recorded voltages were initially referenced to a vertex channel. Trials were excluded from analysis if they contained eye movements (vertical electro-oculogram channel differences greater than 70 μV) or more than five bad channels (changing more than 100 μV between samples, or reaching amplitudes over 200 μV). Data from individual bad channels were replaced using a spherical-spline interpolation algorithm. An average-referenced transform was then used for subsequent ERP analysis. All ERPs were baseline-corrected to a 100 ms pre-stimulus recoding interval.
Real-Time Classification
The real-time classification of the EEG signal was accomplished through analysis of the evoked response following the presentation of each face. The goal was to find a linear combination of the components of the signal that most reliably discriminated between the responses to familiar or recognized versus novel faces. Classification was initially performed using a standard or general model. This linear model was developed from the responses of multiple participants in a prior study (Curran et al., 2009; Touryan et al., 2010) examining the P300 object classification signal (Thorpe et al., 1996). Individualized or custom models were also developed for each participant using only that participants data. Below we describe the feature selection process (Perkins et al., 2003) we implemented to develop the linear models (both general and custom) used in the real-time EEG classification.
For each trial, N features are generated, giving a feature vector x ∈ RN. The basic machine learning approach is to find a discriminant function f : RN ↦ R that maps the features x into the probability that the trial was caused by one of two stimulus classes. For recognition, we define the classes as familiar and unfamiliar. Here, the probability of recognition, given the data vector x and a discriminant function f(x), is

The probability of non-recognition is

Thus if f(x) is large and positive, the probability of recognition is near one, and if f(x) is large and negative, the probability of recognition is near zero. The midpoint f(x) = 0 corresponds to a probability of recognition of 1/2 and is used as the dividing line between the classes.
We use the following linear discriminant function to distinguishing between recognized and unrecognized trials:

where N is the number of features and wi is the weight of the ith feature. This collection of weights represents the linear model that separates the two classes by means of a hyperplane. The goal then is to find the collection of weights that maximally separates the two classes. To accomplish this, a dataset is built from the initial experimental session. These sessions include repeated presentations of all faces (novel, famous, and personal) in random order. The session data is decomposed into a set of feature vectors:  for the familiar or recognized faces, and
  for the unfamiliar faces. The session is then randomly and iteratively split into separate training and validation portions. The training data is used to find a set of weights which are then applied to the feature vectors in the validation data. The linear model is then applied to any subsequent experimental session for that participant.
An important factor to consider with dense array EEG (128 channels at 250 Hz) is the large number of features in each evoked response. Since every channel contains some noise, it is easy to find a set of weights that perfectly fits the training data, but gives poor results on the validation data or subsequent sessions. Thus, a model is more robust if the majority of weights wi are zero, so that only the most important (and stable) features are used. The approach described by Perkins et al. (2003) is to penalize any non-zero wi. Specifically, the weights are found by minimizing the regularized empirical risk function
where λ1 and λ0 are regularization constants. The first two terms in the empirical risk function are the logarithms of the probability that the training set is correctly classified. The λ1 term favors features where small values of wi distinguish well between the classes. The λ0 term simply counts the number of non-zero weights.
Given a fixed set of non-zero weights, L(wk) can be minimized using standard function minimization, while ensuring that any weight that was initially zero remains at zero. A concurrent greedy strategy decides which of these zero weights (if any) should be allowed to vary by choosing the weight with the largest value of |∂L/∂wi|. This weight is then added to the set of non-zero weights, and L(wk) is again minimized. The algorithm begins by allowing only w0 to vary, then iteratively finding the zero weight with the largest |∂L/∂wi| to add to the empirical risk function. This process is repeated until no more weights can be added. The purpose of the λ0 term (for this study λ0 = 10−6) is to force any wi that is very near zero to be precisely zero. Conveniently, L(wk) is a convex function (ignoring the λ0 term), so the only minimum is a global minimum.
Classifier Features
For each evoked response, a large number of features are generated by first linearly transforming the raw EEG signal using principal components analysis (PCA), and then calculating windowed fast Fourier transforms (FFT) for a variety of window sizes and starting times relative to the stimulus onset. We typically include window sizes of w = 128, 256, and 512 ms in the feature set. For memory capacity reasons, features corresponding to frequencies greater than 25 Hz are discarded. All other non-zero frequency components are split into real and imaginary parts. For each epoch, the features for all times, window sizes and frequencies are assembled into a large feature vector x ∈ RN.
Results
The experimental task used in this study (Figure 1) is a simple extension of the traditional RSVP target-detection paradigm (Chun and Potter, 1995). Here, participants had little difficulty detecting the target faces (Presidents Obama, Bush, and Clinton) from amongst the other faces, both familiar, and novel. However, due to the presentation speed (2 Hz) and block duration (2 min), participants reported difficulty in responding to a target face in time (i.e., before the next face appeared). This is likely the primary reason that behavioral performance was not at ceiling. Over the population of 22 participants, the average accuracy for the behavioral response was 81% with high and low scores of 92 and 60.4%, respectively. The average reaction time was 598 ± 53 ms (std).
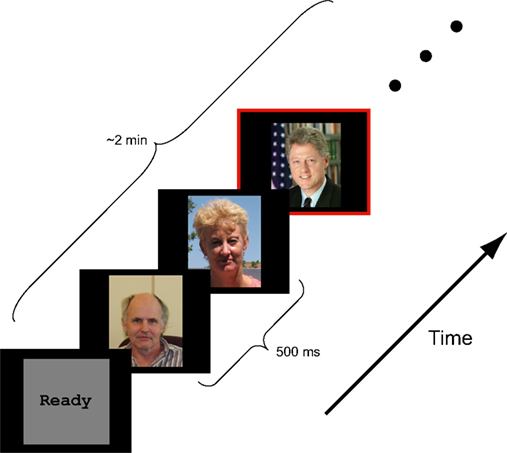
Figure 1. Schematic representation of experimental design. Color photographs of faces were presented in a rapid serial sequence (500 ms per face). Participants were asked to respond, via button press, only when a target face (Presidents Obama, Bush, and Clinton) appeared. Besides the target face, the stimulus ensemble included faces of novel individuals, famous persons selected by the participant and personal friends and family provided by the participant.
ERP Results
Initial analysis focused on spatial regions of interest (ROIs) that were used in previous studies (Yovel and Paller, 2004; Curran and Hancock, 2007). In particular, we analyzed the same channel groups as Curran and Hancock (2007). The two anterior, superior channel groups located near the standard F3 and F4 sites were labeled LAS and RAS (see Figure 2 montage overlays). The two posterior–superior channel groups, which included the standard P3 and P4 sites, were labeled LPS and RPS. Both the familiarity response, or FN400, and recollection response we analyzed over all channel groups. Here the early familiarity response was analyzed from 300 to 500 ms, whereas the recollection response was analyzed from 500 to 800 ms. The increased time window (300 ms) for the recollection response was to compensate for the initial visual response elicited from the following stimuli (presented 500 ms after stimulus onset). Figure 2 shows the average ERPs for each channel group. In agreement with previous studies (Curran and Hancock, 2007; MacKenzie and Donaldson, 2007), the anterior groups (LAS and RAS) showed a greater difference in the early familiarly response as a function of stimulus class (novel, famous, personal) relative to the posterior groups (LPS and RPS). For the later recollection response, all channel groups showed a clear differentiation with stimulus class. Average amplitudes for each channel group are detailed in Table 1.
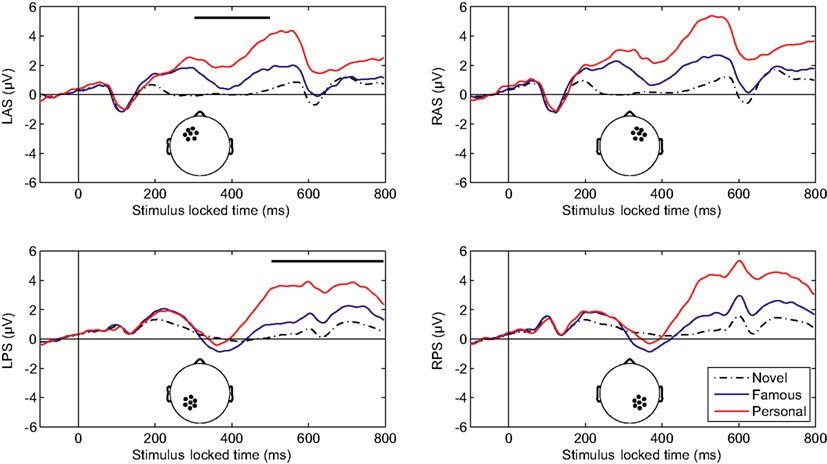
Figure 2. Averaged-referenced, grand-averaged ERPs for depicted channel groups. L, left; R, right; A, anterior; P, posterior; S, superior. Thick overlaid bars in the left column indicate the early (upper) and late (lower) temporal integration widows.
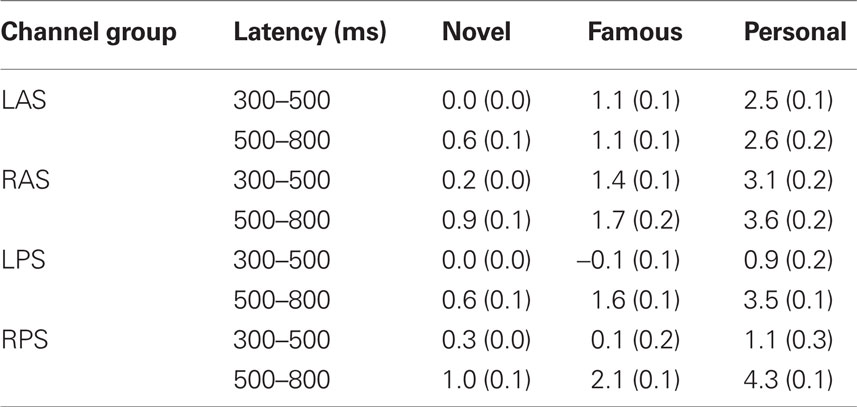
Table 1. Amplitude means and SE.
We compared the mean amplitudes of the frontal LAS and RAS channel groups during the 300–500 ms window. A repeated-measures analysis of variance (ANOVA) with condition (novel, famous, personal) *hemisphere indicated a main effect of stimulus type [F(2,42) = 46.23, p < 0.001]. A within-subjects contrast confirmed a significant effect between novel and famous faces [F(1,21) = 23.57, p < 0.001] as well as between personal and novel/famous faces [F(1,21) = 58.13, p < 0.001]. There was no significant hemispheric difference in the LAS and RAS mean amplitudes [F(1,21) = 3.67, p = 0.07]. Likewise, there was no significant interaction effect between condition and hemisphere [F(2,42) = 2.33, p = 0.11]. This result confirms previous research describing the effect of face familiarity on ERP amplitudes over the frontal cortex during the 300–500 ms time window (Curran and Hancock, 2007).
One important difference with our results is the exaggerated effect due to level of familiarity with the particular individual in each stimulus (i.e., faces of friends and family elicited the largest response). To quantify this we calculated the Pearson’s correlation coefficient between mean amplitude and stimulus type. Specifically, we calculated the correlation coefficient between stimulus type, sorted from least to most familiar (i.e., novel–famous–personal), and mean amplitude across all participants and each channel group: r = 0.445, p < 0.001. This indicates that a substantial part of the variance in the mean response is due to stimulus type, or level of familiarity with the stimulus, in addition to individual differences and scalp topography. Typically, familiarity with the stimulus set is carefully controlled during a study phase where participants associate a novel face with some attribute (Yovel and Paller, 2004; Curran and Hancock, 2007; MacKenzie and Donaldson, 2007). This process constrains familiarity with the stimulus to that specific laboratory setting, thereby limiting the strength of subsequent recognition. By using faces of individuals previously known to the participant, we have maximized the amplitude effect and validated the phenomenon in a more realistic context.
The mean amplitudes of the parietal LPS and RPS channel groups were compared over the later 500–800 ms window. Again, a repeated-measure ANOVA with condition (novel, famous, personal) *hemisphere indicated a main effect of stimulus type [F(2,42) = 50.68, p < 0.001]. Within-subjects contrasts were also significant at all levels [novel versus famous F(1,21) = 24.37, p < 0.001; personal versus novel and famous F(1,21) = 58.48, p < 0.001]. The parietal channel groups did show a significant hemispheric difference [F(1,21) = 5.38, p < 0.05] with a larger mean amplitude over the right (RPS) channel group. However, there was no significant interaction effect between condition and hemisphere [F(2,42) = 2.34, p = 0.11]. Again, this result confirms and extends the prior work on the recollection response. As with the earlier FN400, the magnitude of the later parietal response is significantly correlated with level of familiarity (r = 0.554, p < 0.001; Pearson’s correlation). Importantly, this parietal recognition response was preserved even with the addition of the early visual response elicited from the following stimulus.
To compare the broad topography between the early and later windows, we again computed the mean amplitudes within the four channels groups shown in Figure 2. In this instance however, we used vector normalization (McCarthy and Wood, 1985) and only considered the ERPs associated with the personal stimulus category. Specifically, the average amplitudes for each participant were calculated for the early and late windows described above. These amplitude distributions were normalized, creating 128 dimensional vectors with unit length. The montage averages were then re-calculated using these normalized distributions. Repeated-measures ANOVA indicated that the early and late scalp distributions were significantly different. Both the time (300–500, 500–800 ms) *hemisphere interaction, F(1,21) = 12.85, p = 0.002, and time *anterior/posterior interaction, F(1,21) = 53.78, p < 0.001, show a significant effect. This result is consistent with separate-source theory of familiarity and recollection (Yonelinas, 2002; Curran and Hancock, 2007).
Linear Classifier
In addition to the post-experiment ERP analysis described above, the participant’s neural response was scored via a classification algorithm, in real-time, after each stimulus presentation (see Materials and Methods for details). In our case, the classifier consisted of a linear discriminant function that was applied to the evoked response to generate a score for each face. Figure 3 shows the grand-average topographic ERP for personal faces and the general classifier model overlaid on the same ERP. Essentially, the model is a set of linear weights applied to each channel at each time point in the evoked response. The weighted evoked response is then summed to generate the score. Here, the general model (used in every participant’s initial session) primarily isolates regions over the parietal cortex during the later epoch of the evoked response (500–600 ms). These spatial–temporal regions align well with the maximal recognition response shown in Figure 2. Interestingly, the general model was built from a prior target-detection experiment (Curran et al., 2009; Touryan et al., 2010). In that experiment participants were asked to detect targets (people and vehicles) in an RSVP sequence of natural images. A machine learning algorithm (Perkins et al., 2003) was then used to identify features in the evoked response that maximally separated target from background images. Data from all participants, both right- and left-handed, was used to build this general classifier model, which captured the relevant components of the P300 complex.
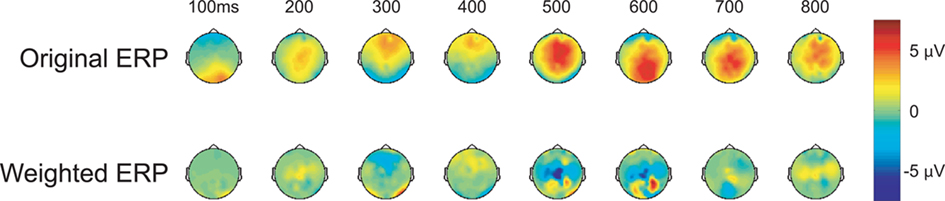
Figure 3. Topographic maps of the evoked response. Upper column: grand-averaged ERP for personal (faces of friends and family) stimulus class. Lower column: same grand-averaged ERP weighted by the general classifier model (linear discriminant function).
We quantified the performance of the general classifier model in the face recognition task with receiver operating characteristics (ROC) analysis (Green and Swets, 1966). For each participant, we calculated the areas under the curve (AUC) for two conditions. First, famous and personal faces were combined and considered as familiar and compared against novel faces. Second, only personal faces were compared against novel faces. Figure 4 shows the performance of each participant using these two calculations. The classifier performed well for the majority of participants with an average AUC for the familiar versus novel of 0.827 (min. = 0.583, max. = 0.957). The comparison between personal and novel was even more compelling with and average AUC of 0.858 (min. = 0.580, max. = 0.998). This difference was statistically significant (p < 0.05, paired t-test).
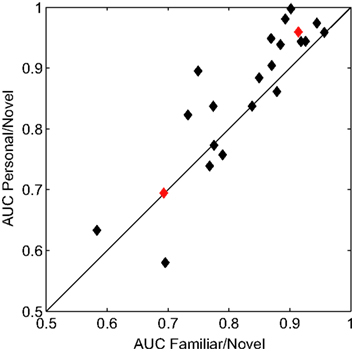
Figure 4. Receiver operating characteristics analysis of classifier performance. Scatter plot of the area under the curve (AUC) for each participant. The x and y axes represent the two comparison conditions: familiar (personal and famous) versus novel and personal versus novel. Red diamonds indicate the individual participants whose ERPs are shown in Figure 5.
Overall, the classifier performance was not correlated with behavioral accuracy (r = −0.17, p = 0.46; Pearson’s correlation), rather it reflected the individual differences in the underlying response. Figure 5 illustrates this diversity in the recognition response over the right-parietal electrodes (RPS channel group). This area in particular, is critical to the general classifier model (see Figure 3). Not surprisingly, the performance of the general model was good for the first participant (participant 121, AUC = 0.91) but not for the second (participant 107, AUC = 0.69). It is clear from the average ERPs that the first participant had a large recognition response by 500 ms, whereas the second participant’s recognition response was substantially delayed. The general classifier model, built from multiple participants, is heavily weighted toward the earlier response (500–600 ms) and is thus negatively affected by this type of delay. These types of individual variations in the evoked response are a primary reason for the suboptimal performance of the general model.
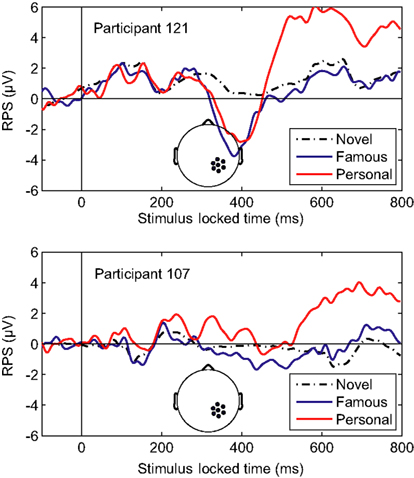
Figure 5. Averaged-referenced ERPs for two individual participants. Top panel: ERP for participant 121 with high AUC (0.91). Bottom panel: ERP for participant 107 with low AUC (0.69). The AUC values were calculated using the general classifier model. Inset: the RPS channel group.
To accommodate the individual variations in the evoked response, we built customized models for each participant after their initial session. The custom models were built in the same manner as the general model described above (see Materials and Methods for details). To compare classification performance between the models, we again calculated the AUC for the familiar versus novel condition (Figure 6). In each case, the customized model resulted in a substantial improvement in classifier performance. Here, the average AUC was 0.945 (min. = 0.868, max. = 0.991) a significant improvement over the general model (p < 0.001, paired t-test). For an additional validation of these customized models, a subset of participants (n = 5) returned for a second experimental session. During this second session, the custom model was used for the real-time classification of the evoked response. Again, the customized model significantly improved classifier performance (p < 0.05, paired t-test) with an average improvement of 0.06 AUC. The separate sessions controlled for any effects of over-fitting or sensitivity to exact electrode placement. In sum, while the general model was able to capture the universal neural correlate of the recognition response, the customized models improve the performance by accounting for some of the individual variations in the evoked response.
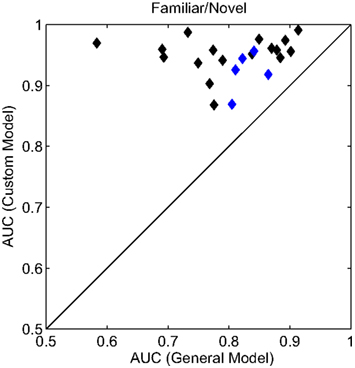
Figure 6. Receiver operating characteristics analysis of classifier models. Scatter plot of the AUC for each participant. All AUC values were calculated for the familiar (personal and famous) versus novel condition. The x and y axes represent the two model conditions: a general model (same for all participants) and a custom model (unique to each participant). Blue diamonds indicate the individual participants whose custom model was validated with a second, independent experimental session.
Discussion
In this study we quantified the neural correlates of recognition evident the evoked response (Yovel and Paller, 2004; Curran and Hancock, 2007; MacKenzie and Donaldson, 2007). Unlike previous studies, the components of recognition, namely familiarity, and recollection, were not independently manipulated. However, it is clear from these results that both the mid-frontal FN400 (familiarity) and later parietal component (recollection) are influenced by knowledge of the individual depicted in the photograph (Paller et al., 2007). A common hypothesis describes familiarly as a sub-threshold process that does not achieve the level of contextual memory recall associated with recollection (Yonelinas, 2002; Wixted, 2007). If this is the case, one might expect this process would saturate once recollection is achieved. Our results, however, indicate that the frontal FN400 is significantly larger for individuals personally known by the participant than for celebrities selected by the participant. Here, the entire recognition response is a not a binary operation but rather a process that reflects the participant’s level of experience with the stimulus. While this study does not resolve the debate over neural correlates of familiarity and recollection, it supports the conclusion that the early and late components of the recognition response behave in a similar continuous or graded fashion.
Our results also indicate that magnitude and time course of the recognition response remains robust even when the stimuli, color photographs of faces, are much less controlled relative to previous studies. In our experiment, faces were of different genders and ethnicities, with large variations in lighting, angle, background, and resolution. Indeed, this diverse ensemble was necessary to control for the variation in participant-provided imagery. Likewise, the ERP associated with each stimulus category clearly shows the early and late components of the recognition response, even though the following stimulus was presented before the complete evolution of the response. These results offer an increased level of ecological validity to the previously described recognition response and demonstrate the utility of the signal for applications outside the laboratory.
In previous studies the level of familiarity was carefully controlled within the laboratory session. Typically, participants would encode novel stimuli (words or faces) during an explicit study phase. This process mitigates, to some degree, influences external to the experimental session and is often necessary for controlling or counterbalancing various cognitive processes (Gabrieli, 1998; Paller et al., 2007). However, one consequence of this is an attenuation of the recognition signal due to the capacity or limits of human memory. In the real world, recognition is often clear and unambiguous, especially the recognition of individuals we encounter on a daily basis (friends, coworkers, family members, etc.). For applications that seek to use the recognition signal, evidenced in the evoked response, it is important to quantify the magnitude of the effect in a more realistic setting.
Brain–machine interfaces are one of the more common applications that utilize the evoked response (Sellers et al., 2006). Many BMI technologies rely on classification of the occipital–parietal P300 signal, similar to the ERPs shown here (Krusienski et al., 2006). While this classification is typically designed to identify stimuli that are task-relevant (e.g., a particular letter or type of object), the recognition response produces a similar signal. While the BMI applications of spelling out letters to form words (Krusienski et al., 2006; Klobassa et al., 2009) or finding relevant targets in imagery is clear (Luo and Sajda, 2009; Touryan et al., 2010), one can also imagine applications that employ the recognition response as either a memory probe or a metric for learning (i.e., what items has the participant committed to memory). This study indicates that, not only is the recognition response distinguishable within single-trials (Parra et al., 2002), but that EEG classification techniques developed for visual categorization tasks can be easily adapted to recognition tasks.
Likewise, the differential neural activity based on memory (referred to as Dm) could be adapted for the same purpose. Previous studies have shown an enhanced posterior positivity in the ERP (with latency similar to the recognition response) for word stimuli that are subsequently remembered (Paller and Wagner, 2002). Yovel and Paller (2004) showed a similar Dm effect during a face-occupation memory task. Here there was a clear distinction in the evoked response for faces that were later remembered as opposed to faces later forgotten. In other words, the evoked response elicited from the initial exposure to a stimulus is predictive of subsequence memory for that stimulus. This intriguing signal offers the prospect for applications that directly measure memory encoding. Ideally, such an application could use this signal to identify information that will either be remembered or forgotten. In addition, this type of tool could be useful for exploring the neural mechanisms of memory at the level of a single object, word or atom of information. Such a memory encoding tool could be useful when designing BMI systems that seek to maximize or augment human performance.
Conflict of Interest Statement
The authors declare that the research was conducted in the absence of any commercial or financial relationships that could be construed as a potential conflict of interest.
Footnotes
References
Chun, M. M., and Potter, M. C. (1995). A two-stage model for multiple target detection in rapid serial visual presentation. J. Exp. Psychol. Hum. Percept. Perform. 21, 109–127.
Curran, T., Gibson, L., Horne, J. H., Young, B., and Bozell, A. P. (2009). Expert image analysts show enhanced visual processing in change detection. Psychon. Bull. Rev. 16, 390–397.
Curran, T., and Hancock, J. (2007). The FN400 indexes familiarity-based recognition of faces. Neuroimage 36, 464–471.
Guo, C., Voss, J. L., and Paller, K. A. (2005). Electrophysiological correlates of forming memories for faces, names, and face-name associations. Brain Res. Cogn. Brain Res. 22, 153–164.
Klobassa, D. S., Vaughan, T. M., Brunner, P., Schwartz, N. E., Wolpaw, J. R., Neuper, C., and Sellers, E. W. (2009). Toward a high-throughput auditory P300-based brain-computer interface. Clin. Neurophysiol. 120, 1252–1261.
Krusienski, D. J., Sellers, E. W., Cabestaing, F., Bayoudh, S., McFarland, D. J., Vaughan, T. M., and Wolpaw, J. R. (2006). A comparison of classification techniques for the P300 Speller. J. Neural Eng. 3, 299–305.
Luo, A., and Sajda, P. (2009). Comparing neural correlates of visual target detection in serial visual presentations having different temporal correlations. Front. Hum. Neurosci. 3:5. doi: 10.3389/neuro.09.005.2009
MacKenzie, G., and Donaldson, D. I. (2007). Dissociating recollection from familiarity: electrophysiological evidence that familiarity for faces is associated with a posterior old/new effect. Neuroimage 36, 454–463.
McCarthy, G., and Wood, C. C. (1985). Scalp distributions of event-related potentials: an ambiguity associated with analysis of variance models. Electroencephalogr. Clin. Neurophysiol. 62, 203–208.
Paller, K. A., Voss, J. L., and Boehm, S. G. (2007). Validating neural correlates of familiarity. Trends Cogn. Sci. 11, 243–250.
Paller, K. A., and Wagner, A. D. (2002). Observing the transformation of experience into memory. Trends Cogn. Sci. 6, 93–102.
Parra, L., Alvino, C., Tang, A., Pearlmutter, B., Yeung, N., Osman, A., and Sajda, P. (2002). Linear spatial integration for single-trial detection in encephalography. Neuroimage 17, 223–230.
Perkins, S., Lacker, K., and Theiler, J. (2003). Grafting: fast, incremental feature selection by gradient descent in function space. J. Mach. Learn. Res. 3, 1333–1356.
Rugg, M. D., Mark, R. E., Walla, P., Schloerscheidt, A. M., Birch, C. S., and Allan, K. (1998). Dissociation of the neural correlates of implicit and explicit memory. Nature 392, 595–598.
Sellers, E. W., Krusienski, D. J., McFarland, D. J., Vaughan, T. M., and Wolpaw, J. R. (2006). A P300 event-related potential brain-computer interface (BCI): the effects of matrix size and inter stimulus interval on performance. Biol. Psychol. 73, 242–252.
Smith, M. (1993). Neurophysiological manifestations of recollective experience during recognition memory judgments. J. Cogn. Neurosci. 5, 1–13.
Thorpe, S., Fize, D., and Marlot, C. (1996). Speed of processing in the human visual system. Nature 381, 520–522.
Touryan, J., Gibson, L., Horne, J. H., and Weber, P. (2010). “Real-time classification of neural signals corresponding to the detection of targets in video imagery,” in International Conference on Applied Human Factors and Ergonomics, Miami, FL, 60.
Voss, J. L., Lucas, H. D., and Paller, K. A. (2010). Conceptual priming and familiarity: different expressions of memory during recognition testing with distinct neurophysiological correlates. J. Cogn. Neurosci. 22, 2638–2651.
Voss, J. L., and Paller, K. A. (2006). Fluent conceptual processing and explicit memory for faces are electrophysiologically distinct. J. Neurosci. 26, 926–933.
Voss, J. L., Reber, P. J., Mesulam, M. M., Parrish, T. B., and Paller, K. A. (2008). Familiarity and conceptual priming engage distinct cortical networks. Cereb. Cortex 18, 1712–1719.
Wixted, J. (2007). Dual-process theory and signal-detection theory of recognition memory. Psychol. Rev. 114, 152–176.
Yonelinas, A. (2002). The nature of recollection and familiarity: a review of 30 years of research. J. Mem. Lang. 46, 441–517.
Keywords: event-related potential, recognition memory, object categorization, classifier
Citation: Touryan J, Gibson L, Horne JH and Weber P (2011) Real-time measurement of face recognition in rapid serial visual presentation. Front. Psychology 2:42. doi:10.3389/fpsyg.2011.00042
Received: 29 November 2010;
Paper pending published: 08 January 2011;
Accepted: 28 February 2011;
Published online: 11 March 2011.
Edited by:
Paul Sajda, Columbia University, USACopyright: © 2011 Touryan, Gibson, Horne and Weber. This is an openaccess article subject to an exclusive license agreement between the authors and Frontiers Media SA, which pemits unrestricted use, distribution, andreproduction in any medium, provided the original authors and source are credited.
*Correspondence: Jon Touryan, Boulder Center for Neurotechnology, Science Applications International Corporation, 801 Main Street, Suite 300, Louisville, CO 80027, USA. e-mail: jonathan.o.touryan@saic.com