
- 1 Istituto Italiano di Tecnologia, Robotics, Brain and Cognitive Sciences, Genova, Italy
- 2 School of Psychology, University of Birmingham, Birmingham, UK
- 3 Dipartimento di Psicologia, Università Degli Studi di Firenze, Florence, Italy
Many recent studies show that the human brain integrates information across the different senses and that stimuli of one sensory modality can enhance the perception of other modalities. Here we study the processes that mediate cross-modal facilitation and summation between visual and tactile motion. We find that while summation produced a generic, non-specific improvement of thresholds, probably reflecting higher-order interaction of decision signals, facilitation reveals a strong, direction-specific interaction, which we believe reflects sensory interactions. We measured visual and tactile velocity discrimination thresholds over a wide range of base velocities and conditions. Thresholds for both visual and tactile stimuli showed the characteristic “dipper function,” with the minimum thresholds occurring at a given “pedestal speed.” When visual and tactile coherent stimuli were combined (summation condition) the thresholds for these multisensory stimuli also showed a “dipper function” with the minimum thresholds occurring in a similar range to that for unisensory signals. However, the improvement of multisensory thresholds was weak and not directionally specific, well predicted by the maximum-likelihood estimation model (agreeing with previous research). A different technique (facilitation) did, however, reveal direction-specific enhancement. Adding a non-informative “pedestal” motion stimulus in one sensory modality (vision or touch) selectively lowered thresholds in the other, by the same amount as pedestals in the same modality. Facilitation did not occur for neutral stimuli like sounds (that would also have reduced temporal uncertainty), nor for motion in opposite direction, even in blocked trials where the subjects knew that the motion was in the opposite direction showing that the facilitation was not under subject control. Cross-sensory facilitation is strong evidence for functionally relevant cross-sensory integration at early levels of sensory processing.
Introduction
Integration and Interactions between Touch and Vision
The different sensory modalities provide redundant information about the environment. Much evidence over the last decade has shown that our nervous system integrates signals from different modalities to maximize the information available for perception and action (e.g., Ernst and Bulthoff, 2004). However, it is not entirely clear whether these processes occur at low sensorial levels or higher decisional levels.
For example, much psychophysical evidence demonstrates integration of visual and auditory motion stimuli, but the integration would not be functionally useful in discrimination direction of motion, of a common object, as it occurs equally for both the same and opposite directions of motion (Meyer and Wuerger, 2001; Wuerger et al., 2003; Alais and Burr, 2004a). This suggests that it is not the sensory, directional signals that are being integrated, but “decision signals,” unsigned signals that motion has occurred.
On the other hand, other studies point clearly to neural interactions between the senses, using electrophysiological and imaging techniques (e.g., Bolognini and Maravita, 2007; Nakashita et al., 2008; Wang et al., 2008; Kayser et al., 2009; Beauchamp et al., 2010). It is particularly interesting that many areas thought to be primary sensory areas have been showed to respond to several modalities: for example, MT, an early visual area, responds both to tactile and to auditory motion (e.g., Hagen et al., 2002; Blake et al., 2004; Beauchamp et al., 2007; Saenz et al., 2008; Bedny et al., 2010). Similarly, area SI and SII, primary somatosensory areas respond well to visual stimuli (Keysers et al., 2004; Blakemore et al., 2005; Schaefer et al., 2005) and neurophysiological evidence support the presence of multimodal interactions at the level of the single neuron (e.g., Stein et al., 2001; Rowland and Stein, 2007).
That many sensory modalities respond to the motion of objects renders it an ideal stimulus to investigate intermodal interactions and multisensory integration. Much is known about visual motion, but the workings of tactile and auditory motion remain more obscure. Nevertheless, recent evidence suggests that they share much in common (e.g., Pei et al., 2011). For example, tactile motion is subject to similar illusions observed with visual motion, including a motion flow after-effect (Watanabe et al., 2007), the “aperture problem,” the Ouchi illusion (Bicchi et al., 2008) and the “Ternus effect” (Harrar and Harris, 2007).
Several studies show cross-modal interactions for motion perception: visual motion can influence the apparent speed of tactile motion (Bensmaia et al., 2006; Craig, 2006), and also influence the speed and direction of audio motion (Mays and Schirillo, 2005; Lopez-Moliner and Soto-Faraco, 2007). Similarly, auditory motion stimuli affect the direction of tactile motion (Soto-Faraco et al., 2004), mutual enhancement between vision and auditory motion has been observed (Strybel and Vatakis, 2004), and reaction times are fast to visuo-tactile motion then to either alone (Ushioda and Wada, 2007). Integration has also been shown for visuo-tactile apparent motion across fingers, but the integration seemed to occur at a high rather than low level (Harrar et al., 2008). More interestingly, recent evidence reports motion bidirectional aftereffects between vision and touch (Konkle et al., 2009) and also between vision and audition (Kitagawa and Ichihara, 2002), both demonstrating intermodal adaptation.
Many studies, using electrophysiological and imaging techniques, including but not limited to those outlined above, suggest that visual, tactile, and auditory motion perception share common neural mechanisms. However, to date no psychophysical studies have demonstrated a clear, functionally useful interaction between motion signals of different modalities in discriminating the direction of motion of a common object. Indeed, also if some psychophysical works reported facilitation between modalities (Wuerger et al., 2003; Alais and Burr, 2004a) the effect of most of them were small (with exception of Arrighi et al., 2009 for visual–auditory integration in biological motion) and, importantly, unspecific for direction. Perhaps the reason for this is that the studies have not been optimized to reveal neural connectivity. In this study we use two psychophysical techniques, summation and facilitation, and show that they are affected differently by visuo-tactile interactions.
Summation and Facilitation
Two common techniques are used to study vision: summation and facilitation. Although they share much in common (see, for example, Pelli, 1987), the techniques are distinct. Summation (first introduced by Rentschler and Fiorentini, 1974) occurs when two different signals (of the same or different modality), individually below threshold combine to reach threshold. In a two-alternative forced choice paradigm the two signals are displayed together in one interval, which has to be discriminated from the blank interval: both are informative about which interval contains the signals. In the facilitation paradigm, on the other hand, a non-informative “pedestal” is displayed to both intervals; and although it provides no direct evidence of which interval contains the signal, it in fact can increase sensitivity to the test when it is of appropriate strength.
Facilitation is different in that one signal is not informative for detection, but facilitates the detection of the other. It was first demonstrated for luminance and contrast discrimination (Legge and Foley, 1980). Figure 1A shows a typical stylized example of facilitation, with a curve plotting threshold of some quantity (such as contrast increment) against the base intensity (say contrast). Nevertheless, the results describe the characteristic “dipper function”: adding a small quantity of signal improves thresholds (termed “facilitation”), but higher levels of base intensity increase thresholds (see Solomon, 2009 for a recent review). As the base contrast is not in itself informative about the test, the change in thresholds must reflect a non-linearity in the system. Typically the non-linearity is thought to occur in the function that transduces signals into neural responses (schematically illustrated in Figure 1B). The function is thought to show two strong non-linearities, an initial threshold-like accelerating non-linearity and a later compressive non-linearity (e.g., Legge and Foley, 1980). If we assume that to perceive two stimuli as different requires a constant change in responsiveness (illustrated by the dotted lines), then more contrast is required to achieve this change at the lower and higher ends of the curve than in the middle, where the curve is steepest: the lower contrasts at the steep part of the curve cause the dip. Many discrimination functions exhibit a “dipper function” both within the visual modality for example in the discrimination of contrast (Nachmias and Kocher, 1970; Pelli, 1985), blur (Watt and Morgan, 1983; Burr and Morgan, 1997) and motion (Simpson and Finsten, 1995) and between modalities for different functions (Arabzadeh et al., 2008; Burr et al., 2009).
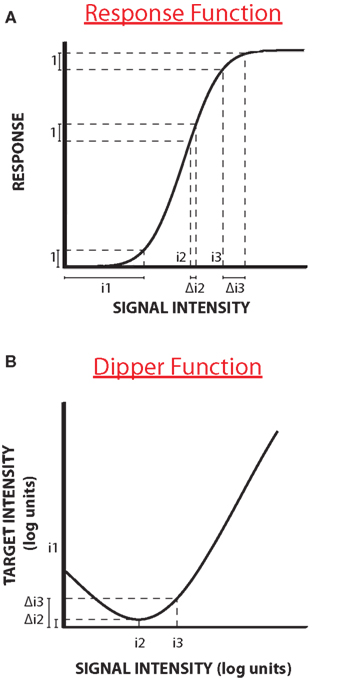
Figure 1. Response function and dipper function. (A) A stylized “dipper function”: adding a small quantity of signal improves thresholds, but higher levels of base intensity increases them. (B) The dip is usually explained by a purported non-linearity in the function that transduces signals into neural responses. The function has an initial threshold-like, accelerating non-linearity and a later compressive non-linearity. If we assume that to perceive two stimuli to be different requires a constant change in responsiveness (illustrated by the dotted lines), then more contrast is required to achieve this change at the lower and higher ends of the curve than in the middle, where the curve is steepest: the lower contrasts at the steep part of the curve cause the dip.
In this study we use both techniques, summation and facilitation, to study interactions between visual and tactile motion. We find that while summation produces a generic, non-specific improvement of thresholds, probably reflecting higher-order interaction of decision signals, facilitation reveals a strong, direction-specific interaction, which we believe reflects sensory interactions. These data have been presented at the visual science conference in Naples 2008 and published in an abstract form (Gori et al., 2008).
Materials and Methods
With the summation technique we studied visual, tactile, and bimodal visuo-tactile motion perception by measuring minimal speed increment motion thresholds over a wide range of base speeds (from 0 to 25 cm/s). The stimuli used were physical wheels etched with a sinewave profile of 10 and 3.3 cycles/cm (Figures 2A,B). They were spatially aligned to give the appearance of a common object and simultaneously driven at specific speeds by two independent computer controlled motors (Figures 2C,D). Subjects, seated at 57 cm, observed the front wheel and touched the second wheel (concealed from view Figures 2E,F) with their index finger. Speed detection and discrimination thresholds were measured with a 2IFC procedure. Subjects chose which of two presentations seemed faster: one presentation (randomly first or second) was the standard, fixed at a specific velocity for each session, while the other stimulus was slightly faster, with speed chosen by the QUEST algorithm (Watson and Pelli, 1983) that homed in near threshold (for each condition 150 trials were collected).
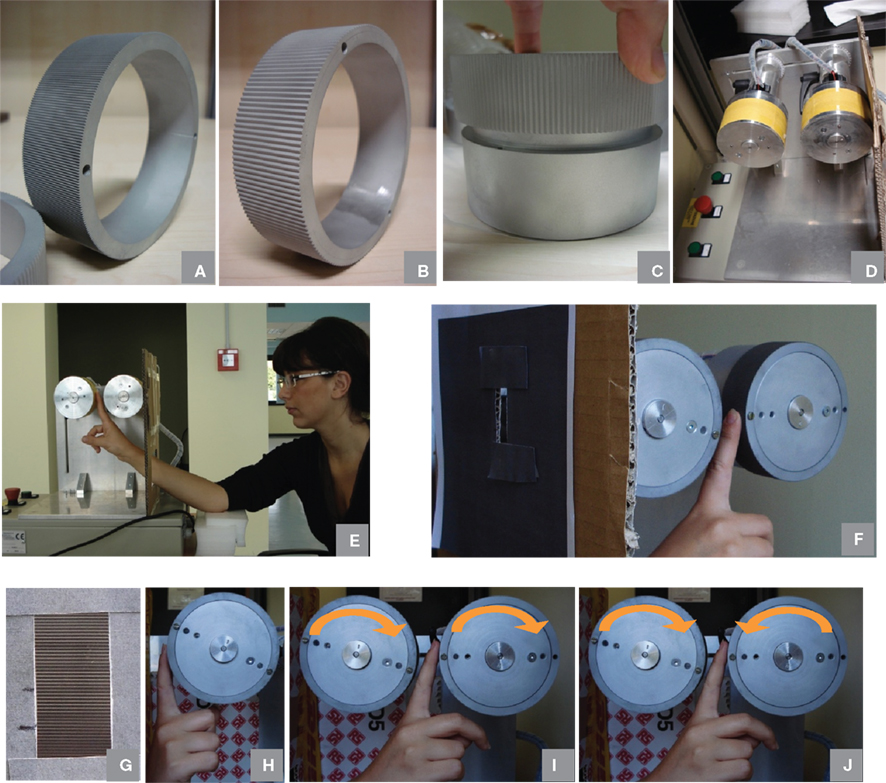
Figure 2. Stimuli: physical wheels etched with a sinewave profile of different spatial frequencies: (A) 10 cycles/cm and a phase of 1 mm, (B) 3. 3 cycles/cm, and a phase of 3 mm. (C) Support where the wheels were inserted. (D) Setup with two arms driven at variable speeds by two independent computer controlled motors. (E) Example subject during the experiment. (F) Closeup of the visual-haptic stimulation unit. (G) Image of the “vision only” stimulus. (H) Image of the “tactile only” stimulus. (I) Image of the “bimodal task same direction of motion.” (J) Image of the “bimodal task opposite direction of motion.”
Data were fitted with a cumulative Gaussian function and SEs in the thresholds were computed with bootstrap simulation (Efron and Tibshirani, 1993). In the “vision only” task the visual stimulus was viewed through a small window (1 × 3 cm Figure 2G). For the entire presentation the subject had to observe a fixation point. In the “tactile only” task the subject touched the tactile stimulus with the fingertip of his index finger (1 × 2 cm Figure 2H). During the “bimodal task” (Figure 2I) subjects were instructed to touch and observe simultaneously the two wheels moving in the same direction. During the “bimodal, opposite direction” task (Figure 2J) the two wheels were moved in opposite directions. To control that the final velocity and acceleration profile of the wheels was equal to the one required by the experimenter, we recorded the velocity profile of the wheels in motion by using a motion tracking system (Optotrack Certus system). For all the considered stimuli the measured speed profile was consistent with the requirements. The maximum time required to the wheel to reach the maximal final velocity with the maximal acceleration used in our experiment was 0.0057 s.
With the facilitation technique only the 10 cycles/cm stimuli were used (Figure 2A). In the cross-modal pedestal condition, the base speed (pedestal) was presented in one modality, and the increment to be detected in the other. The facilitation effect was measured for different speeds of the pedestal stimulus from ranging from 0 to 10 cm/s. During the visual detection plus the tactile pedestal signal, the subject had to perform a visual detection task and at the same time, for both the intervals, he was stimulated by a tactile signal driven at a specific pedestal speed equal for both the presentations. During the tactile detection plus visual pedestal signal, the subject had to perform a tactile detection task and had to observe at the same time, for both intervals, a visual stimulus driven at a specific pedestal speed for both the intervals. For example, in both intervals the tactile motion could be, say, 1 cm/s (hence non-informative), and only in the test interval was there the visual motion to be detected, and the threshold of that motion was detected. We then performed some control experiments by measuring the facilitation effect for pedestal signals of different origins. In the first control experiment, we substituted the cross-modal motion-pedestal with a sound of matched duration (defining precisely the temporal interval of motion). The subject had to perform the same unimodal visual and tactile detection tasks but during each stimulation he was presented with a synchronized acoustic signal. In the second control experiment, we measured facilitation with cross-modal pedestals moving in the opposite direction to the tests and the subject was informed from the experimenter about the future direction of the two motions. In the third control experiment we delayed the beginning of the cross-modal pedestal stimulus of 100 ms with respect to the test stimulus. Two subjects took part to all the experiments of this study. The most important data, however, were collected on five subjects (indicated in figure captions).
Results
Within Modality Facilitation
Figure 3 reports discrimination and detection thresholds in two subjects for visual (on the left) and tactile (on the right) stimuli for two spatial frequencies (3.3 and 10 cycles/cm). Both visual and tactile motion produced the characteristic “dipper function,” where the thresholds initially decreased with base speed to a minimum at base speeds around 0.1 cm/s, then rose, roughly in proportion to base speed (Weber law behavior). The visual and tactile motion curves are very similar in form, both in absolute sensitivity and position of the dip, suggesting that similar mechanisms may operate for these two modalities.

Figure 3. Speed thresholds in the within modality facilitation condition. (A) Vision only condition. The spatial frequency of 3.3 cycles/cm is reported light red and the spatial frequency of 10 cycles/cm dark red. (B) Tactile only condition. The spatial frequency of 3.3 cycles/cm is reported light blue and the spatial frequency of 10 cycles/cm dark blue. This measure was replicated in two subjects.
Between Modality Summation
Figure 4 plots the data in another way, separately for the two spatial frequencies (3.3 and 10 cycles/cm). All curves, for visual, tactile, and visuo-tactile motion (respectively red, blue, and green symbols) are similar in form, with the “dip” (maximum facilitation) always around 0.1 cm/s. Interestingly, for multisensory motion, the functions (including the size and position of the “dip”) were virtually identical when the visual–tactile motion were driven in the same or opposite direction (respectively green and violet symbols). We modeled the predicted improvements for multisensory stimuli using the standard maximum-likelihood model (Ernst and Banks, 2002; Alais and Burr, 2004b). Optimal integration for the visual–tactile stimulus (σVT) is given by:

Where σV and σT are the visual and tactile thresholds. Both the bimodal conditions were well predicted by this model (orange curves in Figure 4) in all conditions, suggesting that visuo-tactile flow signals are integrated in a Bayesian optimal fashion.
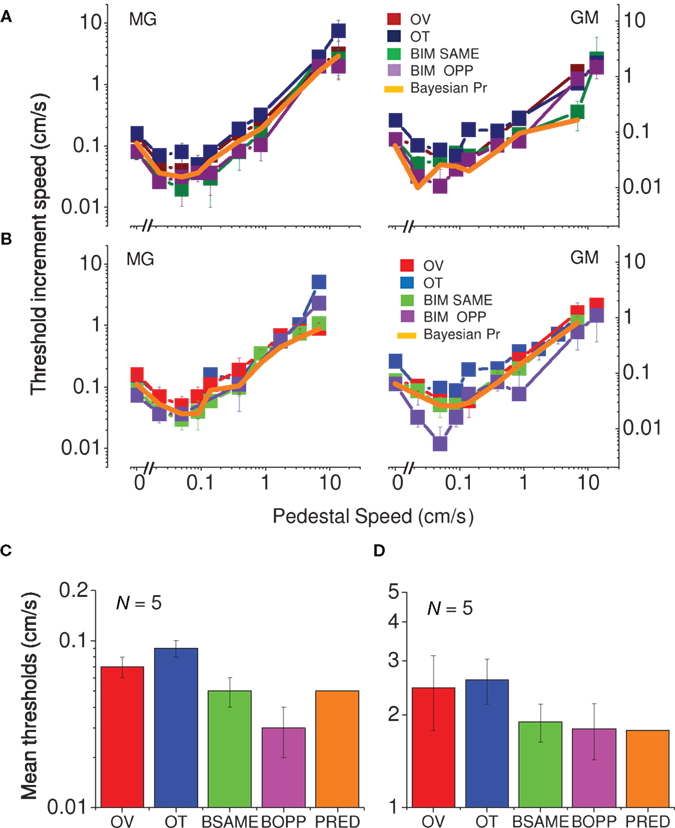
Figure 4. Speed thresholds for summation between modalities. (A) Spatial frequency of 3.3 cycles/cm. Thresholds for vision only are reported in dark red, for tactile only in dark blue and for bimodal in dark green. Thresholds for bimodal same direction condition light green, for bimodal opposite direction light violet, Bayesian prediction orange (replicated in two subjects). (B) Spatial frequency of 10 cycles/cm. Thresholds for vision only are reported in light red, tactile only in light blue, bimodal same direction condition light green, bimodal opposite direction light violet, Bayesian prediction in orange (replicated in two subjects). (C) Average thresholds of five subjects for the velocity of 0.1 cm/s (color-coding as above). Spatial frequency of 10 cycles/cm. (D) Average thresholds of five subjects for the velocity of 7.5 cm/s (color-coding as above). Spatial frequency of 10 cycles/cm.
We measured two points of the curves (for the spatial frequency of 10 cycles/cm) – visual and tactile only thresholds plus points of maximum facilitation– in five subjects (Figure 4C). We also measured the thresholds of five subjects by adding a higher velocity (Figure 4D). All subjects showed the same effect: a decrease in thresholds for visuo-tactile motion, both in the same and opposite directions; and all were well predicted by the Bayesian maximum-likelihood model (orange bars).
Facilitation between Senses
The previous results demonstrate facilitation within the visual and tactile modalities, and also show that the two modalities summate with each other, but in a non-specific manner. Here we ask whether visual motion can facilitate tactile motion, and vice versa. Subjects were asked to discriminate which interval contained the visual motion, when in both intervals there was tactile motion, and vice versa. The results are shown in Figure 5 with blue symbols, together with the previously reported results (red symbols). As with within-sensory facilitation, the cross-sensory data show a clear “dip,” again at around 0.1 cm/s, clearly demonstrating facilitation across senses. However, the form of the blue curves differed from the within-sensory curves in that there is no rising limb with Weber-like behavior.
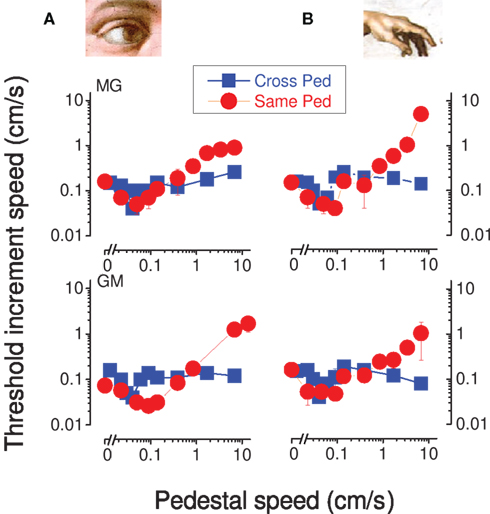
Figure 5. Incremental speed thresholds for the facilitation between senses condition incremental speed thresholds for visual (A) and tactile (B) motion, as a function of base speed, for two observers. Red circular symbols show unimodal thresholds, where all signals are confined to the same modality, vision (A) or touch (B). The blue symbols show thresholds for pedestals of different modality to the test, tactile (B) or visual (A).
To study the facilitation more closely, we measured visual and tactile speed thresholds with and without 0.1 cm/s pedestals of the same or different modality in five subjects. All subjects showed a strong facilitation when a pedestal signal of the same modality was added to the original signal (red symbols in Figure 6C) or different modality (blue symbols in Figure 6C). Averaged results (normalized to base threshold) are shown in Figures 6A,B. For both vision and touch, pedestals of the same (red bars) or different (blue) modality both reduced thresholds considerably, by more than a factor of two. In both cases the average effect of the pedestal was as strong for the cross-modal as for the intra-modal condition. To examine whether this may be due to reducing temporal uncertainty, we substituted the cross-modal motion-pedestal with a sound of matched duration (defining precisely the temporal interval of motion); but the concurrent sounds had no effect on base thresholds (green bars). More importantly, we also measured facilitation with cross-modal pedestals moving in the opposite direction to the tests (and subjects were informed that this was the case), but this had no effect on base thresholds (cyan bars). Figure 6C shows the individual data for all conditions, plotting the pedestal against the no-pedestal thresholds. Clearly all red and blue symbols (pedestal conditions of the same or crossed modality) lie under the equality line, showing facilitation, while the other two conditions are at or above it, showing no facilitation.
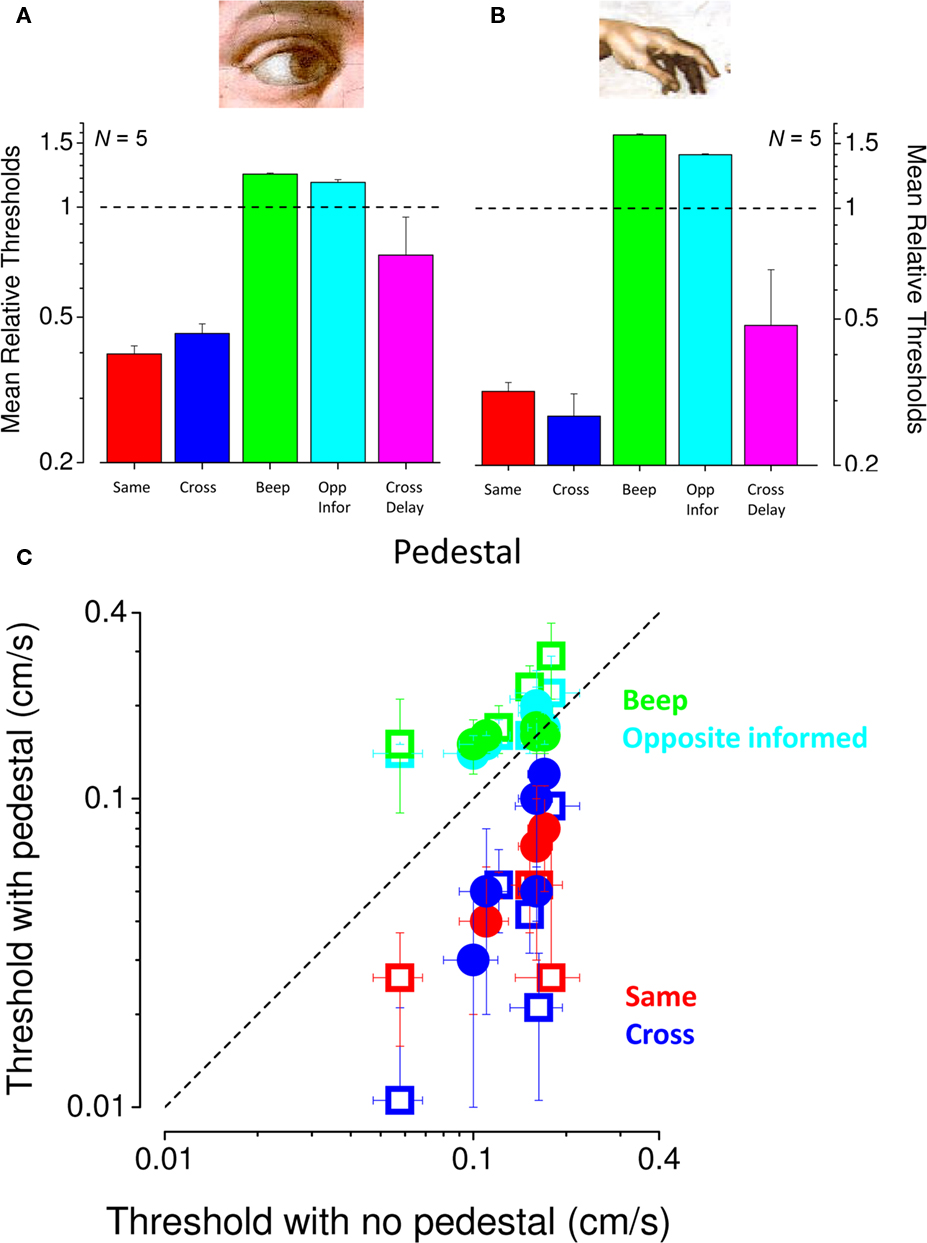
Figure 6. Conditions producing cross-modal facilitation. (A,B) Mean normalized thresholds of five observers for visual (A) and tactile (B) speed increment discrimination. Individual thresholds were divided by thresholds for the no-pedestal condition, then averaged (geometric mean) across subjects (error bars ± 1 SEM). The dashed line at unity indicates no-pedestal effect. Red bars refer to thresholds for pedestals of the same modality, blue pedestals of different modality. The green bars show thresholds when the interval was marked by an auditory tone of 2450 Hz, and the cyan bar thresholds opposite directions of motion (observers were informed of the inversion). Pink bars indicate thresholds for pedestal signal of the other modality delayed of 100 ms (measured in three subjects). (C) Individual thresholds for speed increment discrimination, plotted against no-pedestal thresholds. Visual thresholds are shown by closed symbols, tactile by open symbols (color coding as above). Error bars on individual data points were obtained by bootstrap (Efron and Tibshirani, 1993).
Uncertainty affects the psychometric function in several ways, most notably in that high uncertainty causes a steepening of the psychometric function (Pelli, 1985; Henning and Wichmann, 2007). Figure 7 reports the mean normalized steepness of the psychometric function of all measured conditions. As is apparent, all the conditions with a pedestal or accompanying sound have a broader function than the baseline, single modality conditions, with no specific effect for those conditions that lead to an improvement of thresholds, making uncertainty an unlikely explanation for the facilitation effect. In a third control experiment we measured (in three subjects) the facilitation by delaying the beginning of the cross-modal pedestal stimulus of 100 ms with respect to the test stimulus. This short delay was sufficient to disrupt completely the effect of facilitation, suggesting that the test and pedestal had to be simultaneous for facilitation to occur.
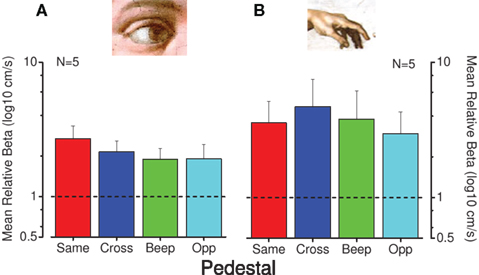
Figure 7. Steepness of psychometric functions for the conditions that produce cross-modal facilitation. Mean normalized psychometric function steepness of five observers for visual (A) and tactile (B) conditions. Individual steepness (SD of psychometric functions) were divided by the steepness for the no-pedestal condition, then averaged across subjects (with error bars representing ± 1 SEM). The dashed line at unity indicates no-pedestal effect: red bars indicate thresholds for pedestals of the same modality, blue pedestals of different modality, green for the auditory tone and cyan for opposite direction of motion.
Discussion
We have investigated summation and facilitation of visual and tactile motion, both within and between senses. The results show that the two forms of motion are processed by similar mechanisms, which interact with each other, possibly at an early level of analysis. Over a wide range of speeds, the motion sensitivity curves for both vision and touch are very similar, both showing a dipper-like facilitation at around 0.1 cm/s. When the two modalities were presented together in a summation paradigm, sensitivity improved by a factor of about root-two, the amount predicted by the standard maximum-likelihood model. However, the improvement was non-specific for motion direction, as previously reported for audio–visual motion (Meyer and Wuerger, 2001; Wuerger et al., 2003; Alais and Burr, 2004a). Non-specific summation of this sort (combining upward visual with downward tactile motion) would have little functional advantage to perception as opposite motion signals cannot arise from a single object, and probably reflects a mere statistical advantage of having two rather than one signal. This process, traditionally termed “probability summation” (e.g., Watson, 1979; Pelli, 1985; Graham, 1989), basically reflects the increased probability that at least one of two noisy signals will be detected. The predicted magnitude of the effects depends on the slope of the psychometric functions but basically is near what we observe here (in the order of root-two). The most interesting result reported here is the clear, directional-specific cross-sensory facilitation between tactile and visual motion. The effect was larger than that observed for summation, a two- or three-fold increase in sensitivity (compared with the root-two summation effect) and, most importantly, occurred only for motion in the same direction presented at the same time similar to what Arrighi et al. (2009) showed with “tap dancing.” The specificity of the interaction suggests that it is functionally important, allowing the system to combine signals from the two senses generated by a common objects to detect motion with a higher sensitivity than with one alone. There are two strong indications that the interactions occur at a low, sensory level rather than at a higher cognitive level. Firstly, when we measured facilitation with motion in the opposite direction, subjects were informed that the tactile and visual motion were in opposite directions. In theory, subjects could have cognitively inverted the motion and taken advantage of it in the same way as motion in the same direction, but this did not happen. Similarly, a delayed pedestal had no effect on thresholds, suggesting that a sensory interaction was necessary.
Discrimination functions for many tasks follow a “dipper function” (see Solomon, 2009 for a recent review), including contrast discrimination (Nachmias and Kocher, 1970; Pelli, 1985), blur (Watt and Morgan, 1983), visual motion (Simpson and Finsten, 1995) and even temporal discrimination (Burr et al., 2009). The usual explanation for the dipper function is that it reflects essential non-linearities in the neural response curve (Figure 1; Legge and Foley, 1980; Legge et al., 1987). For tactile motion to affect the visual neural response curve (and vice versa) they must interact at a fairly early stage of analysis. Other explanations of the dipper function involve spatiotemporal uncertainty (Pelli, 1985), essentially suggesting that the pedestal reduces the time window – and hence the noise within that window – that needs to be monitored. However, the lack of facilitation by sound beeps, or by motion of opposite direction, combined with the fact that slope of the psychometric increased in all dual-modality conditions (irrespective of whether the pedestal caused facilitation) excludes this potential explanation. For facilitation to occur, the motion of the two senses needs to be in the same direction, at the same time, and have a very similar speed: all this points to neural combination that is not under the subject’s control.
We have attempted to account for our results within a simple schematic model (Figure 8). Taken together, the summation and facilitation results suggest that visual and tactile motion signals interact at least two levels, a relatively low, direction-specific sensory level and a higher-level, aspecific, “probabilistic” interaction that explains summation. The facilitation results require that tactile and visual signals are vectorially summed at an early level, taking into account the sign and direction of the motion. However, this summation is clearly not compulsory: the system must also have access to signals from the individual senses. There is much evidence for this. For example, the cross-sensory “dipper function” shows no rising phase, where thresholds become worse than in the no-pedestal condition (masking). If the system has access to the individual sensory data, then the “masked” multisensory signal could be ignored when it is weaker than the single-sense signal. Similarly, when test and pedestal move in the opposite directions, there is no cost, as the null combined signal could be ignored in favor of the single-sense signal. To keep the model at its most simplest, we assume that the decision stage (upper box) is a simple “maximum” operation, choosing the largest signal for a particular trial. This “max” operation also explains the small, non-directional summation effects. As the neural signals are “noisy,” they vary considerably in velocity from one trial to another: if two signals are present (even if in opposite directions), there is a greater chance that at least one of these will rise above the noisy stationary signal than if only one were present. However, this is a mere statistical advantage, not evidence for neural summation. This model is in agreement with previous results that support the idea of interaction between modalities at a sensorial level (e.g., Ushioda and Wada, 2007; Konkle et al., 2009) but only partially with others that suggest only higher-level multisensory integration (Harrar et al., 2008).
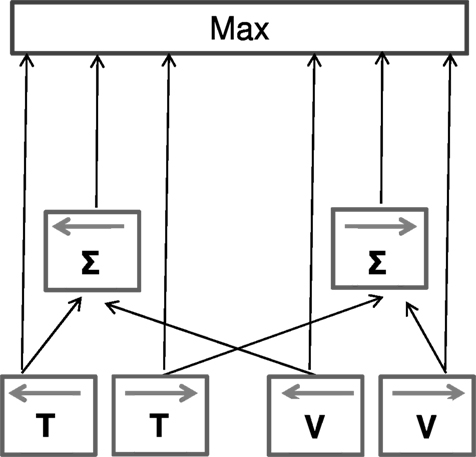
Figure 8. Descriptive model for the interaction of visual and tactile motion signals. Visual and tactile motion signals interact at two levels: a low direction-specific sensory level and a higher decisional stage in which a probability interaction occurs. At the first level we assume the signals are vectorially summed (taking direction into account), while at the second level (upper box) we assume a simple maximum operation that chooses the largest signal for each trial. An important aspect of the model is that cross-modal summation is non-compulsory: signals both from the individual senses, and after combination arrive at the decision level. If the combination is less than the individual sensory signals, the maximum operation will choose the unisensory rather than multisensory signals. This schema explains, at least qualitatively, all the observed results.
The direction-specific facilitation that we observe suggests that visual and tactile motion share common neural mechanisms. As mentioned earlier, imaging studies have shown that tactile and auditory motion activate several visual cortical areas, including area MT (Hagen et al., 2002; Ricciardi et al., 2004; Saenz et al., 2008), and many studies demonstrate multisensory interactions at the level of the single neurons (see Stein et al., 1993 for a review). This makes MT a highly plausible candidate for the neural substrate underlying the interactions reported here. Interestingly a recent study of Pei et al. (2011) also higlighted that some somatosensory areas and MT have similar functional proprierties, and we can not exclude that both MT and somatosensory areas may be involved in these cross-sensory integration mechanisms. Further fMRI studies under facilitation-like conditions would be usefull in understanding better the neural sustrate for these interactions.
In conclusion, we have shown that the psychophysical technique of pedestal facilitation demonstrates clear neural interactions between visual and tactile motion processing. Although neural interactions have been well documented by physiological techniques, psychophysical evidence for these interactions have been elusive to date. This is probably because there are many paths to perception: the senses do combine with each other, and at an early level, but the combination is not obligatory (agreeing with Ernst and Banks, 2002). The system seems to have access to information at various levels, and this parallel access can confound attempts to demonstrate neural intergration. If noisy parallel signals all feed into a simple decision process (such as the absolute maximum schema of Figure 8) there will be two important consequences: firstly the parallel access will obscure any negative effects, such as masking or vectorial summation of opposing directions; and secondly it will lead to enhancement of sensitivity for multiple signals, on sheer probabistic grounds, and this enhancement will sometimes obscure small amounts of neural summation. So while our results are certainly consistent with previous results showing aspecific, probabilistic summation, they also show that more appropriate psychophysical techniques can reveal clear, low-level sensory interactions.
Conflict of Interest Statement
The authors declare that the research was conducted in the absence of any commercial or financial relationships that could be construed as a potential conflict of interest.
References
Alais, D., and Burr, D. (2004a). No direction-specific bimodal facilitation for audiovisual motion detection. Brain Res. Cogn. Brain Res. 19, 185–194.
Alais, D., and Burr, D. (2004b). The ventriloquist effect results from near-optimal bimodal integration. Curr. Biol. 14, 257–262.
Arabzadeh, E., Clifford, C. W. G., and Harris, J. A. (2008). Vision merges with touch in a purely tactile discrimination. Psychol. Sci. 19, 635–641.
Arrighi, R., Marini, F., and Burr, D. (2009). Meaningful auditory information enhances perception of visual biological motion. J. Vis. 9, 1–7.
Beauchamp, M. S., Pasalar, S., and Ro, T. (2010). Neural substrates of reliability-weighted visual-tactile multisensory integration. Front. Syst. Neurosci. 4:25. doi: 10.3389/fnsys.2010.00025
Beauchamp, M. S., Yasar, N. E., Fryec, R. E., and Ro, T. (2007). Human MST but not MT responds to tactile stimulation. J. Neurosci. 27, 8261–8267.
Bedny, M., Konkle, T., Pelphrey, K., Saxe, R., and Pascual-Leone, A. (2010). Sensitive period for a multimodal response in human visual motion area MT/MST. Curr. Biol. 20, 1900–1906.
Bensmaia, S. J., Killebrew, J. H., and Craig, J. C. (2006). Influence of visual motion on tactile motion perception. J. Neurophysiol. 96, 1625–1637.
Bicchi, A., Scilingo, E. P., Ricciardi, E., and Pietrini, P. (2008). Tactile flow explains haptic counterparts of common visual illusions. Brain Res. Bull. 75, 737–741.
Blake, R., Sobel, K. V., and James, T. W. (2004). Neural synergy between kinetic vision and touch. Psychol. Sci. 15, 397–402.
Blakemore, S. J., Bristow, D., Bird, G., Frith, C., and Ward, J. (2005). Somatosensory activations during the observation of touch and a case of vision-touch synaesthesia. Brain 128(Pt 7), 1571–1583.
Bolognini, N., and Maravita, A. (2007). Proprioceptive alignment of visual and somatosensory maps in the posterior parietal cortex. Curr. Biol. 17, 1890–1895.
Burr, D., Silva, O., Cicchini, G. M., Banks, M. S., and Morrone, M. C. (2009). Temporal mechanisms of multimodal binding. Proc. Biol. Sci. 276, 1761–1769.
Burr, D. C., and Morgan, M. J. (1997). Motion deblurring in human vision. Proc. Biol. Sci. 264, 431–436.
Craig, J. C. (2006). Visual motion interferes with tactile motion perception. Perception 35, 351–367.
Efron, B. T., and Tibshirani, R. J. (1993). An Introduction to the Bootstrap, New York: Chapman and Hall.
Ernst, M. O., and Banks, M. S. (2002). Humans integrate visual and haptic information in a statistically optimal fashion. Nature 415, 429–433.
Ernst, M. O., and Bulthoff, H. H. (2004). Merging the senses into a robust percept. Trends Cogn. Sci. 8, 162–169.
Gori, M., Del Viva, M., Sandini, G., and Burr, D. C. (2008). Young children do not integrate visual and haptic form information. Curr. Biol. 18, 694–698.
Hagen, M. C., Franzen, O., McGlone, F., Essick, G., Dancer, C., and Pardo, J. V. (2002). Tactile motion activates the human middle temporal/V5 (MT/V5) complex. Eur. J. Neurosci. 16, 957–964.
Harrar, V., and Harris, L. R. (2007). Multimodal ternus: visual, tactile, and visuo-tactile grouping in apparent motion. Perception 36, 1455–1464.
Harrar, V., Winter, R., and Harris, L. R. (2008). Visuotactile apparent motion. Percept. Psychophys. 70, 807–817.
Henning, G. B. W., and Wichmann, F. A. (2007). Some observations on the pedestal effect. J. Vis. 7, 1–15.
Kayser, C., Logothetis, N. K., and Panzeri, S. (2009). Visual enhancement of the information representation in auditory cortex. Curr. Biol. 20, 19–24.
Keysers, C., Wicker, B., Gazzola, V., Anton, J. L., Fogassi, L., and Gallese, V. (2004). A touching sight: SII/PV activation during the observation and experience of touch. Neuron 42, 335–346.
Konkle, T., Wang, Q., Hayward, V., and Moore, C. I. (2009). Motion aftereffects transfer between touch and vision. Curr. Biol. 19, 745–750.
Legge, G. E., and Foley, J. M. (1980). Contrast masking in human vision. J. Opt. Soc. Am. 70, 1458–1471.
Legge, G. E., Kersten, D., and Burges, A. E. (1987). Contrast discrimination in noise. J. Opt. Soc. Am. A 4, 391–404.
Lopez-Moliner, J., and Soto-Faraco, S. (2007). Vision affects how fast we hear sounds move. J. Vis. 7, 1–7.
Mays, A., and Schirillo, J. (2005). Lights can reverse illusory directional hearing. Neurosci. Lett. 384, 336–338.
Meyer, G. F., and Wuerger, S. M. (2001). Cross-modal integration of auditory and visual motion signals. Neuroreport 12, 2557–2560.
Nachmias, J., and Kocher, E. C. (1970). Visual detection and discrimination of luminance increments. J. Opt. Soc. Am. 60, 382–389.
Nakashita, S., Saito, D. N., Kochiyama, T., Honda, M., Tanabe, H. C., and Sadato, N. (2008). Tactile-visual integration in the posterior parietal cortex: a functional magnetic resonance imaging study. Brain Res. Bull. 75, 513–525.
Pei, Y. C., Hsiao, S. S., Craig, J. C., and Bensmaia, S. J. (2011). Neural mechanisms of tactile motion integration in somatosensory cortex. Neuron 69, 536–547.
Pelli, D. G. (1985). Uncertainty explains many aspects of visual contrast detection and discrimination. J. Opt. Soc. Am. A 2, 1508–1532.
Rentschler, I., and Fiorentini, A. (1974). Meridional anisotrophy of psychophysical spatial interactions. Vision Res. 14, 1467–1475.
Ricciardi, E., Vanello, N., Dente, D., Sgambellini, N., Scillingo, E. P., Gentili, C., Sani, L., Positano, V., Santarelli, F. M., Guazzelli, M., Haxby, J. V., Landini, L., Bicchi, A., and Pietrin, P. (2004). “Perception of visual and tactile flow activitates common cortical areas in the human brain,” in Proceedings of the EuroHaptics 2004 (Germany: Technische Universitat Munchen), 290–292.
Rowland, B. A., and Stein, B. E. (2007). Multisensory integration produces an initial response enhancement. Front. Integr. Neurosci. 1:4. doi: 10.3389/neuro.07/004.2007
Saenz, M., Lewis, L. B., Huth, A. G., Fine, I., and Koch, C. (2008). Visual motion area MT+/V5 responds to auditory motion in human sight-recovery subjects. J. Neurosci. 28, 5141–5148.
Schaefer, M., Heinze, H. J., and Rotte, M. (2005). Seeing the hand being touched modulates the primary somatosensory cortex. Neuroreport 16, 1101–1105.
Simpson, W. A., and Finsten, B. A. (1995). Pedestal effect in visual motion discrimination. J. Opt. Soc. Am. A. Opt. Image Sci. Vis. 12, 2555–2563.
Soto-Faraco, S., Spence, C., and Kingstone, A. (2004). Congruency effects between auditory and tactile motion: extending the phenomenon of cross-modal dynamic capture. Cogn. Affect. Behav. Neurosci. 4, 208–217.
Stein, B. E., Jiang, W., Wallace, M. T., and Stanford, T. R. (2001). Nonvisual influences on visual-information processing in the superior colliculus. Prog. Brain Res. 134, 143–156.
Stein, B. E., Meredith, M. A., and Wallace, M. T. (1993). The visually responsive neuron and beyond: multisensory integration in cat and monkey. Prog. Brain Res. 95, 79–90.
Strybel, T. Z., and Vatakis, A. (2004). A comparison of auditory and visual apparent motion presented individually and with crossmodal moving distractors. Perception 33, 1033–1048.
Ushioda, H., and Wada, Y. (2007). “Multisensory integration between visual and tactile motion information: evidence from redundant-signals effects on reaction time,” in 23rd Annual Meeting of the ISP Proceedings of the 23rd Annual Meeting of the ISP, Tokyo.
Wang, Y., Celebrini, S., Trotter, Y., and Barone, P. (2008). Visuo-auditory interactions in the primary visual cortex of the behaving monkey: electrophysiological evidence. BMC Neurosci. 9, 79. doi: 10.1186/1471-2202-9-79
Watanabe, J., Hayashi, S., Kajimoto, H., Tachi, S., and Nishida, S. (2007). Tactile motion aftereffects produced by appropriate presentation for mechanoreceptors. Exp. Brain Res. 180, 577–582.
Watson, A. B., and Pelli, D. G. (1983). QUEST: a Bayesian adaptive psychometric method. Percept. Psychophys. 33, 113–120.
Watt, R. J., and Morgan, M. J. (1983). The recognition and representation of edge blur: evidence for spatial primitives in human vision. Vision Res. 23, 1465–1477.
Keywords: visual, tactile, motion, perception, neural, cross-sensory, interactions, facilitation
Citation: Gori M, Mazzilli G, Sandini G and Burr D (2011) Cross-sensory facilitation reveals neural interactions between visual and tactile motion in humans. Front. Psychology 2:55. doi: 10.3389/fpsyg.2011.00055
Received: 20 December 2010;
Accepted: 23 March 2011;
Published online: 13 April 2011.
Edited by:
Nadia Bolognini, University of Milano-Bicocca, ItalyAngelo Maravita, University of Milano-Bicocca, Italy
Reviewed by:
Alberto Gallace, University of Milano-Bicocca, ItalyClaudio Brozzoli, Karolinska Institutet, Sweden
Copyright: © 2011 Gori, Mazzilli, Sandini and Burr. This is an open-access article subject to a non-exclusive license between the authors and Frontiers Media SA, which permits use, distribution and reproduction in other forums, provided the original authors and source are credited and other Frontiers conditions are complied with.
*Correspondence: Monica Gori, Department of Robotics, Brain and Cognitive Science, Italian Institute of Technology, Genoa, Italy. e-mail: monica.gori@iit.it