 Ulrike M. Krämer1* Robert P. J. Kopyciok2 Sylvia Richter3 Antoni Rodriguez-Fornells4,5 Thomas F. Münte1
- 1 Department of Neurology, University of Lübeck, Lübeck, Germany
- 2 Department of Neuropsychology, Otto-von-Guericke-University, Magdeburg, Germany
- 3 German Center for Neurodegenerative Diseases, Magdeburg, Germany
- 4 Department of Basic Psychology, The Bellvitge Institute for Biomedical Research, University of Barcelona, Spain
- 5 Institució Catalana de Recerca i Estudis Avançats, Barcelona, Spain
An extensive literature suggests a link between executive functions and aggressive behavior in humans, pointing mostly to an inverse relationship, i.e., increased tendencies toward aggression in individuals scoring low on executive function tests. This literature is limited, though, in terms of the groups studied and the measures of executive functions. In this paper, we present data from two studies addressing these issues. In a first behavioral study, we asked whether high trait aggressiveness is related to reduced executive functions. A sample of over 600 students performed in an extensive behavioral test battery including paradigms addressing executive functions such as the Eriksen Flanker task, Stroop task, n-back task, and Tower of London (TOL). High trait aggressive participants were found to have a significantly reduced latency score in the TOL, indicating more impulsive behavior compared to low trait aggressive participants. No other differences were detected. In an EEG-study, we assessed neural and behavioral correlates of error monitoring and response inhibition in participants who were characterized based on their laboratory-induced aggressive behavior in a competitive reaction time task. Participants who retaliated more in the aggression paradigm and had reduced frontal activity when being provoked did not, however, show any reduction in behavioral or neural correlates of executive control compared to the less aggressive participants. Our results question a strong relationship between aggression and executive functions at least for healthy, high-functioning people.
Introduction
There has recently been increasing interest in examining the similarities and interactions between cognitive and affective control and their underlying neural networks (Ochsner et al., 2002; Ochsner and Gross, 2005; Etkin et al., 2006; Egner et al., 2008; Chiew and Braver, 2011). Studies compare, for instance, interference control in an emotional vs. neutral context and typically find at least partly overlapping networks with a common hub in the anterior cingulate cortex (ACC; Etkin et al., 2006; Egner et al., 2008). These results lead to the critical question whether interindividual differences in the identified control “mechanisms” impact behavior in social interactions also. Here, we ask whether executive control functions relate particularly to the control of aggressive behavior.
Previous research on the relationship between executive functions and aggressive behavior in humans points mostly to an inverse relationship. This literature is limited though in some important aspects: firstly, most of this research focused on clinical groups, such as patients with personality disorders or neurological diseases (Anderson et al., 1999; Morgan and Lilienfeld, 2000; Brower and Price, 2001; Blair et al., 2006). This leaves the question open to what extent interindividual variability of aggressive behavior in psychologically and neurologically healthy people can be explained by differences in executive functions. Secondly, studies typically include only a few measures of executive functions, although executive functions comprise a range of different functions such as working memory, performance monitoring, and inhibition with only low intercorrelations between tasks designed to tap into each one of them (Miyake et al., 2000). In line with this, psychopathic patients show specific deficits in some but not all tests of executive functions (Blair et al., 2006). Lastly, only rarely did researchers assess the neural correlates of executive functions by means of functional magnetic resonance imaging (fMRI) or electroencephalography (EEG) although these measures might (i) be more sensitive to interindividual variability and (ii) provide clues about the underlying “mechanism” of the suggested interaction between executive functions and aggression. In this paper, we present behavioral and electrophysiological data addressing these issues.
Studies relating executive functions and aggression have mainly focused on psychiatric or neurological samples (Anderson et al., 1999; Raine et al., 2000; Brower and Price, 2001). Patients with antisocial personality disorder, psychopathy, or conduct disorder exhibit impaired performance in measures of executive functions (Morgan and Lilienfeld, 2000; Blair et al., 2006). In addition, evidence exists for structural alterations in prefrontal areas in patients with antisocial personality disorder, supposedly underlying these diminished executive functions (Raine, 1993; Raine et al., 2000). However, there are likely fundamental differences between psychiatric patients and individuals with increased, but non-pathological trait aggressiveness. These clinical studies therefore cannot speak to the influence of executive functions on aggressive behavior in healthy people, which has been addressed in a couple of studies with non-clinical samples using laboratory measures of aggression (Hoaken et al., 2003; Pihl et al., 2003; Giancola, 2004). Hoaken et al. (2003), for instance, selected participants based on their performance in two executive function tasks (Spatial Conditional Association Learning Task and Self-Ordered Pointing Task), and demonstrated enhanced levels of laboratory-induced aggression in participants with lower executive functions. A different approach was chosen by Giancola (2004), who derived a composite score of executive functions from a neuropsychological test battery and related this to participants’ behavior in the Taylor aggression paradigm (TAP). Although the hypothesis of less aggressive behavior in people with high executive functions was confirmed, the data also showed interactions with alcohol consumption and gender, such that the largest difference related to executive functioning was observed in intoxicated men, while aggressive behavior shown by women was independent of executive functions.
The approach of Giancola (2004), linking aggressive behavior to a global measure of executive functions, is questioned both by evidence for the diversity of executive functions (Duncan et al., 1997; Miyake et al., 2000; Friedman and Miyake, 2004; Braver and Ruge, 2006) and by studies demonstrating an influence of specific components of executive functions on aggressiveness. Blair et al. (2006) for instance, could differentiate the link between prefrontal functions and violence by showing that the performance of psychopaths is impaired particularly in tests sensitive for orbitofrontal dysfunctions (object alternation task), but unimpaired in tasks probing dorsolateral prefrontal cortex (spatial alternation task), or cingulate cortex functions (number-Stroop reading). Moreover, a common explanation for the relationship of executive functions and violence is related particularly to the concept of impulsivity (Hoaken et al., 2003; Krakowski, 2003), such that people with low executive functions are thought to be unable to inhibit aggressive response tendencies. This is supported by studies directly investigating the link between aggression and impulsivity in healthy humans. LeMarquand et al. (1998), for instance, reported performance differences in a Go/No-go task between low and high trait aggressive adolescents, such that more aggressive boys made also more commission errors. This raises the question whether the relationship between aggressiveness and executive functions can be explained with the concept of impulsivity only or, as suggested by Giancola (2004), goes beyond an impairment in inhibitory functions.
The present study thus aimed at extending the approach of Blair et al. (2007) by examining mentally healthy people and by administering a larger test battery for executive functions. Hence, we tested effects of participant’s trait aggressiveness on performance in a range of neuropsychological tests. We largely followed the approach by Miyake et al. (2000), dissociating updating, shifting, and inhibtion as executive functions. We thus administered tests tapping the different functions updating (n-back), shifting (verbal fluency, trail-making test, task switching), and inhibition (Eriksen Flanker task, Stroop) and also included more complex executive functions tests, such as the Tower of London (TOL) and Wisconsin Card Sorting Test (WCST; Miyake et al., 2000). This enabled us to clarify the relationship between trait aggressiveness and specific components of executive functions.
Aggressiveness as assessed with trait questionnaires captures the interindividual variability in aggressive behavior only partly, however. In the second study, we therefore focused on participants who were characterized based on their laboratory-induced aggressive behavior in the TAP and examined neural and behavioral correlates of error monitoring and response inhibition. Neural measures of executive functions might be more sensitive for interindividual differences (Krämer et al., 2007) and can moreover reveal the underlying “mechanism” by which executive functions are linked to the control of aggression. Specifically, we and others recently provided evidence for differences in frontal activity related to interindividual variability in reactive aggression (Lotze et al., 2007; Krämer et al., 2008; Krämer et al., 2009). Participants who scored high in trait aggressiveness but largely refrained from retaliation in response to provocation showed increased frontal activity when being provoked (Krämer et al., 2008; Krämer et al., 2009). This was suggested to reflect inhibitory control functions contributing to the regulation of reactive aggression. The respective correlates of frontal activity (increased frontolateral negativity, higher frontal theta response) showed similar spatiotemporal dynamics compared with neural correlates of “cold” executive functions. It is thus tempting to assume that participants who show increased frontal activity when being provoked in a social interaction also demonstrate higher frontal activity in cognitively demanding situations. With the present study, we wanted to test this assumption. To this end, we assessed differences in neural correlates of executive functions (performance monitoring, response inhibition) between groups of participants showing low or high experimentally induced aggression in the TAP. As reported previously (Krämer et al., 2009), these participants differed also in their frontal activity in response to the provocation.
To sum up, we investigated the link between executive functions and aggressive behavior by (i) comparing high and low trait aggressive participants’ performance in an extensive executive function test battery and by (ii) assessing neural and behavioral correlates of executive functions in participants characterized by their behavior in an aggressive social interaction. As measures of executive functions, we focused on the error-related negativity (ERN) and the inhibition-related N2 as these are well-established correlates of performance monitoring (Falkenstein et al., 1990; Gehring et al., 1993) and response inhibition (Ramautar et al., 2004; Schmajuk et al., 2006) and sensitive for interindividual differences (Pliszka et al., 2000; Krämer et al., 2007). The ERN is a frontocentral negativity, maximal around 60 ms after an erroneous response, which is believed to emanate from dorsal ACC. The stop-N2 is maximal over central (Ramautar et al., 2004) or right frontal areas (Pliszka et al., 2000) and assumed to be generated in the ACC or right prefrontal cortex. Based on the existing evidence, we expect less aggressive people to show better performance in executive functions tasks and an increased ERN and stop-N2.
Behavioral Study
Materials and Methods
All procedures were cleared by the ethical review boards of the University of Magdeburg and the University of Barcelona. The study was conducted in compliance with the Declaration of Helsinki.
Participants
The data were assessed from 655 students from the University of Barcelona (491 women; age range from 18 to 39, mean = 21.7 ± 3.2). The participants underwent a neuropsychological test battery and filled out a range of personality and health questionnaires.
Questionnaire
As a measure of aggressiveness, we used the Aggression Questionnaire (Buss and Perry, 1992) in its Spanish version (Andreu Rodríguez et al., 2002). The Aggression Questionnaire, which has been used extensively in many studies of aggressive behavior, is a valid self-report technique to assess the different subtraits of aggressiveness: physical and verbal aggression, which reflect the instrumental and motor components of aggression; anger, which is related to the affective component of aggression; and finally hostility, assessing feelings of ill will and injustice and thus representing the cognitive component of aggressiveness. A total score (AQ) as well as scores for the subscales Physical Aggression (AQ-PA), Verbal Aggression (AQ-VA), Anger (AQ-A), and Hostility (AQ-H) can be derived. The questionnaire has been shown to have good reliability as well as good convergent and discriminative validity (Buss and Perry, 1992; Andreu Rodríguez et al., 2002; Tremblay and Ewart, 2005; Vigil-Colet et al., 2005). To control for possible effects of impulsivity, we also administered the I7 Impulsivity Questionnaire (Eysenck et al., 1985).
Behavioral test battery
Flanker task. We applied a modified variant of the Eriksen flanker task (Eriksen and Eriksen, 1974), that required the participants to respond to the central arrow in an array of five arrows (with the right hand following a right-directed arrow and vice versa). The four surrounding arrows were either compatible or incompatible to the central arrow, favoring performance errors. We presented 38.5% of compatible and 38.5% of incompatible trials. In 11.5% of trials we included no-go-trials as in the stop-signal paradigm (Band et al., 2003). In these trials, the central green arrow changed to red after a variable delay, indicating participants to inhibit the response in these trials. Two different stop-signal delays were applied (with equal probability), one yielding a low inhibitory rate (180 ms), and one yielding a high inhibitory rate (70 ms). In the remaining 11.5% of trials we included change trials, in which the central arrow changed its direction after 50 ms, indicating the subject to react with the other hand. Each stimulus array was presented in the middle of the screen. Stimulus duration was 300 ms and the stimulus onset asynchrony (SOA) was between 900 and 1100 ms (rectangular distribution). Participants received 10 training trials to get acquainted to the task. They were encouraged to correct their errors in the go-trials as fast as possible. The experiment was divided into three blocks, each comprising 208 trials, resulting in a total of 624 trials. We derived several parameters from this task, reflecting inhibitory functions, stimulus–response interference, and performance monitoring: incongruency effect on reaction time (reaction time of correct responses in incompatible trials – compatible trials) and percentage of errors (errors in incompatible trials – compatible trials), percentage of inhibited trials, stop-signal reaction time (SSRT; see Band et al., 2003) for the computation; we used the easy stop-trials for computation of the SSRT) and percentage of correctly changed trials.
Stroop. We used a computerized version of the classical Stroop task (Stroop, 1935), presenting the words “blue,” “green,” and “red” in either the congruent or incongruent color, requiring the participants to press the button that was associated with the color of the ink. One hundred twenty-one trials were presented (50% incongruent), with 10 training trials in the beginning. Stimulus duration was 500 ms and the SOA varied randomly between 1500 and 2500 ms. We computed the incongruency effect on the reaction time (reaction time of correct responses in incongruent trials – congruent trials) and the percentage of errors (errors in incongruent trials – congruent trials).
N-back working memory task. Letters were presented one by one centered on a video monitor, requiring the subject to press a button, whenever the letter was identical to the one shown two letters before. Letters were depicted in upper- and lowercase with the case to be ignored for the task, encouraging the participant to verbally encode and rehearse the letter. One-third of the trials were target trials. Stimulus duration was 500 ms with an SOA of 2500 ms. We computed the percentage of correct trials and the reaction times of correct responses as measures of working memory performance.
Task switching. We used the task switching paradigm from a German test battery for attention assessment (Zimmermann and Fimm, 1994). In every trial one letter and one digit were presented. The participants were asked to pay attention to the letter or the digit in alternating trials and to press a button on the respective side (right or left). Each trial thus required a switch of the attention focus (letter or digit). However, in some trials a switch of the response hand was needed, while in others no switch was needed. Switching of the response hand has been shown to be easier, reflected in a shorter reaction time (Zimmermann and Fimm, 1994). Note that the switch costs are thus reversed in the current task, as they do not refer to the switch of the attention focus, but to the switch of the response hand. One hundred trials were presented, each trial ended with the subject’s response. We computed the mean reaction time of correct switch responses and the difference between reaction times in switching and non-switching trials.
WAIS matrices. We used the matrices subtest of the WAIS III (Wechsler, 1997) to assess participants’ non-verbal reasoning abilities. It consists of 29 designs, requiring the participant to fill in a missing design from a number of choices. A computerized version was used with a time restriction of 25 s for each design. The total number of solved problems was scored.
Verbal fluency. We used a semantic verbal fluency task. Participants were required to write down as many animals as possible, within 2 min. Dependent variable was the number of generated words.
Trail-making-test. This test (Reitan, 1958) has two parts. Trail-making-test (TMT) A requires the participant to connect a sequence of numbers (1–25) distributed over a whole page as fast as possible without lifting the pen from the paper. This part measures visuomotor tracking. In TMT B, the subject has to alternate between numbers and letters (1–A–2–B–3…), which necessitates more attention and conceptual tracking. The time to complete parts A and B was measured and the difference between A and B was taken as test parameter, which removes the simple differences in motor functions.
Wisconsin Card Sorting Test. The Nelson version of the WCST (Nelson, 1976) comprises a series of 48 cards, which show printed colored geometrical figures, that differ in one or more dimensions: shape, color, or number. Participants were asked to discover the rule and sort each card by matching it to one of the four stimulus cards, with the rule changing after six consecutive correct sorts. The task was presented as a computerized version. We used the number of perseverative errors (two successive card assignments to an incorrect dimension) as parameter from this test.
Tower of London. We used the TOL – Drexel version (Culbertson and Zillmer, 1998), comprising 10 test items with 4–7 required movements each. Participants are instructed to replicate different patterns of cylinders on three pegs in as few moves as possible. Two rules have to be adhered to: only one cylinder at a time can be moved and more cylinders cannot be placed on a peg than the peg can accommodate. For each item 120 s are given to solve the task. Measured parameters are the time to start the first move (latency), and the number of moves exceeding the necessary number of moves.
Data analysis
We examined differences in executive functions between high and low trait aggressive participants. To this end, we compared participants within the lowest and the highest quartile of the aggression questionnaire (general score) in their performance in the executive functions test battery with univariate analyses of variance (ANOVAs). To examine possible differential effects of trait aggressiveness on executive functions (Hoaken and Pihl, 2000), we added sex as second factor to test for sex by AQ interactions.
Results
All executive functions parameters of interest were available from 91 participants in the lowest aggression quartile and from 90 participants in the highest aggression quartile. Participants in the low trait aggressive group (70 women) had a maximum aggression score of 53 (mean = 46.1 ± 5.2), while high trait aggressive participants (66 women) had a minimum score of 74 (mean = 83.9 ± 8.0).
The univariate ANOVAs for the different executive functions parameters yielded a significant difference between high and low trait aggressive participants in the latency score of the TOL only (F1,179 = 11.41, puncorrected = 0.001; pBonferroni < 0.05). This was due to a shorter latency in high than in low trait aggressive participants (see Table 1; Figure 1). A trend toward group differences was seen in the Stroop incompatibility effect on the error rate, with a higher incompatibility induced increase of the error rate in low trait aggressive people, but did not survive the correction for multiple comparisons (F1,179 = 4.18, puncorrected = 0.045, pBonferroni > 0.1). No other group differences were observed (Table 1). Adding sex as a second factor did not change the results substantially and, importantly, no interactions of sex by AQ were detected (all p > 0.1). We additionally performed regression analysis testing for effects of the Aggression Questionnaire score on the executive functions measures in the complete sample. This approach yielded similar results, since only the effect on the TOL latency measure was statistically significant after correction for multiple comparisons (β = −0.120, puncorrected = 0.003; pBonferroni < 0.05). As performance in the TOL has been related to inhibitory functions, the reduced latency in high trait aggressive participants might reflect higher impulsivity. To test this, we finally performed a regression analysis with both the I7 Impulsivity scale and the Aggression Questionnaire as predictors of the TOL latency measure. The I7 Impulsivity score significantly predicted the TOL performance (β = −0.109, p = 0.015), but the AQ did not yield significance anymore (β = −0.072, p = 0.106). This suggests that the reduced latency in high trait participants reflects a higher tendency for impulsive behavior.
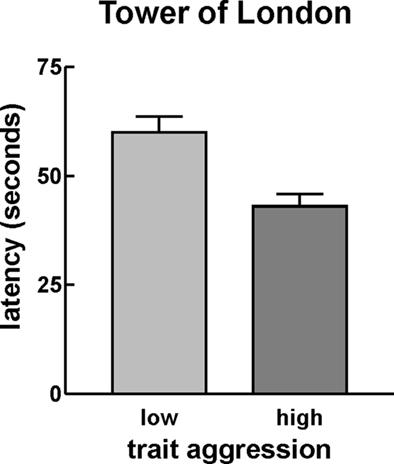
Figure 1. Average latency (seconds) in the Tower of London task separately for low (left) and high (right) trait aggressive participants. High trait aggressive participants showed a reduced latency of the first move in the ToL paradigm. Error bars reflect SE.
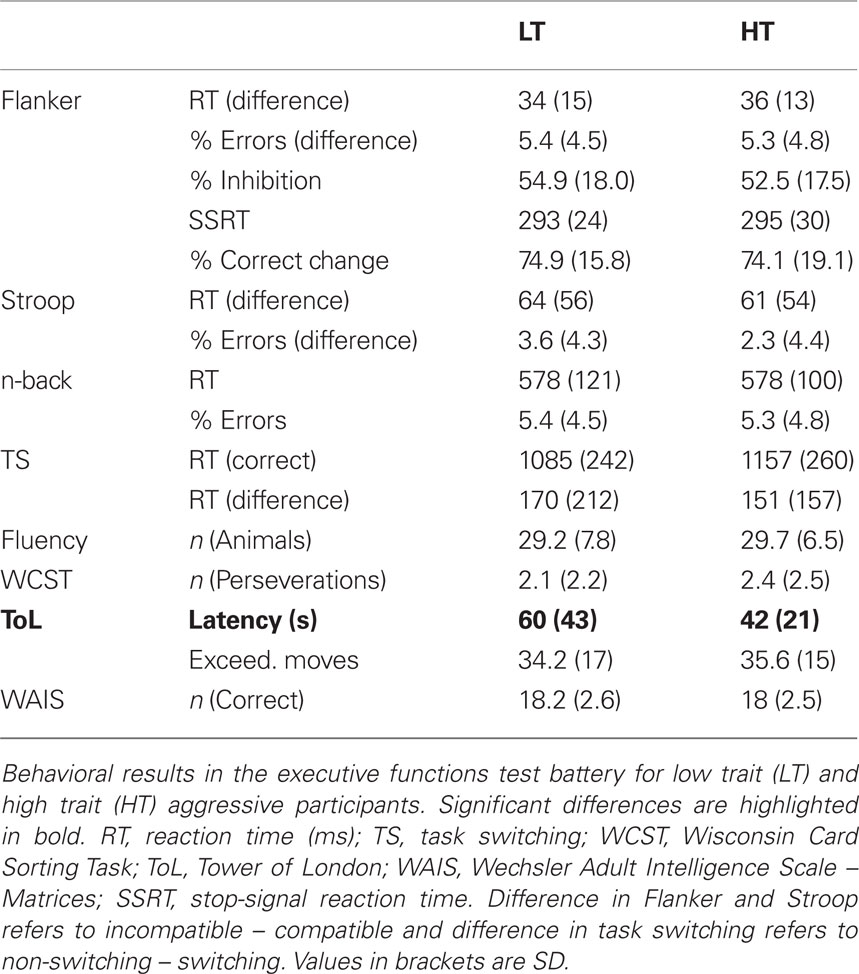
Table 1. Results of executive functions test battery (Study 1).
EEG-Study
Materials and Methods
Participants
Note that the behavioral and EEG results of the aggression paradigm in this study have been reported previously (Krämer et al., 2009). Here, we only summarize the relevant results of the aggression paradigm and focus on the results of the Flanker experiment.
Participants were selected from two larger groups of students from the University of Magdeburg on the basis of their scores on an aggression questionnaire (see below). The first sample comprised 231 economy students (129 women; mean age 22.6, SD 1.9) and the second sample consisted of 520 students from engineering, economics, medicine, and humanities (286 women; mean age 22.9 years). From these groups, we selected participants with high values in the aggressiveness score (see below for further explanation).
Thirty-two students (17 women, mean age = 24.7) participated in the EEG-study after giving informed consent. All were free of neurological or psychiatric disorders and had normal or corrected-to-normal vision. Four participants were excluded from further analyses because they were deemed not to have been completely deceived in the aggression paradigm (n = 2) or because of excessive eye movement artifacts. Thus, 28 participants (15 women; mean age = 24.7 years) were included in the analyses. One participant had a very low inhibition rate of 4% in the stop-task (see below) and was thus excluded from analysis of the stop-trials. Participants received money as compensation.
Questionnaire
Participants were selected based on their trait aggressiveness assessed with a German inventory for the assessment of factors of aggression (FAF, Fragebogen zur Erfassung von Aggressivitätsfaktoren; Hampel and Selg, 1975). With this questionnaire, five subscales (spontaneous aggression, reactive aggression, impulsiveness, autoaggression, aggression inhibition) and a control scale (openness) can be obtained. Spontaneous aggression (19 items) refers to unrestrained verbal or physical aggression. A typical item is “I sometimes like to tantalize others.” Items of the reactive aggression scale (13 items) ask for aggressive reactions to some kind of provocation or unfairness, such as “If someone provokes me, I want to punish him badly.” Items of the impulsivity scale (13 items) deal with the affective component of aggression, as “I flare up quickly, but get over it quickly.” The sum of the scales “spontaneous aggression,” “reactive aggression,” and “impulsiveness” gives a reliable measure for outwardly directed aggression (internal consistency Cronbach’s alpha = 0.85) and was thus used for selection of high trait aggressive participants. The sum score has been shown to be significantly different between both adolescent and adult violent criminals on the one hand and non-violent controls on the other hand (Hampel and Selg, 1975), providing evidence for its external validity.
Task and procedure
All participants performed first in the aggression paradigm and afterward in the Eriksen Flanker task. Aggression was elicited and assessed using a modified version of the TAP (Taylor, 1967). Participants were instructed that they were playing successive competitive reaction time trials against one of two opponents in alternating trials (Krämer et al., 2009). The opponents (one man, one woman), confederates of the experimenters, met the participant prior to the experiment to jointly listen to the instructions. They were told that whoever lost would be punished by the opponent with a mildly painful electric shock. The severity of the punishment, that is the intensity of the shock, had to be selected for each trial on a range from 1 to 8. In fact, selections of the putative opponents and outcome of the trials (50% winning and losing trials for each opponent) were under control of the experimenter. The experiment comprised seven blocks of 40 trials each, yielding a total of 280 trials. Participants were told that the opponents would play in alternating trials and rest during the others. At the end of the experiment participants were completely debriefed about the deception and the experiment’s motivation.
We applied a modified variant of the Eriksen Flanker task (Eriksen and Eriksen, 1974), which was highly similar to the paradigm used for the behavioral study (see above and Krämer et al., 2007). In contrast to the behavioral study, the delay of the stop-signal was adapted to participants’ behavior by means of a staircase-tracking algorithm (Band and van Boxtel, 1999) as follows. The stop-signal delay was set to 140 ms initially. After a successful inhibition, the stop-signal delay was increased by 10 ms (making the inhibition harder). After a failure in inhibition, the stop-signal delay was reduced by 10 ms (making the inhibition easier). This procedure was applied to yield an inhibition rate of about 50%. We computed the SSRT (Band et al., 2003) by subtracting the participant’s mean stop-signal delay from the median reaction time of correct go responses. No change trials were included, yielding thus 33% of stop-trials. Participants received 20 training trials to get acquainted to the task. They were encouraged to correct their errors in the go-trials as fast as possible. The experiment was divided in eight blocks, each comprising 240 trials, resulting in a total of 1920 trials. Duration of the experiment including electrode preparation was 2.5 h.
EEG recordings
The electroencephalogram (EEG) was recorded from 27 tin electrodes mounted in an elastic cap (Easycap™; positions: Fp1/2, F3/4, C3/4, P3/4, O1/2, F7/8, T7/8, CP1/2, PO3/4, FC1/2, FC5/6, CP5/6, Fz, Cz, Pz) with reference electrodes placed on the right and left mastoid. During recording, all scalp electrodes were referenced against an average reference and offline re-referenced against the algebraic mean of the activity at the two mastoid electrodes. Electrode impedances were kept below 5 kΩ. To monitor horizontal eye movements, electrodes were placed on the outer canthus of the right and left eye. Vertical eye movements and blinks were monitored by electrodes placed below and above the right eye. EEG and EOG were recorded continuously with a bandpass of 0.01–70 Hz and digitized with a sampling rate of 250 Hz.
Data analysis
Stimulus- and response-locked averages were obtained for errors and stop-trials. For stimulus-locked ERPs, the 100-ms preceding the stimulus were considered as baseline, for response-locked ERPs, baseline was defined as the 50-ms before the button press (Rodriguez-Fornells et al., 2002; Krämer et al., 2007). All artifact-free error trials were included irrespective of a following corrective response. To account for the overlap between go- and stop-ERPs in the stop-signal-locked data, we computed difference waves following previously published methods (Ramautar et al., 2004; Ramautar et al., 2006; Krämer et al., in press). Specifically, we shifted go ERPs from the respective reaction time distribution (fast reactions for errors and slow reactions for successful inhibitions) across the range of individuals’ stop-/change-signal delays weighted by the actual occurrence of that delay and averaged them. These “virtual” go ERPs were then subtracted from successful and failed inhibitions.
For statistical analyses, mean amplitudes (unless otherwise stated) were subjected to a repeated measures ANOVA with the between-subject factors of experimentally induced aggression (factor Group, HE vs. LE) and the within-subject factors condition and electrode position, dependent on the particular component (as stated below). For all statistical effects involving more than one degree of freedom in the numerator, the Huynh–Feldt correction was applied to correct for possible violations of the sphericity assumption (Huynh and Feldt, 1976). The corrected probabilities are reported.
Results
Aggression paradigm
Participants selected higher punishments for the highly provoking opponent (mean 5.25 ± 1.16) compared to the non-provocative opponent (2.86 ± 1.16; t27 = 6.90, p < 0.001). The average time to make the selection under high provocation was 1060 ms (±467), which did not differ from the time taken to select the punishment under low provocation (1059 ± 446 ms). Participants’ mean reaction time to the target was 202 ms (±39).
For the present study, we wanted to examine differences in executive functions between participants responding aggressively to the provocation (high experimentally induced aggressiveness, HE) and those that did not (LE). We accordingly divided the sample into two groups based on their average selection under high provocation (median split; Figure 2A). Although the provocation effect was evident in both groups, it was clearly higher in the HE group (t13 = −20.40, p < 0.001) than in the LE group (t13 = −2.7, p = 0.019). The two groups did not differ with respect to their mean FAF-score (t26 = 1.32, p = 0.20) or regarding gender distribution (χ2 = 0.337, p = 0.561).
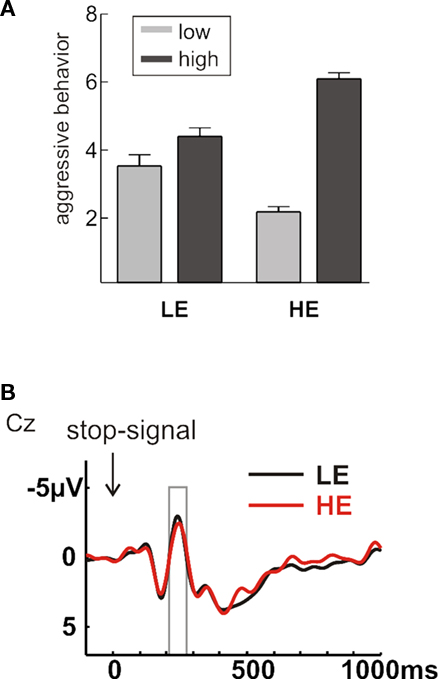
Figure 2. (A) Depicted are the mean selections under low (light gray) and high (dark gray) provocation separately for the two groups LE (low experimentally induced aggression) and HE (high experimentally induced aggression; right panel) in the Taylor Aggression Paradigm. Error bars reflect SE. (B) Event-related potentials (ERPs), stimulus-locked to the stop-stimulus in successfully inhibited trials, separately for the groups LE (black line) and HE (red line). The time-window of interest for the stop-N2 (200–280 ms) is indicated with a gray box.
Flanker paradigm
Participants were faster (385 ± 36 ms) and more accurate (error rate 6.2 ± 5.6 %) in compatible than in incompatible (409 ± 39 ms; 12.9 ± 8.1 %) trials (reaction times: F1,26 = 105.9, p < 0.001; accuracy: F1,26 = 70.8, p < 0.001). The staircase-tracking algorithm was successful, such that the average inhibition rate was 49.1% (±4.5). The average SSRT was estimated to be 271 ms (±41). As typically observed in the Eriksen Flanker task, participants slowed down after making errors, both after errors in go-trials (post-error-slowing: 26 ± 31 ms) and after stop-errors (14 ± 31 ms). Table 2 shows the behavioral data separately for the two groups. We did not detect significant group differences in any of the behavioral measures.
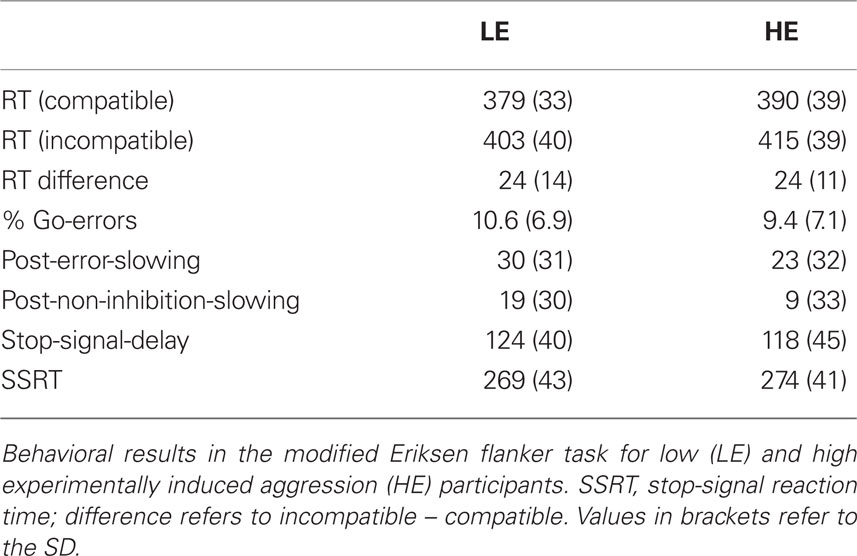
Table 2. Behavioral results of modified Flanker task (Study 2).
As neural correlates of performance monitoring and response inhibition, we assessed the ERN and the stop-signal related N2, respectively (Krämer et al., 2007). Note that one outlier (in the LE group) was excluded from the analysis of the stop-trials because of an inhibition rate below 5% (see Materials and Method). In stop-trials, both inhibited and non-inhibited trials elicited an N2 distributed over central and parietal areas, as had been reported previously (Pliszka et al., 2000; Schmajuk et al., 2006; Krämer et al., 2007). The N2 was maximal around 230 ms after the stop-signal. To examine group differences in inhibitory control, we compared average amplitude values in the N2 time-window (200–280 ms) at midline electrodes with a repeated measures ANOVA with the within-subject factors Inhibition (inhibited vs. non-inhibited) and Electrode (Fz, Cz, Pz) and the between-subject factor Group (LE vs. HE). Errors showed a larger negativity over central electrodes (Inhibition × Electrode: F2,50 = 4.80, p < 0.019). No main effects or interactions with the factor Group were significant (all F < 1; Figure 2B), suggesting comparable inhibitory functions in participants showing low or high experimentally induced aggression. This was further supported when testing for correlations between aggressive behavior and the stop-N2 amplitude at Cz across the whole sample. The stop-N2 amplitude for inhibited trials did not correlate with aggressive behavior (p > 0.1).
A clear ERN was detectable in the group averages, which peaked around 60 ms and had the typical frontocentral maximum (Figure 3). Based on previous literature (Rodriguez-Fornells et al., 2002; Krämer et al., 2007), we submitted average amplitude values of the time-window 30–80 ms to a repeated measures ANOVA with the within-subject factors Accuracy (error vs. correct) and Electrode (Fz, Cz, Pz) and the between-subject factor Group (LE vs. HE). The ANOVA confirmed the enlarged negativity in error compared to correct trials at frontocentral electrodes (Accuracy: F1,26 = 39.60, p < 0.001; Accuracy × Electrode: F2,52 = 39.70, p < 0.001). In contrast to our hypothesis, the highly aggressive group showed a tendency for a larger ERN, but this trend did not even yield marginal significance (Accuracy × Group: p > 0.1). The correlation between ERN amplitude at Fz and aggressive behavior across the whole sample was not significant either (p > 0.1).
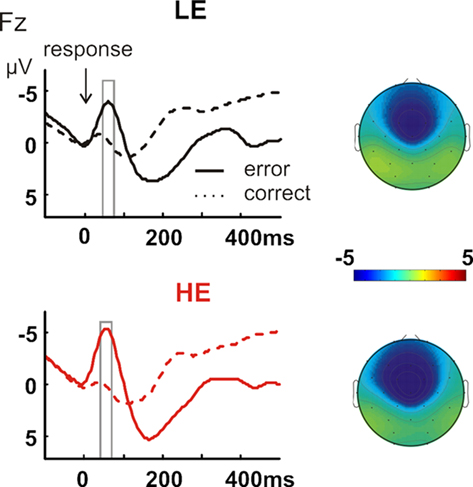
Figure 3. Response-locked ERPs for error (solid line) and correct (dashed line) trials, separately for the LE (upper row, black lines) and HE group (lower row, red lines). The time-window of interest for the error-related negativity (30–80 ms) is indicated with a gray box and the respective topographical maps of the average amplitude in the time-window of interest is shown separately for the two groups (upper map: LE; lower map: HE).
Discussion
In the present study, we examined the relationship between executive functions and aggressive behavior using a combined behavioral and electrophysiological approach. We assessed performance differences on an extensive test battery of executive functions between high and low trait aggressive participants and found a prolonged latency of the first move in the TOL in low trait aggressive people. Additionally, a separate group of participants differing in reactive aggressive behavior as measured by the TAP performed a modified Eriksen Flanker task aimed to tap into performance monitoring and response inhibition aspects of executive functions. The groups did not differ, however, in behavioral or neural correlates of cognitive control. The results question a strong link between executive functions and control of aggressive behavior.
Behavioral Study
High and low trait aggressive participants differed regarding their executive functions only in the latency parameter of the TOL, with a shorter latency in highly aggressive people. No other differences were observed, arguing against a general impairment in executive functions associated with high trait aggressiveness (Giancola, 2004). Moreover, regression analysis on the whole sample showed a significant relationship between trait aggressiveness and the TOL latency measure only. Regarding the TOL, different parameters are usually measured to quantify participants’ performance in this task, supposedly reflecting the different cognitive processes involved (i.e., working memory, planning, and inhibition). The number of exceeding movements has been shown to correlate with fluid intelligence (matrix reasoning; Zook et al., 2004), but the case is less clear for the latency parameter. However, as both the TOL and the similar Tower of Hanoi depend on inhibitory functions (Goel and Grafman, 1995; Welsh et al., 1999; Miyake et al., 2000), this factor might be in fact best captured by the time to initiate the first movement, (i.e., the time taken to consider the best solution). Shorter latencies in highly aggressive participants might therefore reflect their reduced inhibition abilities and tendency for impulsive, imprudent behavior. This interpretation is further strengthened by the observation of a significant correlation between the I7 Impulsivity score and the TOL latency measure, which could largely account for the effect of trait aggressiveness on the TOL performance in a regression analysis.
We did not find any differences in other parameters of inhibitory functions, however (e.g., the Stroop incompatibility effect or the percentage of inhibited trials in the Flanker task). Two reasons could have accounted for this: first, the inhibitory functions in the Stroop or Flanker task have a stronger motor component and thereby differ from the inhibition required for the TOL. However, this argument is challenged by reports of significant correlations between Stroop performance and TOL or Tower of Hanoi performance (Welsh et al., 1999; Miyake et al., 2000). Alternatively, the TOL latency score might be a more sensitive parameter, while ceiling effects accounted for indistinguishable performance in the Stroop or Flanker. It should be noted, that the same argument applies for the other parameters. As all participants were young and healthy, it might be that the applied tasks were not sensitive enough to detect subtle interindividual differences in executive functions. This can most likely be ruled out, since the different parameters presented a considerable interindividual variance and previous studies have shown subtle genotype effects with these tasks (Egan et al., 2001; Goldberg et al., 2003).
This result extends previous findings regarding the relationship of inhibitory abilities and aggressive behavior. Observations in both psychiatric and neurological patients hint at probable prefrontal alterations causing an impaired response control, which is likely underlying their higher proneness to violence (Raine, 1993; Kiehl et al., 2000; Munro et al., 2007a). Kiehl et al. (2000) for instance could demonstrate diminished neurophysiological correlates of response inhibition in psychopaths, supposedly associated with their inability to refrain from aggressive outbursts. However, these patients may possibly have extensive structural and functional abnormalities, which limits the conclusions that can be drawn about specific causes of their behavioral deficits. Laboratory studies in healthy samples could provide additional evidence for the relationship between aggressive tendencies and inhibitory abilities, as highly aggressive participants also show more impulsive behavior (Cleare and Bond, 1995; LeMarquand et al., 1998). Also Sellbom and Verona (2007) reported significant correlations between a self-report measure of psychopathic traits and a response inhibition composite score in a student sample. Our behavioral data support the notion of a role of inhibitory functions in the regulation of aggressive behavior and question a general, non-specific influence of executive functions on aggression (Giancola, 2004).
EEG-Study on Executive Functions
One might argue that trait questionnaires are only part of the story and that aggressive behavior elicited in response to provocation in the lab might be a better measure to distinguish groups of low or high aggressiveness. In fact, EEG findings related to laboratory-induced reactive aggression suggested enhanced prefrontal activity in those with high trait aggressiveness, who were able to refrain from retaliation after provocation (Krämer et al., 2008, 2009). This suggests that executive functions might particularly impact violent behavior in more challenging situations that involve interpersonal provocation, for example. Based on this reasoning, we compared participants who differed in their aggressive response to provocation with respect to behavioral and neural measures of executive functions. However, although the two groups of high and low experimentally induced aggression clearly differed in their neural response to provocation in the aggression paradigm (Krämer et al., 2009), we did not observe any evidence for diminished executive functions in the highly aggressive group. In fact, this group showed a tendency for a higher ERN, and thus, better performance monitoring (i.e., better executive functions), compared to the less aggressive group. Additionally, correlations between aggressive behavior and the ERN and stop-N2 amplitude did not yield significance.
Previous results regarding the ERN or stop-N2 in psychiatric samples are not fully conclusive, with a few studies showing diminished error monitoring or inhibitory control in psychopaths or persons with antisocial personality disorder and others finding no difference (Kiehl et al., 2000; Munro et al., 2007a,b; Brazil et al., 2009, 2011; von Borries et al., 2010). Evidence points specifically to altered error monitoring in an affective context (Munro et al., 2007a) or in learning tasks (von Borries et al., 2010). The present results are consistent with a view that there is no direct link between aggressive behavior and a general impairment in executive control functions, such as performance monitoring or response inhibition. In fact, the results showed a tendency for a higher ERN in highly aggressive participants. Since personality variables, such as anxiety, are known to influence the ERN (Hajcak et al., 2003; Aarts and Pourtois, 2010), one might speculate that differences in emotional responsivity were underlying the increased reactive aggression and the tendency for a higher ERN in this group.
The small sample size of 14 participants per group might have precluded significant group differences. This is rather unlikely, however, as the groups significantly differed in their neural response to provocation in the aggression paradigm (Krämer et al., 2009). In addition, we used a median split to analyze our data, which leads to rather similar groups. Comparing extreme groups may have lead to significant differences in neural correlates of cognitive control, as well.
Conclusion
There has been an increasing interest in the relationship between control of emotions vs. cognition in recent years, raising the question whether interindividual differences in executive control functions impact behavior in social interactions. The present study suggests that cognitive control as assessed with neural and behavioral measures of executive functions does not directly relate to aggressive behavior in affective social interactions. This brings into question a strong link between aggression and executive functions in healthy high-functioning individuals.
Conflict of Interest Statement
The authors declare that the research was conducted in the absence of any commercial or financial relationships that could be construed as a potential conflict of interest.
Acknowledgments
Supported by grants from the German Federal Department of Research (BMBF; to Thomas F. Münte), the German Research Foundation (DFG; to Ulrike M. Krämer (Robert P. J. Kopyciok 3691/1-1) and Thomas F. Münte (SFB 779/A5), the University of Lübeck (E36/2011 to Ulrike M. Krämer) and the Volkswagen Foundation (to Thomas F. Münte and Antoni Rodriguez-Fornells).
References
Aarts, K., and Pourtois, G. (2010). Anxiety not only increases, but also alters early error-monitoring functions. Cogn. Affect. Behav. Neurosci. 10, 479–492.
Anderson, S. W., Bechara, A., Damasio, H., Tranel, D., and Damasio, A. R. (1999). Impairment of social and moral behavior related to early damage in human prefrontal cortex. Nat. Neurosci. 2, 1032–1037.
Andreu Rodríguez, J. M., Pena Fernández, M. E., and Grana Gómez, J. L. (2002). Adaptacion psicometrica de la version espanola del Cuestionario de Agresion. Psicothema 14, 476.
Band, G. P., and van Boxtel, G. J. (1999). Inhibitory motor control in stop paradigms: review and reinterpretation of neural mechanisms. Acta Psychol. (Amst.) 101, 179–211.
Band, G. P., van der Molen, M. W., and Logan, G. D. (2003). Horse-race model simulations of the stop-signal procedure. Acta Psychol. (Amst.) 112, 105–142.
Blair, K. S., Newman, C., Mitchell, D. G. V., Richell, R. A., Leonard, A., Morton, J., and Blair, R. J. R. (2006). Differentiating among prefrontal substrates in psychopathy: neuropsychological test findings. Neuropsychology 20, 153–165.
Blair, K. S., Smith, B. W., Mitchell, D. G. V., Morton, J., Vythilingam, M., Pessoa, L., Fridberg, D., Zametkin, A., Nelson, E. E., Drevets, W. C., Pine, D. S., Martin, A., and Blair, R. J. R. (2007). Modulation of emotion by cognition and cognition by emotion. Neuroimage 35, 430–440.
Braver, T. S., and Ruge, H. (2006). “Functional neuroimaging of executive functions,” in Handbook of Functional Neuroimaging of Cognition, eds R. Cabeza, and A. Kingstone (Cambridge, MA: The MIT Press), 307–348.
Brazil, I. A., de Bruijn, E. R., Bulten, B. H., von Borries, A. K., van Lankveld, J. J., Buitelaar, J. K., and Verkes, R. J. (2009). Early and late components of error monitoring in violent offenders with psychopathy. Biol. Psychiatry 65, 137–143.
Brazil, I. A., Mars, R. B., Bulten, B. H., Buitelaar, J. K., Verkes, R. J., and De Bruijn, E. R. (2011). A neurophysiological dissociation between monitoring one’s own and others’ actions in psychopathy. Biol. Psychiatry 69, 693–699.
Brower, M. C., and Price, B. H. (2001). Neuropsychiatry of frontal lobe dysfunction in violent and criminal behaviour: a critical review. J. Neurol. Neurosurg. Psychiatr. 71, 720–726.
Buss, A. H., and Perry, M. (1992). The aggression questionnaire. J. Pers. Soc. Psychol. 63, 452–459.
Chiew, K. S., and Braver, T. S. (2011). Neural circuitry of emotional and cognitive conflict revealed through facial expressions. PLoS ONE 6, e17635.
Cleare, A. J., and Bond, A. J. (1995). The effect of tryptophan depletion and enhancement on subjective and behavioural aggression in normal male subjects. Psychopharmacology (Berl.) 118, 72–81.
Culbertson, W. C., and Zillmer, E. A. (1998). The Tower of LondonDX: a standardized approach to assessing executive functioning in children. Arch. Clin. Neuropsychol. 13, 285–301.
Duncan, J., Johnson, R., Swales, M., and Freer, C. (1997). Frontal lobe deficits after head injury: unity and diversity of function. Cogn. Neuropsychol. 14, 713–741.
Egan, M. F., Goldberg, T. E., Kolachana, B. S., Callicott, J. H., Mazzanti, C. M., Straub, R. E., Goldman, D., and Weinberger, D. R. (2001). Effect of COMT Val108/158 Met genotype on frontal lobe function and risk for schizophrenia. Proc. Natl. Acad. Sci. U.S.A. 98, 6917–6922.
Egner, T., Etkin, A., Gale, S., and Hirsch, J. (2008). Dissociable neural systems resolve conflict from emotional versus nonemotional distracters. Cereb. Cortex 18, 1475–1484.
Eriksen, B. A., and Eriksen, C. W. (1974). Effects of noise letters upon the identification of a target letter in a nonsearch task. Percept. Psychophys. 16, 143.
Etkin, A., Egner, T., Peraza, D. M., Kandel, E. R., and Hirsch, J. (2006). Resolving emotional conflict: a role for the rostral anterior cingulate cortex in modulating activity in the amygdala. Neuron 51, 871–882.
Eysenck, S. B., Pearson, P. R., Easting, G., and Allsopp, J. F. (1985). Age norms for impulsiveness, venturesomeness and empathy in adults. Pers. Individ. Dif. 6, 613.
Falkenstein, M., Hohnsbein, J., Hoormann, J., and Blanke, L. (1990). “Effects of errors in choice reaction tasks on the ERP under focused and divided attention,” in Psychophysiological Brain Research, eds C. H. M. Brunia, A. W. K. Gaillard, and A. Kok (Tilburg: Tilburg University Press), 192–195.
Friedman, N. P., and Miyake, A. (2004). The relations among inhibition and interference control functions: a latent-variable analysis. J. Exp. Psychol. Gen. 133, 101–135.
Gehring, W. J., Goss, B., Coles, M. G., and Meyer, D. E. (1993). A neural system for error detection and compensation. Psychol. Sci. 4, 385–390.
Giancola, P. R. (2004). Executive functioning and alcohol-related aggression. J. Abnorm. Psychol. 113, 541–555.
Goel, V., and Grafman, J. (1995). Are the frontal lobes implicated in “planning” functions? Interpreting data from the Tower of Hanoi. Neuropsychologia 33, 623–642.
Goldberg, T. E., Egan, M. F., Gscheidle, T., Coppola, R., Weickert, T., Kolachana, B. S., Goldman, D., and Weinberger, D. R. (2003). Executive subprocesses in working memory: relationship to catechol-O-methyltransferase Val158Met genotype and schizophrenia. Arch. Gen. Psychiatry 60, 889–896.
Hajcak, G., McDonald, N., and Simons, R. F. (2003). Anxiety and error-related brain activity. Biol. Psychol. 64, 77–90.
Hampel, R., and Selg, H. (1975). Fragebogen zur Erfassung von Aggressivitätsfaktoren. Goettingen: Hogrefe.
Hoaken, P. N., and Pihl, R. O. (2000). The effects of alcohol intoxication on aggressive responses in men and women. Alcohol Alcohol. 35, 471–477.
Hoaken, P. N., Shaughnessy, V. K., and Pihl, R. O. (2003). Executive cognitive functioning and aggression: Is it an issue of impulsivity? Aggress. Behav. 29, 15–30.
Huynh, H., and Feldt, L. S. (1976). Estimation of the box correction for degrees of freedom from sample data in randomized block and splitsplot designs. J. Educ. Stat. 1, 69–82.
Kiehl, K. A., Smith, A. M., Hare, R. D., and Liddle, P. F. (2000). An event-related potential investigation of response inhibition in schizophrenia and psychopathy. Biol. Psychiatry 48, 210–221.
Krakowski, M. (2003). Violence and serotonin: influence of impulse control, affect regulation, and social functioning. J. Neuropsychiatry Clin. Neurosci. 15, 294–305.
Krämer, U. M., Büttner, S., Roth, G., and Münte, T. F. (2008). Trait aggressiveness modulates neurophysiological correlates of laboratory-induced reactive aggression in humans. J. Cogn. Neurosci. 20, 1464–1477.
Krämer, U. M., Cunillera, T., Camara, E., Marco-Pallares, J., Cucurell, D., Nager, W., Bauer, P., Schüle, R., Schöls, L., Rodriguez-Fornells, A., and Münte, T. F. (2007). The impact of COMT and DRD4 genotypes on neurophysiological correlates of performance monitoring. J. Neurosci. 27, 14190–14198.
Krämer, U. M., Knight, R. T., and Münte, T. F. (in press). Electrophysiological evidence for different inhibitory mechanisms when stopping or changing a planned response. J. Cogn. Neurosci.
Krämer, U. M., Kopyciok, R. P., Richter, S., and Münte, T. F. (2009). Oscillatory brain activity related to control mechanisms during laboratory-induced reactive aggression. Front. Behav. Neurosci. 3:46.
LeMarquand, D. G., Pihl, R. O., Young, S. N., Tremblay, R. E., Seguin, J. R., Palmour, R. M., and Benkelfat, C. (1998). Tryptophan depletion, executive functions, and disinhibition in aggressive, adolescent males. Neuropsychopharmacology 19, 333–341.
Lotze, M., Veit, R., Anders, S., and Birbaumer, N. (2007). Evidence for a different role of the ventral and dorsal medial prefrontal cortex for social reactive aggression: An interactive fMRI study. Neuroimage 34, 470–478.
Miyake, A., Friedman, N. P., Emerson, M. J., Witzki, A. H., Howerter, A., and Wager, T. D. (2000). The unity and diversity of executive functions and their contributions to complex “Frontal Lobe” tasks: a latent variable analysis. Cogn. Psychol. 41, 49–100.
Morgan, A. B., and Lilienfeld, S. O. (2000). A meta-analytic review of the relation between antisocial behavior and neuropsychological measures of executive function. Clin. Psychol. Rev. 20, 113–136.
Munro, G. E., Dywan, J., Harris, G. T., McKee, S., Unsal, A., and Segalowitz, S. J. (2007a). ERN varies with degree of psychopathy in an emotion discrimination task. Biol. Psychol. 76, 31–42.
Munro, G. E. S., Dywan, J., Harris, G. T., McKee, S., Unsal, A., and Segalowitz, S. J. (2007b). Response inhibition in psychopathy: the frontal N2 and P3. Neurosci. Lett. 418, 149–153.
Nelson, H. E. (1976). A modified card sorting test sensitive to frontal lobe defects. Cortex 12, 313–324.
Ochsner, K. N., Bunge, S. A., Gross, J. J., and Gabrieli, J. D. (2002). Rethinking feelings: an FMRI study of the cognitive regulation of emotion. J. Cogn. Neurosci. 14, 1215–1229.
Ochsner, K. N., and Gross, J. J. (2005). The cognitive control of emotion. Trends Cogn. Sci. (Regul. Ed.) 9, 242–249.
Pihl, R. O., Assaad, J. M., and Hoaken, P. N. S. (2003). The alcohol-aggression relationship and differential sensitivity to alcohol. Aggress. Behav. 29, 302–315.
Pliszka, S. R., Liotti, M., and Woldorff, M. G. (2000). Inhibitory control in children with attention-deficit/hyperactivity disorder: event-related potentials identify the processing component and timing of an impaired right-frontal response-inhibition mechanism. Biol. Psychiatry 48, 238–246.
Raine, A., Lencz, T., Bihrle, S., LaCasse, L., and Colletti, P. (2000). Reduced prefrontal gray matter volume and reduced autonomic activity in antisocial personality disorder. Arch. Gen. Psychiatry 57, 119–127; discussion 128–119.
Ramautar, J. R., Kok, A., and Ridderinkhof, K. R. (2004). Effects of stop-signal probability in the stop-signal paradigm: the N2/P3 complex further validated. Brain Cogn. 56, 234–252.
Ramautar, J. R., Kok, A., and Ridderinkhof, K. R. (2006). Effects of stop-signal modality on the N2/P3 complex elicited in the stop-signal paradigm. Biol. Psychol. 72, 96–109.
Reitan, R. M. (1958). Validity of trail making test as an indicator of organic brain damage. Percept. Mot. Skills 8, 271–276.
Rodriguez-Fornells, A., Kurzbuch, A. R., and Münte, T. F. (2002). Time course of error detection and correction in humans: neurophysiological evidence. J. Neurosci. 22, 9990–9996.
Schmajuk, M., Liotti, M., Busse, L., and Woldorff, M. G. (2006). Electrophysiological activity underlying inhibitory control processes in normal adults. Neuropsychologia 44, 384–395.
Sellbom, M., and Verona, E. (2007). Neuropsychological correlates of psychopathic traits in a non-incarcerated sample. J. Res. Pers. 41, 276–294.
Stroop, J. R. (1935). Studies of interference in serial verbal reactions. J. Exp. Psychol. 18, 643–662.
Taylor, S. P. (1967). Aggressive behavior and physiological arousal as a function of provocation and the tendency to inhibit aggression. J. Pers. 35, 297–310.
Tremblay, P. F., and Ewart, L. A. (2005). The Buss and Perry Aggression Questionnaire and its relations to values, the Big Five, provoking hypothetical situations, alcohol consumption patterns, and alcohol expectancies. Pers. Individ. Dif. 38, 337–346.
Vigil-Colet, A., Lorenzo-Seva, U., Codorniu-Raga, M. J., and Morales, F. (2005). Factor structure of the Buss-Perry aggression questionnaire in different samples and languages. Aggress. Behav. 31, 601–608.
von Borries, A. K., Brazil, I. A., Bulten, B. H., Buitelaar, J. K., Verkes, R. J., and de Bruijn, E. R. (2010). Neural correlates of error-related learning deficits in individuals with psychopathy. Psychol. Med. 40, 1559–1568.
Wechsler, D. (1997). Wechsler Adult Intelligence Scale, 3rd Edn. San Antonio, TX: Harcourt Assessment.
Welsh, M. C., Satterlee-Cartmell, T., and Stine, M. (1999). Towers of Hanoi and London: contribution of working memory and inhibition to performance. Brain Cogn. 41, 231–242.
Zimmermann, P., and Fimm, B. (1994). Testbatterie zur Aufmerksamkeitsprüfung (TAP). Herzogenrath: Psytest.
Keywords: reactive aggression, executive functions, Eriksen Flanker task, stop-signal task, Taylor aggression paradigm, Tower of London
Citation: Krämer UM, Kopyciok RPJ, Richter S, Rodriguez-Fornells A and Münte TF (2011) The role of executive functions in the control of aggressive behavior. Front. Psychology 2:152. doi: 10.3389/fpsyg.2011.00152
Received: 13 May 2011;
Accepted: 20 June 2011;
Published online: 01 July 2011.
Edited by:
Gilles Pourtois, University of Ghent, BelgiumReviewed by:
Sven Mueller, University of Ghent, BelgiumRalph Erich Schmidt, University of Geneva, Switzerland
Inti Brazil, Donders Institute for Brain Cognition and Behaviour, Netherlands
Copyright: © 2011 Krämer, Kopyciok, Richter, Rodriguez-Fornells and Münte. This is an open-access article subject to a non-exclusive license between the authors and Frontiers Media SA, which permits use, distribution and reproduction in other forums, provided the original authors and source are credited and other Frontiers conditions are complied with.
*Correspondence: Ulrike M. Krämer, Department of Neurology, University of Lübeck, 23538 Lübeck, Germany. e-mail: umkraemer@gmail.com