 Marianne Latinus1* Pascal Belin1,2
- 1 Voice Neurocognition Laboratory, Social Interactions Research Centre, Institute of Neuroscience and Psychology, University of Glasgow, Glasgow, UK
- 2 International Laboratories for Brain, Music and Sound, McGill University and Université de Montréal, Montreal, QC, Canada
We used perceptual aftereffects induced by adaptation with anti-voice stimuli to investigate voice identity representations. Participants learned a set of voices then were tested on a voice identification task with vowel stimuli morphed between identities, after different conditions of adaptation. In Experiment 1, participants chose the identity opposite to the adapting anti-voice significantly more often than the other two identities (e.g., after being adapted to anti-A, they identified the average voice as A). In Experiment 2, participants showed a bias for identities opposite to the adaptor specifically for anti-voice, but not for non-anti-voice adaptors. These results are strikingly similar to adaptation aftereffects observed for facial identity. They are compatible with a representation of individual voice identities in a multidimensional perceptual voice space referenced on a voice prototype.
Introduction
Human listeners can recognize individuals by their vocalizations (Papcun et al., 1989; Kreiman, 1997), an ability already present at birth to a significant degree (Decasper and Fifer, 1980; Kisilevsky et al., 2003) and with a long evolutionary history (Insley, 2000; Belin, 2006). Despite the importance of voice recognition in social interactions and for automated voice processing, its cognitive and neural bases remain poorly understood. Although a speaker never utters the same sound twice, listeners are able to extract invariants in the auditory input that relate to this particular identity, despite many concurrent sources of variation in speech content, style, signal transmission conditions, etc. The combination of acoustical cues carrying speaker identity information is complex and largely unknown; for instance, even acoustical cues thought to be primarily phonetic, such as formant frequencies, can be used to identity speakers (Remez et al., 1997). The ability to effortlessly recognize speakers in spite of this acoustical complexity indicates the existence of perceptual representations of voice identity. These representations are likely to recruit cerebral mechanisms partially dissociated from those involved in speech perception, as illustrated by the case of phonagnosic patients who show normal speech comprehension despite impaired speaker recognition (Assal et al., 1976; Van Lancker et al., 1988; Garrido et al., 2009). However, the exact nature of the perceptual representations of voice identity remains speculative.
In the present study we focus on speaker recognition from brief vowels as a simplified model of speaker recognition. This approach is justified because: (i) normal listeners are relatively accurate at recognizing identities from brief vowels (Latinus et al., 2011); (ii) the steady-state nature of vowels offers a good analogy with the static images of faces used in face processing research as a simplified model of facial recognition. This simplified model may not generalize to more naturalistic situations when several other cues such as speaking style, dialect, idiosyncratic expressions, etc., contribute to recognition but, as for face perception, this approach potentially can lead to important insights.
In this simplified framework, we have previously shown that speaker identity perception in simple vowels can be adequately summarized (78 and 81% of the variance explained for male and female speakers, respectively) by representing voices as points in a two-dimensional “perceptual voice space” (Baumann and Belin, 2010). This voice identity space is largely independent of which vowel is uttered. The two axes of this space reflect contributions of the source, and filter aspects of phonation, respectively. In that space, voices located close to one another are perceived with similar identities, whereas voices located far apart are perceived with different identities (Baumann and Belin, 2010).
This is analogous to the dominant framework of facial identity representation in which faces are represented in a multidimensional space and coded either as vectors referenced to the central, prototypical face [prototype-based model or axis model (Tsao and Freiwald, 2006)] or as prototype-independent exemplars (Valentine, 1991). Importantly, one characteristic distinguishes between the two models: the role of the average face (Valentine, 1991; Tsao and Freiwald, 2006). In the axis, or prototype-based model, all faces are encoded in terms of their deviation from the prototypical, average face (thought to be the center of mass of the multidimensional face space); on the contrary, the exemplar model does not predict the existence of a face prototype. In previous studies, the prototype has been approximated by an average face, assumed to be the center of the space, generated by averaging a variable number of faces (20 in Rhodes and Jeffery, 2006 or 200 in Blanz et al., 2000; Leopold et al., 2001). While some studies average both male and female faces, resulting in a gender-ambiguous average face (Leopold et al., 2001), others prefer to create a gender-specific average face (Rhodes and Jeffery, 2006). Here we chose to use only male voices, and a male average.
Experiments using perceptual aftereffects (changes in stimulus perceptual quality after exposure to a repeated adaptor) have recently allowed important new insights into the representation of facial identity and affective information in the face space (Webster and Maclin, 1999; Leopold et al., 2001; Skinner and Benton, 2010). Aftereffects observed after adaptation with anti-faces [caricatures of the average face relative to an individual face (Blanz et al., 2000)] provided evidence for prototype-based coding of facial identity (Leopold et al., 2001; Anderson and Wilson, 2005) and, more recently, facial expressions (Skinner and Benton, 2010). Anti-face stimuli were perceived as different identities than their corresponding face (Blanz et al., 2000); yet they induced greater aftereffects than other adaptors. These results are interpreted in terms of contrastive mechanisms relative to a face prototype (Leopold et al., 2001). The notion of prototype-based coding of face identity has since received support from experiments measuring cerebral response to facial stimuli in macaques (Leopold et al., 2006) and humans (Loffler et al., 2005).
Auditory perceptual aftereffects have been extensively studied in speech perception (Eimas and Corbit, 1973; Holt, 2006). Although their study in the non-verbal auditory domain is limited (Mullennix et al., 1995; Schweinberger et al., 2008; Zaske et al., 2010), aftereffects in voice identity perception have recently been demonstrated (Zaske et al., 2010). Here we used voice identity aftereffects as a tool to test whether voice identity is coded relative to a prototype. We generated, via morphing, an acoustical average of 16 different male voices uttering a single vowel as an approximation of a voice prototype (see Materials and Methods). In two experiments, participants learned three different voice identities then performed a three-alternative forced choice identification task on voice stimuli (probes) generated by morphing between different voice identities and the average voice. Probe stimuli were presented either in isolation (baseline) or following adaptation induced by brief repetition of an adaptor stimulus.
Experiment 1
In Experiment 1, probe stimuli were drawn from voice identity continua generated by morphing between each of the three learned voices and the average voice (Figure 1A). Adaptor stimuli consisted of anti-voice stimuli also generated by morphing one of the three learned voices with the average voice, but lying opposite to the average voice on that identity trajectory (i.e., caricatures of the average voice relative to one of the learned voices; Figure 1A). Participants learned the three voice identities over several sessions until they reached a criterion (see Materials and Methods) then performed a three-alternative forced choice (3AFC) identification task at baseline and after adaptation. We reasoned that if voice identities are represented relative to a central voice prototype then identity aftereffects should be stronger for matched trials (in which the adaptor is an “anti-probe,” Figure 1B) than to “non-matched trials” (in which the adaptor and probe do not lie on the same identity trajectory, Figure 1B).
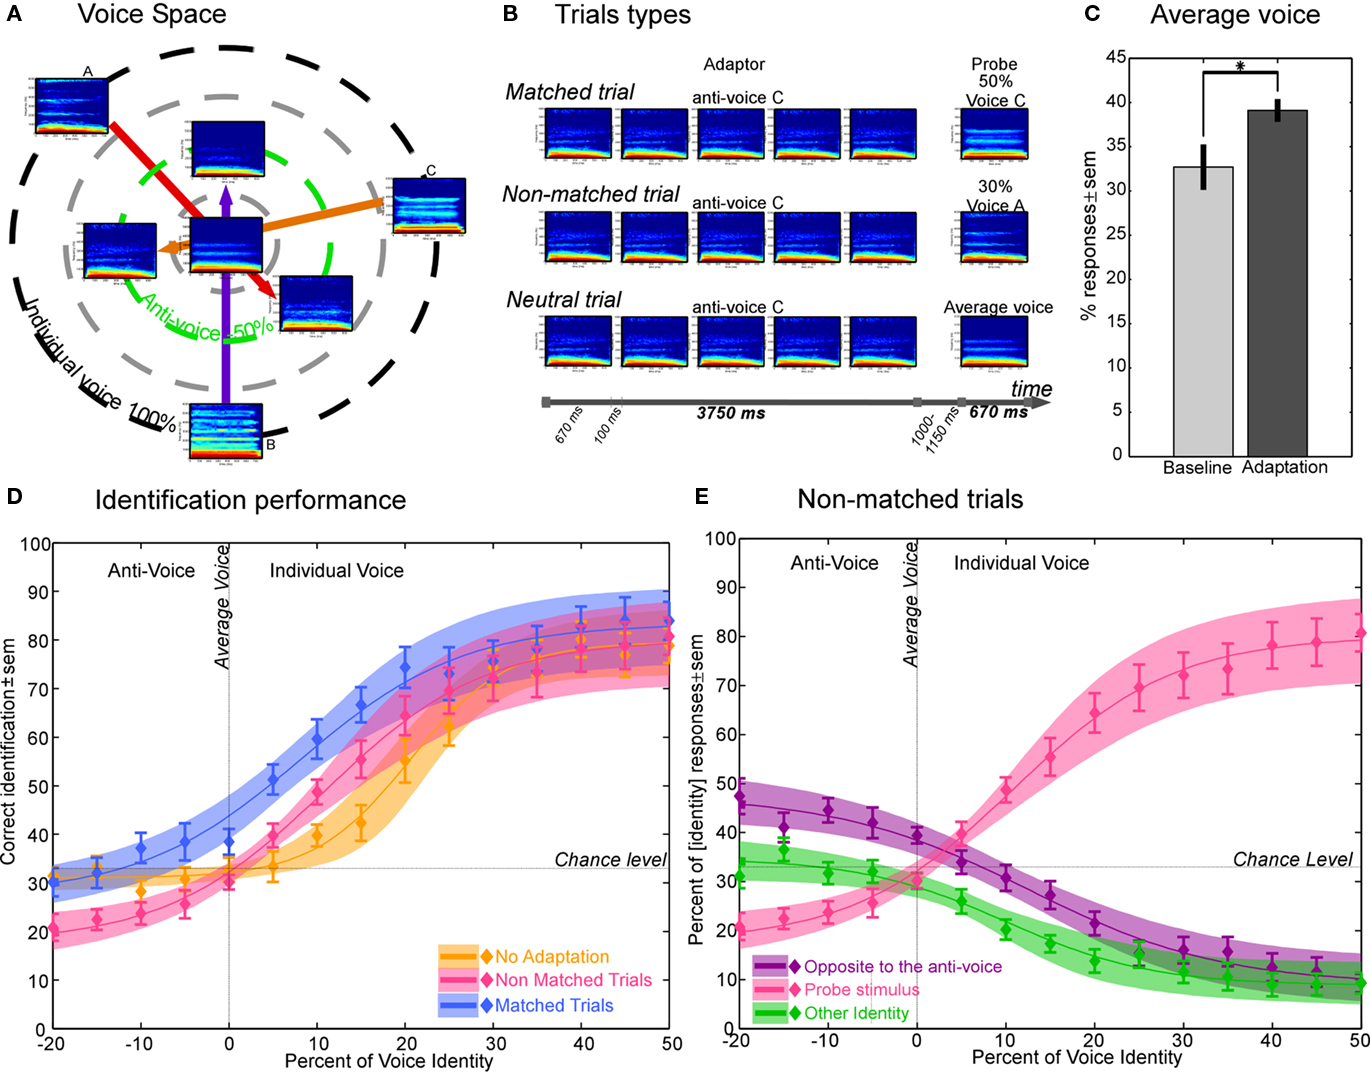
Figure 1. Experiment 1 – Design and results. (A) Location of the average voice (center), three individual voices (black circle) and their associated anti-voices (green circle) in a theoretical voice space. Voices are represented by their spectrogram: X-axis: time (0–670 ms), Y-axis: frequency (0–6000 Hz). (B) Examples of trials used in the experiment. Matched trial: the adaptor is the anti-voice opposite to the probe relative to the average voice. (C) Identification of the average voice. The average voice has no particular identity at baseline (chance level identification). After adaptation, it is identified more often as the identity opposite to the anti-voice adaptor. *p = 0.02. (D) Identification performance. Shaded areas represent the 95% confidence interval of the fit with a logistic function. Note greater aftereffects for matched (blue) than non-matched (pink) trials compared to the baseline (orange). (E) Response distribution in the non-matched trials. In the Y-axis definition (identity) refers to the legend: it can be identity-axis of the anti-voice (purple), the identity-axis of the probe stimulus (pink), or the other identity (green). For example, in a trial with adaptation to anti-voice A with probe stimuli drawn from the average voice B continuum: identity opposite to the anti-voice (purple) means the subjects answered voice A; identity of the continuum (pink) means the subjects answered voice B; other identity (green) means the subjects answered voice C.
Materials and Methods
Participants
Fifteen normal adult listeners (six males, 23 years ±3.7) with no self-reported hearing problems were recruited from the undergraduate population of Glasgow University. They all gave informed written consent, and were paid at a standard rate of £6 per hour. The studies were approved by the local ethics committee.
Stimulus material
Original voice samples were drawn from recordings of male French–Canadian speakers producing the sustained French vowels (“a,” “é,” “è,” “o,” “u,” and “ou”). There is growing evidence for an interaction between language and speaker recognition (Perrachione and Wong, 2007). Using stimuli not drawn from the participants’ native language could have interfered to some extent with identity processing, despite the limited linguistic content of our stimuli (vowels), probably contributing to a greater variability in subjects performance. Voice identity continua were generated by morphing a same vowel spoken by different identities using STRAIGHT (Speech Transformation and Representation by Adaptive Interpolation of weiGHTed spectrogram; Kawahara et al., 1999) in Matlab 7.5. (The MathWorks, Inc., Natick, MA, USA). STRAIGHT performs an instantaneous pitch-adaptive spectral smoothing in each stimulus to separate the contributions of the glottal source (including F0) vs. supra-laryngeal filtering [distribution of spectral peaks, including the first formant, F1 (Ghazanfar and Rendall, 2008)] to the voice signal. Voice stimuli are decomposed by STRAIGHT into five parameters: fundamental frequency (F0), formant frequencies, duration, spectro-temporal density, and aperiodicity; each parameter can be independently manipulated. In each stimulus, we manually identified time-frequency landmarks at the start and end of each vowel sound to be put in correspondence across voices. Morphed stimuli were then generated by re-synthesis based on the interpolation (linear for time and aperiodicities; logarithmic for F0, formant frequency, and spectro-temporal density) of these time-frequency landmark templates. Each stimulus of a continuum between voices A and B was generated using different values of a weight parameter x: a morphed stimulus contains x percent of information of voice A and 100-x percent of information of voice B. Values of x between 0 and 100% correspond to morphed stimuli intermediate between A and B, whereas negative values of x correspond to caricatures of A relative to B, and values of x greater than 100% correspond to caricatures of B relative to A.
The stimulus referred to as the “average voice” corresponds to an average of 16 male voices. The average voice was constructed using the same morphing principle as described above. Several time-frequency landmarks were place in correspondence across the 16 different male voices and a linear combination was performed on the parameters extracted by STRAIGHT with an equal weight of 1/16 for each voice identity.
The three identities to be learned were selected among the 16 voices used to generate the average voice. Each of the three individual voices was morphed with the average voice (Figure 1A) to create three different identity continua ranging from −50% (anti-voices) to 100% (the original voice) in 5% steps, using the French vowel “ou” ([u]; acoustical analyses presented in Table 1). A pilot experiment demonstrated that listeners could reach a high level of identification even for stimuli retaining only 40% of the original voice. Therefore, we used probe stimuli that ranged between a slight anti-voice (x = −20%) to the 50% morphed stimuli [i.e., the average between the individual voice and the average voice, i.e., anti-caricature (Blanz et al., 2000)].
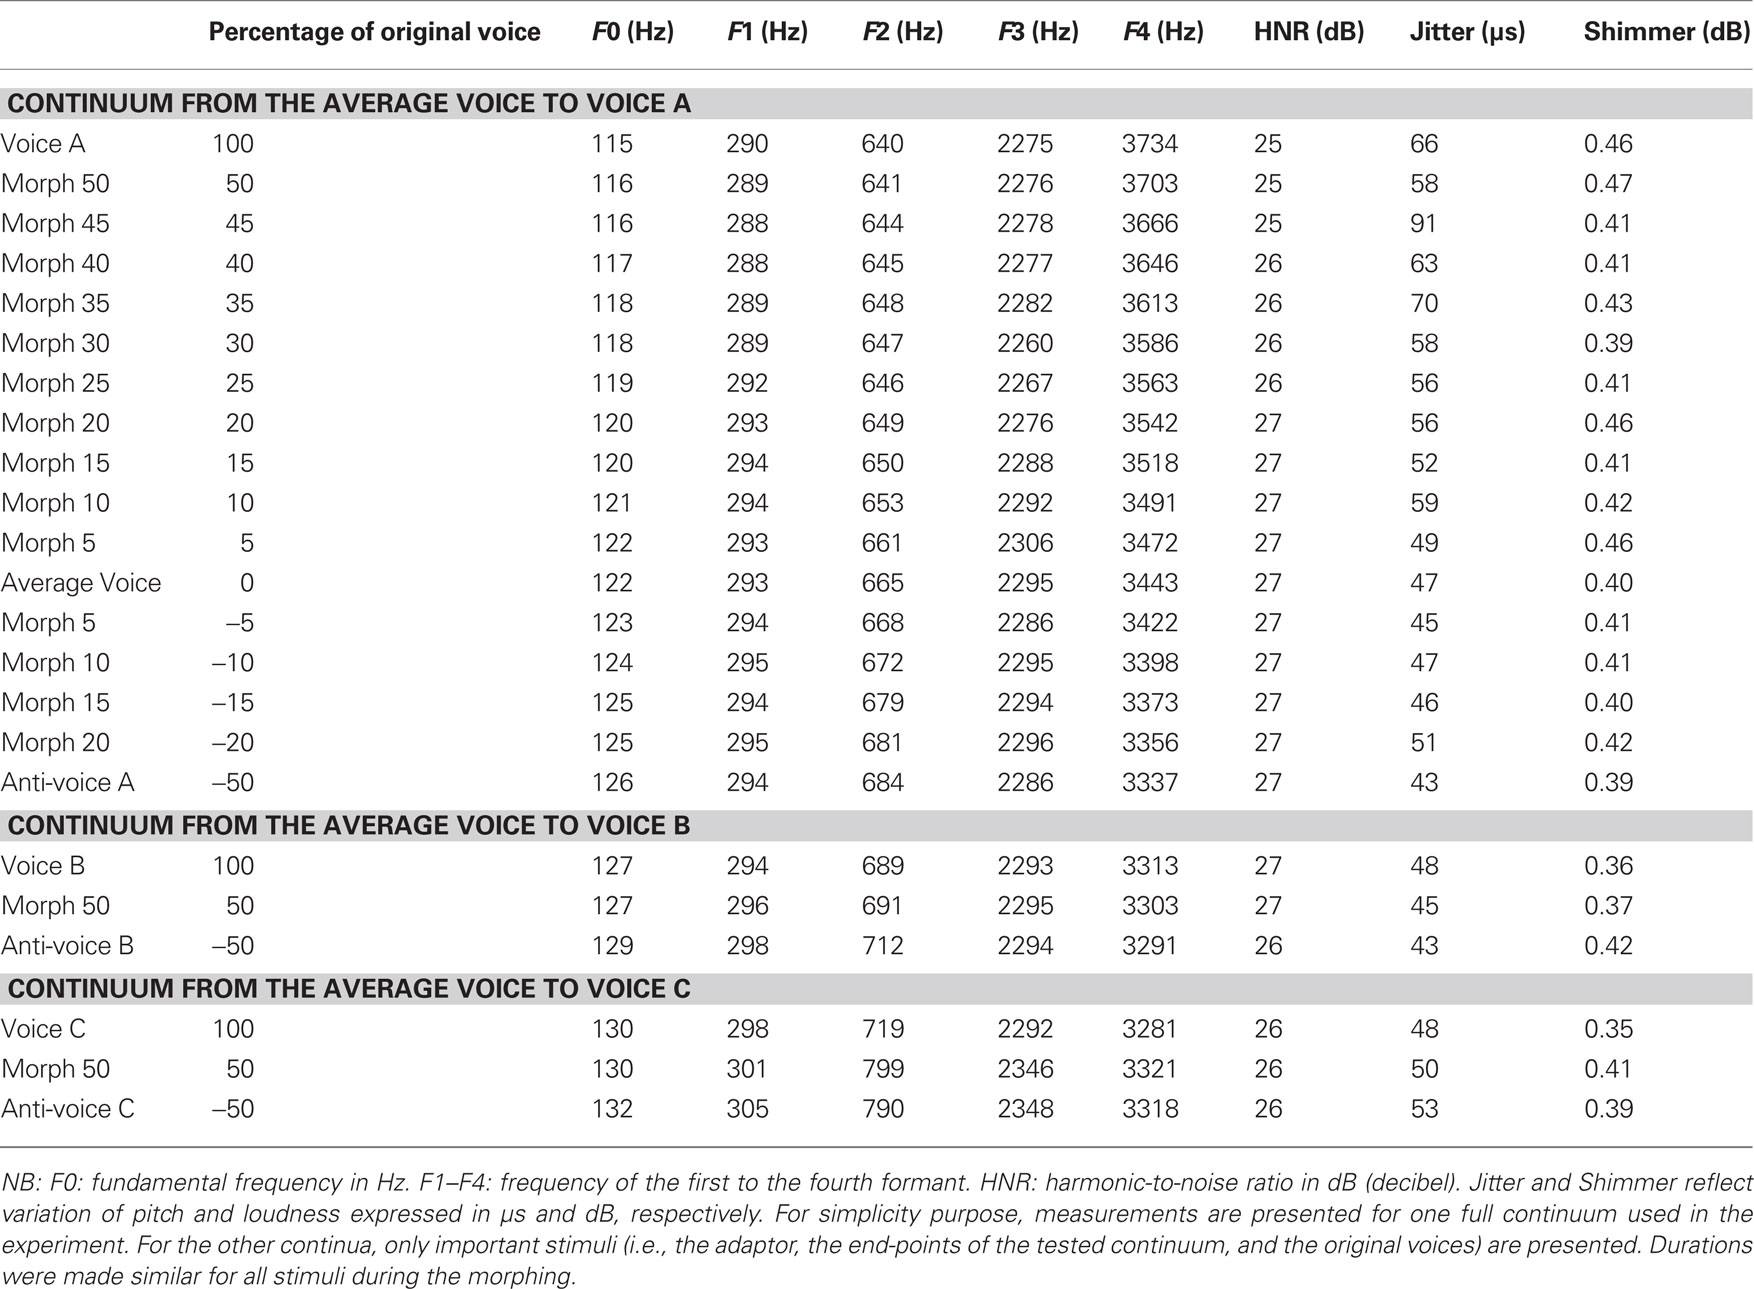
Table 1. Acoustic parameters of the stimuli used in Experiment 1.
Examples of the stimuli used in the experiments can be found at http://vnl.psy.gla.ac.uk/antivoices/
Voice learning
Prior to testing, participants underwent a learning phase over several 20 to 30 min daily sessions during which they learned to associate three different voices with corresponding names; the three names used were Phil, Ian, and Dave. In the first part of the training, participants listened carefully to two stories (one in French, the other in English) for each voice and learned to associate each voice with a name. Note that our subjects did not necessarily understand French; however, as the vowels were French vowels and the task was to pay attention to identity and not speech, we believe that using a French story helped our subjects learn the voices. In the second part of the training, participants performed a 3AFC identification task on different items (words, vowels in both languages) from the same voices. Feedback was provided on their answer via a word displayed on the screen; in the case of an incorrect answer, the sound, and the correct answer were presented again to the subjects. In the third part, the test phase, voice recognition was measured without feedback using simple vowels. Each daily session was composed of these three parts, and were repeated each day until subjects’ performance at the test phase was above a predefined criterion of 66% [66% represents the discrimination threshold in a 3AFC task (Kingdom and Prins, 2010)]. On average training lasted 6.4 days (range 5–10 sessions) and performance at the final session in the test phase was 84.29% (chance level of 33%). Most participants required several learning sessions to reach the criterion, largely because recognition was tested on several different vowels that were different from the training material.
Procedures
During the experiments, participants sat in a sound-attenuated room facing a computer screen displaying three response boxes containing a name associated with one of learned voice identities. Stimuli were presented binaurally at a level of 80 dB SPL via headphones (Beyerdynamic DT 770). Responses were given by clicking one of the three boxes with the computer mouse: three-alternative forced choice identification task. Stimulus presentation and data collection were done using Media Control Functions (MCF) software (Digivox; Montreal, QC, Canada).
To establish a baseline listeners first performed a 3AFC identification task on the probe stimuli, i.e., the stimuli drawn from the three identity continua, in the absence of any adaptation [180 trials; inter-stimulus interval (ISI): 1 s]. They then performed the same task on the same stimuli with, within trial adaptation. Adaptation was induced by five repetitions of an anti-voice (duration ∼3.75 s; ISI: 100 ms); probe stimuli were presented after a silent gap (1000–1150 ms); a sequence of five stimuli plus the probe defined a trial. The three adaptors (i.e., the three different anti-voices) were run in three separate blocks of 90 trials, repeated twice; probe stimuli drawn from the three identity continua were mixed within an adaptor block. For any given probe the adaptor could be the anti-voice matching the probe (a third of the trials – matched trials), or a non-matching anti-voice (two thirds of the trials – non-matched trials); some trials were considered “neutral” as the probe stimuli was the average voice, i.e., a neutral stimuli in term of identity (Figure 1B). A given participant was thus presented with the following sequence of blocks: baseline (no adaptation), adaptation to anti-voice A, adaptation to anti-voice B, adaptation to anti-voice C, adaptation to anti-voice B, adaptation to anti-voice A, adaptation to anti-voice C; the task, i.e., a 3AFC identification task, was the same in all blocks. The order of the adaptation blocks was counterbalanced across participants. Two participants were removed from the statistical analysis because a logistic function improperly fitted the data (R2 < 0.4).
Statistical analyses
Data were analyzed using Matlab 7.5. Individual identification performance (expressed as the percent of voice A response when testing the average-A continuum) was fitted with a logistic function with four free parameters: the minimum and maximum y-values, the x-value at the center of symmetry of the curve (i.e., point of subjective equality – PSE), and the slope of the curve at the PSE. We used bootstrap with replacement [10,000 re-samplings (Wilcox, 2005)] to assess the statistical significance of the effects and to compute data-driven 95% confidence intervals. Due to our paired design, when a subject was selected randomly, results from all his conditions were included in that sample. For each condition, we averaged the data across participants and fitted this average with the logistic function, then saved the regression parameters. We also computed differences between conditions at this stage. For each condition we repeated the process 9,999 times, leading to a distribution of 10,000 bootstrapped estimates of the fits, and a distribution of fit differences between conditions. Finally, we computed the 95% confidence intervals of the fit parameters and of the fit differences providing a measure of the aftereffects’ significance at each morph step.
Results and Discussion
At baseline, the average voice (0% morphing value) as well as anti-voice stimuli (negative morphing values) yielded identification performance close to chance level [y-value of psychometric function at x = 0 (mean ± SEM) = 33.3 ± 3.0% – Figure 1C]. This indicates that anti-voice stimuli are perceived with a different identity than their corresponding voice, in accordance with previous results with anti-faces (Blanz et al., 2000; Leopold et al., 2001). For the 50% morph between an individual voice and the average, identification performance reached approximately 80% correct. Note that probe stimuli containing even a small proportion (20%) of one of the original voices yielded identification performance above 50% (Figure 1D, orange curve).
Adaptation to the anti-voice adaptors induced marked shifts in the psychometric function [PSE abscissa (mean ± SEM): matched trials: x = 8.2 ± 3.3%; non-matched trials: x = 12.9 ± 2.4%] compared to the baseline condition (x = 20.1 ± 2.2%). After adaptation for match trials, stimuli were perceived more often as with the identity opposite to the adapting anti-voice (Figures 1C,D). The average voice, which at baseline was perceived with no particular identity, was after adaptation perceived more often as the voice opposite to the adapting anti-voice [baseline: 32.7 ± 2.6%; after adaptation: 39.1 ± 1.3%; paired T test: t(12) = −2.52, p = 0.02; Figure 1C].
Crucially, aftereffects were larger for matched than for non-matched trials, a difference significant (p < 0.05) at all morphs steps (Figure 2A). That is, the shift in perceived identity was larger when induced by the anti-voice adaptor opposite to the probe stimulus relative to the average voice (blue curve in Figure 1D) compared to when induced by the other adaptors (pink curve in Figure 1D).
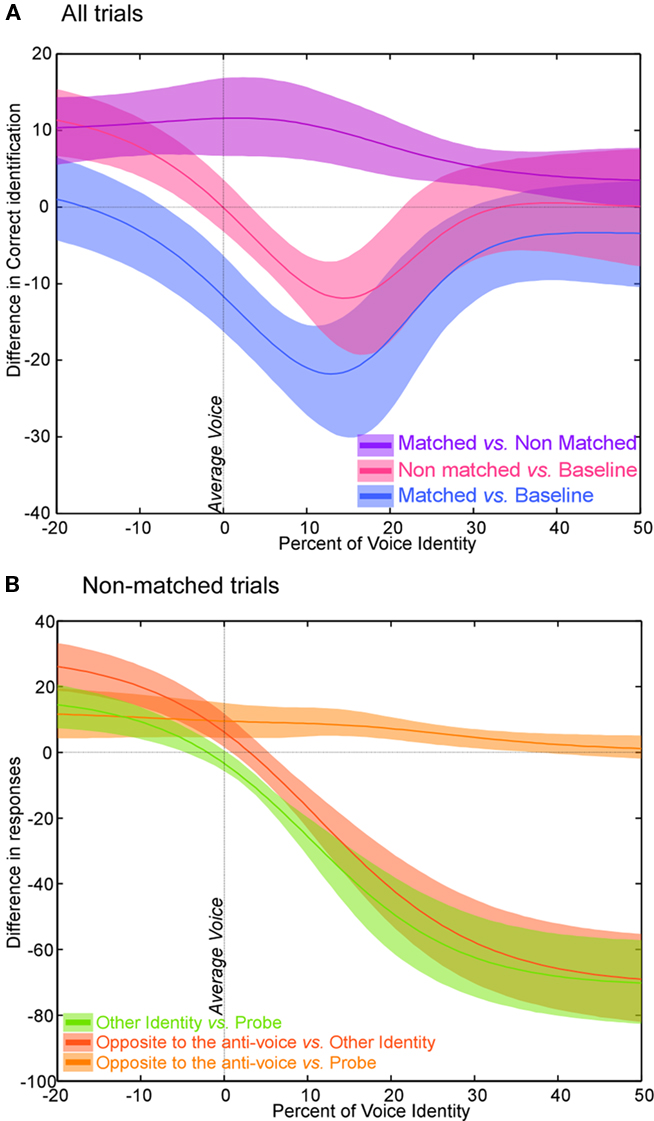
Figure 2. Experiment 1 – Statistical analysis (A) Statistical analysis. CI95% (shade) and plot of the difference in percent correct recognition (line) for matched trials vs. baseline (blue), non-matched trials vs. baseline (pink), and matched trials vs. non-matched trials (purple). Note that both matched and non-matched adaptors induce a perceptual change compared to baseline, yet a stronger effect is seen for matched anti-voices. (B) Statistical analysis for non-matched trials only. CI95% (shade) and plot of the difference (line) between responses according to the identity of the adapting stimulus (anti-voice) vs. identity of the probe (orange), identity of the adapting stimulus vs. other identity (red), and identity of the probe vs. other identity (green).
Separate analysis of non-matched trials (Figure 1E) showed that after adaptation, participants no longer categorized the anti-voice probe stimuli (negative morphing values) at chance but instead tended to categorize them significantly (p < 0.05) more often as the identity opposite to the adapting anti-voice (purple curve in left panel of Figures 1E and 2B). Such an aftereffect is quite striking as in these cases neither the adaptor nor the probe stimuli corresponded to one of the learned identities. Interestingly, as soon as on the other side of the mean (positive morphing value), subjects tended to categorize the probe stimuli based on their physical structure, i.e., answering according to which continua the probe was drawn from, and more so than in the baseline condition (Figures 1C,D and 2A). Aftereffects for non-matched trials, even though smaller than for matched trials, were unexpected. These smaller aftereffects could reflect substantial learning effects as seen between two consecutive baseline tests separated by adaptation trials (see below, Rhodes and Jeffery, 2006; Schweinberger et al., 2008).
These results suggest a particular role of the prototypical voice in the coding of voice identity, similar to aftereffects observed with anti-face adaptors which have been interpreted as evidence of prototype-based coding (Leopold et al., 2001). It has since been argued, however, that the greater aftereffects for matched trials observed by Leopold et al. (2001) could have a simpler explanation (Rhodes and Jeffery, 2006). A weaker adaptation effect for non-matched trials could be consistent with repulsion away from any adaptor in the perceptual voice space: as the probe stimulus does not lie on a trajectory defined by the non-matched adaptor and one of the learned identities, adaptation would not be expected to produce as much repulsion along these lines (Rhodes and Jeffery, 2006). This alternative explanation also potentially applies to our results. We thus performed a second experiment in which we controlled for this difference and ensured that adaptors and probe stimuli would be on the same identity trajectories as the learned voices.
Experiment 2
In Experiment 2, a new set of three voices was selected (A, B, and C) and adaptors anti-A and anti-B were generated as in Experiment 1. We then selected an additional natural voice (D) such that the perceptual distance between voice D and voices A and B was similar to that between each original voice and its respective anti-voice (see Materials and Methods, Figure 3). Probe stimuli were generated by morphing between voices A and B and their respective anti-voices, as well as between voices A and B and voice D (Figure 4A). As in Experiment 1 participants learned the three voices A, B, and C, then were instructed to perform a 3AFC task on the identity of the probe stimuli, at baseline, and after adaptation. Adaptors consisted of voices anti-A, anti-B, or D. Thus, as in Rhodes and Jeffery (2006), we compared two different adaptors (anti-voices and voice D) located on the same identity trajectory and at similar perceptual distance to the probe stimuli. We predicted that even in these conditions we would observe a greater aftereffect of anti-voice adaptors, thus ruling out an interpretation of this result in terms of general repulsion away from the adaptor.
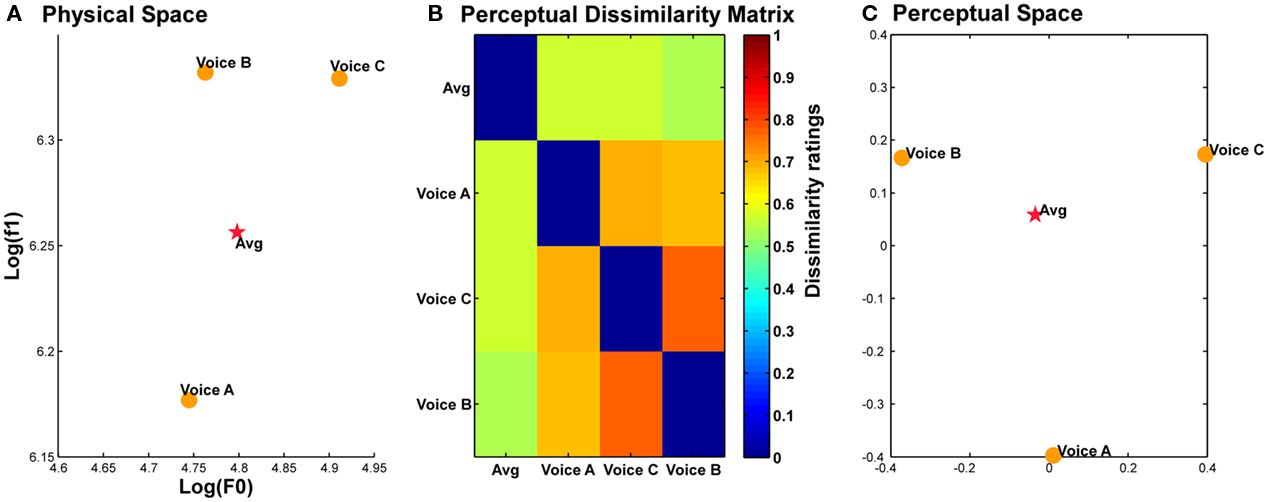
Figure 3. Position of the average voice in physical and perceptual spaces. (A). Position of the three original voice stimuli (A, B, and C) and the average voice (Avg, red star) in a logF0–logF1 space approximating voice identity perceptual space (Baumann and Belin, 2010). (B) Dissimilarity matrix of perceived identity differences in pairs of the four voice stimuli. (C) Positions of the four voices in perceptual space based on the matrix in (B). Note the central position of the average voice in both physical and perceptual voice spaces.
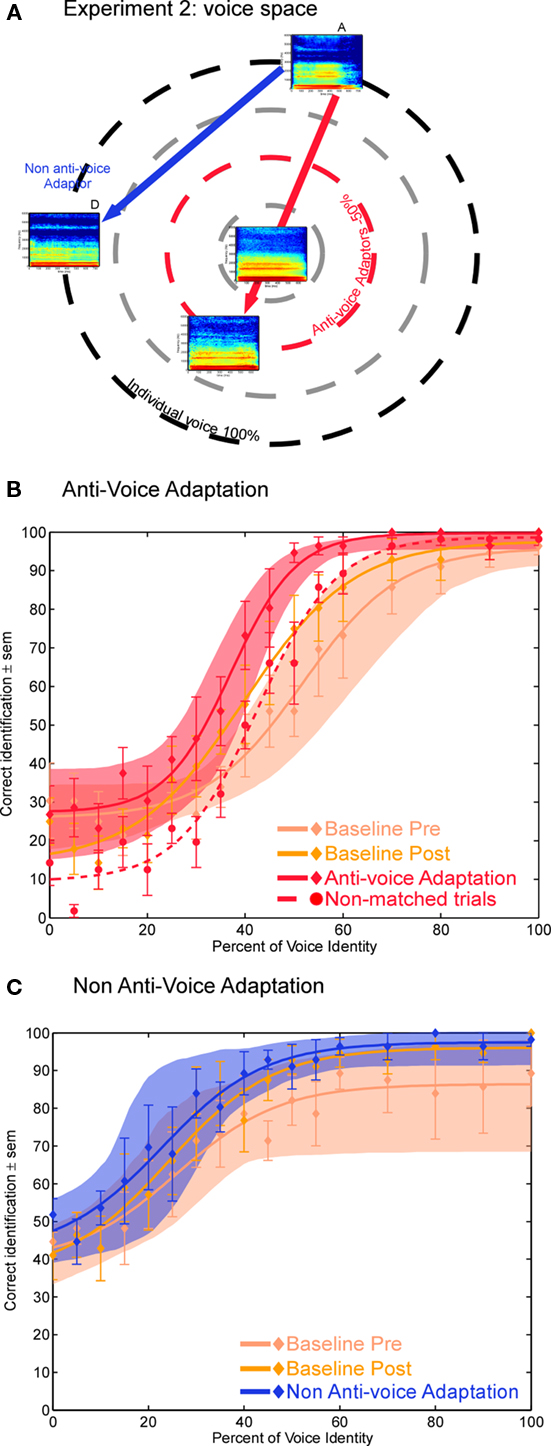
Figure 4. Experiment 2 (A) Position of an individual voice (voice A), its matched anti-voice adaptor (red circle) and a non-anti-voice adaptor (voice D) in theoretical voice space. (B,C) Identification performance after adaptation with (B) the anti-voice adaptors and (C) the voice D adaptor. Note the greater voice identity aftereffect for anti-voice adaptors.
Materials and Methods
Participants
Thirteen new adult participants (six males, 20.2 years ±1.2) with self-reported normal audition provided written informed consent.
Stimuli
Three voices (A, B, and C) were selected from the pool of 16 male voices used to generate the average voice (16 male voices – French vowel “è” [ε]); they were chosen so that the average voice was at the center of the acoustical space they defined. We verified that this acoustically average voice was also perceptually average by using multidimensional scaling of voice identity dissimilarity judgments. The three original voices of Experiment 2 plus the average voice were associated two-by-two to form 16 pairs of stimuli. Subjects (N = 10, five males, mean age = 25.2 ± 1.4) rated the dissimilarity in perceived identity between the stimuli within a pair using a visual analog scale with labels ranging from “very dissimilar” to “very similar.” MDS analysis confirmed the central position of average voice in the perceptual space represented by the two main dimensions provided by the MDS solution (Figure 3). Anti-voices were generated for voice A and voice B by morphing each of them with the average voice (−50%; red line in Figure 4A). We then selected an additional natural voice (voice D in Figure 4A) to act as an adaptor that would be comparable to the anti-voice adaptor in terms of perceptual distance to the learned voices. Voice D was selected such that its physical distance to voices A and B was comparable to the distances between voices A and B and the anti-voice (Euclidian distance in logF0–logF1 space; A-anti-A: 0.087; B-anti-B: 0.084; A–D: 0.100, B–D: 0.085). We then confirmed that perceptual distances were also similar by asking a group of 10 listeners (four males, mean age 29 ± 5 years) to rate perceived dissimilarity between pairs of voices on a visual analog scale ranging from 0 (very similar) to 1 (very dissimilar). Mean dissimilarity judgments were: A-anti-A = 0.72 ± 0.16; A–D = 0.71 ± 0.13; B-anti-B = 0.63 ± 0.16; B–D = 0.70 ± 0.13. There was no effect of identity, trajectory or interaction on the perceptual dissimilarity between the pairs [Identity: F(9,1) = 2.02; Trajectory: F(9,1) = 0.587; Interaction: F(9,1) = 1.11, all p > 0.1].
We then generated probe stimuli along the four continua: A-anti-A, A–D, B-anti-B, B–D (Figure 4A; only continua starting with A are shown for clarity). Those were generated by morphing each adaptor with their matching individual voice in 17 morph steps (5% steps up to 50%, then 10% steps). Acoustical analyses are presented in Table 2.
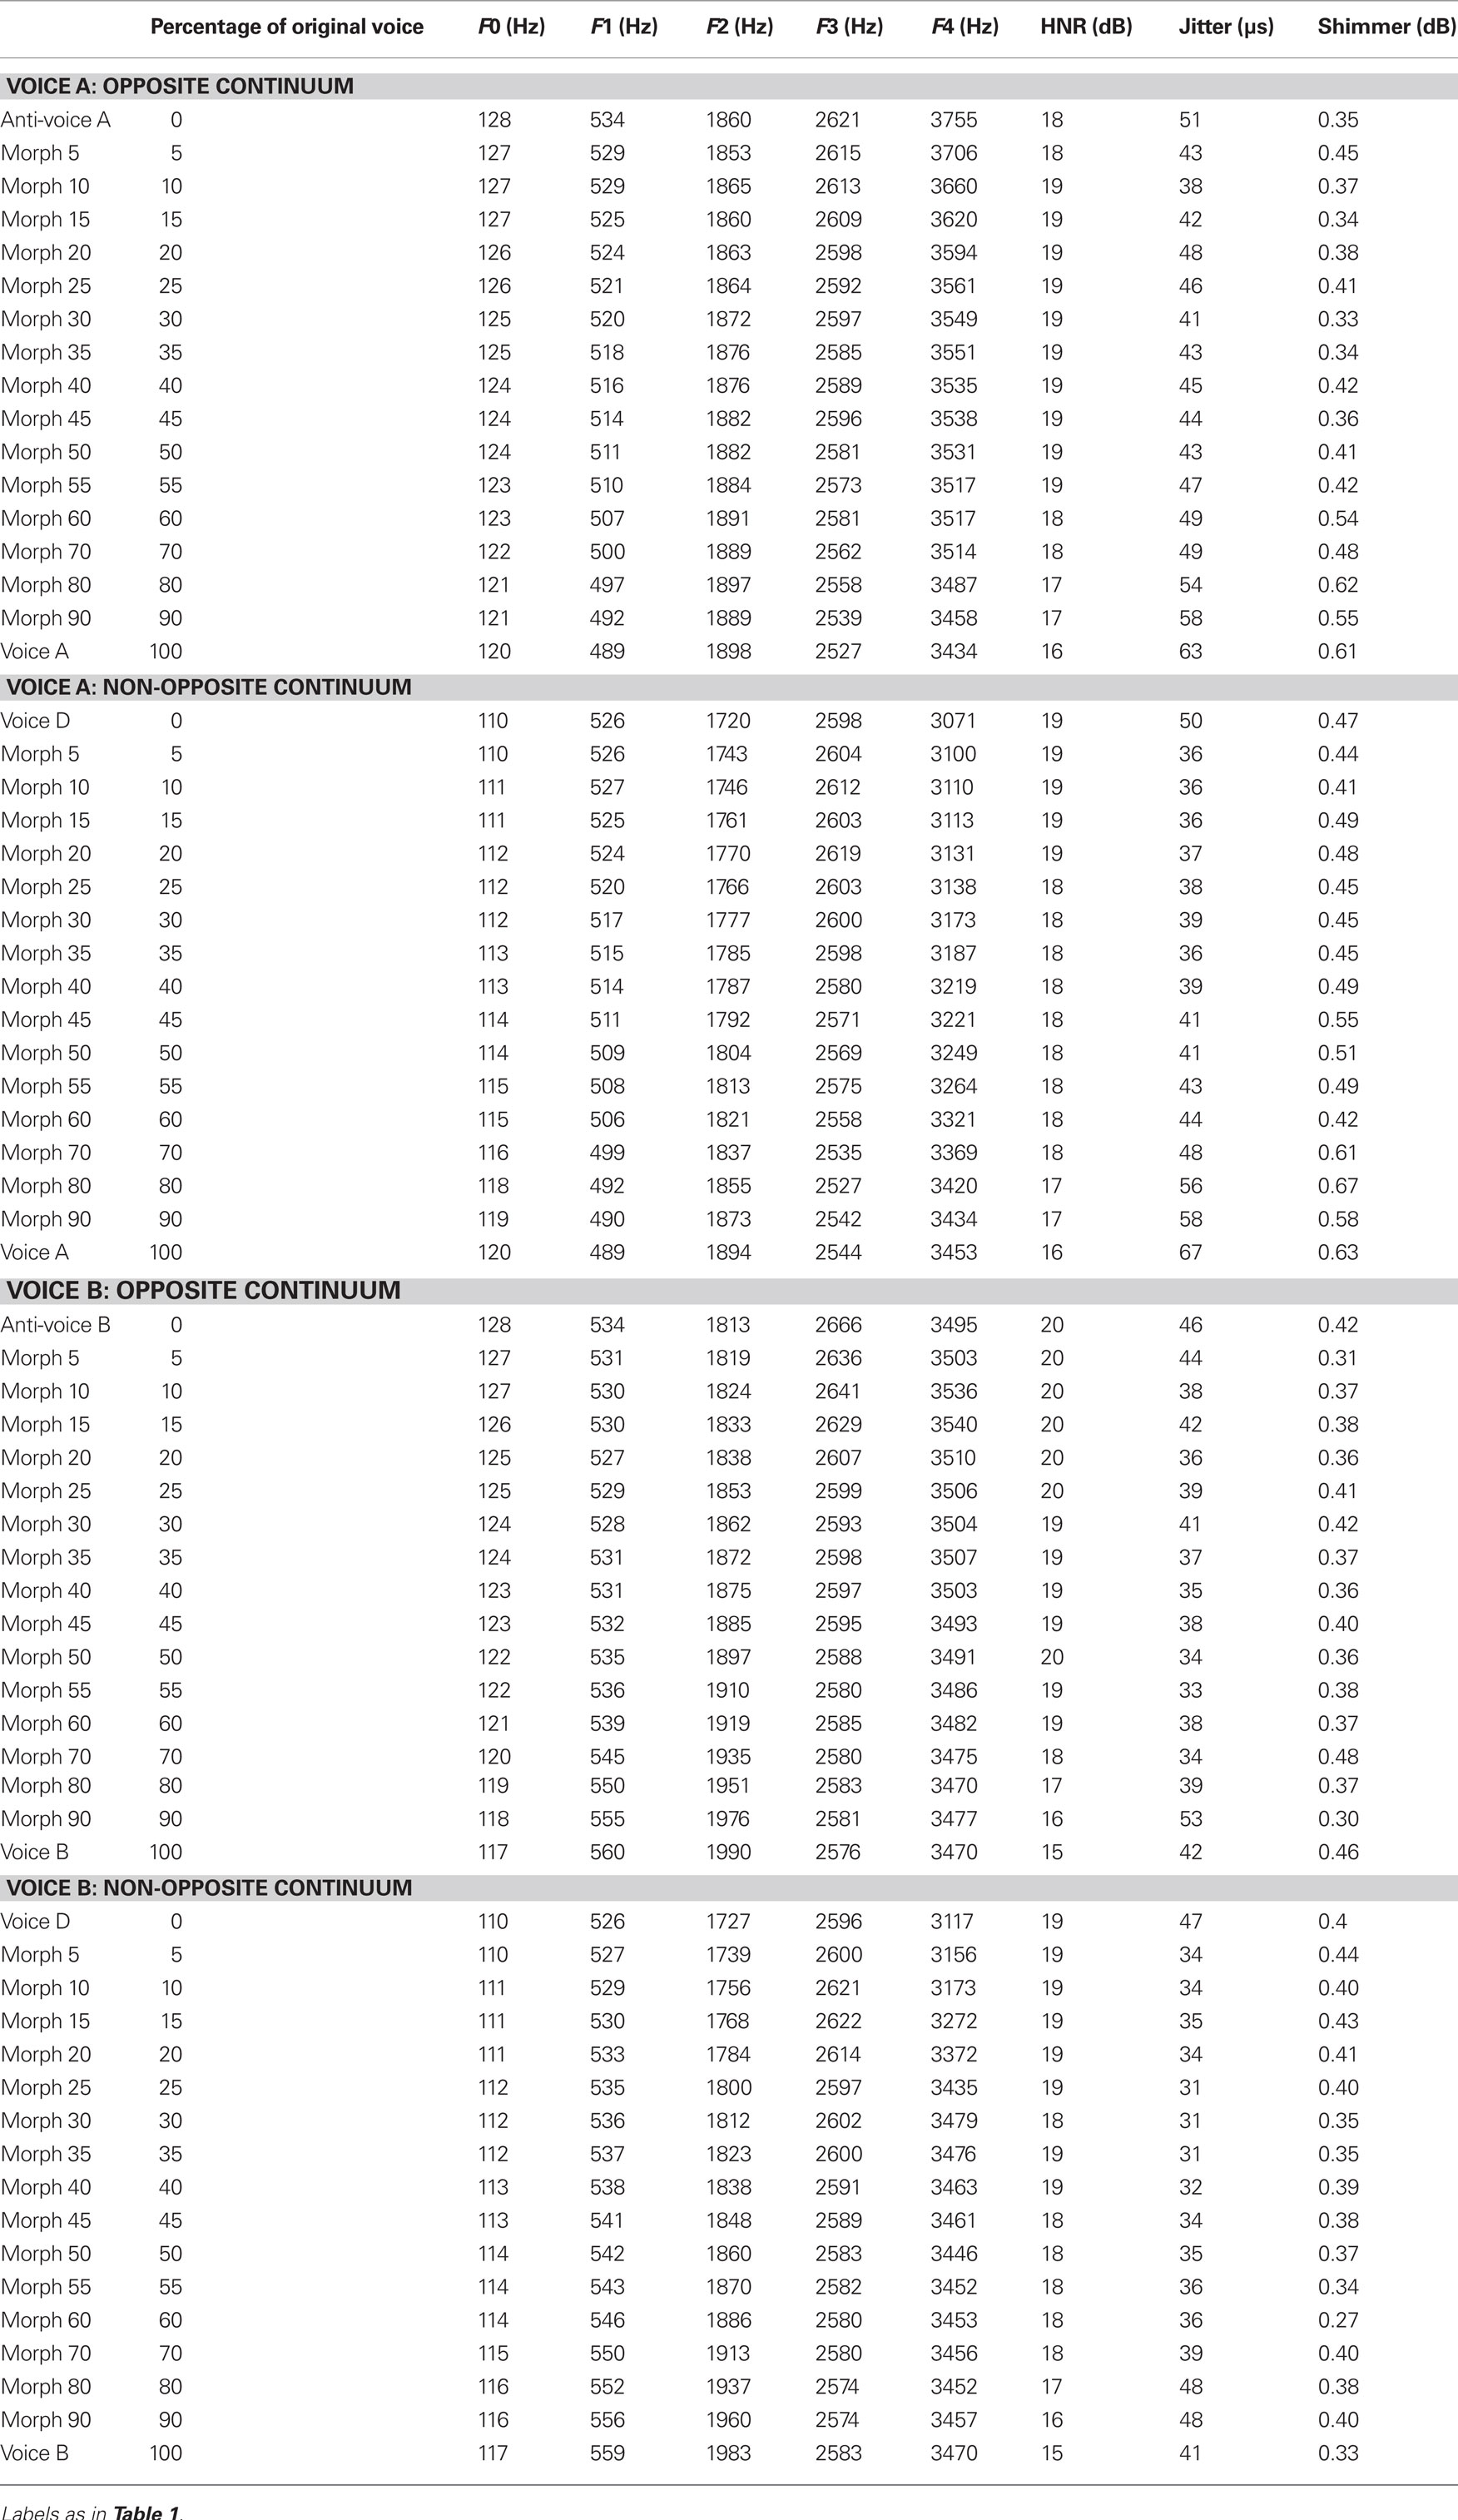
Table 2. Acoustic parameters of the stimuli used in Experiment 2.
Voice learning
Participants were familiarized with the three voices (A, B, and C) with a procedure similar to that of Experiment 1 with the important difference that they were familiarized only with the vowel stimulus to be used in the experiment. This resulted in much shorter learning durations (approximately 10 min). Participants first heard the vowel stimulus 10 times and learned to associate it with the name displayed on the screen. Then, they performed a 3AFC identification task on these three stimuli; feedback was provided on their answers. Finally they were tested in the absence of feedback in the same 3AFC identification task. After a single session, all participants performed above 88% correct.
Procedures
Anti-voice and non-anti-voice adaptation conditions were ran in two different sessions. Each run was organized as follows: a baseline condition, the adaptation blocks (one per identity, repeated twice, i.e., four blocks – 78 trials per block), and a second baseline. The second baseline was acquired after the adaptation blocks in line with Rhodes and Jeffery (2006). During the pre- and post-adaptation baseline, participants performed a 3AFC identification task on the probe stimuli in absence of any adaptation (156 trials). Adaptation was induced by five repetitions of the adaptor; probe stimuli were presented after a silent gap of 1 s. Participants performed a 3AFC identification task on the probe stimuli drawn from the opposite or non-opposite continua depending on the adaptation condition. In the anti-voice adaptation condition, for any given probe, the adaptor could be a matched adaptor (i.e., anti-voice A/voice A – half of the trials), or a non-matched adaptor (i.e., anti-voice B/voice A). In the non-anti-voice adaptation condition, the adaptor (voice D) belongs to both trajectories (A–D and B–D), thus there were only matched trials, i.e., all trials were included in the analysis. The order of the adaptation conditions (anti-voice/non-anti-voice) was counterbalanced across participants. Six participants were removed from the statistical analysis because the logistic function improperly fitted the data in at least one of the seven conditions (R2 < 0.4). Adaptation strength was measured compared to both baselines.
Results and Discussion
In Experiment 2 we compared aftereffects induced by anti-voice adaptors to those induced by a non-anti-voice adaptor, the perceptual distances, and alignment with probe stimuli being comparable across the two conditions (blue vs. red lines of Figure 4A). Whereas identification accuracy for the anti-voice stimuli was close to chance level (33%) as expected, that for probe stimuli close to voice D (percent identity 0–20 in Figure 4C) was closer to 50%, probably owing to the fact that voice D is very distant from learned identity C, thus inducing subjects to select either voices A or B.
Anti-voice adaptors were found to induce a marked perceptual shift (Figure 4B) compared to both the pre- and the post-adaptation baseline [mean PSE abscissa ± SEM (%): matched trials: x = 36.4 ± 2.6; first baseline: x = 51.8 ± 4.9; second baseline: x = 40.4 ± 3.5], replicating the findings of Experiment 1. The adaptor which was not an anti-voice (voice D) induced smaller aftereffects (Figure 4C; matched trials: x = 24.5 ± 4.8; first baseline: x = 33.3 ± 7.6; second baseline: x = 22.9 ± 3.7). Bootstrapping analyses indicates that adaptation strength (measured as the difference between performance in the adaptation conditions and in the baseline) was significantly stronger (p < 0.05) in the anti-voice condition, compared to either baseline in the identity-ambiguous portion of the continua (Figure 5). In the anti-voice adaptation conditions, aftereffects in the non-matched trials yielded similar results than in Experiment 1: they were smaller than that of matched trials, induced a slight perceptual shift compared to the first baseline, but not compared to the second baseline. Analysis of non-matched trials in Experiment 2 thus showed the robustness of our results, i.e., reproducible with a smaller and different subject group and different stimuli, but also confirmed that the slight aftereffects observed were due to general adaptation effects.
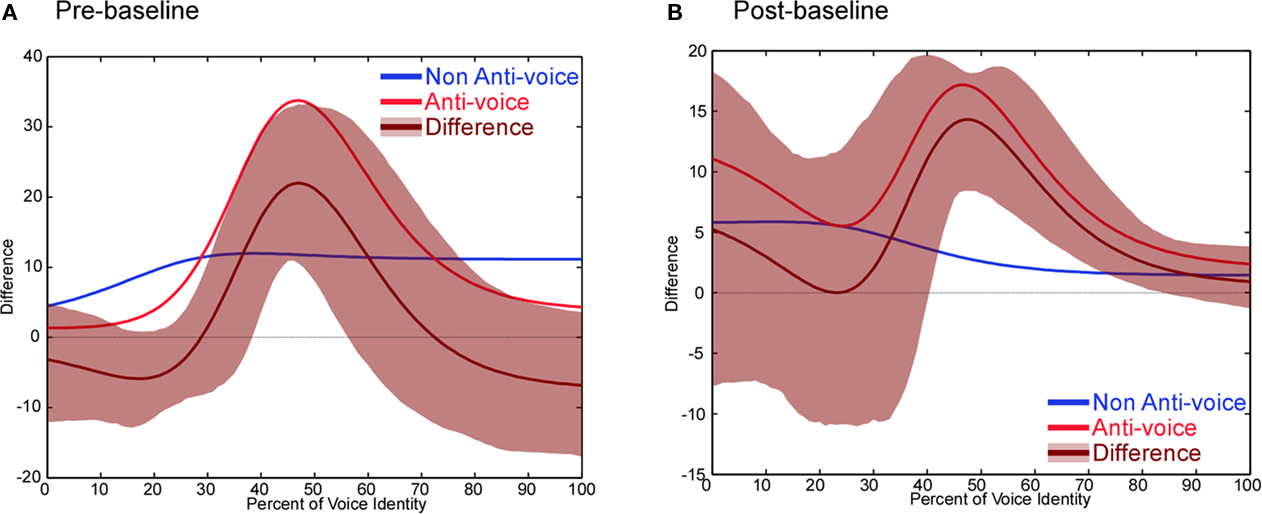
Figure 5. Experiment 2 – Statistical analysis. Adaptation strength relative to the first baseline (A) and the second baseline (B) in the anti-voice (red) and non-anti-voice (blue) conditions, difference between anti-voice and non-anti-voice adaptation (brown, ± 95% CI shaded area). Adaptation strength is computed by calculating the difference between the adaptation condition and each baseline.
In the second experiment, we found stronger perceptual aftereffects for anti-voice stimuli compared to non-anti-voice adaptors, while perceptual distances between each original voice and each adaptor were similar. Thus, our pattern of results is similar to the results of Rhodes and Jeffery (2006) for faces, ruling out a simple explanation of the results of Experiment 1 in terms of repulsion away from any adaptor. Moreover, unlike in the face study, this pattern held even when adaptation was compared to the first baseline.
General Discussion
We used perceptual aftereffects to explore the representations of voice identity. We found across two experiments that for a given voice identity, a voice stimulus lying opposite to this voice relative to the average voice – i.e., its matched anti-voice – in a perceptual voice space yields aftereffects stronger than other adaptors, even though this anti-voice is perceived as an unrelated identity. Our results cannot simply be explained in terms of adaptation to low-level auditory representations: adaptation to low-level acoustical features would be expected to affect similarly the different adaptation conditions, particularly in Experiment 2 where the physical and perceptual differences between stimuli were equalized across the conditions of interest. Yet, aftereffects were stronger for morph trajectories that pass through the average voice thus ruling out any explanation in terms of adaptation to low-level acoustic representations. Similarly, an explanation of this result in terms of perceptual distance or alignment with probe stimuli (Rhodes and Jeffery, 2006) is not sufficient (Experiment 2). Note that alternative interpretations of our findings could still be proposed. For example, an account which would simply assume that the acoustic/perceptual space that voice identities inhabit is non-uniform might also explain the results (see, e.g., Guenther and Gjaja, 1996 for a discussion of how prototype-like behavior might emerge from the distribution of phonetic tokens in acoustic space). However, in line with the generally agreed interpretation of similar aftereffects in face perception studies, the most parsimonious interpretation of our findings is in terms of prototype-based coding of voices. We now discuss the implications of these results for the coding of voice identity.
Prototype-Based Coding of Voice Identity
Two models are commonly used to describe face identity representations: the prototype-based model or axis model (Tsao and Freiwald, 2006) and the exemplar-based model (Valentine, 1991). In the prototype-based model, individual faces are encoded in terms of their position relative to a face prototype. On the contrary, the exemplar-based model does not stipulate the existence of a stored prototype. Converging evidence suggests that the prototype-based model more adequately represents the way individual face identities are represented by the brain. Aftereffects induced by anti-face stimuli notably indicate a special role of the prototypical, average face in face representations by inducing larger perceptual shifts than otherwise comparable adaptors that do not have this anti-face status (Leopold et al., 2001; Rhodes and Jeffery, 2006; Tsao and Freiwald, 2006).
We show that a transposition of this experimental approach from static faces to static voices (vowels) yields highly similar results. As for faces, we find in two experiments that anti-voice stimuli induce stronger aftereffects than other, non-anti-voice adaptors. This finding holds even when perceptual distance and alignment with probe stimuli is controlled (Experiment 2). This finding indicates the adaptation was specific to morph trajectories that pass through the average voice, revealing a special role of the average voice in representing voice identity and constitutes evidence of prototype-based coding of voice identity. The notion of prototype-based coding of voice identity is not novel. Papcun et al. (1989) already proposed a “prototype” model of voice identity to explain the observation that certain voices are easier to remember than others – presumably because they are more distant from the prototype, i.e., more distinctive (Papcun et al., 1989). Recently, indirect evidence for prototype-based coding of voice identity was obtained by Bruckert et al. (2010) who showed that the perceived attractiveness of brief voice samples is a function of their acoustical distance to the average voice [in a logF0–logF1 space adequately summarizing the perceptual space (Baumann and Belin, 2010)]. More relevant to the coding of voice identity, Andics et al. (2010) observed effects of short-term adaptation in the cerebral response to voices which they interpreted as consistent with a prototype-based model of voice identity, although this was not explicitly tested (Andics et al., 2010).
A Perceptual Voice Space
The present study provides empirical evidence supporting prototype-based coding of voice identity. Together with previous studies, these results suggest a model of voice identity representation in which individual voices could be encoded in a multidimensional perceptual voice space. The two dimensions of this perceptual space explaining most of the variance in dissimilarity judgments are well approximated by measures of the fundamental frequency of phonation (F0) and of formant frequencies (Baumann and Belin, 2010), representing contributions of the source and filter aspects of phonation respectively (Ghazanfar and Rendall, 2008; Latinus and Belin, 2011). Evidence from the present study suggests that this perceptual space is centered on the average voice that may act as a reference for encoding different voice identities. The prototype is defined as the voice relative to which all others are encoded; it is thought to be the center of mass of the multidimensional voice space, and was approximated in the present study as a morphing-generated average of 16 voices. Note that our two experiments were not designed to investigate the exact nature of the prototype, an important issue that requires further investigations. For instance, we chose to test a representation of the voices relative to a gender-specific average voice, but future research should test whether an androgynous average voice would lead to even stronger adaptation. Investigating the nature of the prototype, i.e., what information is stored in it, its flexibility, how many voices are required in an average voice so that it acts as a “prototype,” are all important questions for future research.
It is important to note that these results were obtained in the simplified context of voice identity perception from brief vowels. Although this simplified context is analogous to the simplified context of face perception from static pictures of faces and yields comparable results, these results may not generalize to more complex, naturalistic situations. Typically, many other cues unfolding over longer durations contribute to speaker recognition, such as specific phonetic patterns, dialect, intonation, speaking rate, idiosyncratic expressions, etc. Moreover, the number of possible identities in realistic settings is larger than three. These limitations, however, equally apply to results from most face perception studies obtained with static faces, and as for those studies, our results provide important insights into some of the perceptual mechanisms involved in voice recognition.
Conclusion
Similar processing for faces and voices has been proposed due to their co-occurrence in everyday life and because they carry the same types of information: speech, identity, affect (Belin et al., 2004). Yet, these results are the first to provide evidence suggesting similar perceptual encoding strategies for face and voice identity. They suggest that the coding of stimulus identity using contrastive mechanisms relative to a prototype is not a unique feature of visual perception (Leopold et al., 2001; Rhodes and Jeffery, 2006), but may extend to other sensory modalities.
Author Contributions
Marianne Latinus and Pascal Belin designed the experiments. Marianne Latinus conducted and analyzed the experiments. Marianne Latinus and Pascal Belin wrote the manuscript.
Conflict of Interest Statement
The authors declare that the research was conducted in the absence of any commercial or financial relationships that could be construed as a potential conflict of interest.
Acknowledgments
We are grateful to Hideki Kawahara for providing the audio morphing software and to Julien Rouger for his assistance with programming. This work was supported by UK Biotechnology and Biological Sciences Research Council grant (BBSRC, BBE0039581) and a Economic and Social Research Council/Medical Research Council grant (RES-060-25-0010). We are grateful to Rachael E. Jack, Paddy J. O’Donnell, Sara Sereno, Philippe G. Schyns, and Phil McAleer for their comments on the manuscript.
References
Anderson, N. D., and Wilson, H. R. (2005). The nature of synthetic face adaptation. Vision Res. 45, 1815–1828.
Andics, A., Mcqueen, J. M., Petersson, K. M., Gal, V., Rudas, G., and Vidnyanszky, Z. (2010). Neural mechanisms for voice recognition. Neuroimage 52, 1528–1540.
Assal, G., Zander, E., Kremin, H., and Buttet, J. (1976). Voice discrimination in patients with cerebral cortical lesions. Schweiz. Arch. Neurol. Neurochir. Psychiatr. 119, 307–315.
Baumann, O., and Belin, P. (2010). Perceptual scaling of voice identity: common dimensions for different vowels and speakers. Psychol. Res. 74, 110–120.
Belin, P. (2006). Voice processing in human and non-human primates. Philos. Trans. R. Soc. Lond. B Biol. Sci. 361, 2091–2107.
Belin, P., Fecteau, S., and Bedard, C. (2004). Thinking the voice: neural correlates of voice perception. Trends Cogn. Sci. (Regul. Ed.) 8, 129–135.
Blanz, V., O’toole, A. J., Vetter, T., and Wild, H. A. (2000). On the other side of the mean: the perception of dissimilarity in human faces. Perception 29, 885–891.
Bruckert, L., Bestelmeyer, P., Latinus, M., Rouger, J., Charest, I., Rousselet, G. A., Kawahara, H., and Belin, P. (2010). Vocal attractiveness increases by averaging. Curr. Biol. 20, 116–120.
Decasper, A. J., and Fifer, W. P. (1980). Of human bonding: newborns prefer their mothers’ voices. Science 208, 1174–1176.
Eimas, P. D., and Corbit, J. D. (1973). Selective adaptation of linguistic feature detectors. Cogn. Psychol. 4, 99–109.
Garrido, L., Eisner, F., Mcgettigan, C., Stewart, L., Sauter, D., Hanley, J. R., Schweinberger, S. R., Warren, J. D., and Duchaine, B. (2009). Developmental phonagnosia: a selective deficit of vocal identity recognition. Neuropsychologia 47, 123–131.
Ghazanfar, A. A., and Rendall, D. (2008). Evolution of human vocal production. Curr. Biol. 18, R457–R460.
Guenther, F. H., and Gjaja, M. N. (1996). The perceptual magnet effect as an emergent property of neural map formation. J. Acoust. Soc. Am. 100, 1111–1121.
Holt, L. L. (2006). The mean matters: effects of statistically defined nonspeech spectral distributions on speech categorization. J. Acoust. Soc. Am. 120, 2801–2817.
Kawahara, H., Masuda-Katsuse, I., and Cheveigne, A. D. (1999). Restructuring speech representations using a pitch-adaptive time-frequency smoothing and an instantaneous-frequency-based f0 extraction. Speech Commun. 27, 187–207.
Kingdom, F. A. A., and Prins, N. (2010). Psychophysics: A Practical Introduction. London: Academic Press. [An imprint of Elsevier].
Kisilevsky, B. S., Hains, S. M., Lee, K., Xie, X., Huang, H., Ye, H. H., Zhang, K., and Wang, Z. (2003). Effects of experience on fetal voice recognition. Psychol. Sci. 14, 220–224.
Kreiman, J. (1997). “Listening to voices: theory and practice in voice perception research,” in Talker Variability in Speech Research, eds. K. Johnson and J. Mullenix (New York: Academic Press), 85–108.
Latinus, M., Crabbe, F., and Belin, P. (2011). Learning-induced changes in the cerebral processing of voice identity. doi: 10.1093/cercor/bhr077. Cereb. Cortex. [Epub ahead of print].
Leopold, D. A., Bondar, I. V., and Giese, M. A. (2006). Norm-based face encoding by single neurons in the monkey inferotemporal cortex. Nature 442, 572–575.
Leopold, D. A., O’toole, A. J., Vetter, T., and Blanz, V. (2001). Prototype-referenced shape encoding revealed by high-level aftereffects. Nat. Neurosci. 4, 89–94.
Loffler, G., Yourganov, G., Wilkinson, F., and Wilson, H. R. (2005). fMRI evidence for the neural representation of faces. Nat. Neurosci. 8, 1386–1390.
Mullennix, J. W., Johnson, K. A., Topcu-Durgun, M., and Farnsworth, L. M. (1995). The perceptual representation of voice gender. J. Acoust. Soc. Am. 98, 3080–3095.
Papcun, G., Kreiman, J., and Davis, A. (1989). Long-term memory for unfamiliar voices. J. Acoust. Soc. Am. 85, 913–925.
Perrachione, T. K., and Wong, P. C. (2007). Learning to recognize speakers of a non-native language: implications for the functional organization of human auditory cortex. Neuropsychologia 45, 1899–1910.
Remez, R. E., Fellowes, J. M., and Rubin, P. E. (1997). Talker identification based on phonetic information. J. Exp. Psychol. Hum. Percept. Perform. 23, 651–666.
Rhodes, G., and Jeffery, L. (2006). Adaptive norm-based coding of facial identity. Vision Res. 46, 2977–2987.
Schweinberger, S. R., Casper, C., Hauthal, N., Kaufmann, J. M., Kawahara, H., Kloth, N., Robertson, D. M., Simpson, A. P., and Zaske, R. (2008). Auditory adaptation in voice perception. Curr. Biol. 18, 684–688.
Skinner, A. L., and Benton, C. P. (2010). Anti-expression aftereffects reveal prototype-referenced coding of facial expressions. Psychol. Sci. 21, 1248–1253.
Tsao, D. Y., and Freiwald, W. A. (2006). What’s so special about the average face? Trends Cogn. Sci. (Regul. Ed.) 10, 391–393.
Valentine, T. (1991). A unified account of the effects of distinctiveness, inversion, and race in face recognition. Q. J. Exp. Psychol. A 43, 161–204.
Van Lancker, D. R., Cummings, J. L., Kreiman, J., and Dobkin, B. H. (1988). Phonagnosia: a dissociation between familiar and unfamiliar voices. Cortex 24, 195–209.
Webster, M. A., and Maclin, O. H. (1999). Figural aftereffects in the perception of faces. Psychon. Bull. Rev. 6, 647–653.
Wilcox, R. R. (2005). Introduction to Robust Estimation and Hypothesis Testing, 2nd Edn, San Diego, CA: Academic Press.
Keywords: adaptation, morphing, average, prototype, representation, perceptual space
Citation: Latinus M and Belin P (2011) Anti-voice adaptation suggests prototype-based coding of voice identity. Front. Psychology 2:175. doi: 10.3389/fpsyg.2011.00175
Received: 23 March 2011;
Accepted: 13 July 2011;
Published online: 27 July 2011.
Edited by:
Michael J. Tarr, Carnegie Mellon University, USAReviewed by:
Lori L. Holt, Carnegie Mellon University, USALaurie Heller, Carnegie Mellon University, USA
Emily Myers, University of Connecticut, USA
Copyright: © 2011 Latinus and Belin. This is an open-access article subject to a non-exclusive license between the authors and Frontiers Media SA, which permits use, distribution and reproduction in other forums, provided the original authors and source are credited and other Frontiers conditions are complied with.
*Correspondence: Marianne Latinus, Voice Neurocognition Laboratory, Social Interactions Research Centre, Institute of Neuroscience and Psychology, University of Glasgow, 58 Hillhead Street, Glasgow G12 8QB, UK. e-mail: marianne.latinus@glasgow.ac.uk