
- 1 Graduate School of Systemic Neurosciences, Ludwig-Maximilians-University, Munich, Germany
- 2 Department of Neurology, Klinikum Großhadern, Ludwig-Maximilians-University, Munich, Germany
- 3 Centre for Cognitive and Neural Systems, University of Edinburgh, Edinburgh, UK
- 4 School of Informatics, University of Edinburgh, Edinburgh, UK
- 5 Integrated Centre for Research and Treatment of Vertigo (IFB), Ludwig-Maximilians-University, Munich, Germany
- 6 Centre for Cognitive Ageing and Cognitive Epidemiology, University of Edinburgh, Edinburgh, UK
Our ability to perceive visual motion is critically dependent on the human motion complex (hMT+) in the dorsal visual stream. Extensive electrophysiological research in the monkey equivalent of this region has demonstrated how neuronal populations code for properties such as speed and direction, and that neurometric functions relate to psychometric functions within the individual monkey. In humans, the physiological correlates of inter-individual perceptual differences are still largely unknown. To address this question, we used functional magnetic resonance imaging (fMRI) while participants viewed translational motion in different directions, and we measured thresholds for direction discrimination of moving stimuli in a separate psychophysics experiment. After determining hMT+ in each participant with a functional localizer, we were able to decode the different directions of visual motion from it using pattern classification (PC). We also characterized the variability of fMRI signal in hMT+ during stimulus and rest periods with a generative model. Relating perceptual performance to physiology, individual direction discrimination thresholds were significantly correlated with the variability measure in hMT+, but not with PC accuracies. Individual differences in PC accuracy were driven by non-physiological sources of noise, such as head-movement, which makes this method a poor tool to investigate inter-individual differences. In contrast, variability analysis of the fMRI signal was robust to non-physiological noise, and variability characteristics in hMT+ correlated with psychophysical thresholds in the individual participants. Higher levels of fMRI signal variability compared to rest correlated with lower discrimination thresholds. This result is in line with theories on stochastic resonance in the context of neuronal populations, which suggest that endogenous or exogenous noise can increase the sensitivity of neuronal populations to incoming signals.
Introduction
Accurate perception of visual motion is a key function of the human brain, enabling us to interpret the world around us, to predict trajectories of moving objects and to steer vehicles and control locomotion. While many psychophysical and neurophysiological studies have revealed common processing of visual motion information across participants, perceptual capabilities can differ substantially between individuals (Halpern et al., 1999). Though classical behavioral experiments average these difference to focus on the mean tendency, heterogeneity in visual motion perception can provide information on perceptual functioning. Describing performance profiles of motion perception might, for example, help to distinguish subgroups in phenomena like dyslexia or describe aging processes in the visual system (Talcott et al., 2000; Slaghuis and Ryan, 2006; Bennett et al., 2007; Billino et al., 2008). Exploring the relation between differences in performance on motion tasks and physiological signals in the visual dorsal stream can shed light on the relationships between cortical processing and perception.
Motion perception in humans critically depends on area hMT+ (also known as V5, for a review see Born and Bradley, 2005). Extensive research on its equivalent in monkeys (MT) has shown that neurons in this region are selective for the direction and speed of moving stimuli. Direction sensitive neurons show columnar organization, with columns of smoothly changing preferred directions abutting columns of the opposite preferred direction (Born and Bradley, 2005). Relating neuronal characteristics to behavior, neurometric functions of single-neurons were shown to correlate with psychometric functions in a direction discrimination task (Britten et al., 1992). More evidence for a direct link between MT neuronal properties and perception comes from studies which show that microstimulation can considerably bias performance (Cohen and Newsome, 2004) and that deteriorated neuronal speed and direction selectivity accompanies aging (Yang et al., 2009; Liang et al., 2010).
In humans, hMT+ lies in an anatomically variable region and shows variation in histological and functional anatomy across individuals (Dumoulin et al., 2000; Huk et al., 2002; Malikovic et al., 2007). Studies exploring neurophysiological properties of hMT+ have worked with exogenous variation of the stimulus (e.g., coherence of movement) to describe related modulations of the blood oxygen level dependent (BOLD) signal. Other studies have considered endogenous signal changes in hMT+ during the presentation of ambiguous stimuli, reflecting switches between percepts (for example Castelo-Branco et al., 2002; Muckli et al., 2002). The latter line of research shows the informative value of looking at endogenous fluctuations in hMT+, an approach we took in the current study to describe inter-individual physiological differences. While structural differences in the visual stream have been shown to correlate with individual psychophysical thresholds (Kanai and Rees, 2011), the connection between individual physiological properties of hMT+ and inter-individual differences in psychophysical tasks is less explored.
On a neuronal level, a possible reason for different perceptual sensitivity for direction could be the relative width of directional tuning curves. Sharper tuning curves lead to an unambiguous population signal in hMT+, which could be reflected in more distinct patterns for different directions of motion. On the behavioral level, this might translate into lower psychophysical thresholds when an individual has to make fine discrimination between different directions of motion (Purushothaman and Bradley, 2005; Liang et al., 2010). A potential candidate for revealing such physiological differences in fMRI is multi-voxel pattern analysis (MVPA) which is able to resolve fine grain patterns of hMT+ organization invisible to univariate techniques (Kamitani and Tong, 2006). Individual differences in decoding accuracy might indicate the distinctiveness of the hMT+ population pattern and correlate with perceptual performance.
Another method which has been recently suggested as a good gauge for inter-individual comparisons is variability analysis of the BOLD signal (Garrett et al., 2010; Mohr and Nagel, 2010; Samanez-Larkin et al., 2010; Mennes et al., 2011). Measurements of variability aim to describe endogenous background fluctuations in the signal, which appear independent of the timecourse of the experimental manipulation. An important confound for accurately measuring such endogenous variability is that the relationship between the stimulus and the BOLD signal has to be described as precisely as possible. Only if this is achieved can one investigate if the observed physiological variability has functional significance. A growing body of studies suggests that neurophysiological variability patterns can be understood as (functional relevant) “signal” rather than (function disturbing) “noise” (Faisal et al., 2008; McDonnell and Abbott, 2009; Garrett et al., 2010). Population signal variability in hMT+ could have different effects on performance accuracy: higher overall variability levels in hMT+ could be detrimental for discrimination performance if they would have an destabilizing effect on the hMT+ population signal as some authors suggest for the dopamine system (Winterer et al., 2006; Samanez-Larkin et al., 2010). Alternatively, a certain level of variability has been described to improve the sensitivity of systems, e.g., by stabilizing synchronized oscillating populations (Ermentrout et al., 2008), an observation described as stochastic resonance (Emberson et al., 2007; McIntosh et al., 2008; McDonnell and Abbott, 2009; Garrett et al., 2010).
In the present study, we set out to characterize brain activity that correlates with inter-individual variability in the accuracy of visual motion perception. We used multivariate pattern classification (PC) to describe hMT+ population patterns and we characterized the variability of the hMT+ BOLD signal during perception of motion in different directions. We investigated if these measures can serve as sensitive indicators for inter-individual performance differences on a motion direction discrimination task.
Materials and Methods
Participants
Fifteen healthy subjects gave written informed consent to participate in this study. The study was performed in accordance with the Declaration of Helsinki and approved by the ethics committee of the medical faculty of the Ludwig-Maximilians University Munich. Handedness was determined according to a 10-item excerpt of the “Handedness Inventory,” coding the degree of handedness (+100: exclusively right handed, −100: exclusively left handed; Oldfield, 1971). It resulted in +100 in 13 subjects, one with +64 and one with +81. All subjects had normal or corrected-to-normal visual acuity as determined binocularly with a Snellen table (0.8 on 6 m or better). None of the subjects were taking medication or had any history of neurological disease. All subjects understood the instructions without difficulty. One subject was excluded from the MR analysis due to excessive motion resulting in a final cohort of 14 subjects (age range: 21–27, 6 female). These 14 subjects consecutively also took part in the psychophysical task on direction discrimination. Three subjects were excluded from psychophysical data analysis, as their measurements did not fulfill stability criteria as described below.
Psychophysics
Apparatus
Stimuli were generated by a Fujitsu Siemens Pentium(R) 4 CPU at a frame rate of 85 Hz and displayed on a 40-cm × 30-cm Conrac Elektron CRT monitor driven by a NVIDIA Quadro Pro2 graphics card. The monitor resolution was set to 1280 × 1024. White and black pixel had a luminance of 25.3 and 0.1 cd/m2, respectively, resulting in a maximum Michelson contrast of 99%. Experiments were conducted in a darkened room and subjects were seated in 60 cm distance from the monitor.
Stimulus
Stimuli were programmed in Matlab 7.3 using the Psychophysics Toolbox extensions (Brainard, 1997). Coherent translational flow fields were presented in a circular aperture (11.4° × 11.4°), containing 300 white dots (diameter: 0.1°) at a time on a black background. All dots of one stimulus moved in a upward direction either vertically or at a small tilt from the vertical with a speed of 8°/s. Dots moving out of the aperture reappeared at new random positions (at the bottom of the aperture). Stimulus intensity was defined as the degree of tilt of the match stimulus (clockwise or anticlockwise) in respect to the upward (0°) reference stimulus.
Procedure
A two-alternative-forced-choice task was used to determine individual thresholds and psychometric functions of direction sensitivity. Reference stimulus and match stimulus were presented consecutively (stimulus duration: 1.5 s, inter stimulus interval: 0.25 s, intertrial interval: 1.25 s). While fixating on the center of the aperture, subjects indicated with a buttonpress whether the second stimulus (match) was tilted clockwise or anticlockwise with respect to the first, upward moving reference stimulus (compare Figure 1A). After initial training with feedback (60 trials), preliminary thresholds were determined by two repetitions of a 3-down-1-up adaptive double-staircase method (140 trials). The staircase measure was defined as stable if the slope of the linear fit from the last 12 reversals was less than 0.02. All but one subject achieved stable staircase measurements (this subject belonged also to the outliers in the measurement of constant stimuli, defined as subjects whose threshold exceeded the fourth quartile, see 2.2.4). Consecutively, the method of constant stimuli was used to sample the psychometric function, the range of sampling was set around the threshold determined by the staircase measurements. Tilt was varied between seven different intensities and each intensity was presented in 30 trials, resulting in a total of 210 trials. Subjects answered following the second stimulus and both speed and accuracy of the response were emphasized. Response times were measured from the moment the second stimulus ended until the moment of response. No feedback was given in staircase or constant stimulus measurements.
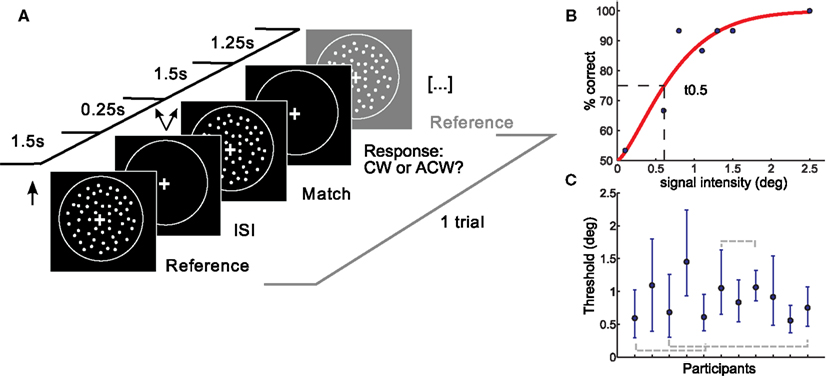
Figure 1. Setup and results of the psychophysical experiment. (A) A coherent flow field of white dots was moving in an upward vertical direction followed by a match stimulus moving upward with a slight tilt clockwise or anticlockwise from vertical. Participants responded following the match stimulus. One trial is depicted. (B) Psychometric function of one representative subject. Percent correct responses are plotted as a function of the deviation (in degree) of the match stimulus from the reference stimulus. Thresholds were taken at the mid-point of the psychometric function (t0.5, shown by dotted lines). (C) Subjects yielded different thresholds. Shown are individual t0.5 thresholds with errorbars depicting the 95% confidence intervals. Subjects which were not found to be different in a post hoc test are shown with gray dotted lines. deg, degree tilt from vertical; ISI, interstimulus interval; CW, clockwise; ACW, anticlockwise.
Data analysis
Data was analyzed using psignifit toolbox (Wichmann and Hill, 2001a,b) in Matlab 7.3. Final thresholds were obtained by fitting the percentage of correct responses determined by the method of constant stimuli with a cumulative Weibull distribution using a maximum likelihood procedure. Free parameters were threshold, slope, and lapse rate, which was kept variable between 0 and 0.5 (Wichmann and Hill, 2001b). Thresholds were taken as the 0.5 cut-off from the fitted function, corresponding roughly to a performance level of 75% correct (see Figure 1B).
To ensure data reliability, those subjects whose thresholds exceeded the fourth quartile were excluded from further analysis (2 of 14). Subjects were furthermore excluded if the fit of their psychometric function did not meet goodness-of-fit criteria in the sensitivity analysis. Summary statistics yielded good fits between the psychometric function and the data for 11 of the 12 remaining subjects. Ninety-five percentage confidence intervals (CI) were calculated for the thresholds of each subject using the bootstrapping method (sampling with replacement, 1999 repetitions).
A one-way Kruskal–Wallis ANOVA tested for inter-individual differences in the behavioral thresholds, using the bootstrapped results.
Averaged reaction times (RT) were calculated as the arithmetic mean over the whole constant stimuli experiment. RT consistency was calculated as the SD over the experiment.
Magnetic Resonance Imaging
Experimental stimulus and procedure
Visual stimuli were projected with a LCD projector on a screen placed behind participants in the MR-scanner, which they viewed through a mirror placed above them at 45°. Vizard 3.0 (Worlviz)1, was used to produce coherent translational flow fields presented in a circular aperture (300 dots per display, aperture size 11.4° × 11.4°). Participants watched flow fields in one of four possible directions (0°, 90°, 180°, and 270°), shown in a randomized order, while fixating on a cross in the middle. Using a block design, 18 s task periods were interleaved with 10 s rest periods, during which subjects continued fixating. One block consisted of four trials, in which direction of motion was kept constant. Subjects performed a two-alternative forced-choice speed discrimination task, to keep their attention directly related to the movement of the stimulus while incidentally coding stimulus direction. In each trial, two consecutive stimuli were shown, a reference speed of 8°/s and a match stimulus of faster speed randomly distributed to the first or second presentation (stimulus duration: 1.5 s, interstimulus interval: 0.25 s, intertrial interval: 1.25 s, as for the psychophysical stimulus). Subjects reported the order-position of the faster stimulus with a buttonpress (see Figure 2A). For keeping task difficulty constant, individual speed discrimination thresholds were kept at a task performance of about 80% correct with an adaptive staircase procedure (QUEST, Watson and Pelli, 1983). Subjects performed 8 runs for a total of 32 repetitions per direction. Participants practiced the task outside the MR-scanner until they reached a satisfactory performance level (2 runs in which participants had to be error-free for 12 trials (fixed velocity difference) after which a staircase procedure started, on which subjects had to demonstrate a stable 80% correct threshold for at least 12 trials). They also practiced inside the bore of the MR-scanner, until they were comfortable conducting the task in a supine position.
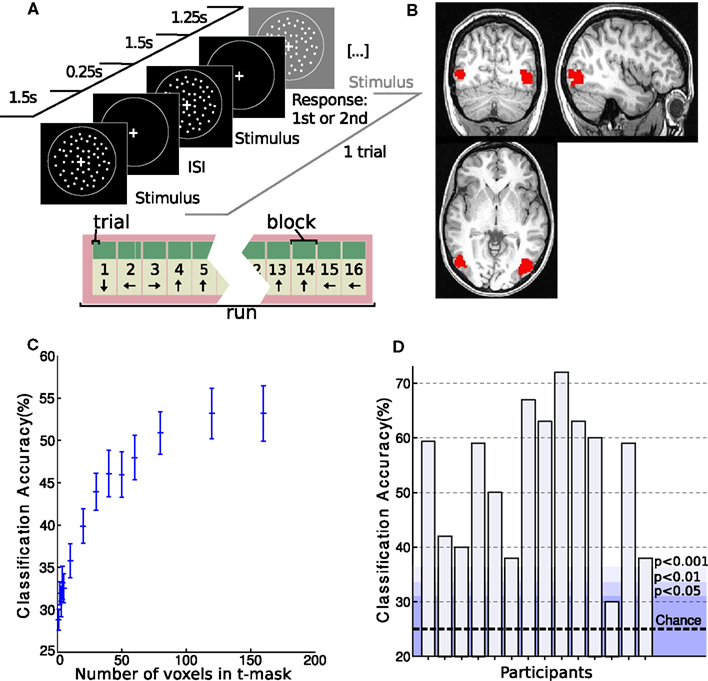
Figure 2. Setup and hMT+ classification results of MR experiment. (A) Experimental setup. Coherent flow fields of white dots moved in one of four directions (0°, 90°, 180°, and 270°, clockwise from upward) while subjects performed a speed discrimination task. One trial is depicted. Blocks consisted of 4 trials and runs of 16 blocks. Direction of motion was consistent within blocks and differed between blocks. (B) Example of an individual hMT+ t-mask as created with the functional localizer experiment. (C) Classification accuracy in hMT+ with varying number of voxels used in the mask. Classification performance averaged over subjects is shown. Note that the accuracy plateaus at 120 voxels. (D) Individual classification accuracy in hMT+ for each subject with a t-mask of 160 voxels. The dotted line indicates chance performance. The shading shows different probability levels as determined by permutation testing.
A separate fMRI experiment was conducted to functionally localize hMT+ in each subject, according to previously established procedures (Morrone et al., 2000; Huk et al., 2002). Briefly, a stimulus of alternating moving and stationary dot patterns was presented in a circular aperture with interleaved rest periods. Moving dots (velocity: 17.1°/s) traveled toward and away from the fixation cross for 16 s, followed by a 16-s stationary dot field, and a 20-s blank screen. Subjects fixated at all times.
fMRI acquisition
Imaging data were acquired on a 3T MR-Scanner (GE Sigma HDx) with a standard 8 channel head coil using an echo-planar imaging sequence (TR: 2 s, echo time: 40 ms, flip angle: 70°) to acquire 25 slice volumes (interleaved acquisition, no gap), centered on the area of interest (medial temporal lobe). Voxel size was 1.75 mm × 1.75 mm × 2.4 mm. In total, 8 runs of 225 volumes for the experimental condition and 1 run of 132 volumes for the functional hMT+ localizer were acquired in each subject. In addition, a T1-weighted anatomical volume was acquired.
Defining hMT+ and V1 masks
To define functional regions of interest, fMRI data from the functional localizer were realigned to the first volume of the timeseries and smoothed with a kernel of 4 mm FWHM as implemented in SPM8 (Wellcome Department of Imaging Neuroscience, London, UK). Data were processed in individual space. A general linear model analysis comprising regressors for motion and stationary conditions was performed. Contrasting motion and stationary regressors identified clear delineated clusters for hMT+ (FWE, p < 0.05 in all but two subjects, who showed hMT+ clusters only at p < 0.001 uncorrected). See Figure 2B for an example. The clusters from the two hemispheres were combined to make a hMT+ mask of voxels for further analysis.
The V1 mask was created using anatomical and functional constraints. V1 was determined anatomically using FreeSurfer’s cortical parcelation algorithms in every subject, based on anatomical constrains described by Hinds et al. (2008). The final mask consisted of voxels within this anatomically defined V1 which showed significant activation in the functional localizer, using the motion–stationary contrast.
Multivariate pattern classification and preprocessing
We used the Princeton Multi-Voxel Pattern Analysis Toolbox (MVPA)2, to test whether voxels within hMT+ or V1 contained information about the direction of the stimulus. Data were prepared by unwarping, realigning (SPM8), and detrending (MVPA) the timeseries to remove linear trends and high-pass filtering (cut-off: 128 s) to remove low frequency noise. Z-scoring of response amplitudes for stimulus periods of individual voxels was applied to minimize baseline differences across runs and to reduce the impact of outliers. To account for the latency of the hemodynamic response, all stimulus onset times were shifted forward in time by 4 s as described previously (Kamitani and Tong, 2006). Data were neither smoothed nor spatially normalized, to avoid signal degradation and preserve inter-individual differences. The nine image volumes from each block of four trials were combined to generate a single average volume for each block.
The 160 voxels with the highest t-values in the functional localizer experiment were selected from the hMT+ or V1 masks respectively for decoding analysis. We tested different mask sizes, but found no improvement in classification accuracy beyond 160 voxels (see Figure 2C).
The lSVM (linear support vector machine) classifier was chosen as it provided stable results across participants without overfitting. It was used with a fixed cost, c = 1. Classification used standard leave-one-out cross-validation, in which the data set was divided, with seven runs in the training set and one run in the testing set. The test was repeated eight times, with each different run being the test set (Pereira et al., 2009). The accuracy scores reported represent the proportion of blocks in which the classifier correctly decoded directions.
Generating a stability index to quantify head motion
An index was designed to assess data stability for individual subjects. Head-movement causes image shifts between classifier training and test periods which are detrimental for MVPA. Specifically, a movement in the middle of the acquisition is more detrimental than a movement at its start or end because there will be more cross-validation iterations in which the training set contains volumes misaligned with the test set’s volumes. Our stability index (SI) roughly represents the longest stable stretch of head orientation during data acquisition. For each volume, the location of the center of hMT+ is estimated from the realignment parameters generated during image preprocessing. Each volume is compared with all others. At each comparison (e.g., between volumes i and j), the distance, dij between the estimated locations of hMT+ is calculated and a number, Aij, assigned describing how aligned the pair of volumes are. This alignment score is
The similarity Si of each volume with all the other volumes is summarized by summing over all of its alignment scores:
Finally, the whole recording session is given a SI, which is the score for the volume with the highest similarity score:

Figure 3A illustrates how the similarity value varies for different time points over a fictitious series of volumes. The example shows little head motion during the longest part of data acquisition and a single large head motion toward the end. Similarity values for volumes in the long stable period are higher than for those after the movement, because the volumes in the former are similar to many more timepoints than a volume taken after the movement.
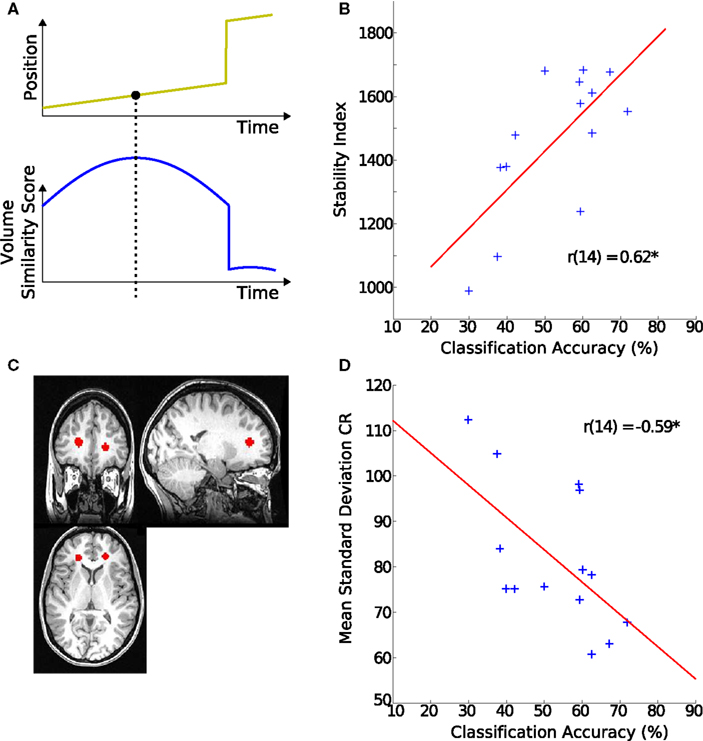
Figure 3. Origins of classification variability. (A) Schematic of the stability index. The upper plot shows simulated movement of a participant across a scanning session. The lower plot indicates how similar each of the volumes is to all the other volumes in the scan. For example the last few volumes are very dissimilar to the rest of the scan. The value of the volume with the highest similarity score is used as this participant’s overall stability index. (B) Stability index and hMT+ classification accuracy. The stability index was positively correlated with decoding accuracy. (C) Region of interest in white matter. The region is defined by placing two spheres of 80 voxels each in the anterior portion of the corona radiata (CR). (D) Signal variance in white matter and hMT+ classification accuracy. The individual SD during block-periods in CR was negatively correlated with the decoding accuracy in their hMT+.
Estimating BOLD signal statistics using a generative model
Variability of the timecourses of the 160 voxels from the above described hMT+ and V1 masks was assessed with a generative model for stimulus (SDstim) and rest periods (SDrest) (see Figure 4B for an illustration of the model). In addition, variability was estimated in a white matter region to quantify the contribution of non-physiological variability to noise, as those regions show little change in local metabolism (Rostrup et al., 2000). Spheres of 80 voxels in each hemisphere were selected from the anterior portion of the corona radiata (CR), as determined by the Harvard–Oxford structural atlas (see Figure 3C for an example).
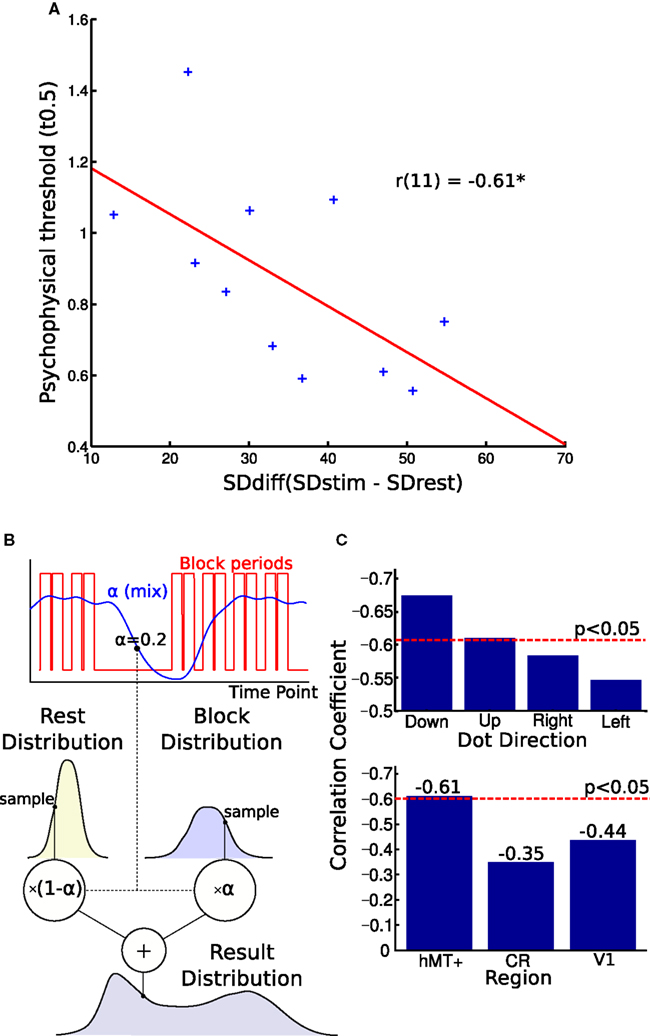
Figure 4. Blood oxygen level dependent (BOLD) signal variability and behavioral performance. (A) Correlation of BOLD signal variance and direction discrimination threshold. The difference in individual SD between the blocks and rest periods correlated with single-subject thresholds from the psychophysics experiment. A larger variability difference is correlated with lower direction discrimination thresholds. (B) This figure illustrates the generative model used to estimate the parameters of the two distributions. The graph shows how the alpha “mix” values are calculated from the block times. Each volume’s alpha value is used to estimate what proportion of the signal is from the stimulus and what proportion is from the rest period. These two distributions are sampled and their weighted sum is found. This is used to generate the distribution. The log likelihood of the real distribution being generated in this way is calculated. The parameters of the block and rest distributions are then altered to maximize this log likelihood. (C) Top graph: Comparing correlations for different stimulus directions. Splitting the block and rest periods in the four directions shown during the MR experiment, we observed small differences in correlation strength. Bottom graph: Comparing correlations over different brain regions. The correlation between noise difference and psychophysical threshold was smaller and not significant in the white matter region CR and V1. CR, corona radiata.
Timecourses were high-pass filtered before model analysis. The temporal properties of the BOLD signal were described by modeling all eight events within a stimulus block as box-cars (1.25 s duration), which is similar to modeling them as delta functions as used in event-related designs. Box-cars were then convolved with the canonical hemodynamic response function (HRF), to account for the latency of the BOLD signal. A mixing parameter αi was generated by this function and assigned to each volume i, describing the proportion of the signal recorded at that timepoint that was provided by the stimulus periods.
For the generative model, both stimulus and rest periods were modeled as gaussian distributions (stimulus: mean μs, variance  rest: mean μr, variance
  ). The proportion of each of these distributions included in the final signal was estimated using maximum likelihood estimation (MLE). The estimate of the signal for a particular time point was calculated by finding the weighted sum of the two distributions. The mean and variance of the sum of two independently distributed gaussian random variables was found by adding the means and variances of the two distributions. So the mean and variance of the new distribution for time point i could be written as:

this allows one to write the probability of value xi as
Assuming independent and identically distributed sampling, the likelihood of the whole timeseries is:
The log likelihood therefore is:
The four parameters were estimated by maximizing this function with respect to each of them.
Finally, the arithmetic difference between the SD within stimulus periods (σs) and within rest periods (σr) was calculated for each participant (SDdiff).
Adaptation model. The above model is not the only conceivable description of the signal timecourse. An alternative model was tested to assess the stability of our results yielded with the first approach. In this alternative model, possible signal adaptation in hMT+ over a block was accounted for by introducing a exponential decay term with a time constant of 5 s. This reduced the (pre-HRF convolved) box-car signal exponentially while the stimulus was applied, and allowed it to recover using the same exponential function during the stimulus-off periods. A maximum reduction of 14% in the BOLD response due to the adaptation was assumed, based on electrophysiological studies (Petersen et al., 1985; Krekelberg et al., 2006). The model was tested at four values of the time constant: 5, 10, 20, and 40 s. All other parameters of the model were kept constant.
Assessing Eye Movements from FMRI Data
Although subjects were instructed to fixate, we were concerned that systematic eye movements occurred. It has been shown previously that eye movements can be estimated from fMRI data by analyzing the timecourse of fMRI signal in the vitreous of the eye (Beauchamp, 2003). We took this retrospective approach in those subjects in which the eyeball was partially contained in the field of view (FOV; in 3 of 11 participants the eyeballs were to 33, 40, and 46% contained in the FOV, see Figure 5). We defined a region of interest for the available section of the eyeball using FreeSurfer. The mean timecourse was extracted using marsbar in SPM8. To estimate the dependency between eyeball signal and the rest of the brain, we used the eyeball timecourse as regressor in a GLM, as has been described previously (see Muckli et al., 2009 supplementary material).
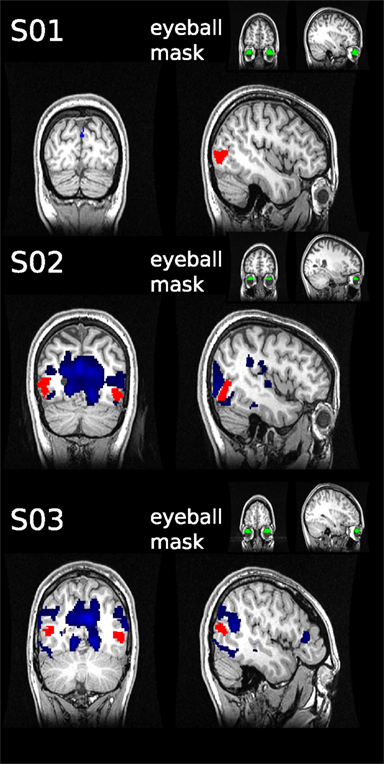
Figure 5. Retrospective eye movement analysis. The mean timecourse was extracted from the eyeball ROIs (green) defined for three subjects. The timecourses were used as regressors in general linear models to assess correlated activity in the rest of the brain (blue). No overlap was found with the hMT+ masks (red).
Correlation of Behavioral Data with MR Measurements
A Pearson correlation was calculated between individual thresholds from the behavioral experiment (t0.5) and the individual noise difference between block and rest periods as determined by the generative model (SDdiff). Additionally, a Spearman correlation was performed which also showed a significant correlation. The robustness of the significant Pearson correlation was estimated using bootstrapping, sampling with replacement with 2000 iterations, to produce 95% CI for the r distributions.
Results
Inter-Individual Variability in Direction Discrimination
On average, direction discrimination thresholds were found to be similar to previous results (Westheimer and Wehrhahn, 1994). We observed significant differences in discrimination thresholds between subjects (Kruskal–Wallis ANOVA, p < 0.001). Post hoc analysis also revealed similarities in subgroups of subjects, in three subject pairs (see Figure 1C: there was no significant difference between subject 1 and 4, between subject 3 and 11 and between subject 6 and 8). Note that data stem from 11 subjects, as three subjects did not reach reliability criteria explained in Materials and Methods. Slopes of the individual psychometric functions were heterogeneous as well and showed a negative correlation with threshold (the higher the slope, the lower the threshold). The width of subjects 95% CI also differed between subjects. Average RT and RT consistency varied between subjects (max: 460 ms, min: 176 ms, SD: 67 ms, and SD max: 149 ms, SD min 57 ms respectively). RT means or variability did not correlate with individual direction discrimination thresholds.
Pattern Classification is Confounded by Residual Head Motion and Cannot Explain Perceptual Differences
Replicating previous results (Kamitani and Tong, 2006), the linear SVM was able to discriminate between the four motion directions in hMT+ with above chance accuracy (μ = 53 ± 13%, p < 0.002 using permutation testing) in all but one participant (see Figure 2D). Also consistent with previous results, classification accuracy was still higher in V1 (μ = 65 ± 12%, p < 0.001).
To test if individual classification scores in hMT+ or V1 were related to performance on the direction discrimination tasks, a correlation analysis between scores and psychophysical thresholds (t0.5) was performed which showed no significant effect (hMT+: r = 0.15, p = 0.64; V1: r = 0.16, p = 0.64).
To investigate possible reasons for inter-individual differences in classification scores, we looked at its correlation with non-physiological noise of the MR signal. Classification accuracy correlated significantly with variability (SDstim) in the white matter region CR (r = −0.59, p < 0.03, Figure 3D), from which we concluded that the level of global noise determined the differences in decoding success rather than local hMT+ noise.
To test this, we looked at one of the largest methodological contributors to variability in MR signal: head-movement (Friston et al., 1996; Lund et al., 2005). A strong correlation was observed between the SI reflecting stability of the signal and classification accuracy (r = 0.62, p < 0.02, Figure 3B).
This implies that noise induced by subject movement is the predominant cause for differential classification accuracies in subjects. Being this sensitive for head-movement artifacts, PC differences between subjects are unlikely to be a viable method to investigate physiological differences between subjects.
A Generative Model for Assessing BOLD Signal Variability
We used the arithmetic difference between SD of block and rest periods (SDdiff) to look at variability of the MR signal in hMT+ and V1 in individual participants. Being a relative measure, it was assumed to be largely resistant to movement induced artifacts and background scanner noise, as those would influence both periods to the same extend.
Considerably more variability was found in the hMT+ region than in a white matter region (CR), both within stimulus blocks, and rest periods (SD was 30% higher in hMT+ and V1 than in CR). The SDdiff was also found to be larger in hMT+ and V1 than in CR (36%).
Importantly, subjects with a larger noise difference in hMT+ between rest and blocks did not have larger SI scores (r = −0.4810, p = 0.0695) which demonstrates that SDdiff is less affected by head motion.
Variability Patterns in hMT+, but Not V1, Correlate with Direction Sensitivity
In the final analysis, we tested whether inter-individual variability of perceptual performance was correlated with variability characteristics of the hMT+ signal. As can be seen in Figure 4A, we observed a significant correlation between psychophysical threshold and SDdiff: participants with a greater SDdiff showed better behavioral performance (smaller thresholds) compared to participants with a smaller SDdiff (r = −0.61, p < 0.046, bootstrap CI 95% for r: −0.87 to −0.23). In other words, the larger the difference in variability (stimulus block minus rest), the lower the threshold the respective subject achieved. Similar correlation results were found for estimating SDdiff with an alternative model taking into account adaptation effects within blocks (r = −0.59, p < 0.058, bootstrap CI 95% for r: −0.84 to −0.20).
To investigate the specificity of this effect, we also correlated SDdiff in the CR with the psychophysical thresholds which was not significant (r = −0.35, p = 0.29, Figure 4C, lower panel). To test another region involved in direction coding, we correlated SDdiff of V1 with psychophysical thresholds. We did not observe a significant correlation in V1 neither (r = −0.44, p = 0.181, Figure 4C, lower panel).
When the MR-blocks were split into those with stimuli of different directions, the effect remained significant for vertical but not horizontal motion (see Figure 4C, upper panel). Given that the stimulus in the psychophysics experiment were visual flow fields moving vertically upward, this might indicate that we are observing a phenomenon specific for vertical motion. Alternatively, one could interpret this observation as showing a general bias for vertical versus horizontal motion in hMT+. Further studies are necessary to clarify this point.
Eye Movement Analysis
The hMT+ is known to be influenced by eye movements (Dukelow et al., 2001; Acs and Greenlee, 2008). For this reason we instructed subjects to fixate, with which they reported no difficulties. We can not exclude however, that eye movements occurred. To investigate this, we used a retrospective approach to assess, if the signal timecourse of the eyeballs taken from the EPI images correlates with fluctuations in hMT+. In the three subjects analyzed, we did not observe significant correlations of eyeball signal timecourse with fluctuations in area hMT+ (see Figure 5).
Discussion
We demonstrate in the current study that inter-individual differences in performance on a direction discrimination task of visual motion are correlated with signal variability characteristics of hMT+ but not V1. We furthermore show that PC, though being able to decode direction from hMT+ within subjects, is a poor tool to describe inter-individual differences. Assessing individual BOLD signal variability difference in stimulus and rest periods is shown to be a better measure for such comparisons, being less influenced by non-physiological noise.
Differences in psychophysical thresholds between subjects show that perceptual sensitivity for motion direction is variable even within a homogeneous sample. Worse or better perception of motion stimuli in subjects with normal visual acuity has been suggested to reflect changes in higher level visual cortical areas rather than in the peripheral apparatus (Halpern et al., 1999).
Relatively little is known about hMT+’s contribution to worsening of direction perception (Bennett et al., 2007; Billino et al., 2008), although concepts like the “magnocellular theory” behind learning disorders like dyslexia attribute a partial cause of the phenomenon to perceptual malfunctioning in the dorsal visual stream (Stein, 2001). Other authors already suggested that BOLD signal variability over the whole brain (Garrett et al., 2010) or in specific regions like the nucleus accumbens (Samanez-Larkin et al., 2010) might have predictive value for degradation of function during aging. Our method of characterizing signal variability in hMT+ could help the clinical understanding of degraded motion perception in aging or disorders like dyslexia.
Better performance in the psychophysical task suggests higher perceptual sensitivity in that particular participant and thereby most likely more effective processing in the brain. Our results show that variability characteristics in hMT+ but not V1 correlate with psychophysical thresholds. This might indicate that we observe individual differences not at the initial encoding of the visual information in V1, but rather during a more complex motion processing step in hMT+, an area thought to drive perceptual decisions in higher cortical areas.
We find lower thresholds correlating with larger variability differences between stimulus and rest periods which mean higher variability levels in stimulus periods (but see the below discussion on model bias as a limitation to this claim). How could increased random physiological signal be beneficial for the sensitivity of a system? An influential theory based on the phenomenon of stochastic resonance advertises “[...]randomness that makes a non-linearity less detrimental to a signal.” (McDonnell and Abbott, 2009). The theory asserts that a certain level of noise can actually be beneficial for signal transmission. Studies have shown that a certain level of endogenous noise can make synchronized oscillating populations more stable (Ermentrout et al., 2008; Ghosh et al., 2008) and benefits the emergence of fast oscillations in local field potentials (Brunel and Wang, 2003). For us this means that detecting higher levels of endogenous variability in the hMT+ population signal might actually reflect a more robust signal.
Other fMRI and EEG studies have described lower levels of cortical noise in senior subjects (Garrett et al., 2010) and children (McIntosh et al., 2008) compared to young adults. This has been discussed as neurophysiological noise being inversely related to the well described U-shaped function of performance during the lifespan (MacDonald et al., 2006; McIntosh et al., 2008).
More specifically for our case of signal variability in the visual system, Bair et al. (2001), recording single-neurons in macaque MT, describe that those neuron pairs with high signal correlations also showed an increase in the correlation of noise. Clearly, given the coarse MR resolution, correlated noise would be more detectable at the fMRI level than uncorrelated noise. Our results suggest that greater variability differences between stimulus and rest periods might be beneficial for perceptual sensitivity in hMT+. The basis for signal variability could be caused by individual neurophysiological characteristics of hMT+.
A confound that must be considered before interpreting our variability signal is signal fluctuations in hMT+ caused by eye movements. Participants were instructed to fixate, but as we used translation stimuli, an automatic smooth pursuit must have been suppressed which individual subjects might have achieved with more or less success over the timecourse of stimulation. However, we did not find that the signal timecourse from the eyeball ROIs as measured in a subgroup of subjects correlated with hMT+ signal fluctuations. Participants furthermore did not report difficulties fixating. Although we cannot exclude an influence of eye movements on the hMT+ signal, we believe it is not the strongest component causing the observed inter-individual differences in fluctuation of the hMT+ signal.
Also non-perceptual phenomena like individual motivation or attentional levels could explain our results, influencing both physiological and perceptual measurements. It has been shown that hMT+ BOLD signal is modulated by attention (Berman and Colby, 2002; Liu et al., 2011; Stoppel et al., 2011), and those participants able to apply attention most accurately to the stimulus are not only likely to do well in the psychophysics direction discrimination task, but may also show the BOLD signal variability we observe. Top-down control by areas described for internally evoked attention processes like the intraparietal cortex and superior frontal cortex could play a role in inducing the individual hMT+ signal variability we observe (Corbetta and Shulman, 2002).
From the methodological point of view, we demonstrate that PC is a poor method to determine between subject differences. Although it could decode directional information from hMT+ activity in individual subjects, its ability to describe the relative difference between subjects was confounded by individual head-movement and scanner artifact differences. Filtering out movement artifacts has been a challenge in the field of MR, as it contributes the greatest amount of non-physiological noise (Friston et al., 1996; Lund et al., 2005). Although successful methods have been established for reducing the effect of head-movement in univariate analysis based on the general linear model (Friston et al., 1996; Andersson et al., 2001), the specific influence of residual artifacts on new methods like PC is less well documented. Beyond this methodological confound, other evidence exists that classification accuracy may not be an appropriate metric to compare experimental conditions, brain regions, or participants. Smith et al. (2011) for example suggest that classifier performance is influenced by other factors besides neural specificity such as response amplitude. Using MVPA for between subject comparison might therefore require further corrections to guarantee comparability.
Head-movement artifacts can also confound measures of signal variability. Garrett et al. (2010) show that the predictability of a noise measure was greatly improved by the extensive preprocessing of the data, beyond the conventional steps of realignment and normalization. Their methods included artifact correction via independent component analysis (Beckmann and Smith, 2004) and regressing out motion parameters. For future analysis of both PC and BOLD signal variability, this seems to be a fruitful approach. In the current study we used the relative value of noise differences between stimulus and rest periods, which minimizes the movement confound, as both periods should be equally affected by movement.
Critically, all assumptions on signal variability characteristics depend on the validity of our method to estimate the variability in the hMT+ signal. We used a generative model to estimate variability in the fMRI signal, modeling all eight events within a stimulus blocks separately as box-cars convolved with the HRF. The model furthermore accounted for the HRF-induced overlap of stimulus blocks and rest periods by assigning mixing values to each individual volume, based on the estimation of the relative contribution of stimulus and rest periods to the signal in that particular volume. Compared to other methods to assess variability in the BOLD signal, our method is quite complex. Garrett et al. (2010) for example directly calculated the SD over blocks. Considering that the physiological response in hMT+ to our stimulus periods probably consisted of a sustained elevation in BOLD signal, overlaid with single spikes evoked by the eight single events, simply calculating the SD would have not allowed us to separate the endogenous from the stimulus induced variability. The current model is designed to account for the stimulus induced modulation of the BOLD signal, leaving us with the endogenous variability. Certain stimulus induced modulation of the BOLD signal might still not have been accounted for, such as repetition suppression which might occur due to repetitive stimulus display during a block. An alternative model taking this adaptation effect of the signal into account yielded similar results as our initial model. Extending our model to include an adaptation effect therefore seems to have little consequence for our measure of variability.
The model, in its current form, has also important limitations. By using non-uniformly distributed mixing parameters (e.g., the stimulation and rest periods), a bias is introduced as the maximum likelihood estimator assigns more of the variance in the data to the more frequent parameter (the stimulus period). Critically, though, this does not affect their use to compare subjects, as the bias will influence all subjects equally.
Another point to be considered is that the mixing parameter was calculated by convolving the stimulus events with the HRF, while the remaining signal was assumed to stem from the rest periods. Other ways to model the data are conceivable, e.g., convolving both rest and block-periods with the HRF. The ratio or sum of the two could then be used to model the data. Different modeling schemes remain to be explored systematically, to find which best estimates the contributions of the two distributions.
Taking the relative difference as a measure and not absolute variance, we are however confident that we observed physiological differences in hMT+ correlating with perceptional sensitivity. We conclude by suggesting that modeling variability difference between rest and stimulus cycles is a promising method to investigate physiological differences between subjects. We furthermore suggest that perceptual sensitivity in direction discrimination might be associated with noise characteristics in hMT+. This could ultimately help to understand normal and pathological changes in visual motion perception.
Conflict of Interest Statement
The authors declare that the research was conducted in the absence of any commercial or financial relationships that could be construed as a potential conflict of interest.
Acknowledgments
This work was supported by the Deutsche Forschungsgemeinschaft (GRK1091, JA1087/1-1) and the Neuroinformatics and Computational Neuroscience Doctoral Training Centre, School of Informatics, University of Edinburgh. The authors thank Stefan Glasauer for helpful input, all the participants, and the scanning assistants for their support.
Footnotes
References
Acs, F., and Greenlee, M. W. (2008). Connectivity modulation of early visual processing areas during covert and overt tracking tasks. Neuroimage 41, 380–388.
Andersson, J. L., Hutton, C., Ashburner, J., Turner, R., and Friston, K. (2001). Modeling geometric deformations in EPI time series. Neuroimage 13, 903–919.
Bair, W., Zohary, E., and Newsome, W. T. (2001). Correlated firing in macaque visual area MT: time scales and relationship to behavior. J. Neurosci. 21, 1676–1697.
Beckmann, C. F., and Smith, S. M. (2004). Probabilistic independent component analysis for functional magnetic resonance imaging. IEEE Trans. Med. Imaging 23, 137–152.
Bennett, P. J., Sekuler, R., and Sekuler, A. B. (2007). The effects of aging on motion detection and direction identification. Vision Res. 47, 799–809.
Berman, R. A., and Colby, C. L. (2002). Auditory and visual attention modulate motion processing in area MT+. Brain Res. Cogn. Brain Res. 14, 64–74.
Billino, J., Bremmer, F., and Gegenfurtner, K. R. (2008). Differential aging of motion processing mechanisms: evidence against general perceptual decline. Vision Res. 48, 1254–1261.
Born, R. T., and Bradley, D. C. (2005). Structure and function of visual area MT. Annu. Rev. Neurosci. 28, 157–189.
Britten, K. H., Shadlen, M. N., Newsome, W. T., and Movshon, J. A. (1992). The analysis of visual motion: a comparison of neuronal and psychophysical performance. J. Neurosci. 12, 4745–4765.
Brunel, N., and Wang, X. J. (2003). What determines the frequency of fast network oscillations with irregular neural discharges? I. Synaptic dynamics and excitation-inhibition balance. J. Neurophysiol. 90, 415–430.
Castelo-Branco, M., Formisano, E., Backes, W., Zanella, F., Neuenschwander, S., Singer, W., and Goebel, R. (2002). Activity patterns in human motion-sensitive areas depend on the interpretation of global motion. Proc. Natl. Acad. Sci. U.S.A. 99, 13914–13919.
Cohen, M. R., and Newsome, W. T. (2004). What electrical microstimulation has revealed about the neural basis of cognition. Curr. Opin. Neurobiol. 14, 169–177.
Corbetta, M., and Shulman, G. L. (2002). Control of goal-directed and stimulus-driven attention in the brain. Nat. Rev. Neurosci. 3, 201–215.
Dukelow, S. P., DeSouza, J. F., Culham, J. C., van den Berg, A. V., Menon, R. S., and Vilis, T. (2001). Distinguishing subregions of the human MT+ complex using visual fields and pursuit eye movements. J. Neurophysiol. 86, 1991–2000.
Dumoulin, S. O., Bittar, R. G., Kabani, N. J., Baker, C. L., Goualher, G. L., Pike, G. B., and Evans, A. C. (2000). A new anatomical landmark for reliable identification of human area V5/MT: a quantitative analysis of sulcal patterning. Cereb. Cortex 10, 454–463.
Emberson, L., Kitajo, K., and Ward, L. M. (2007). “Endogenous neural noise and stochastic resonance”, in Proceedings SPIE Noise and Fluctuations in Biological, Biophysical, and Biomedical Systems, ed. S. M. Bezrukov Florence, 6602.
Ermentrout, G. B., Galán, R. F., and Urban, N. N. (2008). Reliability, synchrony and noise. Trends Neurosci. 31, 428–434.
Faisal, A. A., Selen, L. P. J., and Wolpert, D. M. (2008). Noise in the nervous system. Nat. Rev. Neurosci. 9, 292–303.
Friston, K. J., Williams, S., Howard, R., Frackowiak, R. S., and Turner, R. (1996). Movement-related effects in fMRI time-series. Magn. Reson. Med. 35, 346–355.
Garrett, D. D., Kovacevic, N., McIntosh, A. R., and Grady, C. L. (2010). Blood oxygen level-dependent signal variability is more than just noise. J. Neurosci. 30, 4914–4921.
Ghosh, A., Rho, Y., McIntosh, A. R., Kötter, R., and Jirsa, V. K. (2008). Noise during rest enables the exploration of the brain’s dynamic repertoire. PLoS Comput. Biol. 4, e1000196. doi: 10.1371/journal.pcbi.1000196
Halpern, S. D., Andrews, T. J., and Purves, D. (1999). Interindividual variation in human visual performance. J. Cogn. Neurosci. 11, 521–534.
Hinds, O. P., Rajendran, N., Polimeni, J. R., Augustinack, J. C., Wiggins, G., Wald, L. L., Rosas, H. D., Potthast, A., Schwartz, E. L., and Fischl, B. (2008). Accurate prediction of V1 location from cortical folds in a surface coordinate system. Neuroimage 39, 1585–1599.
Huk, A. C., Dougherty, R. F., and Heeger, D. J. (2002). Retinotopy and functional subdivision of human areas MT and MST. J. Neurosci. 22, 7195–7205.
Kamitani, Y., and Tong, F. (2006). Decoding seen and attended motion directions from activity in the human visual cortex. Curr. Biol. 16, 1096–1102.
Kanai, R., and Rees, G. (2011). The structural basis of inter-individual differences in human behaviour and cognition. Nat. Rev. Neurosci. 12, 231–242.
Krekelberg, B., van Wezel, R. J. A., and Albright, T. D. (2006). Adaptation in macaque MT reduces perceived speed and improves speed discrimination. J. Neurophysiol. 95, 255–270.
Liang, Z., Yang, Y., Li, G., Zhang, J., Wang, Y., Zhou, Y., and Leventhal, A. G. (2010). Aging affects the direction selectivity of MT cells in rhesus monkeys. Neurobiol. Aging 31, 863–873.
Liu, T., Hospadaruk, L., Zhu, D. C., and Gardner, J. L. (2011). Feature-specific attentional priority signals in human cortex. J. Neurosci. 31, 4484–4495.
Lund, T. E., Nørgaard, M. D., Rostrup, E., Rowe, J. B., and Paulson, O. B. (2005). Motion or activity: their role in intra- and inter-subject variation in fMRI. Neuroimage 26, 960–964.
MacDonald, S. W. S., Nyberg, L., and Bäckman, L. (2006). Intra-individual variability in behavior: links to brain structure, neurotransmission and neuronal activity. Trends Neurosci. 29, 474–480.
Malikovic, A., Amunts, K., Schleicher, A., Mohlberg, H., Eickhoff, S. B., Wilms, M., Palomero-Gallagher, N., Armstrong, E., and Zilles, M. K. (2007). Cytoarchitectonic analysis of the human extrastriate cortex in the region of V5/MT+: a probabilistic, stereotaxic map of area hOc5. Cereb. Cortex 17, 562–574.
McDonnell, M. D., and Abbott, D. (2009). What is stochastic resonance? Definitions, misconceptions, debates, and its relevance to biology. PLoS Comput. Biol. 5, e1000348. doi: 10.1371/journal.pcbi.1000348
McIntosh, A. R., Kovacevic, N., and Itier, R. J. (2008). Increased brain signal variability accompanies lower behavioral variability in development. PLoS Comput. Biol. 4, e1000106. doi: 10.1371/journal.pcbi.1000106
Mennes, M., Zuo, X. N., Kelly, C., Martino, A. D., Zang, Y. F., Biswal, B., Castellanos, F. X., and Milham, M. P. (2011). Linking inter-individual differences in neural activation and behavior to intrinsic brain dynamics. Neuroimage 54, 2950–2959.
Mohr, P. N. C., and Nagel, I. E. (2010). Variability in brain activity as an individual difference measure in neuroscience? J. Neurosci. 30, 7755–7757.
Morrone, M. C., Tosetti, M., Montanaro, D., Fiorentini, A., Cioni, G., and Burr, D. C. (2000). A cortical area that responds specifically to optic flow, revealed by fMRI. Nat. Neurosci. 3, 1322–1328.
Muckli, L., Kriegeskorte, N., Lanfermann, H., Zanella, F. E., Singer, W., and Goebel, R. (2002). Apparent motion: event-related functional magnetic resonance imaging of perceptual switches and states. J. Neurosci. 22, RC219.
Muckli, L., Naumer, M. J., and Singer, W. (2009). Bilateral visual field maps in a patient with only one hemisphere. Proc. Natl. Acad. Sci. U.S.A. 106, 13034–13039.
Oldfield, R. C. (1971). The assessment and analysis of handedness: the Edinburgh inventory. Neuropsychologia 9, 97–113.
Pereira, F., Mitchell, T., and Botvinick, M. (2009). Machine learning classifiers and fMRI: a tutorial overview. Neuroimage 45, S199–:S209.
Petersen, S. E., Baker, J. F., and Allman, J. M. (1985). Direction-specific adaptation in area MT of the owl monkey. Brain Res. 346, 146–150.
Purushothaman, G., and Bradley, D. C. (2005). Neural population code for fine perceptual decisions in area MT. Nat. Neurosci. 8, 99–106.
Rostrup, E., Law, I., Blinkenberg, M., Larsson, H. B., Born, A. P., Holm, S., and Paulson, O. B. (2000). Regional differences in the CBF and BOLD responses to hypercapnia: a combined PET and fMRI study. Neuroimage 11, 87–97.
Samanez-Larkin, G. R., Kuhnen, C. M., Yoo, D. J., and Knutson, B. (2010). Variability in nucleus accumbens activity mediates age-related suboptimal financial risk taking. J. Neurosci. 30, 1426–1434.
Slaghuis, W. L., and Ryan, J. F. (2006). Directional motion contrast sensitivity in developmental dyslexia. Vision Res. 46, 3291–3303.
Smith, A. T., Kosillo, P., and Williams, A. L. (2011). The confounding effect of response amplitude on MVPA performance measures. Neuroimage 56, 525–530.
Stoppel, C. M., Boehler, C. N., Strumpf, H., Heinze, H. J., Noesselt, T., Hopf, J. M., and Schoenfeld, M. A. (2011). Feature-based attention modulates direction-selective hemodynamic activity within human MT. Hum. Brain Mapp. doi: 10.1002/hbm.21180. [Epub ahead of print].
Talcott, J. B., Hansen, P. C., Assoku, E. L., and Stein, J. F. (2000). Visual motion sensitivity in dyslexia: evidence for temporal and energy integration deficits. Neuropsychologia 38, 935–943.
Watson, A. B., and Pelli, D. G. (1983). QUEST: a Bayesian adaptive psychometric method. Percept. Psychophys. 33, 113–120.
Westheimer, G., and Wehrhahn, C. (1994). Discrimination of direction of motion in human vision. J. Neurophysiol. 71, 33–37.
Wichmann, F. A., and Hill, N. J. (2001a). The psychometric function: II. Bootstrap-based confidence intervals and sampling. Percept. Psychophys. 63, 1314–1329.
Wichmann, F. A., and Hill, N. J. (2001b). The psychometric function: I. Fitting, sampling, and goodness of fit. Percept. Psychophys. 63, 1293–1313.
Winterer, G., Musso, F., Vucurevic, G., Stoeter, P., Konrad, A., Seker, B., Gallinat, J., Dahmen, N., and Weinberger, D. R. (2006). COMT genotype predicts BOLD signal and noise characteristics in prefrontal circuits. Neuroimage 32, 1722–1732.
Keywords: inter-individual differences, motion perception, direction sensitivity, hMT+/V5, fMRI, BOLD signal variability, multi-voxel pattern classification
Citation: Wutte MG, Smith MT, Flanagin VL and Wolbers T (2011) Physiological signal variability in hMT+ reflects performance on a direction discrimination task. Front. Psychology 2:185. doi: 10.3389/fpsyg.2011.00185
Received: 17 January 2011;
Accepted: 21 July 2011;
Published online: 02 August 2011.
Edited by:
Guillaume A. Rousselet, University of Glasgow, UKCopyright: © 2011 Wutte, Smith, Flanagin and Wolbers. This is an open-access article subject to a non-exclusive license between the authors and Frontiers Media SA, which permits use, distribution and reproduction in other forums, provided the original authors and source are credited and other Frontiers conditions are complied with.
*Correspondence: Magdalena G. Wutte, Department of Neurology, Klinikum Großhadern, Ludwig-Maximilians-University, Marchioninistrasse 23, 81377 Munich, Germany. e-mail: mwutte@lrz.uni-muenchen.de