
- 1 Division Neuropsychology, Psychological Institute, University of Zurich, Zurich, Switzerland
- 2 Geneva Neuroscience Center, University of Geneva, Geneva, Switzerland
- 3 Faculty of Psychology and Educational Sciences, University of Geneva, Geneva, Switzerland
Past research has shown that musical training induces changes in the processing of supra-segmental aspects of speech, such as pitch and prosody. The aim of the present study was to determine whether musical expertise also leads to an altered neurophysiological processing of sub-segmental information available in the speech signal, in particular the voice-onset-time. Using high-density EEG-recordings we analyzed the neurophysiological responses to voiced and unvoiced consonant-vowel-syllables and noise-analogs in 26 German speaking adult musicians and non-musicians. From the EEG the N1 amplitude of the event-related potential and two microstates from the topographical EEG analysis (one around the N1 amplitude and one immediately preceding the N1 microstate) were calculated to the different stimuli. Similar to earlier studies the N1 amplitude was different to voiced and unvoiced stimuli in non-musicians with larger amplitudes to voiced stimuli. The more refined microstate analysis revealed that the microstate within the N1 time window was shorter to unvoiced stimuli in non-musicians. For musicians there was no difference for the N1 amplitudes and the corresponding microstates between voiced and unvoiced stimuli. In addition, there was a longer very early microstate preceding the microstate at the N1 time window to non-speech stimuli only in musicians. Taken together, our findings suggest that musicians process unvoiced stimuli (irrespective whether these stimuli are speech or non-speech stimuli) differently than controls. We propose that musicians utilize the same network to analyze unvoiced stimuli as for the analysis of voiced stimuli. As a further explanation it is also possible that musicians devote more neurophysiological resources into the analysis of unvoiced segments.
Introduction
The past 15 years have seen a vast amount of research on music and associated neural processes. One of the most prominent findings is that the intensive practice and training needed to achieve high proficiency in musicianship leads to structural and functional short and long-term alterations in the brain (for a review, see Schlaug, 2001; Münte et al., 2002; Jäncke, 2009). Researchers have therefore become increasingly aware of the value of musicianship as a model for brain plasticity. In view of this, the question arises whether these music-training induced plasticity effects are restricted particularly to structures and functions underlying the perception and production of music or are more widespread in affecting also other domains such as language and speech.
A number of recent studies indicate that the language network is affected by plastic alterations due to musical training (e.g., Thompson et al., 2003; Schön et al., 2004; Moreno and Besson, 2006; Besson et al., 2007; Marques et al., 2007; Parbery-Clark et al., 2009; Gordon et al., 2010; Marie et al., 2010a,b; Colombo et al., 2011). However, most of these studies focused on pitch processing and prosody, nonetheless showing a substantial transfer effect of intensive musical training on auditory language functions. Efficient analysis of spectral acoustic information in the speech signal is indeed crucial for auditory language perception, but the same is true for temporal cues (Shannon et al., 1995; Davis and Johnsrude, 2007). As musical training involves melodic, supra-segmental and subtle timing issues, the processing of rapidly changing temporal cues in the speech signal and the underlying neural substrates may also be altered in musicians. Studies which have examined musicians and non-musicians in terms of their ability to discriminate segmental phonetic cues mainly focused on the spectral domain and generally have revealed negative results. For example, Hillenbrand et al. (1990) have demonstrated that musicians are not faster or even better in discriminating synthetic speech sounds. A similar finding has been provided by Marie et al. (2010a), who examined whether musical expertise has an effect on the discrimination of tonal and segmental variations in tone language. In addition, they measured event-related potentials (ERPs) and identified that musical expertise did not influence segmental processing as indicated by the amplitudes and latencies of early components like the N1. These authors, however, demonstrated strong influences of musical expertise on the later occurring “cognitive” ERP components (N2, P3a, and P3b).
Anyhow, the speech signal carries not only rapidly changing spectral, but also temporal information on a segmental level. Musical training on the other hand, includes practising the perception of rhythm, meter, and subtle timing issues. Thus, it might be the case that when focusing on the temporal domain, musicians and non-musicians actually do differ with respect to the processing of segmental phonetic cues. One of the most important temporal acoustic cues carrying linguistically and phonetically relevant information is the voice-onset-time (VOT). This mainly refers to voicing differences between stop-consonants in a broad range of languages. VOT is defined as the duration of the delay between release of closure and start of voicing (Lisker and Abramson, 1964). Electrophysiological studies have consistently demonstrated VOT-related auditory evoked potential (AEP) differences in the N1 component in humans and animals (e.g., Sharma and Dorman, 1999; Steinschneider et al., 1999, 2005; Sharma et al., 2000; Trébuchon-Da Fonseca et al., 2005; Zaehle et al., 2007). The N1 component is considered to be particularly important in reflecting the basic encoding of acoustic information of the auditory cortex (Näätänen and Picton, 1987; Picton et al., 1987). Moreover, it has been shown that the electrophysiologic patterns elicited by the processing of consonant-vowel (CV) syllables and corresponding non-speech sounds with similar temporal characteristics are comparable in humans (Liégeois-Chauvel et al., 1999; Zaehle et al., 2007). This indicates a general mechanism for encoding and analyzing successive temporal changes in acoustic signals. Modulations of the N1 component reflect the central auditory representation of speech and non-speech sounds (Ostroff et al., 1998; Sharma et al., 2000; Meyer et al., 2006; Pratt et al., 2007). The present study thus aimed to examine potential differences between musicians and non-musicians in the processing of changing temporal acoustic cues. This was done by recording and comparing scalp AEP’s in response to CV-syllables and corresponding noise-analogs with varying VOT’s and noise-onset times (NOT), respectively. Based on the findings of Zaehle et al. (2007), which clearly demonstrate that the AEP’s N1 component is especially responsive to temporal variations in speech and non-speech stimuli, we focused our (“classical”) AEP analysis on amplitude modulations at the vertex electrode in the N1 time window. These modulations were elicited by brief auditory stimuli that varied systematically along an acoustic and a linguistic dimension.
We hypothesized that within the non-musicians group we would find stronger N1 amplitudes for stimuli with short (voiced) compared to long (unvoiced) VOT’s/NOT’s, as this has previously been shown by Zaehle et al. (2007) and various others (e.g., Simos et al., 1998; Sharma et al., 2000; Steinschneider et al., 2005). On the other hand, if musical expertise has an influence on early phonetic processing in the temporal domain, then musicians should show a different pattern in the corresponding neurophysiological indicators of early phonetic processing within the time window of the N1.
In order to reveal potential differences between musicians and non-musicians in distinct stages of information processing of VOT’s/NOT’s, we also analyzed the spatial variations of the scalp voltage distribution over time between conditions and groups, an approach known as Topographic Pattern Analysis or evoked potential (EP) mapping. This method searches for time segments of stable map topography that represents functional microstates of the brain. These are assumed to reflect distinct information processing steps and provide several advantages over the classical ERP analysis, such as experimenter and reference independence (for an overview, see, e.g., Murray et al., 2008; Michel et al., 2009). This kind of analysis benefits mostly from the high topographic resolution that high-density EEG-recordings provide. Using this approach, we searched for stable map topographies before, during, and after the N1 time window. Here, we are interested in examining whether the duration of these maps are different between musicians and non-musicians.
Materials and Methods
Subjects
Thirty-one healthy volunteers with no history of neurological pathology and with normal audiological status participated in this study. All participants were native German or Swiss German speakers. One group consisted of 16 musicians (11 women, 5 men, mean age ± SD of 26.7 ± 10.1 years), with formal training starting at a mean age of 6.02 ± 2.2 years. All musicians were students, music teachers and/or members of an orchestra/band and practiced their instrument daily for 1–6 h. Most of them play several instruments of which the most frequent were piano, violin, and clarinet. The other group comprised 15 non-musicians (11 women, 4 men, mean age ± SD of 26.07 ± 7.9 years) with no formal musical training and no history of musical instrumental performance. According to the Annett-Handedness-Questionnaire (Annett, 1970), 13 participants within the musician group were consistently right-handed, whereas two were ambidextrous and one was left-handed. In the non-musician group, 11 participants were consistent right-handers, one was ambidextrous and three were left-handed. In order to determine each participant’s degree of musical competence, the “Advanced Measures of Music Audiation” by Gordon (1989) was applied. All participants performed also a short intelligence test (KAI) to rule out significant differences in intelligence between groups. Descriptive statistics for the criterion measures completed by the participants are summarized in Table 1. All participants gave informed written consent, in accordance with procedures approved by the local ethics committee, and were paid for participation.
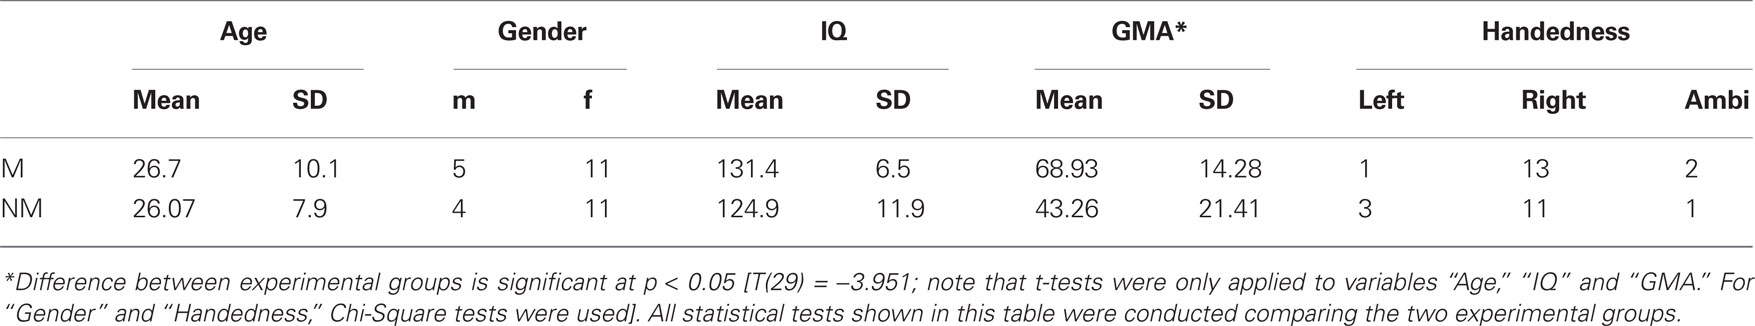
Table 1. Descriptive statistics for the criterion measures completed by the subjects are listed group-wise (M = musicians; NM = non-musicians; GMA = Gordon musical aptitude).
Stimuli
All participants heard two different classes of auditory stimuli in the context of a phonetic categorization task. One class formed the “speech condition” consisting of the same CV-syllables used in previous studies, such as Jäncke et al. (2002) and Meyer et al. (2007). These syllables (/ka/,/ta/,/pa/,/ga/,/da/,/ba/) were digitally recorded by a trained phonetician at a sampling rate of 44.1 kHz and a sampling depth of 16-bit. The onset, duration, intensity, and fundamental frequency of the stimuli were edited and synchronized by means of a speech editor. The criterion for temporal alignment of the syllables was the onset of articulatory release. The duration of the syllables ranged from 310 to 360 ms, depending on the VOT, with a vowel duration of 300 ms (VOTs in ms for the stops were approximately “k” = 59, “t” = 49, “p” = 39, “g” = 19, “d” = 04, “b” = 09). The second class, forming the “non-speech condition,” consisted of noise-analogs, which were synthesized from the CV-syllables used in the speech condition. This was achieved using a variation of a formerly published procedure (Shannon et al., 1995). Thus, spectral information was removed from the syllables by replacing the frequency specific information in a broad frequency region with band-limited white noise (Band 1: 500–1500 Hz, Band 2: 2500–3500 Hz) whereas normalized amplitudes and temporal cues were preserved in each spectral band, resulting in double-band-pass filtered noise with temporal CV-amplitude dynamics. Thus, these stimuli are devoid of any phonological, semantic, and syntactic cues but imitate the temporal envelope of proper speech signals (syllables, words, or sentences).
This non-speech condition was introduced in a non-task-relevant manner to reassess whether any found differences are due to different VOT processing and not to other varying characteristics between the speech stimuli. Figure 1 shows both the speech and non-speech waveforms of the syllables “pa” and “ba” as an example of the stimuli used in the present study. All manipulations were carried out with the “Adobe Audition 1.5” software (Adobe Systems Incorporated, 1992–2004). All auditory stimuli were presented binaurally at a sound pressure level of about 70 dB using hi-fi headphones. Stimuli were presented and responses recorded using Presentation® software (Neurobehavioral Systems, USA).
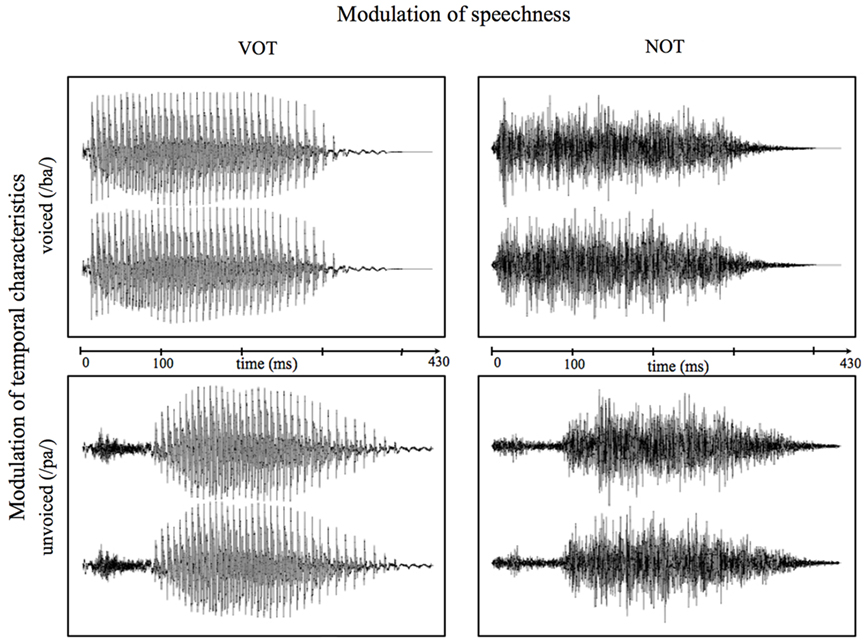
Figure 1. Exemplary waveforms of voiced (/ba/; top) and unvoiced (/pa/; bottom) speech (left) and correspondent non-speech (right) stimuli. Time point “0” refers to the stimulus onset.
Procedure
The EEG experiment comprised four blocks per condition (i.e., “speech” and “non-speech”), resulting in a total of eight blocks and an overall duration of the experiment of about 60 min. Each block contained 42 trials of each stimulus, thus presenting 252 stimuli per block and a total amount of 168 presentations per stimulus. In both conditions, stimuli were shuffled in a pseudo-randomized order. The condition order was randomized for every subject. Stimuli were of two different categories, assigned either “voiced” or “unvoiced,” depending on their particular VOT (“voiced” = /ga/,/da/,/ba/and corresponding noise-analogs; “unvoiced” = /ka/,/ta/,/pa/and corresponding noise-analogs). Participants were seated in a comfortable chair in an electrically shielded, dimly lit room, and were instructed to listen attentively to the auditory stimuli presented via headphones. They had to decide as quickly and accurately as possible whether the heard stimulus was of type “voiced” or “unvoiced,” and to indicate their response by pressing either the left or right mouse button. We utilized this task to ensure the participant’s vigilance throughout the experiment, even though it has previously been shown (Baumann et al., 2008) that an enhancement of N1 amplitudes in musicians rather reflects an influence of expertise than selective attention. In order to ensure that participants could solve the task as instructed, each participant performed practice trials before the experiment until complete comprehension of the task was reported. As each stimulus was presented 500 ms after the preceding mouse button press, the inter-stimulus interval depended mainly on the speed of the participant’s response. When no response occurred, the next stimulus was presented automatically after 2 s.
AEP Recordings
Electroencephalogram was recorded using a high-density Geodesic EEG system® (GSN300; Electrical Geodesic Inc., Oregon)1 with 128-Channel HydroCel Geodesic Sensor Nets@ (HCGSN120). Data was sampled at 250 Hz and band-pass filtered at 0.1–100 Hz. The vertex electrode (Cz) served as on-line recording reference. Impedance was kept below 30 kΩ. For various reasons, such as violations of attendance criteria regarding age or technical problems during EEG recording, behavioral and EEG data of five participants (three musicians and two non-musicians) were discarded from further analysis, leading to a total of 26 remaining datasets (13 per group).
Data Analysis – Behavioral Data
The number of correct identifications, errors, and misses in each block was counted within the two groups (musicians vs. non-musicians) and averaged for each subject across blocks, categories (i.e., “voiced” vs. “unvoiced”), and classes (i.e., “speech” vs. “non speech”). The same procedure was carried out with reaction times (RT), which were analyzed for correct identifications only. Thus, a 2 × 2 × 2 repeated measure analysis of variance (ANOVA) with factors group (between-subject), voiceness, and speechness (within-subject) was computed for each of these variables in order to statistically evaluate any differences in identification accuracy and RT’s.
Data Analysis – EEG, N1 Component Analysis
Electroencephalogram recordings of each participant were imported and analyzed in the BrainVision Analyzer2 software (Version 2.0.1; Brain Products GmbH, D-82205 Gilching)2. In a first step, data was band-pass filtered at 1.5–70 Hz and a 50-Hz notch filter was applied. An ICA (independent component analysis) was then performed to correct for ocular artifacts (e.g., Jung et al., 2000). Each EEG recording was visually inspected and trials with sweating and muscle artifacts, amplifier saturation, and remaining eye blinks or eye movements were excluded. Noisy channels were interpolated and the data was then re-referenced to the mastoid electrodes for ERP calculation. Each ERP waveform was an average of more than 100 repetitions of the EEG sweeps evoked by the same stimulus type. EEG-recordings were sectioned into 500 ms segments (100 ms pre-stimulus and 400 ms post-stimulus) and a baseline correction using the signal’s pre-stimulus portion was carried out. Finally, ERP’s for each stimulus were averaged for each subject and grand-averaged across subjects within the two groups separately. Had peak values of grand-averages been used for statistical analysis, differences between experimental groups in the N1 peak values might have been blurred during averaging due to individual differences in their latencies. Therefore, grand-average waves were used only to reassess the N1 time window and for illustrative purposes.
In order to statistically confirm relevant differences between AEP’s at Cz as a function of experimental group, stimulus category and condition, mean amplitude ERP’s time-locked to the auditory stimulation were therefore measured in a specific latency window. This was individually pre-determined for each subject and stimulus by visual inspection of the event-related signal. These individual latency windows were centered at the peak of the prominent N1 component and covered a total signal length of 20 ms around the center. Individually chosen latency windows were used to ensure that the mean amplitude actually reflect the N1 peak values of every subject and stimulus. Mean amplitudes were then averaged separately within groups (i.e., “musicians” vs. “non-musicians”), depending on their category (i.e., “voiced” vs. “unvoiced”), and class (i.e., “speech” vs. “non-speech”). Subsequently, a 2 × 2 × 2 repeated measure ANOVA with a between-subject factor (group) and two within-subjects factors (speechness and voiceness) was computed for the central electrode (Cz), and the reported p-values were adjusted for non-sphericity using Greenhouse–Geisser Epsilon when equal variances could not be assumed. Subsequently, Bonferroni–Holm adjusted post hoc t-tests were applied. The global level of significance was set at p < 0.05 for all statistical analyses.
Data Analysis – EEG, Topographic Pattern Analysis
Topographic Pattern Analysis was performed using the Cartool software (Version 3.43/869; The Cartool Community group)3. Subject- and grand-averaged ERP’s were imported into Cartool and recalculated against the average reference. To identify the dominant map topographies on the scalp, segments of stable voltage topography (or EP maps) were then defined by using a topographic atomize and agglomerate hierarchical cluster analysis (T-AAHC) in the grand-averaged ERP’s across conditions and groups over the full post-stimulus EEG segment length of 400 ms. These template maps are the mean maps over the period where the stable voltage topography segments were found. The optimal number of templates was determined by the combination of a modified cross-validation and the Krzanowski–Lai criterion (e.g., Pascual-Marqui et al., 1995; Murray et al., 2008). In order to assess any differences regarding map duration between groups and conditions in and around the N1 time window (i.e., 50–200 ms), the presence of each map that was identified in the group-averaged data within that particular epoch was verified statistically over the same period in the ERP’s of the individual participants (i.e., “single-subject fitting”; Murray et al., 2008). This step allowed us to determine the duration of any given template map for each condition within the musician’s and control’s group between 50 and 200 ms. This time window was accordingly chosen to encompass the N1 time window itself plus the periods immediately before and after it. These duration values were then statistically evaluated for each map of interest by means of a repeated measures ANOVA with the factors group (between-subjects), speechness, and voiceness (within-subjects), as in the classical N1 component analysis. Subsequently, any significant interactions were further examined by applying post hoc t-tests.
Results
Behavioral Data
We analyzed accuracy and RT using 2 × 2 × 2 ANOVAs with one between-subjects factor (group: musicians vs. non-musicians) and two repeated measurement factors (voiceness: voiced vs. unvoiced; speechness: speech vs. non-speech). With regard to accuracy, significant main effects for voiceness [F(1, 24) = 6.096, p < 0.05] and speechness [F(1, 24) = 6.742, p < 0.05] were found with higher accuracies for speech stimuli in general. Furthermore, there was a significant voiceness by speechness [F(1, 24) = 1.217, p < 0.05] interaction characterized by higher accuracies for voiced than unvoiced non-speech stimuli [T(25) = 5.296, p < 0.05] and for unvoiced speech than unvoiced non-speech stimuli [T(25) = 3.929, p < 0.05]. There were no significant differences between groups neither for the main effects nor the interactions. With respect to RT, neither significant main nor interaction effects were found in the 2 × 2 × 2 ANOVA of speech and non-speech stimuli. Mean reaction times for the two experimental groups are shown in Figure 2A. Figure 2B shows overall accuracies irrespective of group. Note that only RT of correct answers were analyzed.
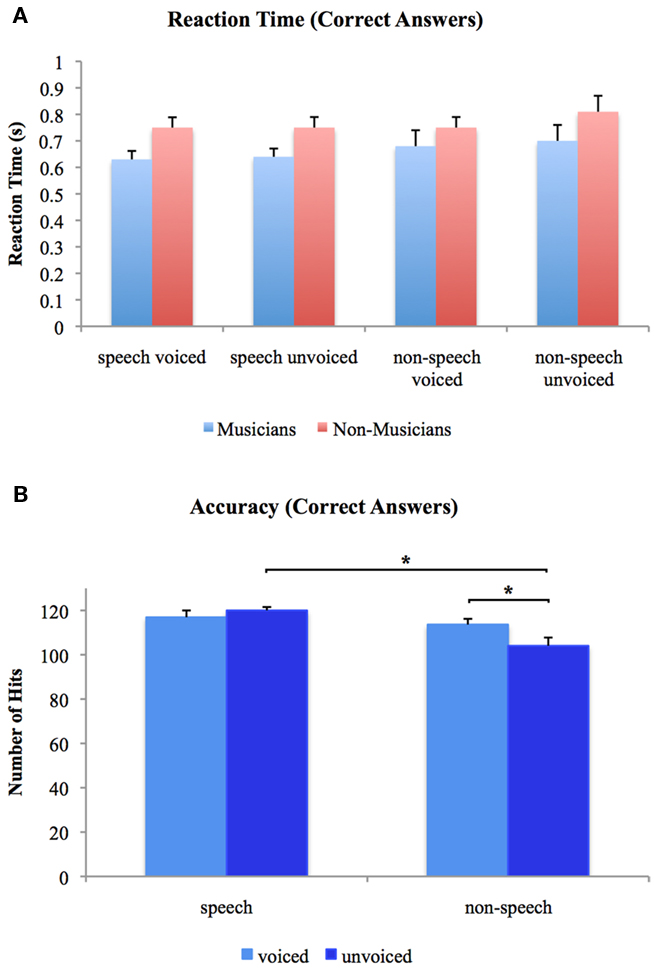
Figure 2. (A) Reaction times to voiced and unvoiced speech and non-speech stimuli for musicians and non-musicians. (B) Overall accuracies for voiced and unvoiced speech and non-speech stimuli. *Differences are significant at p < 0.05 [differences between stimulus class (i.e., “speech” vs. “non-speech”) and stimulus type (i.e., “voiced” vs. “unvoiced”) irrespective of experimental group (i.e., “musicians” vs. “non-musicians”), T(25) = 5.296 and T(25) = 3.929, respectively]. Error bars indicate standard errors.
EEG Data – N1 Component Analysis
Grand-averaged waveforms evoked by each category and class of stimuli recorded at Cz are shown in Figure 3 for the speech and in Figure 4 for the non-speech condition, respectively. We observed that all stimuli elicited a prominent N1 component. In the non-musician group, the strongest N1 amplitudes were found for stimuli with short VOT’s (i.e., “voiced” stimuli), thus replicating the results of Zaehle et al. (2007) and various others (e.g., Simos et al., 1998; Sharma et al., 2000). However, in the musician group, no difference between N1 amplitudes was revealed. In order to statistically examine the ERP effects, mean amplitudes of each stimulus category (i.e., “voiced” vs. “unvoiced”) and class (i.e., “speech” vs. “non-speech”) were analyzed for each subject in a 20-ms latency window around the N1 peaks.
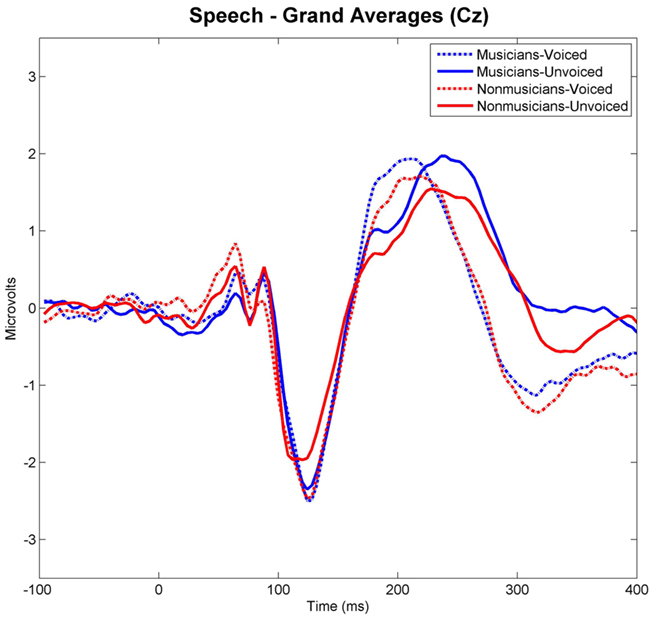
Figure 3. Grand-averaged waveforms elicited by voiced and unvoiced speech stimuli. Time point “0” refers to the stimulus onset.
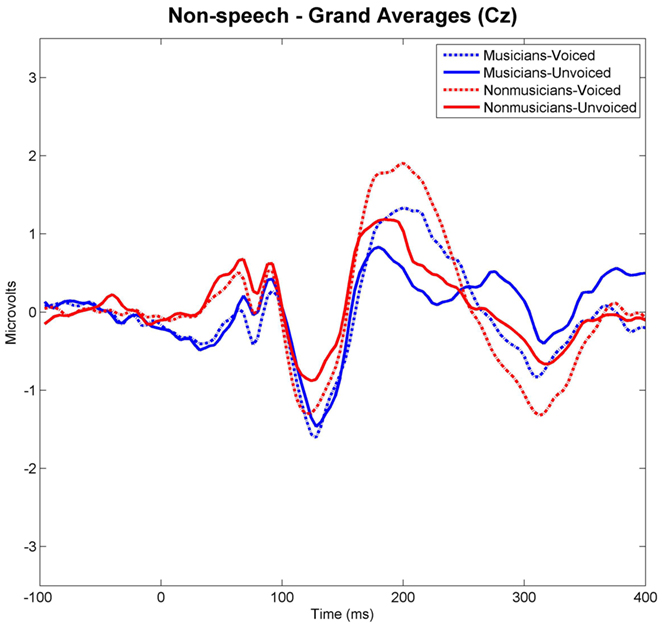
Figure 4. Grand-averaged waveforms elicited by voiced and unvoiced non-speech stimuli. Time point “0” refers to the stimulus onset.
Results of the 2 × 2 × 2 repeated measures ANOVA with the factors group (musicians vs. non-musicians), voiceness (voiced vs. unvoiced), and speechness (speech vs. non-speech) for the N1 amplitudes showed significant main effects for the factors voiceness [F(1, 24) = 4.733, p < 0.05] and speechness [F(1, 24) = 29.33, p < 0.05]. In addition, a significant group by voiceness interaction was revealed [F(1, 24) = 6.209, p < 0.05].
Separate post hoc analyses were conducted for the two experimental groups, using Bonferroni–Holm adjusted t-tests and accepting therefore differences as significant only when the corresponding p-values were below the adjusted significance-level. Figures 3 and 4 show group-wise plots of the mean amplitudes recorded at Cz for each stimulus category. Figure 5 shows the corresponding results of post hoc t-tests collapsed for both the speech and non-speech condition (i.e., speech and non-speech stimuli are treated as one class). In the non-musician group, separate t-tests revealed significantly stronger N1 potentials elicited by voiced than by unvoiced stimuli [T(12) = −3.480, p < 0.05]. In contrast, neither significant differences were found within the musician group nor between groups. Moreover, N1 amplitudes elicited by speech were stronger in general than those elicited by non-speech [T(25) = 5.446, p < 0.05].
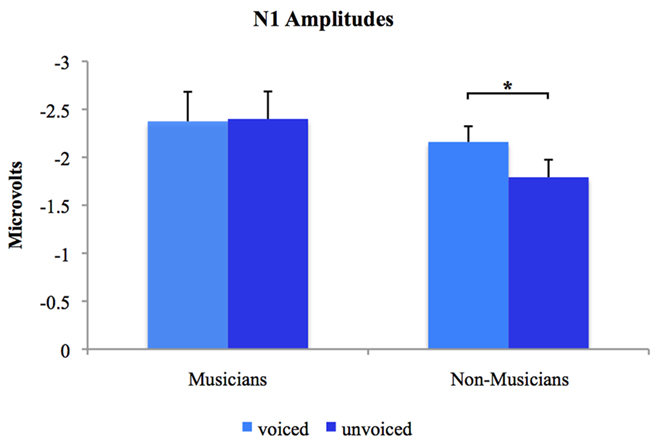
Figure 5. Group-wise plots of N1 mean amplitudes for voiced and unvoiced stimuli. Speech and non-speech conditions are collapsed. *Difference is significant at p < 0.05 [difference between stimulus type (i.e., “voiced” vs. “unvoiced”) irrespective of stimulus class (i.e., “speech” vs. “non-speech”) within the non-musician group, T(12) = −3.480]. Error bars indicate standard errors.
EEG Data – Topographic Pattern Analysis
Figure 6 shows the results of the topographical EP mapping of the grand-averaged data for each group and condition. In order to provide consistency with the examination of the classical N1 component, we first inspected visually the resulting template maps in and around the N1 time window (50–200 ms). Subsequently, we restricted our further analyses to the one template map, which expressed a typical N1-like auditory topography (map 6) and those which appeared immediately before and after that map (maps 3 and 7). Durations of these maps were then extracted and compared by means of a repeated measure ANOVA.
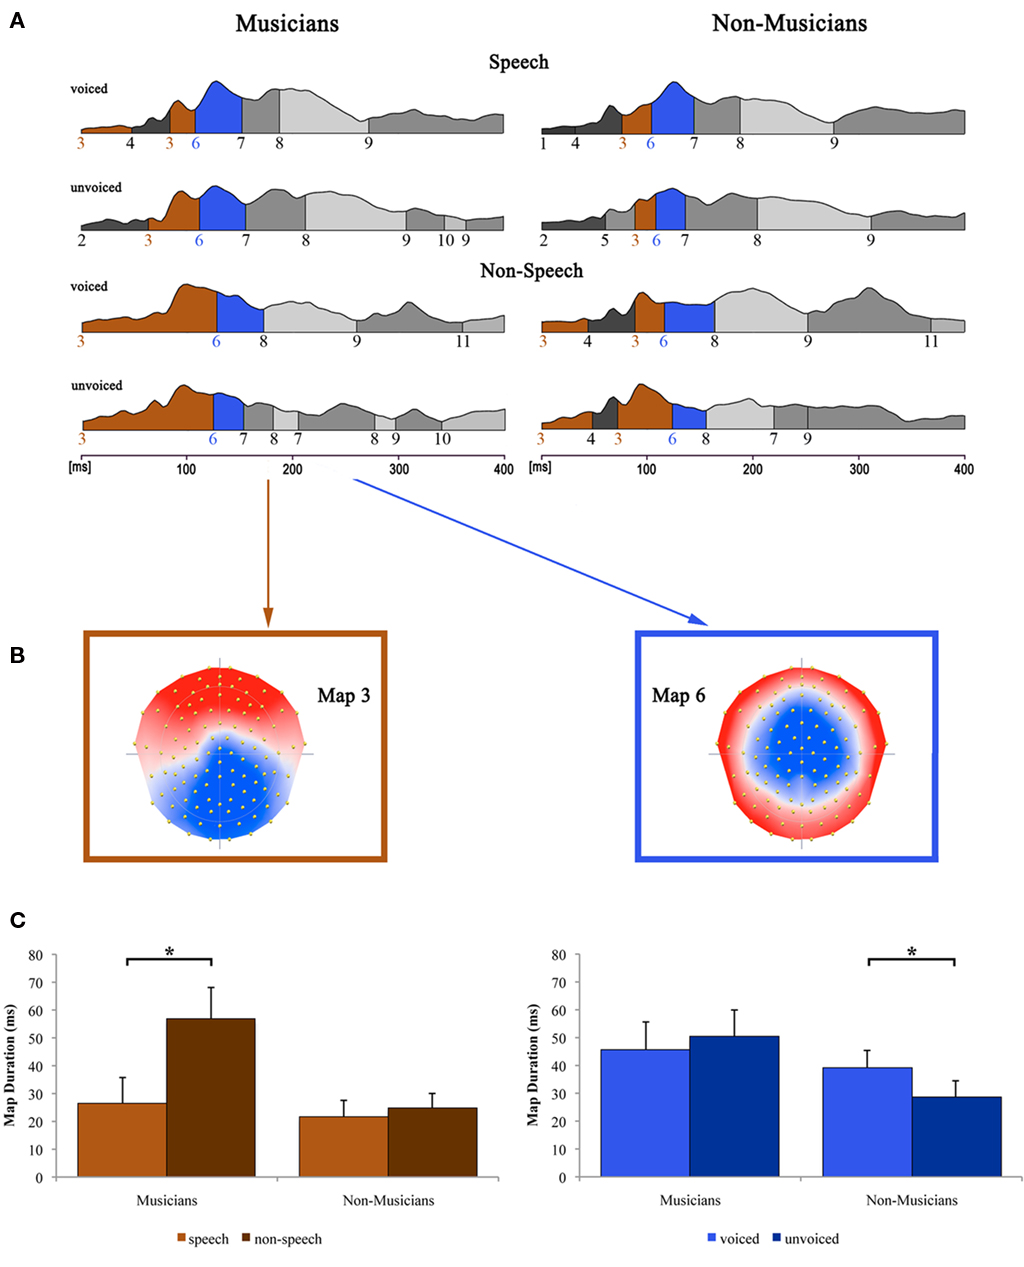
Figure 6. Evoked potential data. (A) Segments of stable map topography are shown group-wise (left: musicians, right: non-musicians) for each condition under the global field power curve from 0 to 400 ms. Auditory N1-like template map 6 (blue) was found at ∼100 ms and was significantly longer for voiced than for unvoiced stimuli within the non-musicians group whereas within the musicians group, durations were comparable. Template map 3 (brown) preceded map 6 and lasted significantly longer in the non-speech condition compared to the speech condition within the musicians group only. (B) Map topography and (C) duration of maps 3 (left) and 6 (right) for musicians and non-musicians in the respective conditions (voiced and unvoiced stimuli are collapsed for map 3; speech and non-speech conditions are collapsed for map 6). *Difference is significant at p < 0.05 [left: Difference between stimulus class (i.e., “speech” vs. “non-speech”) irrespective of stimulus type (i.e., “voiced” vs. “unvoiced”) within the musician group, T(12) = −3.582; right: Difference between stimulus type irrespective of stimulus class within the non-musician group, T(12) = 2.533]. Note that the data shown in (A,B) are derived of grand-averaged waveforms, whereas map durations shown in (C) are obtained from individual ERPs (for a detailed description of the microstate analysis procedure see, e.g., Murray et al., 2008). Error bars indicate standard errors.
Results of the 2 × 2 × 2 repeated measure ANOVA with between subjects factor group and within-subjects factors speechness and voiceness showed significant main effects for the factor speechness regarding the durations of map 3 [F(1, 24) = 10.046, p < 0.05] and map 7 [F(1, 24) = 5.139, p < 0.05]. Furthermore, a significant speechness by group interaction was found for map 3 [F(1, 24) = 6.684, p < 0.05], whereas map 6 exhibited a significant voiceness by group interaction [F(1, 24) = 5.933, p < 0.05].
Subsequent post hoc Bonferroni–Holm adjusted t-tests revealed significant differences regarding the duration of map 3 between speech and non-speech stimuli [T(12) = −3.582, p < 0.05] within the musician group. In particular, map 3 was longer for musicians in the non-speech condition. Non-musicians on the other hand showed similar durations for map 3 in both conditions.
The topography of map 6 strongly resembles the typical auditory N1 topography. Post hoc t-tests for the durations of this microstate revealed significantly longer durations for voiced than for unvoiced stimuli within the non-musicians group [T(12) = 2.533, p < 0.05]. Within the musicians group, no significant difference in the duration of map 6 was found at all.
Discussion
The purpose of this study was to examine the extent to which musicians and non-musicians process phonetic information differently. We were specifically interested in the early processing steps within the first 200 ms of stimulus onset during which the basic acoustic properties of acoustic stimuli are processed. Our hypothesis was that musical practice would have shaped the auditory system of musicians and that this use-dependent influence might also exert its influence on early phoneme perception. We anticipated therefore different neurophysiological activation patterns during early auditory processing stages.
For this study we used speech and non-speech stimuli with short (voiced) and long (voiceless) VOT. High-density EEG-recordings were obtained during the early acoustic processing stages and analyzed in two different ways: Firstly we calculated and analyzed conventional AEP components and focused on the N1 component, which is particularly important for auditory analysis (e.g., Sharma and Dorman, 1999; Steinschneider et al., 1999, 2005; Sharma et al., 2000; Zaehle et al., 2007). In addition to the conventional ERP analysis we also applied a topographic pattern analysis. With this method we exploit the entire spatial information of our high-density EEG recording and reveal a more detailed activation pattern. Using this approach we focused on microstates around the N1 time window. Microstates are identified in an entirely data-driven approach, which substantially decreases the subjective influence on the data analysis. Thus, this method can be considered a more objective method to analyze evoked electrical responses (Michel et al., 2009).
As in various aforementioned studies (e.g., Sharma et al., 2000; Zaehle et al., 2007), the N1 amplitude is different to voiced and unvoiced acoustic stimuli in non-musicians. In particular, the N1 is larger for voiced than for unvoiced stimuli. Musicians on the other hand demonstrated large N1 amplitudes to all stimuli with no difference between voiced and unvoiced stimuli. Correspondingly, for non-musicians the microstate durations around the N1 time window are significantly shorter for unvoiced stimuli irrespective of whether these stimuli are “speech” or “non-speech.” In addition, there is no difference between the microstate durations for musicians.
The findings with respect to the N1 amplitude and the corresponding microstate supports the idea that non-musicians process voiced and unvoiced stimuli differently and utilize different neurophysiological processes at least at processing stages around the N1 component. Simos et al. (1998) found the N1m peak equivalent current dipole (ECD) to be shifted toward more medial locations with increasing VOT. Due to the authors, this finding suggests that the peak of the N1m response elicited by stimuli with short VOT values may reflect activity from distinct subpopulations of auditory cortex neurons compared to the N1m response elicited by stimuli with long VOT values. That different neurophysiological processes are used to analyze voiced and unvoiced stimuli reflects the fact that there are qualitative differences between voiced and unvoiced phonemes. A pivotal feature in the perception of unvoiced phonemes is the relatively long VOT and the characteristic VOT differences between different unvoiced phonemes. For example, the VOT for/k/is much longer than the one for/p/. The VOT of voiced phonemes on the other hand is fairly short in general and much harder to resolve. Therefore, the processing of other acoustic features such as formant transitions and the specific composition of formants becomes more important in order to perceive and differentiate voiced phonemes, and spectral information is more relevant for this kind of analysis. Voiced phonemes are harder to detect in monitoring tasks (not in our study since the task used in this experiment was fairly easy) resulting in reduced hit rates and longer RT (Jäncke et al., 1992), thus it is possible that the processing of voiced stimuli requires more neurophysiological resources indicated by larger N1 amplitudes. Analysis of VOTs for perceiving unvoiced stimuli is a bit easier and thus does not need that much neurophysiological resource. A further possibility could be that the long VOT in unvoiced syllables provides the opportunity for some pre-processing after the first consonant, which then limits the quantity of processing needed after the occurrence of the following vowel. This preparation (or “warning effect”) elicited by the long VOT could explain the reduced N1 for unvoiced stimuli. If this argument is correct then musicians would show either less of this “preparation effect” or their auditory system would recover more quickly (or efficiently) after the “warning” initial consonant than in non-musicians. Finally, N1 amplitudes in response to unvoiced stimuli could also be reduced due to a second positive-going wave elicited by voicing onset that truncates the N1 evoked by consonant release (e.g., Sharma et al., 2000; Steinschneider et al., 2005).
Taken together, non-musicians utilize different processing modes at the time window of the N1 component for voiced and unvoiced stimuli.
The major finding of our study is that musicians process unvoiced stimuli differently than non-musicians. The N1 amplitude and the corresponding microstate are practically identical for voiced and unvoiced stimuli in musicians. Does that mean that musicians process voiced and unvoiced stimuli similarly? Although we are not in the position to answer this question unequivocally on the basis of our data, we believe that musicians indeed process voiced and unvoiced stimuli at least partly similar. Due to their lifelong musical practise to perceive, distinguish and memorize pitch and supra-segmental information, they are experts in this regard. In this context, the primary and secondary auditory cortex has been adapted anatomically and neurophysiologically to effectively analyze pitch and supra-segmental information (e.g., Pantev et al., 1998, 2003; Schneider et al., 2002; Baumann et al., 2008; Brancucci et al., 2009; Geiser et al., 2009). This expertise can even be identified when the musicians pre-attentively process pitch and supra-segmental information as has been shown in many studies using the mismatch negativity potential (e.g., Pantev et al., 2003; Herholz et al., 2008, 2009; Chandrasekaran et al., 2009; Nikjeh et al., 2009). Because of this preponderance, it might be that musicians are prone to use the neurophysiological processes applied for pitch-relevant information also to the analysis of unvoiced stimuli. Thus, they activate the pitch information analysis mode (voiced analysis mode) even during analyses of unvoiced stimuli. A further possibility could be that they activate the two analysis modes simultaneously when analyzing unvoiced stimuli, namely the voiced and the unvoiced mode. This would imply that musicians run a kind of multi-tasking analysis, which possibly provides more refined information about the spectro-temporal features of an auditory event. It might also be the case that highly trained musicians invest processing resources to a higher extent in the analysis of unvoiced stimuli, in order to ensure the analysis to be as precise as possible. Whether these explanations hold true has to be shown in future experiments.
Map 3, a microstate which immediately precedes the microstate within the N1 time window (here map 6) also revealed differences between musicians and non-musicians. This microstate lies in the P1 AEP time window (50–100 ms) and reflects early auditory neurophysiological processes. For this microstate musicians demonstrate longer durations during processing of non-speech stimuli irrespective of whether these stimuli are voiced or unvoiced. Thus, this neurophysiological process is longer active in musicians than in non-musicians. Even though our experiment was not primarily focused on this particular time window and we thus had no a priori hypothesis in this respect, we explain this finding as follows: We believe that in musicians, non-speech stimuli automatically evoke the non-speech processing mode at this very early processing stage. This processing mode is most likely specific for musicians because they have practised a lot to improve their capabilities to analyze speech-unspecific acoustic features (e.g., pitch, rhythm, intensity, metrum). Thus, they remain longer in the processing stage during which these basic acoustic features are analyzed than non-musicians.
Beside these neurophysiological differences there was also a slight advantage with respect to the RT for musicians. Though not significant, this was a consistent effect, especially for the speech stimuli. Whether this behavioral advantage is related to superior auditory processing or due to a more efficient auditory-motor coupling (see for example Bangert and Altenmüller, 2003) is difficult to infer. Future studies need to be conducted using different experimental designs in order to disentangle auditory processing from audio-motor coupling.
Most of the studies published so far which have examined differences between musicians and non-musicians with respect to basic auditory analyses have focused on supra-segmental acoustic features and pitch processing (e.g., Pantev et al., 1998, 2003; Schneider et al., 2002; Magne et al., 2003; Moreno and Besson, 2005, 2006; Chartrand and Belin, 2006; Baumann et al., 2008; Brancucci et al., 2009; Geiser et al., 2009; Oechslin et al., 2009). Others examined short-term effects of musical training on brain plasticity and its behavioral outcome with respect to speech (e.g., Magne et al., 2006; Moreno et al., 2008; Draganova et al., 2009; Nikjeh et al., 2009). They clearly show that the auditory cortex is functionally altered in musicians compared to non-musicians, thus reflecting their exceptional expertise in encoding and analyzing auditory events. Moreover, structural and functional alterations can be seen already after a relatively short exposure to musical training. The present study complements these findings insofar as the results at hand show also different processing of voiced and unvoiced phonemes on a segmental level. This is reflected by different activation patterns between musicians and non-musicians with respect to N1 amplitudes and corresponding map durations.
It is however important to point out that it is not clear yet if and to what extent these differences might be driven by functionally altered processes at an even earlier level. Musacchia et al. (2007) clearly demonstrated that musical expertise affects the processing of speech as well as music at the level of the brainstem. In particular, they found stronger amplitudes in musicians to both CV-syllables and musical sounds in the transient and sustained portions of the brainstem response to auditory events. Several further studies examining the frequency-following response (FFR), which is interpreted as a marker of brainstem activity, have produced results in line with these findings. For example, Bidelman et al. (2011) found stronger subcortical pitch encoding in musicians compared to non-musicians as reflected in an enhanced FFR in musicians for both speech and non-speech stimuli. It is therefore conceivable that the results of the present study regarding functional differences at the cortical level are influenced by or even solely based on an already altered afferent signal from the brainstem.
Conclusion
Our findings indicate that musical expertise transfers to basal speech processing on a very basic level of processing. Musicians utilize a similar neurophysiological processing mode to analyze voiced and unvoiced stimuli at the time window of the N1 component. Maybe they activate both modes (voiced and unvoiced analyses) simultaneously. At an earlier processing step preceding the voiced–unvoiced processing mode they strongly react to non-speech stimuli indicating a kind of automatic processing mode for non-speech stimuli. Although there are substantial neurophysiological differences between musicians and non-musicians, there are no strong behavioral differences. However, our results provide further support for the view that language and music share neural resources.
Conflict of Interest Statement
The authors declare that the research was conducted in the absence of any commercial or financial relationships that could be construed as a potential conflict of interest.
Acknowledgments
This study was supported by a grant of the Swiss National Science Foundation (SNF) to Lutz Jäncke (32003B_121927).
Footnotes
References
Annett, M. (1970). A classification of hand preference by association analysis. Br. J. Psychol. 61, 303–321.
Bangert, M., and Altenmüller, E. O. (2003). Mapping perception to action in piano practice: a longitudinal DC-EEG study. BMC Neurosci. 4, 26. doi: 10.1186/1471-2202-4-26
Baumann, S., Meyer, M., and Jäncke, L. (2008). Enhancement of auditory-evoked potentials in musicians reflects an influence of expertise but not selective attention. J. Cogn. Neurosci. 20, 2238–2249.
Besson, M., Schön, D., Moreno, S., Santos, A., and Magne, C. (2007). Influence of musical expertise and musical training on pitch processing in music and language. Restor. Neurol. Neurosci. 25, 399–410.
Bidelman, G. M., Gandour, J. T., and Krishnan, A. (2011). Cross-domain effects of music and language experience on the representation of pitch in the human auditory brainstem. J. Cogn. Neurosci. 23, 425–434.
Brancucci, A., di Nuzzo, M., and Tommasi, L. (2009). Opposite hemispheric asymmetries for pitch identification in absolute pitch and non-absolute pitch musicians. Neuropsychologia 47, 2937–2941.
Chandrasekaran, B., Krishnan, A., and Gandour, J. T. (2009). Relative influence of musical and linguistic experience on early cortical processing of pitch contours. Brain Lang. 108, 1–9.
Chartrand, J. P., and Belin, P. (2006). Superior voice timbre processing in musicians. Neurosci. Lett. 405, 164–167.
Colombo, L., Deguchi, C., Boureux, M., Sarlo, M., and Besson, M. (2011). Detection of pitch violations depends upon the familiarity of intonational contour of sentences. Cortex 47, 557–568.
Davis, M. H., and Johnsrude, I. S. (2007). Hearing speech sounds: top-down influences on the interface between audition and speech perception. Hear. Res. 229, 132–147.
Draganova, R., Wollbrink, A., Schulz, M., Okamoto, H., and Pantev, C. (2009). Modulation of auditory evoked responses to spectral and temporal changes by behavioral discrimination training. BMC Neurosci. 10, 143. doi: 10.1186/1471-2202-10-143
Geiser, E., Ziegler, E., Jancke, L., and Meyer, M. (2009). Early electrophysiological correlates of meter and rhythm processing in music perception. Cortex 45, 93–102.
Gordon, R. L., Schön, D., Magne, C., Astesano, C., and Besson, M. (2010). Words and melody are intertwined in perception of sung words: EEG and behavioral evidence. PLoS ONE 5, e9889. doi: 10.1371/journal.pone.0009889
Herholz, S. C., Lappe, C., Knief, A., and Pantev, C. (2008). Neural basis of music imagery and the effect of musical expertise. Eur. J. Neurosci. 28, 2352–2360.
Herholz, S. C., Lappe, C., and Pantev, C. (2009). Looking for a pattern: an MEG study on the abstract mismatch negativity in musicians and nomusicians. BMC Neurosci. 10, 42. doi: 10.1186/1471-2202-10-42
Hillenbrand, J., Canter, G. J., and Smith, B. L. (1990). Perception of intraphonemic differences by phoneticians, musicians, and inexperienced listeners. J. Acoust. Soc. Am. 88, 655–662.
Jäncke, L., Steinmetz, H., and Volkmann, J. (1992). Dichotic listening: what does it measure? Neuropsychologia 30, 941–950.
Jäncke, L., Wüstenberg, T., Scheich, H., and Heinze, H. J. (2002). Phonetic perception and the temporal cortex. Neuroimage 15, 733–746.
Jung, T. P., Makeig, S., Humphries, C., Lee, T. W., McKeown, M. J., Iragui, V., and Sejnowski, T. J. (2000). Removing electroencephalographic artifacts by blind source separation. Psychophysiology 37, 163–178.
Liégeois-Chauvel, C., de Graaf, J. B., Laguitton, V., and Chauvel, P. (1999). Specialization of left auditory cortex for speech perception in man depends on temporal coding. Cereb. Cortex 9, 484–496.
Lisker, L., and Abramson, A. S. (1964). Across language study of voicing in initial stops: acoustical measurements. Word 20, 384–411.
Magne, C., Schön, D., and Besson, M. (2003). Prosodic and melodic processing in adults and children. behavioral and electrophysiologic approaches. Ann. N. Y. Acad. Sci. 999, 461–476.
Magne, C., Schön, D., and Besson, M. (2006). Musician children detect pitch violations in both music and language better than nonmusician children: behavioral and electrophysiological approaches. J. Cogn. Neurosci. 18, 199–211.
Marie, C., Delogu, F., Lampis, G., Belardinelli, M. O., and Besson, M. (2010a). Influence of musical expertise on segmental and tonal processing in Mandarin Chinese. J. Cogn. Neurosci. doi: 10.1162/jocn.2010.21585. [Epub ahead of print].
Marie, C., Kujala, T., and Besson, M. (2010b). Musical and linguistic expertise influence pre-attentive and attentive processing of non-speech sounds. Cortex. doi: 10.1016/j.cortex.2010.11.006. [Epub ahead of print].
Marques, C., Moreno, S., Castro, S. L., and Besson, M. (2007). Musicians detect pitch violation in a foreign language better than nonmusicians: behavioral and electrophysiological evidence. J. Cogn. Neurosci. 19, 1453–1463.
Meyer, M., Baumann, S., and Jancke, L. (2006). Electrical brain imaging reveals spatio-temporal dynamics of timbre perception in humans. Neuroimage 32, 1510–1523.
Meyer, M., Elmer, S., Baumann, S., and Jancke, L. (2007). Short-term plasticity in the auditory system: differential neural responses to perception and imagery of speech and music. Restor. Neurol. Neurosci. 25, 411–431.
Michel, C. M., Koenig, Th, Brandeis, D., Gianotti, L. R. R., and Wackermann, J. (2009). “Electrical neuroimaging in the time domain - microstate analysis,” in Electrical Neuroimaging, Chap. 6, eds C. M. Michel, Th Koenig, D. Brandeis, L. R. R. Gianotti, and J. Wackermann (Cambridge: Cambridge University Press), 123–125.
Moreno, S., and Besson, M. (2005). Influence of musical training on pitch processing: event-related brain potential studies of adults and children. Ann. N. Y. Acad. Sci. 1060, 93–97.
Moreno, S., and Besson, M. (2006). Musical training and language-related brain electrical activity in children. Psychophysiology 43, 287–291.
Moreno, S., Marques, C., Santos, A., Santos, M., Castro, S., and Besson, M. (2008). Musical training influences linguistic abilities in 8-year-old children: more evidence for brain plasticity. Cereb. Cortex 19, 712–723.
Münte, T. F., Altenmüller, E., and Jäncke, L. (2002). The musician’s brain as a model of neuroplasticity. Nat. Rev. Neurosci. 3, 473–478.
Murray, M. M., Brunet, D., and Michel, C. M. (2008). Topographic ERP analyses: a step-by-step tutorial review. Brain Topogr. 20, 249–264.
Musacchia, G., Sams, M., Skoe, E., and Kraus, N. (2007). Musicians have enhanced subcortical auditory and audiovisual processing of speech and music. Proc. Natl. Acad. Sci. U.S.A. 104, 15894–15898.
Näätänen, R., and Picton, T. (1987). The N1 wave of the human electric and magnetic response to sound: a review and an analysis of the component structure. Psychophysiology 24, 375–425.
Nikjeh, D. A., Lister, J. J., and Frisch, S. A. (2009). Preattentive cortical-evoked responses to pure tones, harmonic tones, and speech: influence of music training. Ear Hear. 30, 432–446.
Oechslin, M. S., Meyer, M., and Jäncke, L. (2009). Absolute pitch-functional evidence of speech-relevant auditory acuity. Cereb. Cortex 20, 447–455.
Ostroff, J. M., Martin, B. A., and Boothroyd, A. (1998). Cortical evoked response to acoustic change within a syllable. Ear Hear. 19, 290–297.
Pantev, C., Oostenveld, R., Engelien, A., Ross, B., Roberts, L. E., and Hoke, M. (1998). Increased auditory cortical representation in musicians. Nature 392, 811–814.
Pantev, C., Ross, B., Fujioka, T., Trainor, L. J., Schulte, M., and Schulz, M. (2003). Music and learning-induced cortical plasticity. Ann. N. Y. Acad. Sci. 999, 438–450.
Parbery-Clark, A., Skoe, E., Lam, C., and Kraus, N. (2009). Musician enhancement for speech-in-noise. Ear Hear. 30, 653–661.
Pascual-Marqui, R. D., Michel, C. M., and Lehmann, D. (1995). Segmentation of brain electrical activity into microstates: model estimation and validation. IEEE Trans. Biomed. Eng. 42, 658–665.
Picton, T. W., Skinner, C. R., Champagne, S. C., Kellett, A. J., and Maiste, A. C. (1987). Potentials evoked by the sinusoidal modulation of the amplitude or frequency of a tone. J. Acoust. Soc. Am. 82, 165–178.
Pratt, H., Starr, A., Michalewski, H. J., Bleich, N., and Mittelman, N. (2007). The N1 complex to gaps in noise: effects of preceding noise duration and intensity. Clin. Neurophysiol. 118, 1078–1087.
Schlaug, G. (2001). The brain of musicians. A model for functional and structural adaptation. Ann. N. Y. Acad. Sci. 930, 281–299.
Schneider, P., Scherg, M., Dosch, H. G., Specht, H. J., Gutschalk, A., and Rupp, A. (2002). Morphology of Heschl’s gyrus reflects enhanced activation in the auditory cortex of musicians. Nat. Neurosci. 5, 688–694.
Schön, D., Magne, C., and Besson, M. (2004). The music of speech: music training facilitates pitch processing in both music and language. Psychophysiology 41, 341–349.
Shannon, R. V., Zeng, F. G., Kamath, V., Wygonski, J., and Ekelid, M. (1995). Speech recognition with primarily temporal cues. Science 270, 303–304.
Sharma, A., and Dorman, M. F. (1999). Cortical auditory evoked potential correlates of categorical perception of voice-onset time. J. Acoust. Soc. Am. 106, 1078–1083.
Sharma, A., Marsh, C. M., and Dorman, M. F. (2000). Relationship between N1 evoked potential morphology and the perception of voicing. J. Acoust. Soc. Am. 108, 3030–3035.
Simos, P. G., Diehl, R. L., Breier, J. I., Molis, M. R., Zouridakis, G., and Papanicolaou, A. C. (1998). MEG correlates of categorical perception of a voice onset time continuum in humans. Cogn. Brain Res. 7, 215–219.
Steinschneider, M., Volkov, I. O., Fishman, Y. I., Oya, H., Arezzo, J. C., and Howard, M. A. (2005). Intracortical response in human and monkey primary auditory cortex support a temporal processing mechanism for encoding of the voice onset time phonetic parameter. Cereb. Cortex 15, 170–186.
Steinschneider, M., Volkov, I. O., Noh, M. D., Garell, P. C., and Howard, M. A. (1999). Temporal encoding of the voice onset time phonetic parameter by field potentials recorded directly from human auditory cortex. J. Neurophysiol. 82, 2346–2357.
Thompson, W. F., Schellenberg, E. G., and Husain, G. (2003). Perceiving prosody in speech. effects of music lessons. Ann. N. Y. Acad. Sci. 999, 530–532.
Trébuchon-Da Fonseca, A., Giraud, K., Badier, J., Chauvel, P., and Liégeois-Chauvel, C. (2005). Hemispheric lateralization of voice onset time (VOT) comparison between depth and scalp EEG recordings. Neuroimage 27, 1–14.
Keywords: musicians, speech, musical expertise, N1, microstates, topographic pattern analysis, transfer effect, experience dependent plasticity
Citation: Ott CGM, Langer N, Oechslin M, Meyer M and Jäncke L (2011) Processing of Voiced and Unvoiced Acoustic Stimuli in Musicians. Front. Psychology 2:195. doi: 10.3389/fpsyg.2011.00195
Received: 21 March 2011; Accepted: 03 August 2011;
Published online: 06 September 2011.
Edited by:
Anne-Lise Giraud, INSERM-Ecole Normale Supérieure, FranceReviewed by:
Mitchell Steinschneider, Albert Einstein College of Medicine, USAAnne Caclin, INSERM, France
Copyright: © 2011 Ott, Langer, Oechslin, Meyer and Jäncke. This is an open-access article subject to a non-exclusive license between the authors and Frontiers Media SA, which permits use, distribution and reproduction in other forums, provided the original authors and source are credited and other Frontiers conditions are complied with.
*Correspondence: Cyrill Guy Martin Ott, Division Neuropsychology, Institute of Psychology, University Zurich, Binzmühlestrasse 14/Box 25, CH-8050 Zürich, Switzerland. e-mail: c.ott@psychologie.uzh.ch