
- 1 Center for Mind/Brain Sciences, University of Trento, Rovereto, Italy
- 2 Department of Economics, University of Southern California, Los Angeles, CA, USA
- 3 Department of Economics, University of Minnesota, Minneapolis, MN, USA
We formulate and test a model that allows sharp separation between two different ways in which environment affects evaluation of outcomes, by comparing social vs. private and personal responsibility vs. chance. In the experiment, subjects chose between two lotteries, one low-risk and one high-risk. They could then observe the outcomes. By varying the environment between private (they could observe the outcome of the chosen lottery and the outcome of the lottery they had not chosen) and social (they could observe the outcome of the lottery chosen by another subject) we can differentiate the response and brain activity following the feedback in social and private settings. The evidence suggests that envy and pride are significant motives driving decisions and outcomes evaluation, stronger than private emotions like regret and rejoice, with ventral striatum playing a key role. When we focus on the outcome evaluation stage we demonstrate that BOLD signal in ventral striatum is increasing in the difference between obtained and counterfactual payoffs. For a given difference in payoffs, striatal responses are more pronounced in social than in private environment. Moreover, a positive interaction (complementarity) between social comparison and personal responsibility is reflected in the pattern of activity in the ventral striatum. At decision stage we observe getting ahead of the Joneses effect in ventral striatum with subjective value of risk larger in social than in private environment.
Introduction
We investigate neural correlates of envy and pride during choice and evaluation of outcomes. Envy is a negative emotion experienced when an individual receives a worse outcome than someone else; correspondingly, pride is a positive emotion experienced when that outcome is better than the other’s. Human subjects may feel envy and pride for different reasons. A classical view (Social Comparison Theory; Festinger, 1954) is that comparing our performance with others’ can give us a useful signal about our skill, information that we may want to have even if we are not interested in relative comparisons, and envy and pride simply help us to learn from such experience. The other classical view is formulated for example by Veblen (1899): individuals strive for social dominance, which is their ultimate objective, and envy and pride reflect responses to differences in social status.
Until recently economics has focused mainly on situations where social comparison is not considered, and the utility of an economic agent depends only on one’s obtained outcomes and is independent of others’ outcomes. The works on conspicuous consumption in quest for social status (Veblen, 1899) or relative-income theory of consumption (Duesenberry, 1949) were rather isolated examples of incorporating social comparison into economics. More recently the empirical literature on subjective well-being shows importance of relative-income (Blanchflower and Oswald, 2004; Luttmer, 2005; Dynan and Ravina, 2007). The experimental work on other-regarding preferences suggests that players in simple strategic situations are influenced by relative outcomes (Fehr and Schmidt, 1999; Charness and Rabin, 2002). Social comparison was demonstrated to matter potentially in many applications like internal wage structure in a firm (Frank, 1984), use of prizes instead of wages as optimal motivation devices (Dubey et al., 2005), or pro-cyclical tax policy as a stabilization tool (Ljungqvist and Uhlig, 2000), and many others. In finance, social comparison can account for the observed under-diversification of households’ portfolios (Roussanov, 2010). Social comparison has a potentially broad impact in economics because it affects the central concept of utility function. In this light the more important becomes thorough understanding of social comparison including its neurobiological basis.
Neuroeconomics focuses on understanding neural basis of reward system (neurobiological utility), beliefs formation and emotions that impact decisions, ex post evaluations, and learning (Glimcher et al., 2008). Numerous studies point to ventral striatum and orbito-frontal cortex as essential regions that process reward and values in the brain (McClure et al., 2003; O’Doherty et al., 2003; Preuschoff et al., 2006; Glimcher et al., 2008; Caplin et al., 2010). Social aspects of reward processing were addressed by several papers in neuroeconomics (Sanfey et al., 2003; Knoch et al., 2006; Singer et al., 2006; Takahashi et al., 2009). Two most related papers to ours show that ventral striatum is sensitive to social comparison (Fliessbach et al., 2007; Dvash et al., 2010). The first paper (Fliessbach et al., 2007) demonstrates that BOLD signal in ventral striatum increases as the ratio of relative-income increases to subject’s advantage (1:2, 1:1, 2:1). In the second paper (Dvash et al., 2010) the effect of social comparison in ventral striatum is demonstrated by benchmarking social treatment to the treatment with absolute payoff only (no information about others’ outcomes). The limitation of these fMRI studies is that one cannot exclude the possibility that the main effect comes from a different type of comparison than social one, i.e., counterfactual comparison reflected by activity in ventral striatum (Camille et al., 2004; Coricelli et al., 2005). Using counterfactual comparison as a benchmark social comparison was demonstrated in skin conductance responses (Bault et al., 2008).
There are at least four factors that distinguish our fMRI study from the related work in neuroeconomics we mentioned. First, we consider envy and pride in social comparison as social correspondents of regret and rejoice in counterfactual comparison, which we use as a benchmark for the former. This is a much higher bar for social comparison to pass as compared to those in the mentioned papers. Second, the present study is the first in neuroeconomics to weigh two classical explanations of social comparison described in the first paragraph: Veblen’s social status and Festinger’s drive to compare abilities. Third, thanks to large variability in outcomes we are able to test robustness of social comparison to loser/winner effect. Forth, using a two-lottery choice task allows us to investigate social comparison at decision stage unlike earlier studies (Fliessbach et al., 2007; Dvash et al., 2010). The studies (Bault et al., 2008, 2011), where a similar design is used, are closely related. Differently from Bault et al. (2011), in the current study the emphasis is in the decomposition of the counterfactual comparison in chance and personal responsibility, based on a specific formal model that we now present.
Theoretical Framework
Our work can be conceptualized within the axiomatic framework of social decision theory laid out in Maccheroni et al. (forth coming), hereafter MMR, who extend regret theory (Loomes and Sudgen, 1982) into social context, with envy and pride as social correspondents of regret and rejoice. The theory considers a decision-maker that observes both the outcome x obtained from his choice, and the counterfactual outcome y, that is an outcome he could have had alternatively. The value function V(x, y) of outcome profile (x, y) is a sum of personal utility u(x) from the obtained outcome x and relative utility G(x − y). The latter part captures importance of counterfactual comparison of the obtained outcome x vs. the counterfactual outcome y. This is a generalization of classical expected utility theory, incorporating relative utility. How important relative utility is for well-being of decision-maker, given x and y, potentially depends on the nature of counterfactual outcome y.
The model allows a distinction between private and social environments. In private environment a counterfactual outcome y is just what the individual could have had. In social environment a counterfactual outcome y is what he could have had, but someone else obtained. Independently of distinction between private vs. social environment, this setup may distinguish between chance and personal responsibility. In case of chance, a decision-maker obtained x rather than y due to pure luck. This occurs for example when x and y are outcomes of the same chosen lottery, but drawn independently. As for personal responsibility a decision-maker could have obtained a counterfactual outcome y if he had made a different choice. In general, the ex post value function is:

where the superscript i denotes private or social environment, and j denotes chance or personal responsibility. To evaluate lotteries ex ante, before choice is made, a decision-maker uses expectation of a value function  with respect to a subjective belief over states of nature. One of the main features of the model is that it provides separation of the personal u(x) and relative
  utility: here we focus on the latter. The
  functions have natural interpretation, for example: the function
  is the disappointment/elation function (private environment and chance responsibility), the function
  the regret/rejoice function (private environment and personal responsibility), and
  the envy/gloating function (social environment, and either chance or personal responsibility).
Hypotheses
Our primary objective is to investigate social comparison at outcome evaluation stage. To simplify the analysis we assume that functions  are linear, and we refer to
  as a slope. If this model is taken as a model of the ex ante choice, then a linear G function would make the model identical to expected utility: that is, it would produce the same choice as that of an individual that ignores inter-personal comparisons. For this reason we rather interpret linear functions
  as approximations to true non-linear functions. We state now formally our hypotheses:
1. Counterfactual comparison:  for all i, j.
2. Social comparison: 
3. Personal responsibility: 
4. Positive interaction (complementarity) between social comparison and personal responsibility effects: 
5. Correspondence between behavioral and neural effects.
The first hypothesis asserts that the subjective value of the obtained outcome x, while a decision-maker could have had the outcome y, depends on the comparison of x and y, or  In addition, we hypothesize that the functions
  are increasing. In other words, the subject’s relative utility
  is increasing in the subject’s advantage (that is the difference x − y) over the counterfactual payoff. The second hypothesis of social comparison states that the counterfactual comparison matters more in a social than in a private environment. Simply, if a subject earns $1 more than the other person his relative utility is larger as compared to earning $1 more than the counterfactual outcome in private environment. The third hypothesis concerns personal responsibility effect, which states that the counterfactual comparison is more important in case of personal rather than chance responsibility. Intuitively, the subject is more affected in terms of relative utility if advantage (or x − y) in counterfactual comparison is due to his choice rather than just pure chance. The forth hypothesis is positive interaction (complementarity) between social comparison and personal responsibility effects. It is about personal responsibility effect being stronger in the social than in the private environment. The last fifth hypothesis is the correspondence between the neural and behavioral effects.
Materials and Methods
Participants
We recruited 63 participants from introductory courses in microeconomics and macroeconomics at University of Minnesota to participate in 21 experimental sessions. In each session one participant was placed inside magnetic resonance imaging (MRI) scanner and two other at computers outside the scanner in a separate room. All subjects in each experimental session faced otherwise the same task. The 21 scanned participants were right-handed, healthy males, aged 18–20 years old (mean 18.5, SD 0.6). Forty-two subjects (18 females and 24 males) participated in the experiment outside the scanner. We later discovered that the subject in the scanner and one of the other two had a personal relationship, so we drop this session from analysis and analyze data from 20 sessions. All subjects gave informed consent to participate according to the procedures approved by University of Minnesota Institutional Review Board.
Experimental Task
Subjects chose between two lotteries in each of 70 consecutive rounds. Each lottery had two possible outcomes ranging from a minimum value of −$5 to a maximum of $25. Three subjects performed the same task in each experimental session. One male subject was placed inside MRI machine. The two others made choices at computers through a remote connection in a separate room. We dropped one session from analysis due to violation of experimental procedures. The main focus of this paper is on the 20 scanned subjects, for whom we collected both behavioral and neural data according to the study procedures. Subjects were connected over computer network. No deception was used at any time. Subjects chose repeatedly a lottery from a pair of lotteries, a low-risk and a high-risk one. In a typical trial each subject had 2 s to evaluate lotteries, and then made a decision without time constraints: see Figure 1. Choice was followed by display of lotteries for 2 s, and then determination of outcome for each. Lotteries together with final outcomes were then shown for 2 s (outcome event). Subjects then observed for 5 s two bars representing the obtained payoff and the counterfactual payoff (comparison event). Each of 70 trials ended with a subjective rating on the integer scale 0–10 (we labeled 0 as bad, 5 as neutral, 10 as good) without time constraints. The outcomes of lotteries were drawn once and for all using the actual probabilities for each of 72 trials. These outcomes were the same in all 21 experimental sessions.
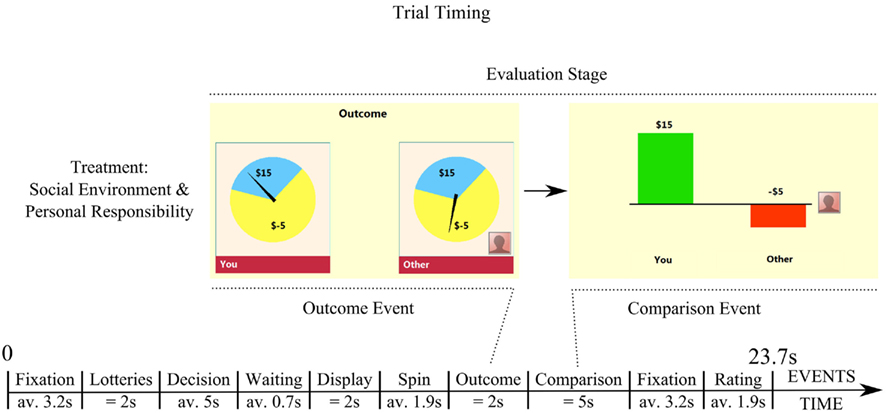
Figure 1. Trial timing with duration and sequence of events. The study focuses on ex post evaluation stage that is divided into two events: outcome event and comparison event. The events presented in this Figure refer to the treatment of social environment and personal responsibility. At comparison event, a subject (“you”) conducts counterfactual comparison of “what you got” as compared to “what you could have had, but the other got.” The clause “but the other got” extends counterfactual comparison into social comparison.
Timing
Each of 70 periods started with a fixation screen pre-announcing either the social or the private environment. Next, we asked the subject to choose from two lotteries. After a display of 2 s, a cue was given indicating that a choice could be made. The subject had unlimited time to decide his choice of lottery. The average choice time was 5 s. The lottery chosen by the subject was highlighted for 2 s for decision confirmation. Sometimes, a subject in addition learned the choice of lottery by one other subject selected randomly. This could lead to the delay of presentation of choices that last 0.7 s on average. After that an arrow appeared over the pie chart describing each lottery on the screen, started to spin instantly, and stopped pointing to the outcome of lottery after an average spinning time of 1.9 s. Pie charts and arrows pointing to outcomes were kept on the screen for 2 s. After that, a subject was presented for fixed 5 s with his obtained payoff vs. the counterfactual payoff he could have had according to the relevant condition. This event, called comparison event, is the main focus of brain data analysis. The period ended with the question “How did that make you feel?” that a subject answered on the integer scale 0–10, with 0 – “Bad,” 5 – “Neutral,” and 10 – “Good.”
Payments
Subjects received a fixed participation payment of $15; the subject in the MRI machine received additional $25. In addition subjects were paid the outcomes of three randomly determined out of those they had chosen during 70 periods. Outcomes of lotteries varied from −$5 to $25, so losses were possible. To cover potential losses a participant received an additional payment of $15. The three paid lotteries were drawn at the end of the session. The total fixed payment was $55 to a scanned subject and $30 to a subject participating outside MRI scanner. The average additional payment from the three paid lotteries to subjects scanned in MRI was $11.25, with minimum −$4, maximum $39, and SD $10.97. The average performance payment to subjects participating outside MRI was $12.80, with minimum −$7, maximum $46, and SD $12.39.
Analysis
At the decision stage there was only one factor with two levels: private vs. social environment. In the social environment each subject was choosing a lottery expecting to learn its outcome as well as choice and obtained outcome of the other randomly matched subject. In contrast in private environment a subject was not provided with any information about others. At the evaluation stage we used 2 × 2 factorial design.
The two independent factors were: environment and responsibility. Each factor had two levels: private vs. social environment, and chance vs. personal responsibility. There were 20 trials in each of three treatments: (private, personal), (social, chance), and (social, personal). There were 10 trials in the treatment (private, chance). The order of treatments in a session was random. We used the set of 20 different pairs of lotteries shown at most once in each treatment, see Table A1 in Appendix.
We now explain the four treatments present at the evaluation stage, the stage consisting of outcome and comparison events, see Figure A1 in Appendix for displays used in different treatments. In treatment (private, chance) a subject saw at outcome event only the lottery he chose, and at comparison event the obtained outcome vs. the unrealized outcome within the chosen lottery. In contrast in treatment (private, personal) a subject observed at outcome event both the lottery he chose and the lottery he did not choose, followed with comparison event presenting the outcome of chosen lottery vs. the outcome of lottery he could but did not choose. Treatment (social, chance) occurred if subjects in a random match chose the same lottery. In this case we resolved the same lottery independently for each subject in the match. Consequently, a subject in the match observed at outcome event the two instances of the same lottery, one instance applying to him and other instance applying to other subject. The outcome event was followed with comparison event presenting subject’s outcome vs. other’s outcome. Finally, treatment (social, personal) occurred if subjects in a random match chose different lotteries. At outcome stage a subject observed a lottery he chose and a lottery chosen by the other subject in a random match. This was followed with a comparison event presenting subject’s outcome against the outcome obtained by the other.
fMRI Acquisition and Preprocessing
We collected data at Magnetic Resonance Research Center at University of Minnesota using 3T Siemens Trio scanner. High resolution anatomical images were obtained using Siemens T1-weighted 3D flash 1 mm sequence. Functional images were acquired using echo planar imaging with repetition time (TR) 2000 ms, echo time (TE) 23 ms, flip angle 90°, 64 × 64 matrix, 38 slices per scan, axial slices 3 mm thick with no gap, voxel size 3 mm × 3 mm × 3 mm. Functional images were acquired with an oblique 30° angle to the anterior commissure–posterior commissure (AC–PC) line to optimize signal acquisition from orbito-frontal cortex. The data were preprocessed and analyzed using Brain Voyager QX 1.8. The anatomical images were transformed into Talairach space in two steps: first the cerebrum was rotated into AC–PC plane using trilinear transformation, second we identified eight reference points (AC, PC, and six boundary points) to fit the cerebrum into Talairach template using trilinear transformation. We preprocessed functional data performing slice scan time correction, 3D movement correction relative to the first volume using trilinear estimation and interpolation, removal of linear trend together with low frequency non-linear trends using high-pass filter. Next, we co-registered functional with anatomical data to obtain Talairach referenced voxel time courses, to which we applied spatial smoothing using Gaussian filter of 7 mm.
fMRI Analysis
The analysis was performed in Brain Voyager QX; the statistical analysis in Stata. We used GLM model with continuous predictors of interest convolved with two-gamma hemo-dynamic response function (Bϋchel et al., 1998). We proceeded in three steps separately for decision and outcome evaluation stages. First, we performed whole-brain analysis with treatments collapsed using random-effects General Linear Model (RFX GLM) to identify functional region-of-interests (ROIs). We then examined treatment effects in the regions identified in the first step. We finally performed whole-brain analysis with RFX GLM focusing on relative treatment effects. At ex post outcome evaluation stage we focused on two events of interest: outcome and comparison, while controlling for the remaining events of no interest with dummy variables. We implemented model designs with continuous predictors of product of delta function (a box car function over 500 ms) and value of advantage at event comparison. In model designs differentiating between treatments we used separate predictors of advantage for each treatment considered. We controlled for the obtained payoff by a subject with a continuous predictor being a product of delta function (2000 ms) and value of the obtained payoff by a subject at event outcome. In analyzing ex ante evaluation of choice alternatives we focused on the event lotteries. We implemented model designs with continuous predictors of product of delta function (500 ms) and value of risk-adjusted return of high-risk lottery at the event lotteries.
Results
Behavioral Results
We focus on the question how self reported affective ratings (variable affect) depend on subjects’ obtained outcome (variable payoff) and counterfactual comparison relevant to treatment (variable advantage). The variable advantage is the difference between the payoff obtained by the subject and the counterfactual payoff. We estimate the model given by Eq. 2 using OLS with robust SE corrected for in-subject correlation in observations:

The results reported in Table 1 confirm hypothesis that counterfactual comparisons matter in the evaluations of outcomes of choices, for example the estimated  coefficients are positive and significantly different from 0. The affective rating of outcome profile depends not only on the obtained payoff but also on the counterfactual comparison.
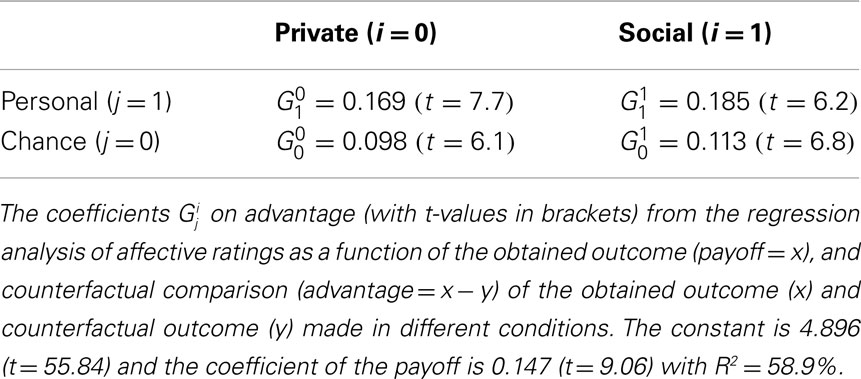
Table 1. Counterfactual comparisons in behavioral data.
To investigate the effect of personal responsibility we test whether the importance of counterfactual comparisons is higher in personal than in chance responsibility separately for the private  and the social
  environment using the above estimates of
  The personal responsibility effect is highly significant in both cases according to a two-sided Wald test: F(1, 19) = 26.28 with p < 0.001 and F(1, 19) = 13.28 with p = 0.002, respectively. Similarly for the social comparison effect we test whether the importance of counterfactual comparisons is higher in the social than in the private environment separately for chance
  and personal
  responsibility treatments. The social comparison effect has the right sign but is not significant in both cases using two-sided Wald test: F(1, 19) = 1.24 with p > 0.1 and F(1, 19) = 0.77 with >0.1, respectively. To check the forth hypothesis of positive interaction between social comparison and personal responsibility we construct the complementarity index CI:
The numerator in Eq. 3 captures the degree of complementarity between two factors. If it is positive then factors are complementary (positive interaction), if zero they are independent (no interaction), and if negative they are substitutable (negative interaction). The denominator in Eq. 3 is a normalization introduced so that CI is independent of scaling of variables. We estimated CI individual by individual finding mean CI = 0.21, which is positive as hypothesized. However, we cannot reject the hypothesis that the two factors: environment and responsibility are independent (Wilcoxon signed-rank test, z = 0.34, p > 0.1).
fMRI Results
We performed whole-brain analysis of ex post evaluation of outcomes. The evaluation stage was partitioned in two distinct events: outcome event (which lasted 2 s) followed immediately by comparison event (5 s), see Figure 1. During the outcome event subjects were shown the lotteries, relevant to treatment, and their outcomes. In the comparison event subjects observed the obtained outcome vs. the counterfactual outcome, with the latter varying according to treatments. In the statistical models we test we use the outcome event to control for the obtained payoff, while during the comparison event we focus on counterfactual comparison. The partitioning of the outcome evaluation stage into two events allowed us to better control the nature of counterfactual comparison between the obtained and counterfactual outcomes, while also temporally decouple the predictors of the obtained and counterfactual payoffs.
Universal Network for Counterfactuals
Our strategy is to first identify brain areas that are involved in counterfactual comparisons in general, without differentiating between different treatments. To this end we use model design with linear predictors (Bϋchel et al., 1998) in the obtained payoff and the advantage (with all treatments collapsed) and consider the contrast of advantage against the baseline. With conservative threshold of p < 0.01 (Bonferroni corrected) we find increased activations only in striatum bilaterally, see Figure 2A. However, with more liberal threshold of p < 0.02 (FDR corrected) we find also other clusters associated with reward processing like mPFC and OFC, see Table 2, among other regions, see Table A2 in Appendix. In the second step we extract average BOLD time-series from the regions identified above and perform ROI analysis to test our hypotheses. We differentiate between different treatments by considering model designs with one factor at the time, instead of two, in order to increase power. For clarity we report below the results on the left ventral striatum, and very similar results on the right ventral striatum are reported in the Appendix.
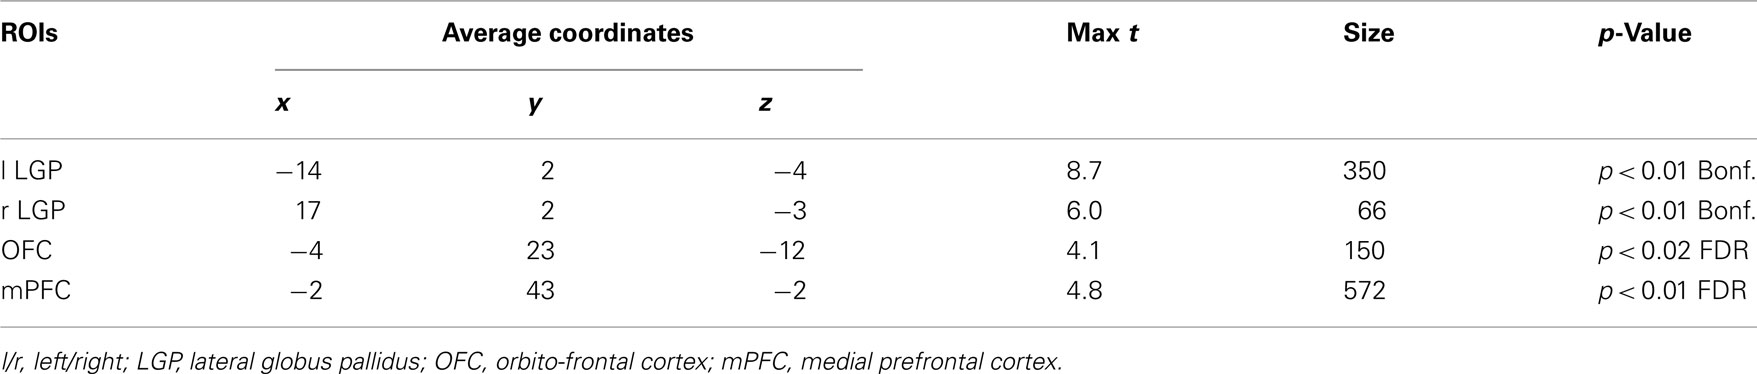
Table 2. Areas in universal network for counterfactuals.
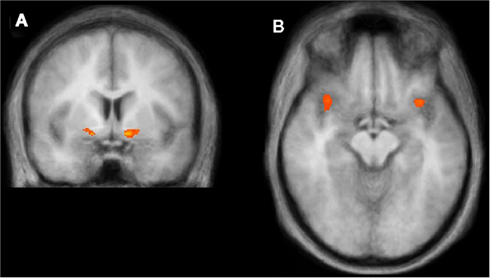
Figure 2. Regions of interest identified. (A) Ventral striatum bilaterally shows increased activity at the contrast of linear advantage against the baseline with p < 0.01 (Bonferroni corrected). (B) Anterior insula bilaterally shows increased activity at the contrast with dummy predictors: Social Loss less Private Loss with p < 0.001 (uncorrected), where Loss = 1 if advantage <0, and 0 otherwise. Details of coordinates in Table 2.
We ran random-effects panel regression to explain average BOLD time-series in the cluster of left striatum with linear predictors (convolved with standard two gammas hemo-dynamic response function) in private advantage (coefficient G0 = 0.77 with z = 7.79, p < 0.001) and social advantage (coefficient G1 = 1.07 with z = 11.31, p < 0.001), while controlling for the obtained payoff. Both coefficients are positive and significantly different from zero, which demonstrates the involvement of left striatum in counterfactual comparisons.
The difference in coefficients on social less private advantage is positive and statistically significant (two-sided Wald test, χ2 = 5.45, p = 0.02). The same analysis after the introduction of a responsibility factor shows that the coefficients on chance advantage (coefficient 0.79, z = 7.93, p < 0.001) and personal advantage (coefficient 1.05 with z = 11.14, p < 0.001) are significantly different from zero, with the difference between the latter and the former positive and statistically significant (two-sided Wald test, χ2 = 4.18, p = 0.04). The results confirm again the involvement of left striatum in counterfactual processing and show that it is stronger for personal rather than chance responsibility, see Figure 3. To exclude the possibility that correlation of payoff and advantage drives the results we consider the model designs with advantage normalized to mean 0 and SD 1, without controlling for payoffs. We run subject by subject regressions to explain BOLD time-series convolved with HRF linear predictors in normalized advantage, so that we obtain individual by individual coefficients allowing us to perform non-parametric statistical tests. Considering environment factor we find that coefficients on normalized private (coefficient 4.30, Wilcoxon signed-rank test, z = 3.73, p < 0.001) and social advantage (coefficient 6.03, Wilcoxon signed-rank test, z = 3.92, p < 0.001) are positive and statistically significant. The difference between the latter and the former is also positive and significant (Wilcoxon signed-rank test, z = 1.79, p = 0.07). Switching to responsibility factor we observe that coefficients on normalized chance (coefficient 3.49, Wilcoxon signed-rank test, z = 3.21, p = 0.001) and personal advantage (coefficient 6.52, Wilcoxon signed-rank test, z = 3.92, p < 0.001) are positive and significantly different from 0. The difference between coefficients on personal less chance normalized advantage is positive and statistically significant (Wilcoxon signed-rank test, z = 2.02, p = 0.04). The non-parametric analysis of normalized advantage, without controlling for payoff, confirms the results obtained in panel analysis when we controlled for payoffs.
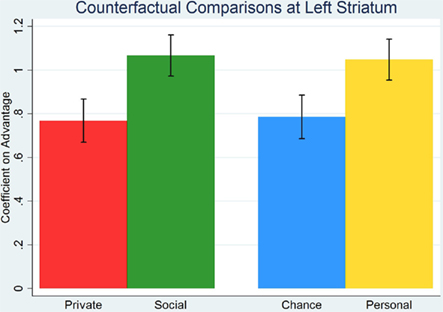
Figure 3. We performed ROI analysis, considering one factor at the time, on the cluster of left ventral striatum, identified earlier as a part of universal network for counterfactuals, showing that coefficients on linear predictors in advantage are positive in all treatments. The coefficient on advantage is larger in social than in private environment and with personal than with chance responsibility.
To investigate the interaction between the two factors, environment and responsibility, we consider the disaggregated model design with all four treatments. We estimated neural CI (Eq. 3) in left ventral striatum cluster to be 1.82 and significantly different from zero (Wilcoxon signed-rank test, z = 2.46, p = 0.01). Further, for each participant we compute CI in the left striatal cluster and based on affective ratings, and found that the neural CI is positively correlated with behavioral CI with Pearson correlation coefficient 0.4 see Figure 4. The OLS regression of neural CI against behavioral CI gives a significant positive coefficient 0.94 (p = 0.08). The robust regression of neural CI vs. behavioral CI, that weights away outliers and leverage points, gives very similar results to OLS regression with coefficient on behavioral CI of 0.92 (p = 0.03). However, this result is not robust to entirely removing the two extreme points from the right or two extreme outliers (see Figure 4) from the OLS regression.
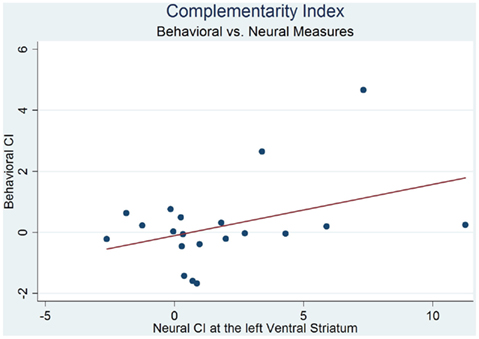
Figure 4. BOLD data in the left ventral striatum exhibit positive interaction, or complementarity between responsibility and environment factors as measured by complementarity index CI = 1.82 (Wilcoxon signed-rank test, z = 2.46, p = 0.01), see Eq. 3 for definition of CI. The Figure shows that neural CI (x-axis) predicts behavioral CI (y-axis).
Neural Treatment Effects
The previous analysis focused on the regions of interest involved in the counterfactual comparisons in all conditions. However, some brain regions may be involved selectively only in some treatments, or may deviate from baseline in the opposite directions in different treatments. To account for these possibilities we use model design differentiating between private vs. social environment in order to identify the regions of interest involved. We performed the whole-brain analysis looking at the contrast between social less private advantage, while controlling for payoffs (all being linear predictors). In terms of MMR model we are looking for brain regions in which G1 − G0 ≠ 0. At the threshold p < 0.005 (uncorrected) and cluster size 50 voxels we find increased activity in right striatum (left striatal cluster is slightly above threshold), superior frontal gyrus (SFG), and right dorsolateral prefrontal cortex (right DLPFC) among other regions. Confirming above findings the ROI analysis of right striatal cluster reveals that the coefficients on private G0 = 0.1 (Wilcoxon signed-rank test, z = 3.6, p < 0.001) and social advantage G1 = 0.21 (Wilcoxon signed-rank test, z = 3.85, p < 0.001) are positive and significantly different from 0. In addition, the difference between coefficients on social less private advantage G1 − G0 is positive and significantly greater than 0 (Wilcoxon signed-rank test, z = 3.3, p < 0.001). In the ROI analysis we computed for each participant a gloating index (G1 − G0)/(G0 + G1) in the right striatal cluster and separately a behavioral one based on affective ratings. Using robust regression we found behavioral gloating index to be predicted by its neural counterpart individual by individual: a constant −0.21 (p = 0.07) and a coefficient 0.22 (p = 0.01). As caution is necessary when using robust regression, we find positive correlation of neural and behavioral gloating indices at individual level to strengthen the finding of social comparison effect at aggregate level documented above. In addition to right striatum we found also SFG and right DLPFC to exhibit increased activity at the contrast between social less private advantage, while controlling for payoffs. However, in contrast to right striatum neither SFG nor right DLPFC was identified to be part of universal network for counterfactuals. The ROI analysis reveals that both SFG and right DLPFC show positive linear response only to social advantage. In case of SFG the coefficients on private advantage G0 = −0.06 (Wilcoxon signed-rank test, z = −1.8, p = 0.07) and social advantage G1 = 0.1 (Wilcoxon signed-rank test, z = 2.3, p = 0.02) are significantly different from zero, but have opposite signs. The last fact explains why we did not detect SFG to be part of the universal network for counterfactuals. The difference between coefficients on social less private advantage G1 − G0 in SFG is positive and significant (Wilcoxon signed-rank test, z = 3.36, p < 0.001). ROI analysis of right DLPFC exhibits similar pattern. The similar exercise along chance vs. personal responsibility dimension has not led to identification of other regions than those already found in the universal network for counterfactuals.
Loser and Winner Effect
There exists a possibility that, rather than being more linearly responsive to advantage in social than in private environment, the brain regions are only more responsive to a win or a loss in social than in private environment, no matter how large the advantage is. In our experiment the variable advantage varied from −22 through +21, with 34 intermediate discrete values, and contiguous values in the interval from −11 to 11. Given this variability in advantage we are able to run robustness check of the above findings by considering the model design with both linear and dummy predictors of interest. In addition to linear predictors in payoff, private, and social advantage we include dummy predictors: social win (equal to 1 if social advantage is strictly larger than 0, and equal to 0 otherwise), and similarly defined variables social loss, private win, and private loss.
The ROI analysis in the clusters of right stratum, SFG, and right DLPFC, identified above shows that greater positive linear response to social than private advantage in these regions is robust to private/social win/loss effects. The difference in coefficients on linear predictors of social less private advantage G1 − G0 was positive and significant in all three regions: right striatum (Wilcoxon signed-rank test, z = 2.9, p = 0.004), SFG (Wilcoxon signed-rank test, z = 1.8, p = 0.07), and right DLPFC (Wilcoxon signed-rank test, z = 2.2, p = 0.03). Further, we looked at contrasts between dummy predictors. In the whole-brain analysis in the contrast social loss vs. private loss we found increased activity in anterior insula bilaterally, see Figure 2B. The ROI analysis of left insula cluster reveals a percentage BOLD change only to social loss to be positive and significantly different from zero (Wilcoxon signed-rank test, z = 3.3, p < 0.001), while in cases of private loss, private win, and social win we fail to reject the hypothesis that percentage BOLD change is zero (Wilcoxon signed-rank test, p > 0.6), see Figure 5.
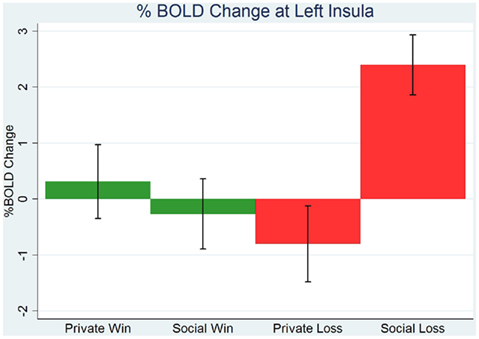
Figure 5. Region-of-interest analysis of left anterior insula shows increased activity only to social loss (equal to 1 if advantage is strictly less than 0 in social environment, and equal to 0 otherwise), and around zero or slightly negative activity in cases of social win or private win/loss.
Getting Ahead of the Joneses
Until now we presented behavioral and neural evidence that counterfactual comparisons matter in ex post evaluations of choice outcomes. They are stronger in social than private environment and with personal than chance responsibility. We predict similar results during the ex ante evaluations of choice alternatives, that is, in the process leading to choice. In the analysis of ex post evaluations we considered two factors: environment (private vs. social) and responsibility (chance vs. personal). In contrast, in the analysis of ex ante evaluations of choice alternatives we considered environment factor only. In the beginning of a trial subjects learned whether they are in private or social environment but not whether the trial involves chance or personal responsibility. The analysis of the ex ante evaluations of choice alternatives, two binary lotteries in our case, is complicated by the fact that outcomes of lotteries are risky at the evaluation stage. In the previous analysis we assumed for simplicity that relative utility in MMR model is linear. However, under the linearity assumption MMR model applied to ex ante evaluations is equivalent to expected utility model, meaning that both models generate the same choices and counterfactual comparisons do not matter for choice behavior. Therefore, it is necessary to adjust risk attitudes of subjects in the ex ante analysis. Our empirical strategy is to consider risk-adjusted return as a variable of interest. Recall that each choice situation in our study involved two binary lotteries with similar expected values, low-risk vs. high-risk one. We focus on the question how the choice of high-risk lottery depended on its risk-adjusted return. We define risk-adjusted return as expected value of lottery divided by SD. The view that risk-adjusted return drives decisions has been supported in the literature (Weber and Johnson, 2009), which justifies our approach.
We first examine behavioral data with logit regression aiming to explain the choice of high-risk rather than low-risk lottery with risk-adjusted return of high-risk lottery in private vs. social environment. Borrowing intuition from finance one can interpret the regression coefficient on risk-adjusted return as the subjective value of risk. We run logit regression subject by subject obtaining the average subjective value of risk to be 0.14 (SEM 0.22) in private and 0.68 (SEM 0.2) in social environments. The former is not significantly different from 0 (Wilcoxon signed-rank test, z = 0.3, p = 0.79), while the latter is positive and significantly different from zero (Wilcoxon signed-rank test, z = 2.9, p = 0.004). The subjective value of risk is significantly larger in social than in private environment (Wilcoxon signed-rank test, z = 2.4, p = 0.02). This may suggest that subjects choose more often high-risk lotteries in social than in private environment. However, high-risk lotteries are not all the same. Focusing on high-risk lotteries we can consider those with below and above median risk, namely the median of SD of high-risk lottery in the pair of lotteries presented to subjects. The median value was $6.58. High-risk lotteries with below median risk are chosen with lower frequency in social (47%) than in private (52%) environment. The reverse pattern holds for high-risk lotteries with above median risk as subjects choose the high-risk lotteries with higher frequency in social (42%) than in private (38%) environment. A Wilcoxon signed-rank test shows that the first difference is not significant (z = 1.01 and p > 0.1, while the latter is significant (z = −2.02, p = 0.04).
This analysis suggests that subjects adjust their decisions in social as compared to private environment in order to get ahead of others. Our findings are consistent with the literature on experience based tasks showing social exposure to increase risk-taking (Yechiam et al., 2008).
Guided by the behavioral results we performed analogical analysis of neural data at the decision stage. Given our interest in reward system, and especially in ventral striatum, our use of risk-adjusted return as predictor in neural analysis can be justified by the finding that ventral striatum tracks both expected reward and variance (Preuschoff et al., 2006). We first consider the model design with linear predictor in risk-adjusted return, without distinction between private and social environments. In the contrast of risk-adjusted return against the baseline, with threshold p < 0.005 uncorrected, we found increased activity in ventral striatum bilaterally and decreased activity in OFC (see Table 2). In the ROI analysis of the left cluster of ventral striatum we looked at the linear response to risk-adjusted return in private vs. social environment. In both cases the coefficients were positive and significantly different from 0: private coefficient 0.04 (SEM 0.032, Wilcoxon signed-rank test, z = 1.75, p = 0.08) and social coefficient 0.14 (SEM 0.025, Wilcoxon signed-rank test, z = 3.5, p < 0.001). Crucially, the difference between the coefficients in social vs. private environment was positive and highly significant (Wilcoxon signed-rank test, z = 3.1, p = 0.002). The similar results apply to right cluster of ventral striatum. As for OFC the analogical ROI analysis revealed that the coefficients on risk-adjusted return were negative and significant with private coefficient −0.17 (SEM 0.12, Wilcoxon signed-rank test, z = −3.6, p < 0.001) and social coefficient −0.05 (SEM 0.11, Wilcoxon signed-rank test, z = −3.1, p = 0.04). The difference between social and private coefficients was positive and significant (Wilcoxon signed-rank test, z = 2.4, p = 0.02). Subsequently, we considered the model design with linear predictors in risk-adjusted return, both in private and social environments. Looking at the contrast social less private risk-adjusted return with threshold p < 0.005 uncorrected we found increased activity in striatum bilaterally and OFC as above. In addition we found also increased activity in anterior cingulate cortex (ACC) and right dorsolateral-cortex (rDLPFC) among other regions. The ROI analysis shows that BOLD activity is decreasing in risk-adjusted return in ACC and rDLPFC in private environment. The coefficients on private risk-adjusted return are negative and significant, with coefficient in ACC equal to −0.1 (SEM 0.04, Wilcoxon signed-rank test, z = −2.2, p = 0.03). The coefficient in rDLPFC was −0.07 (SEM 0.04, Wilcoxon signed-rank test, z = −1.5, p = 0.13). In contrast coefficients on social risk-adjusted return are positive and significant with coefficient in ACC 0.07 (SEM 0.03, Wilcoxon signed-rank test, z = 1.8, p = 0.08) and the coefficient in rDLPFC 0.08 (SEM 0.03, Wilcoxon signed-rank test, z = 2.9, p = 0.004).
Conclusion
Our results put social comparison in new light and strengthen existing findings. We document as in existing literature a crucial role of ventral striatum, a part of brain reward system, in social comparisons. Focusing on outcome evaluation stage we showed that social emotions like envy and pride are stronger than corresponding private emotions like regret and rejoice as measured by ventral striatum responses. First, this confirms Veblen’s view of envy and pride as reflecting differences in social status. Second, this is important finding as other studies established social comparison effect in ventral striatum only against the baseline (Fliessbach et al., 2007; Dvash et al., 2010), without reference to any other alternative comparison process, i.e., counterfactual comparison (Camille et al., 2004; Coricelli et al., 2005). More, social comparison in ventral striatum is stronger in case of personal than chance responsibility for outcomes, which amounts to positive interaction of social environment and personal responsibility. We favor interpretation that difference between personal and chance responsibility for outcomes is about how much can be inferred about skill vs. luck of decision-maker during comparison process. Given this interpretation, positive interaction of social environment and personal responsibility confirms Festinger’s view of envy and pride as helping people to learn skills from others. We show that larger linear response in social than in private environment to difference in outcomes is robust to winner/loser effect. At the same time we find social loser effect in anterior insula, a region associated with negative emotions. Interestingly, we did not find for this region similar loser effect in private environment or winner effects in either environment. Nor we found differential linear response in private vs. social environment. This suggests that the very social loss, no matter how large evokes strong negative emotion. These findings fit well with increased activity in anterior insula predicting rejections of unfair offers (worse than 50:50) in ultimatum game (Sanfey et al., 2003). We find also increased activity in areas related to Theory of Mind reasoning in social vs. private environment. At decision stage we observe getting ahead of the Joneses effect with subjective value of risk as measured by activity in ventral striatum being larger in social than in private environment. Not surprisingly subjects assume extreme risk more often in social than in private environment. One another interesting aspect of brain response to risk-adjusted return at decision stage is increased activity in rDLPFC and ACC in social vs. private environment. Both regions were shown previously to exhibit increased activity the higher the decision conflict present (MacDonald et al., 2000). In this light one interpretation of our results would be that the subjects have decision conflict in social environment whether to assume extreme risk and possibly get ahead of others or keep taking reasonable risks only.
Further research on social comparisons is needed to understand it better. It may have far reaching consequences as social comparison affects utility function, a central concept in economics. A direction of future research would be to focus on decision stage and investigate idiosyncratic as compared to systematic risk in private vs. social environment. Another interesting direction of research to pursue is the relationship between temporal discounting and social comparison, topics that independently received considerable attention in neuroeconomics. Motivated by personal responsibility effect in our study the hypothesis is that patient individuals are more envious and proud if differences in relative outcomes are mainly due to different skills. The intuition is that patient individuals would weigh more the future differences in relative outcomes. Yet another intriguing question is the relationship between social comparisons in different domains: me-vs.-others as compared to among others. One possibility is that the more envious and proud individual the higher is his preference for equality among others, for this increases chances he is in better situation than anyone else.
Conflict of Interest Statement
The authors declare that the research was conducted in the absence of any commercial or financial relationships that could be construed as a potential conflict of interest.
Acknowledgments
This work was supported by the Agence Nationale de la Recherche France (to Giorgio Coricelli), Provincia Autonoma di Trento (to Giorgio Coricelli and Jaroslaw Grygolec), and National Science Foundation Grant SES-0452477 (to Aldo Rustichini).
References
Bault, N., Coricelli, G., and Rustichini, A. (2008). Interdependent utilities: how social ranking affects choice behavior. PLoS ONE 3, e3477. doi:10.1371/journal.pone.0003477
Bault, N., Joffily, M., Rustichini, A., and Coricelli, G. (2011). Medial prefrontal cortex and striatum mediate the influence of social comparisons on the decision process. Proc. Natl. Acad. Sci. U.S.A. 108, 38, 16044–16049.
Blanchflower, D. G., and Oswald, A. J. (2004). Well-being over time in Britain and the USA. J. Public Econ. 138, 1359–1386.
Bϋchel, C., Holmes, A. P., and Friston, K. J. (1998). Characterizing stimulus-response functions using nonlinear regressors in parametric fMRI experiments. Neuroimage 8, 140–148.
Camille, N., Coricelli, G., Sallet, J., Pradat-Diehl, P., Duhamel, J.-R., and Sirigu, A. (2004). The involvement of orbitofrontal cortex in the experience of regret. Science 304, 1167–1170.
Caplin, A., Dean, M., Glimcher, P. W., and Rutledge, R. B. (2010). Measuring beliefs and rewards: a neuroeconomic approach. Q. J. Econ. 125, 923–960.
Charness, G., and Rabin, M. (2002). Understanding social preferences with simple tests. Q. J. Econ. 117, 817–869.
Coricelli, G., Critchley, H. D., Joffily, M., O’Doherty, J. P., Sirigu, A., and Dolan, R. J. (2005). Regret and its avoidance: a neuroimaging study of choice behavior. Nat. Neurosci. 8, 1255–1262.
Dubey, P., Geanakoplos, J., and Haimanko, O. (2005). “Prizes versus wages with envy and pride,” in Cowles Foundation Discussion Paper No. 1537, New Haven.
Duesenberry, J. S. (1949). Income, Savings and the Theory of Consumer Behavior. Cambridge, MA: Harvard University Press.
Dvash, J., Gilam, G., Ben-Ze’ev, A., Hendler, T., and Shamay-Tsoory, S. G. (2010). Envious brain: the neural basis of social comparison. Hum. Brain Mapp. 31, 1741–1750.
Dynan, K., and Ravina, E. (2007). Increasing income inequality, external habits, and self-reported happiness. Am. Econ. Rev. 97, 226–231.
Fehr, E., and Schmidt, K. M. (1999). A theory of fairness, competition and cooperation. Q. J. Econ. 114, 817–868.
Fliessbach, K., Weber, B., Trautmer, P., Dohmen, T., Sunde, U., Elger, C. E., and Falk, A. (2007). Social comparison affects reward-related brain activity in the human ventral striatum. Science 318, 1305–1308.
Glimcher, P. W., Camerer, C. F., Fehr, E., and Poldrack, R. A. (eds). (2008). Neuroeconomics: Decision Making and the Brain. New York: Academic Press.
Knoch, D., Pascual-Leone, A., Meyer, K., Treyer, V., and Fehr, E. (2006). Diminishing reciprocal fairness by disrupting the right prefrontal cortex. Science 314, 829–832.
Ljungqvist, L., and Uhlig, H. (2000). Tax policy and aggregate demand management under catching up with the joneses. Am. Econ. Rev. 90, 356–366.
Loomes, G., and Sudgen, R. (1982). Regret theory: an alternative theory of rational choice under uncertainty. Econ. J. 92, 805–824.
Luttmer, E. F. P. (2005). Neighbors as negatives: relative earnings and well-being. Q. J. Econ. 120, 963–1002.
MacDonald, A. W., Cohen, J. D., Stenger, V. A., and Carter, C. S. (2000). Dissociating the role of the dorsolateral prefrontal and anterior cingulate cortex in cognitive control. Science 288, 1835–1838.
McClure, S. M., Berns, G. S., and Montague, P. R. (2003). Temporal prediction errors in a passive learning task activate human striatum. Neuron 38, 339–346.
O’Doherty, J. P., Dayan, P., Friston, K. J., Critchley, H. D., and Dolan, R. J. (2003). Temporal difference models and reward-related learning in the human brain. Neuron 38, 329–337.
Preuschoff, K., Bossaerts, P., and Quartz, S. R. (2006). Neural differentiation of expected reward and risk in human subcortical structures. Neuron 51, 381–390.
Roussanov, N. (2010). Diversification and its discontents: idiosyncratic and entrepreneurial risk in the quest for social status. J. Finance 65, 1755–1788.
Sanfey, A. G., Rilling, J. K., Aronson, J. A., Nystrom, L. E., and Cohen, J. D. (2003). The neural basis of economic decision-making in the ultimatum game. Science 300, 1755–1758.
Singer, T., Seymour, B., O’Doherty, J. P., Stephan, K. E., Dolan, R. J., and Frith, C. D. (2006). Empathic neural responses are modulated by the perceived fairness of others. Nature 439, 466–469.
Takahashi, H., Kato, M., Matsuura, M., Mobbs, D., Suhara, T., and Okubo, Y. (2009). When your gain is my pain and your pain is my gain: neural correlates of envy and schadenfreude. Science 323, 937–939.
Weber, E. U., and Johnson, E. J. (2009). Mindful judgment and decision making. Annu. Rev. Psychol. 60, 53–86.
Yechiam, E., Druyan, M., and Ert, E. (2008). The effect of observing others on risk taking from experience. Judgm. Decis. Mak. 7, 493–500.
Appendix
In the section on the universal network for counterfactuals we focus on reporting results concerning the left ventral striatum. However, the results concerning the right ventral striatum are very similar, and we omitted them in the main text in order not to flood the reader with too many statistics, which we report here in the Appendix. The cluster of right ventral striatum identified as a part of the universal network for counterfactuals included 66 voxels at p < 0.01 (Bonferroni corrected). The coefficients on private (G0 = 0.61 with z = 5.68, p < 0.001) and social advantage (coefficient G1 = 1.08 with z = 10.56, p < 0.001) are positive and statistically significant. The difference in coefficients on social less private advantage is also positive and statistically significant (two-sided Wald test, χ2 = 11.61, p < 0.001). The analysis for responsibility factor shows the coefficients on chance advantage (coefficient 0.73, z = 6.79, p < 0.001) and personal advantage (coefficient 0.97 with z = 9.46, p < 0.001) to be positive and statistically significant, with the difference between the latter and the former positive and statistically significant (two-sided Wald test, χ2 = 2.86, p = 0.09).
As we did for the left ventral striatum in the main text to exclude the possibility that correlation of payoff and advantage drives the results we consider the model designs with advantage normalized to mean 0 and SD 1, without controlling for payoffs.
Considering environment factor we find that coefficients on normalized private (coefficient 3.39, Wilcoxon signed-rank test, z = 3.14, p = 0.002) and social advantage (coefficient 6.47, Wilcoxon signed-rank test, z = 3.92, p < 0.001) are positive and statistically significant. The difference between the latter and the former is also positive and significant (Wilcoxon signed-rank test, z = 2.54, p = 0.01). Switching to responsibility factor we observe that coefficients on normalized chance (coefficient 3.61, Wilcoxon signed-rank test, z = 3.25, p = 0.001) and personal advantage (coefficient 6.52, Wilcoxon signed-rank test, z = 3.70, p < 0.001) are positive and significantly different from 0. The difference between coefficients on personal less chance normalized advantage is positive but not significant as in the left ventral striatum (Wilcoxon signed-rank test, z = 1.38, p = 0.17). The non-parametric analysis of normalized advantage, without controlling for payoff, in principle confirms the results obtained in panel analysis when we controlled for payoffs.
To investigate the interaction between the two factors, environment and responsibility, we consider the disaggregated model design with all four treatments. We estimated neural CI (Eq. 3) in right ventral striatum cluster to be 2.12 and significantly different from zero (Wilcoxon signed-rank test, z = 1.98, p = 0.05). Further, for each participant we compute CI in the right striatal cluster and based on affective ratings, and found that the neural CI is positively correlated with behavioral CI (Pearson correlation coefficient is 0.22). The OLS regression of neural CI against behavioral CI gives positive coefficient 0.78 but not significant (p = 0.36). In the analogical robust regression the coefficient is 0.75 (p = 0.17), also not being significant. In contrast at the left ventral striatum the analogical coefficients were significant in both regressions.
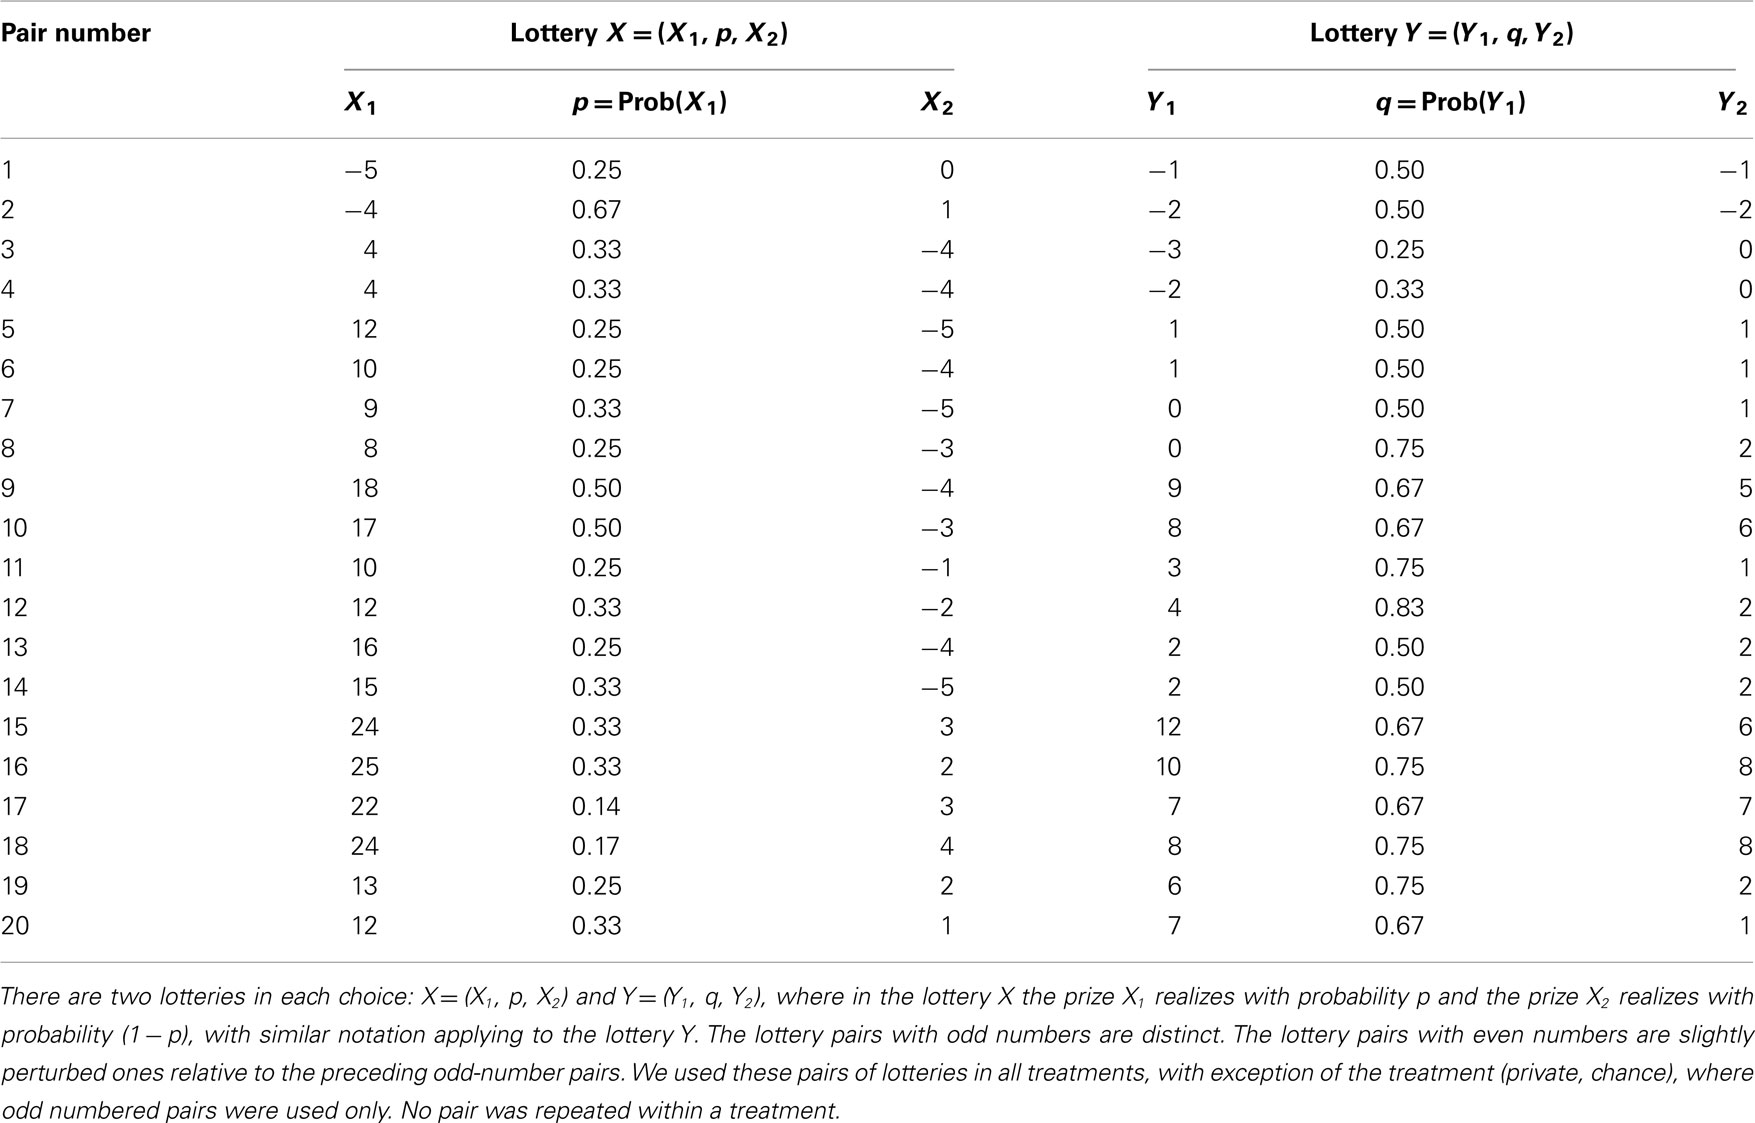
Table A1. Lotteries used in the experiment.
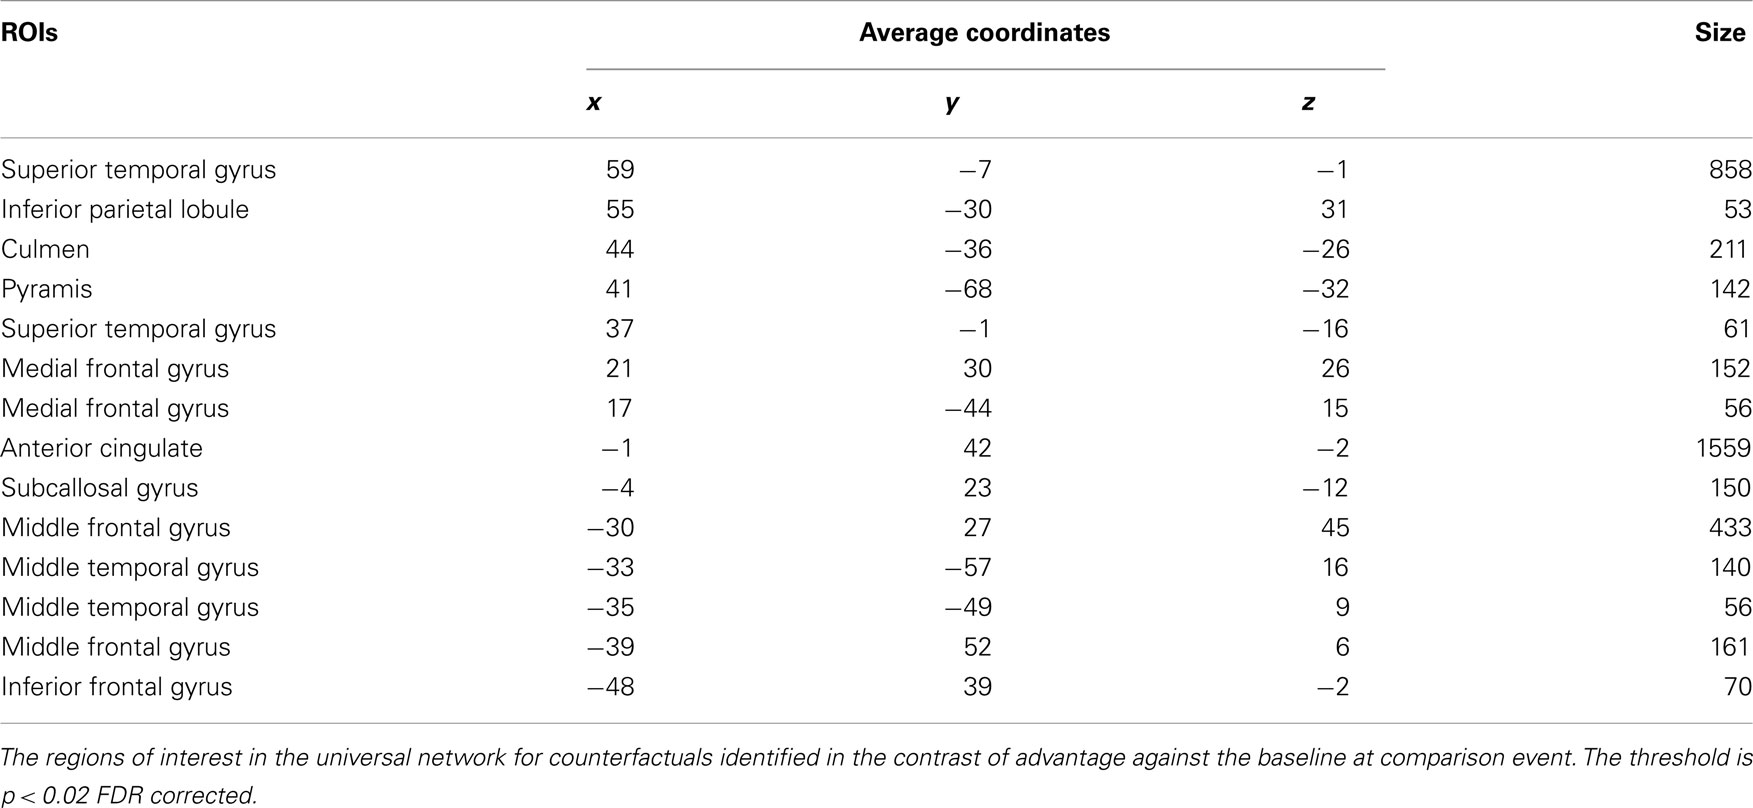
Table A2. Areas in universal network for counterfactuals.
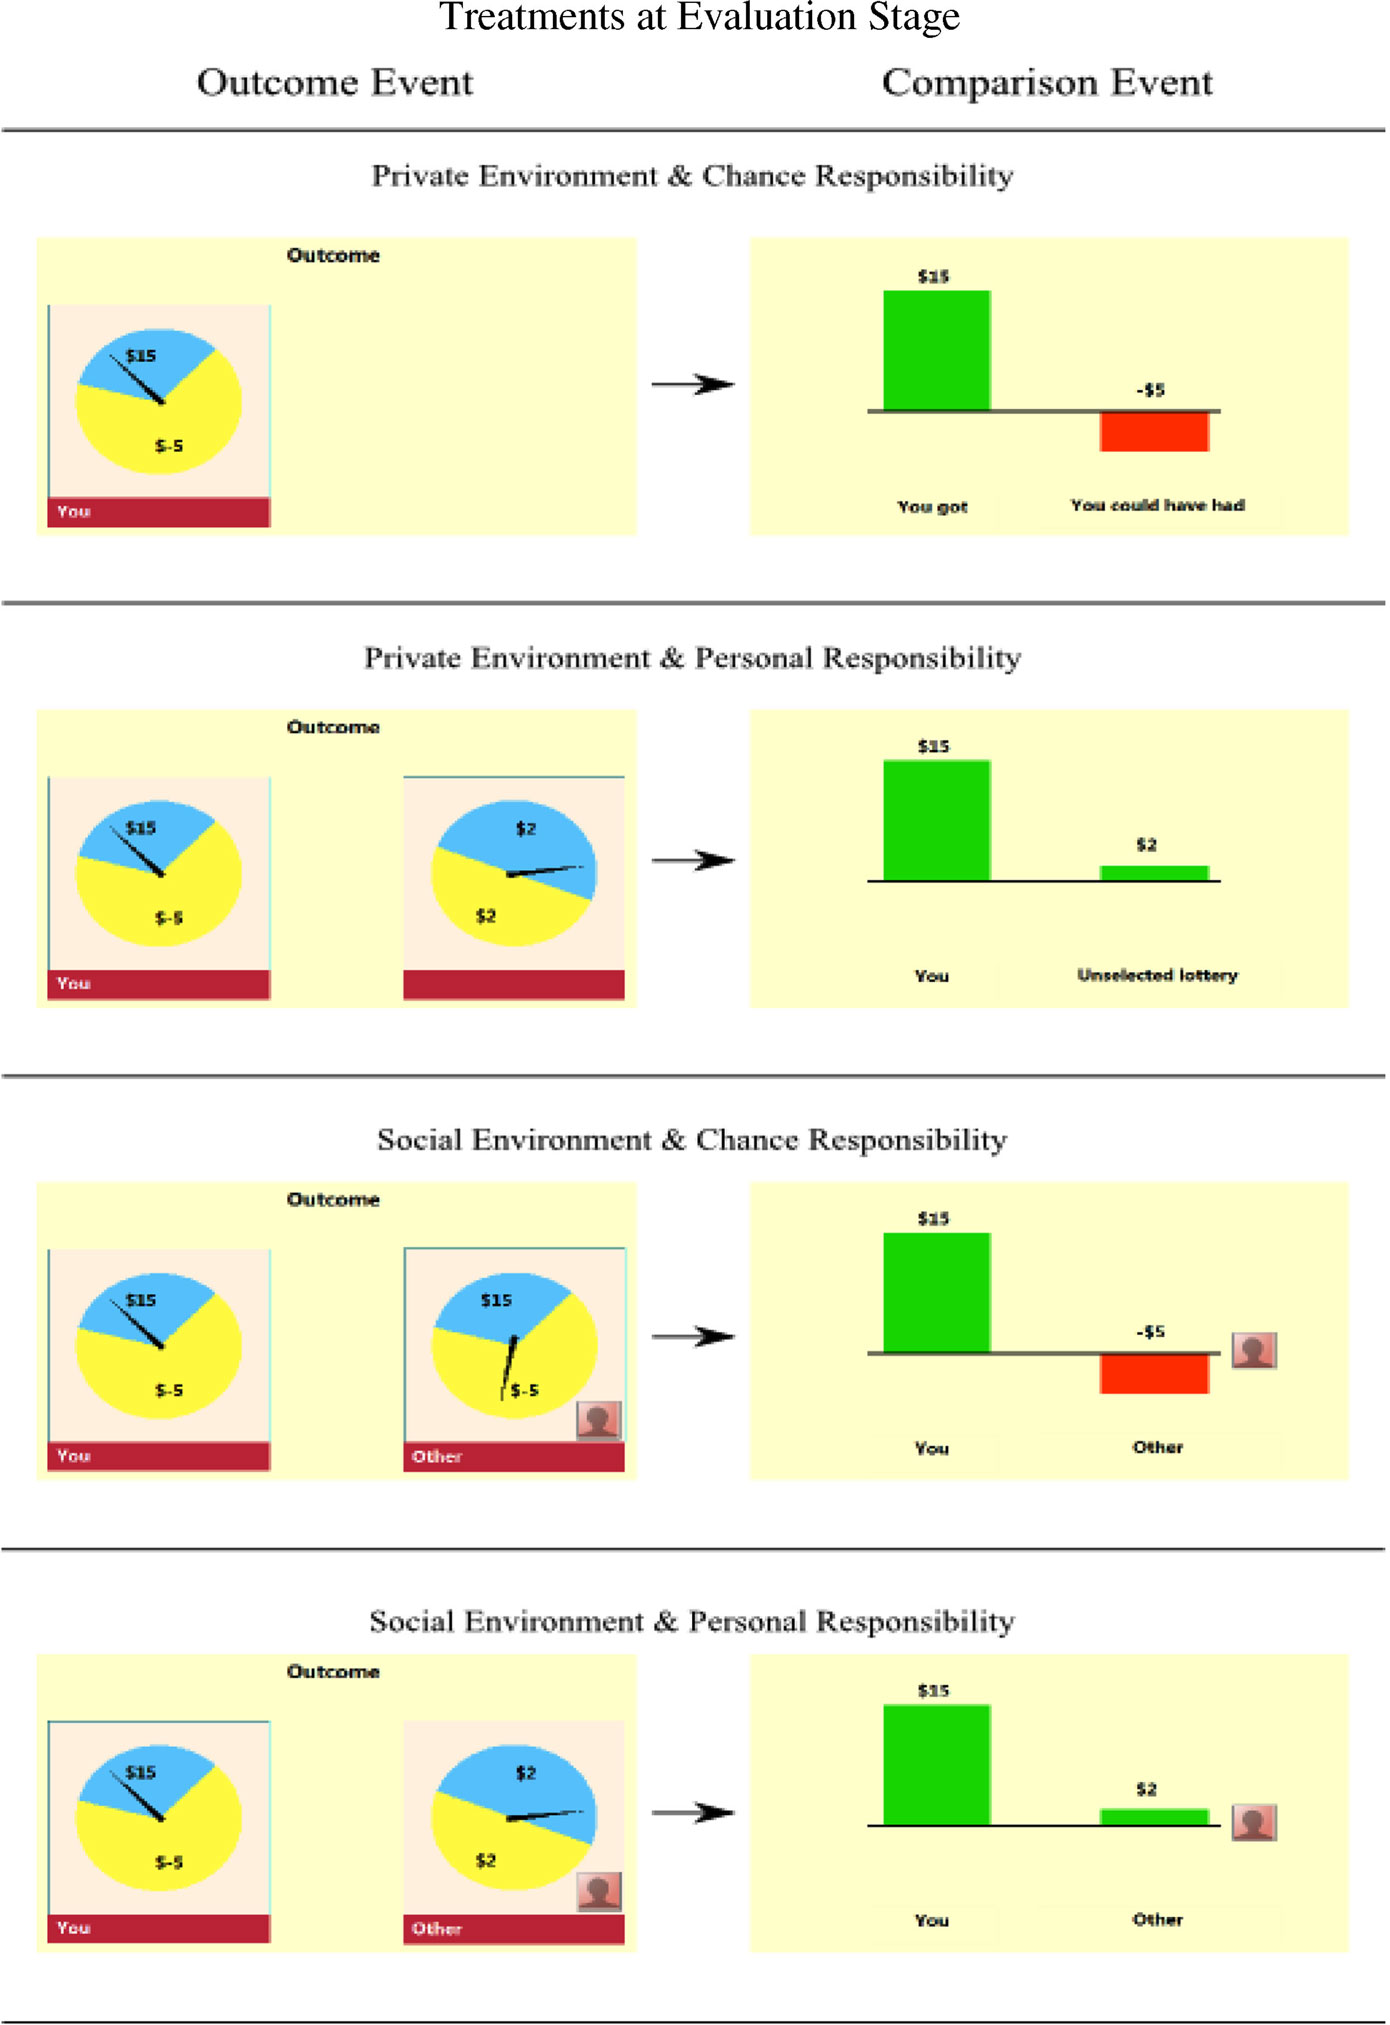
Figure A1. Treatments at evaluation stage as displayed to subjects. First outcome event is presented and then followed with comparison event.
Keywords: envy, pride, social comparison, responsibility, regret
Citation: Grygolec J, Coricelli G and Rustichini A (2012) Positive interaction of social comparison and personal responsibility for outcomes. Front. Psychology 3:25. doi: 10.3389/fpsyg.2012.00025
Received: 30 November 2011;
Paper pending published: 02 January 2012;
Accepted: 19 January 2012;
Published online: 22 February 2012.
Edited by:
Eldad Yechiam, Technion Israel Institute of Technology, IsraelReviewed by:
Hidehiko Takahashi, National Institute of Radiological Sciences, JapanEldad Yechiam, Technion Israel Institute of Technology, Israel
Copyright: © 2012 Grygolec, Coricelli and Rustichini. This is an open-access article distributed under the terms of the Creative Commons Attribution Non Commercial License, which permits non-commercial use, distribution, and reproduction in other forums, provided the original authors and source are credited.
*Correspondence: Giorgio Coricelli, Department of Economics, University of Southern California, 3620 South Vermont Avenue, Los Angeles, CA 90089-0253, USA. e-mail: giorgio.coricelli@usc.edu