 Eliza Congdon1,2* Jeanette A. Mumford3 Jessica R. Cohen4 Adriana Galvan5 Turhan Canli6 Russell A. Poldrack3,7
- 1 Center for Neurobehavioral Genetics, University of California Los Angeles, Los Angeles, CA, USA
- 2 Department of Psychiatry, Semel Institute for Neuroscience and Human Behavior, University of California Los Angeles, Los Angeles, CA, USA
- 3 Department of Psychology, University of Texas at Austin, Austin, TX, USA
- 4 Helen Wills Neuroscience Institute, University of California Berkeley, Berkeley, CA, USA
- 5 Department of Psychology, University of California Los Angeles, Los Angeles, CA, US
- 6 Department of Psychology, Stony Brook University, Stony Brook, NY, USA
- 7 Department of Neurobiology, University of Texas at Austin, Austin, TX, USA
Response inhibition plays a critical role in adaptive functioning and can be assessed with the Stop-signal task, which requires participants to suppress prepotent motor responses. Evidence suggests that this ability to inhibit a prepotent motor response (reflected as Stop-signal reaction time (SSRT)) is a quantitative and heritable measure of interindividual variation in brain function. Although attention has been given to the optimal method of SSRT estimation, and initial evidence exists in support of its reliability, there is still variability in how Stop-signal task data are treated across samples. In order to examine this issue, we pooled data across three separate studies and examined the influence of multiple SSRT calculation methods and outlier calling on reliability (using Intra-class correlation). Our results suggest that an approach which uses the average of all available sessions, all trials of each session, and excludes outliers based on predetermined lenient criteria yields reliable SSRT estimates, while not excluding too many participants. Our findings further support the reliability of SSRT, which is commonly used as an index of inhibitory control, and provide support for its continued use as a neurocognitive phenotype.
Introduction
Response inhibition, the ability to inhibit a response in the face of changing internal or external demands, underlies a range of behaviors critical for adaptive functioning. Given its important role in the ability to respond flexibly in a dynamic environment, along with widespread evidence supporting the role of impaired inhibitory control in multiple psychiatric illnesses, response inhibition has become a central candidate in genetic and neurobiological investigations of executive functioning. Its suitability as an intermediate phenotype, however, requires ongoing inspection of its measurement and reliability. The purpose of the present set of analyses was to examine the reliability of a specific measure of response inhibition (Stop-signal reaction time (SSRT)) and determine the optimal method of calling outliers in order to ensure robust estimates of inhibitory control.
Response inhibition is primarily measured by Stop-signal and Go/NoGo tasks, although there are important differences between these two tasks. While the Go/NoGo task (which requires participants to respond to one set of stimuli and to not respond to another set of stimuli) primarily provides an index of inhibition failure, or commission errors, the Stop-signal task is somewhat unique in that it provides an individualized measure of stopping latency. In the Stop-signal task, participants respond to one set of stimuli and, on a subset of trials, must inhibit an ongoing or already initiated response in the presence of a stop-signal (for a more complete description, see Logan and Cowan, 1984; Logan et al., 1984). In the tracking version of the task, the onset of this stop-signal is varied dynamically in response to a participant’s performance, such that it is increased after a previously successful inhibition trial (making the next stop trial more difficult) and decreased after a previously unsuccessful inhibition trial (making the next stop trial less difficult).
Although successful inhibition produces no overt behavior, we can estimate stopping latency based on the horse-race model, which is a formal theory underlying the task and described elsewhere (including Logan et al., 1984; Logan, 1994; Boucher et al., 2007). Briefly, this horse-race model of stopping posits that competing go and stop processes race against each other in order to determine whether a participant fails to inhibit or is successful in inhibiting a response on a given trial, respectively. This allows us to estimate an individual’s stopping latency, or average stop-signal reaction time (SSRT). As comprehensively described in Band et al. (2003), there are multiple methods for estimating SSRT. One such method, referred to here as the quantile method, has been shown to be reliable and robust against violations of assumptions underlying the horse-race model (Logan et al., 1997; Williams et al., 1999; Band et al., 2003).
This individualized measure of stopping latency (SSRT), when using the tracking procedure, controls for task difficulty level, individual differences in go reaction time (Band et al., 2003), and has been shown to be a valid index of inhibitory control. Specifically, SSRT has been shown to vary as a function of impulsivity (Logan et al., 1997; Lijffijt et al., 2004), and to distinguish samples with impaired inhibitory control from controls (Schachar et al., 1993; Lijffijt et al., 2005). SSRT has also been shown to be sensitive to pharmacological manipulation (Tannock et al., 1995; Rubia et al., 2011), and related to neural activation as measured using functional magnetic resonance imaging (fMRI; Aron and Poldrack, 2006; Congdon et al., 2010), providing additional support for its usefulness as an indicator of neurobiological function. In addition to evidence in support of its validity, studies have also demonstrated suitable reliability of SSRT estimates (Logan et al., 1997; Williams et al., 1999), and have suggested that the Stop-signal tracking procedure is robust for estimating SSRT across the life span (Williams et al., 1999).
Previous attention has therefore been given to the optimal method of estimating SSRT (Logan et al., 1997; Band et al., 2003) and there is enough evidence of the reliability of SSRT to support its current widespread use. Together, these studies have contributed greatly to our understanding of the horse-race model of stopping and have provided useful guidelines for estimating SSRT. However, there is still widespread variability in how Stop-signal data are treated en route to SSRT estimation (that is, how the data from multiple sessions, trials, and subjects are handled for analysis), which creates variability in how response inhibition is operationalized. For example, Rush et al. (2006) report excluding the first two blocks of testing from their analyses, while Bedard et al. (2002) excluded the first block of trials from their analyses. In another example, Aron and Poldrack (2006) used a subset of data (based on the point at which the participant achieved 50% inhibition) for calculation of SSRT. Most commonly, however, reports do not include details regarding these steps (including some of our own; Congdon et al., 2009), warranting closer inspection of how these differences may influence SSRT reliability and stability.
In order to systematically address these issues, we conducted a reliability analysis of SSRT calculation, with reliability meaning the consistency or reproducibility of this measure across multiple observations. We pooled data from three separate studies in order to examine the influence that different methods of SSRT calculation and outlier calling have on the reliability of SSRT scores. There are several decisions to make when estimating SSRT from multiple runs (or sessions), including whether to average across all available runs or to use the last run (based on the assumption that, when using the tracking procedure, participants are closest to their 50% inhibition point at the end of the run). Similarly, within each run, it is possible to use data from all trials of the run or the last half only (again, based on the assumption that participants stabilize near the end of the run when using the tracking procedure). Finally, it is possible to use data from all participants regardless of performance, or to use either lenient or conservative criteria to exclude outliers. As each of these decisions has implications for not only the stability of the SSRT estimate obtained across runs, but also the resulting sample size, we examined the influence of how many trials were selected and how outliers were determined on the reliability, reproducibility, and variability of SSRT. Our results suggest that there are important differences between these possible approaches. We conclude that one approach (which used an average of all available runs, all trials from each run, and excluded outliers based on predetermined lenient criteria) yields reliable SSRT estimates while retaining a large proportion of subjects tested.
Materials and Methods
Stop-Signal Task and SSRT
The Stop-signal task is a widely used measure of response inhibition and the main dependent variable of the task, SSRT, provides an individualized measure of inhibitory control. Participants are presented with a series of Go stimuli to which they are instructed to respond quickly; for example, participants see a series of left- or rightward pointing arrows and are instructed to press the right button for a right arrow and a left button for a left arrow. This speeded reaction time task establishes a prepotency to respond. On a subset of trials, the Go stimulus is followed, after a variable delay, by a stop-signal (for example, a beep or an upward pointing arrow), to which participants are instructed to inhibit their response. The onset of the stop-signal, or stop-signal delay (SSD), is varied and depends on the participant’s performance, such that it is decreased after a previous failure to inhibit and increased after a previous inhibition (resulting in SSD staircases across the course of the task). This one-up/one-down tracking procedure ensures that participants inhibit on approximately half of all trials and controls for difficulty level across participants. As described above, to estimate stopping latency we can apply a horse-race model to the task, which assumes that independent go and stop processes race against one another to determine whether a response is executed or inhibited (Logan and Cowan, 1984; Logan, 1994; though the model is robust to violations of this assumption; Band et al., 2003).
Samples
All samples included right-handed healthy English-speaking subjects, free of neurological or psychiatric history, not currently taking psychoactive medication, and with normal or corrected-to-normal vision.
Sample 1 includes data from 52 healthy young adult participants (22 males; mean age, 23.31 (4.51 SD) years). These data were collected by EC and TC; for a full description of sample and task details, see Congdon et al. (2009). Sample 2 includes data from 85 healthy young adult participants (42 males; mean age, 21.24 (3.32 SD) years). These data were collected by JRC and RAP; for a full description of sample and task details, see Congdon et al. (2010); under Sample 2. Sample 3 includes data from 30 healthy adult participants (11 males; mean age, 27.80 (8.98 SD) years); these data were collected by EC and RAP.
Participants were instructed to inhibit responses on trials in which the stop-signal appears, and were told that correctly responding and inhibiting were equally important. All studies included tracking versions of the Stop-signal task: the SSD for each stop trial was selected from one or two interleaved staircases of SSD values, with each SSD increasing or decreasing by 50 ms according to whether or not the participant successfully inhibited on the previous stop trial.
Participants in Sample 1 performed a version of the Stop-signal task with left- and rightward pointing arrows (Go stimuli) and upward pointing arrows (Stop-signal), while participants in Samples 2-3 performed a version of the Stop-signal task with left- and rightward pointing arrows inside of a circle (Go stimuli) and an auditory stop-signal. In Sample 1, stimuli were presented for 500 ms followed by a 1.5-s fixation; in Samples 2-3, stimuli were presented for 1 s or until the participant responded. In all studies, Stop-signals were presented after the onset of a Go stimulus after a variable delay. Jittered null events were imposed between every trial, with the duration of the null event sampled from an exponential distribution (null events ranged from 0.5 to 4 s, with a mean of 1.75 s for Sample 1 and a mean of 1 s for Samples 2-3).
For Sample 1, the onset of the Stop-signal on the first trial was 250 ms and increased/decreased according to a participant’s performance on subsequent trials. For Samples 2-3, the SSD for each stop trial was selected from one of two interleaved staircases, each starting with SSD values of 250 and 350 ms. In contrast to Sample 1, the last SSD values of the two ladders were used as starting values for each subsequent run. The total number of trials collected from each sample are presented in Table 1. Samples 1-2 completed three runs of the task, while Sample 3 completed one run of the task. Participants in Sample 2 performed runs 2-3 of the task at a variable delay after the first administration of the task, whereas participants in Samples 1 and 3 performed all runs during the same testing session.
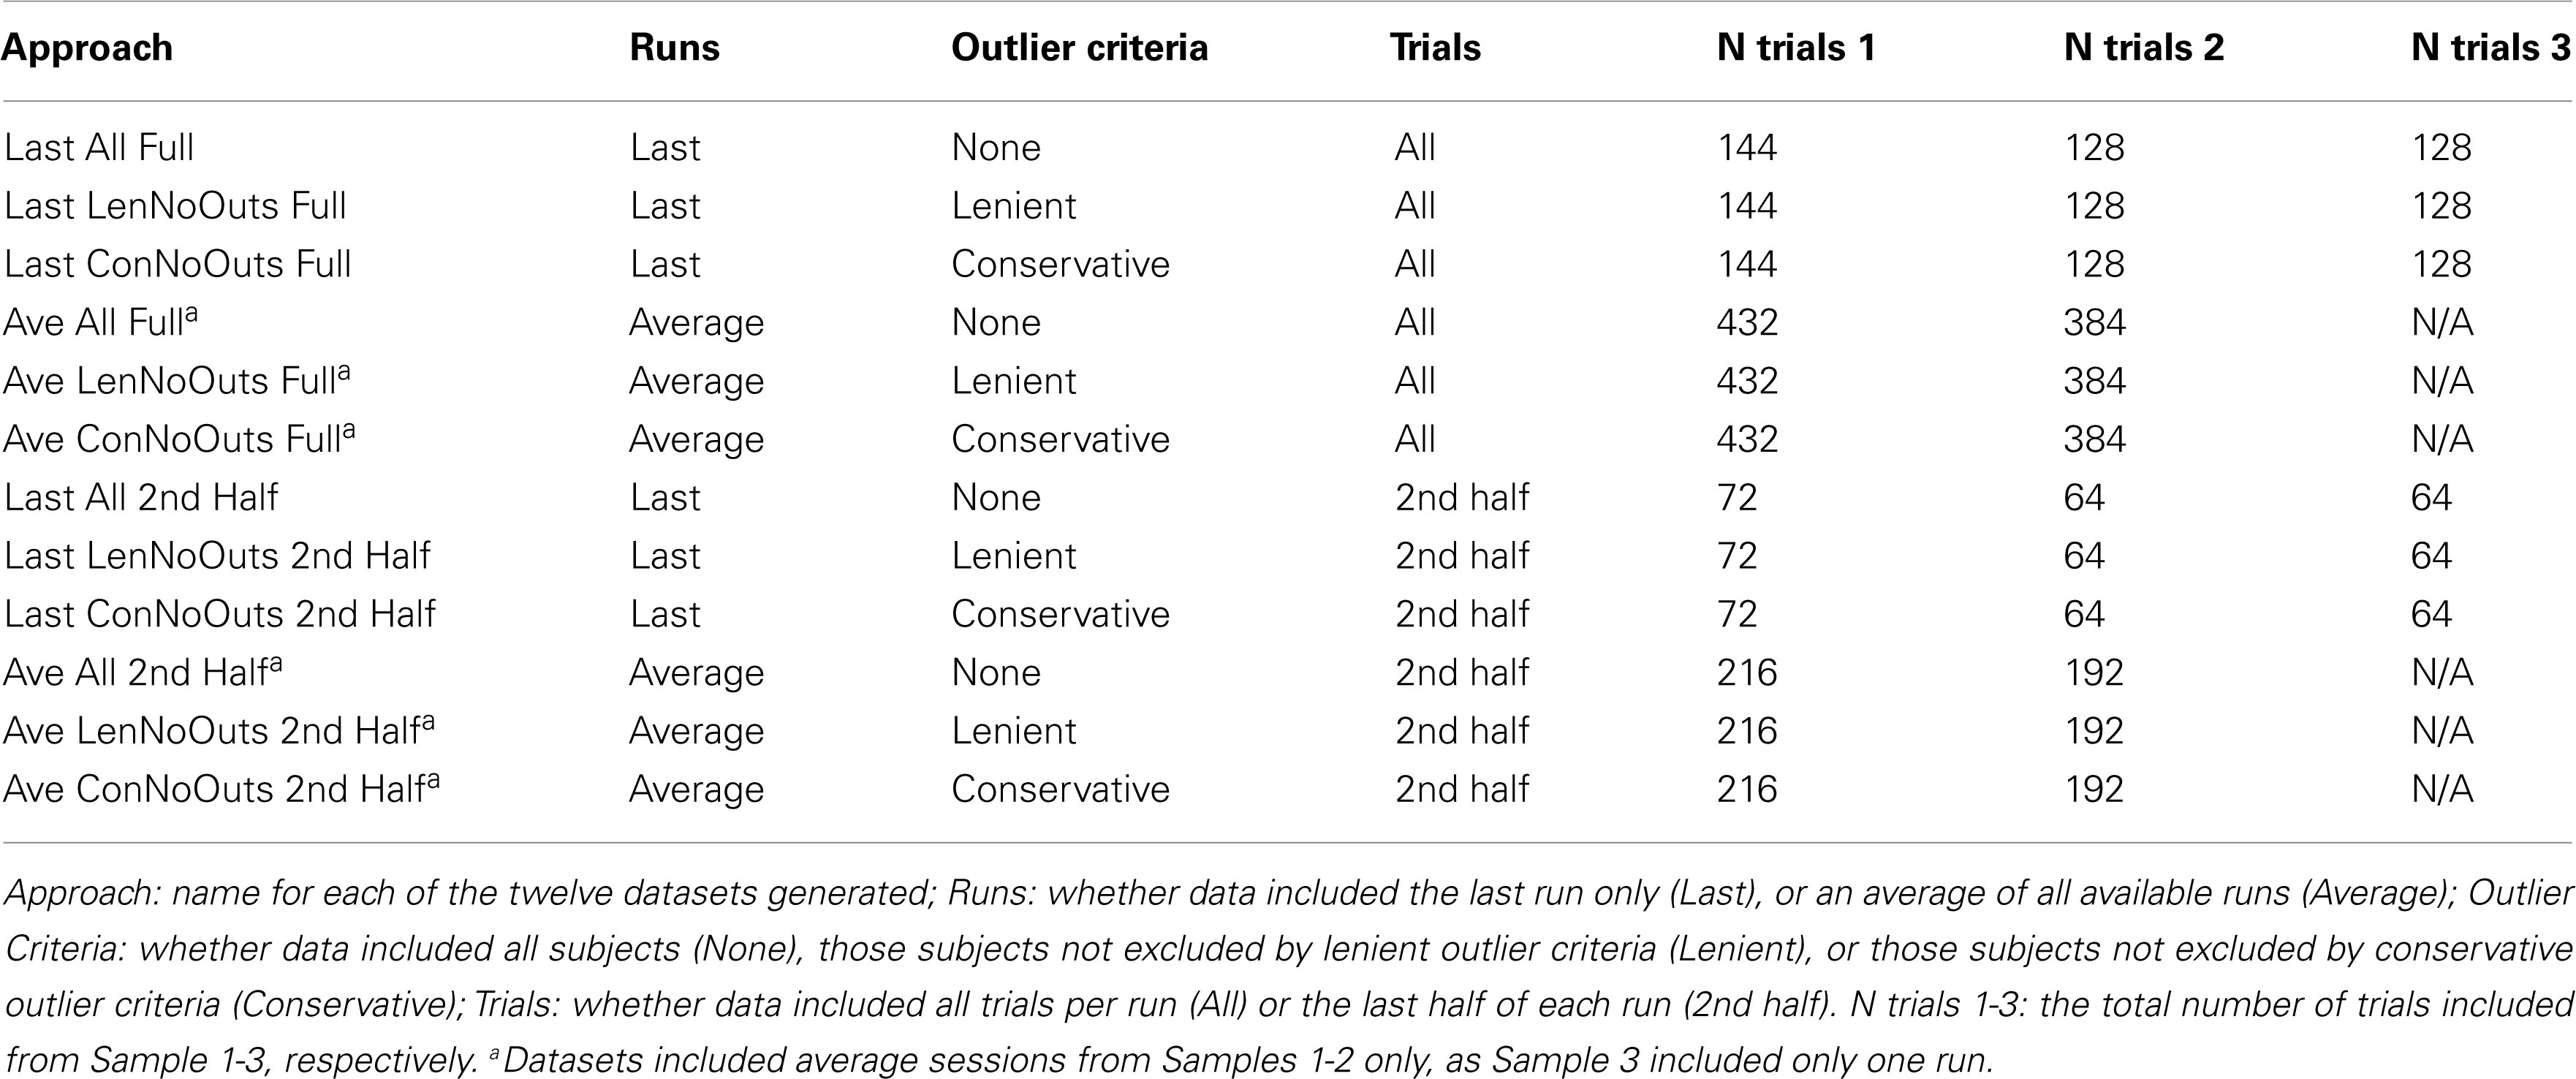
Table 1. Twelve approaches to SSRT calculation.
All participants gave written informed consent according to the procedures approved by the Yale University School of Medicine Institutional Review Board (Sample 1) the University of California Los Angeles Institutional Review Board (Sample 2) or the University of Texas at Austin Institutional Review Board (Sample 3).
Data Analysis
Scoring of behavioral data proceeded as follows: the mean, median, and standard deviation of reaction time on Go trials were calculated only for Go trials in which participants correctly responded. There are two possible types of errors on Go trials: Incorrect go responding, in which the participant fails to make a response on a Go trial (“Go-Omissions”); and Incorrect go trials (“Go-Errors”), in which the participant makes an incorrect response on a Go trial (e.g., presses left button in response to a rightward pointing arrow). Stop successful trials included only Stop trials on which participants successfully inhibited a response, and Stop unsuccessful trials included only Stop trials on which participants responded. Average SSD was calculated from all SSD values. SSRT was estimated using the quantile method, which does not require an assumption of 50% inhibition, as follows: all RTs on correct Go trials were arranged in ascending order, and the RT corresponding to the proportion of failed inhibition (or 1-percent Stop successful inhibition) was selected (for more details on the quantile method, see Band et al., 2003). The average SSD was then subtracted from this quantile RT, providing an estimate of SSRT. In this way, SSRT reflects the average time (in ms) that the individual requires in order to successfully inhibit a motor response approximately 50% of the time (Logan and Cowan, 1984; Logan, 1994; Band et al., 2003), or stated differently, represents the point at which the race between go and stop processes ends in a tie, thus providing an individualized measure of inhibitory control.
In order to investigate different calculation methods, 12 separate approaches were used to calculate the above summary measures (see Table 1). These 12 different approaches consisted of all combinations of three possible outlier criteria (None, Lenient, and Conservative), using four different ways of subsetting the data (using the Last run only with All trials, Last run only with 2nd Half of trials, Average across runs with All trials of each run, and Average across runs with 2nd Half of trials of each run). Our lenient outlier criteria were as follows: (1) Percent inhibition on stop trials less than 25% or greater than 75%; (2) Percent Go-Response less than than 60%; (3) Percent Go-Errors greater than 10%; and (4) SSRT estimate that is negative or less than 50 ms. Our conservative outlier criteria were as follows: (1) Percent inhibition on stop trials less than 40% or greater than 60%; (2) Percent Go-Response less than 75%; (3) Percent Go-Errors greater than 10%; and (4) SSRT estimate that is negative or less than 50 ms.
The reason for comparing the inclusion of all runs vs. last run only, and all trials vs. last half of trials only, is described above; namely, the latter option may be preferred by users given the assumption that participants are closer to their 50% inhibition point toward the end of a given run or testing session. The reason for excluding outliers based on the above criteria is to ensure that participants are following task instructions and sufficiently engaging the stopping process, as indicated by an inhibition rate close to 50%, a response rate close to 100%, a low error rate, and reasonable SSRT estimates. First, excluding estimates of average stopping latency below 50 ms is akin to excluding Go reaction times that are under 50 ms, which is common practice in the literature, and in particular, negative SSRT values are thought to reflect deliberate slowing of go responses, which violates a key assumption of the horse-race model. Second, based on our collective experience with data resulting from the Stop-signal task, the lenient criteria reflect cut-offs that are in line with values that fall two standard deviations outside of the mean, while conservative cut-offs align with values that fall one standard deviation outside of the mean, for Percent Inhibition, Go-Response, and Go-Errors.
These three separate approaches were applied to data, thereby yielding 12 separate datasets. In order to examine reliability within Stop-signal performance data, each run was randomly split into halves. Specifically, for performance data from each subject, and each run, go and stop trials were randomized separately, after which go and stop trials were split into random halves. In order to ensure that any one randomization was not driving the results of a given approach, this randomization step was repeated 500 times for each subject’s run, for each of the 12 approaches, yielding 500 datasets per approach. Summary measures were then calculated using these datasets, and averaged across iterations. For approaches that included more than one run, the average of the first halves (first halves of runs 1 through 3) were compared to the average of the second halves (second halves of runs 1 through 3). Behavioral analyses were conducted on all three sessions of Samples 1-2. In cases where performance on one run was too poor for inclusion, the average of the remaining runs was used. In the case of Sample 3, which only includes one run, the single run was included as a last session (Last), but these participants were excluded from average analyses (Ave).
This split-half approach enabled us to calculate Intra-class correlation (ICC) coefficients between the two halves, for each of the 12 approaches to scoring data. ICC coefficients index consistency or reliability in some measure across repeated testings, with reliable measures reflected by high ICC values, and are similar to Pearson’s correlation coefficients, ranging from 1.0 (high) to −1.0 (although negative ICC values can be treated as 0). ICC (1) version was used in all instances (Shrout and Fleiss, 1979), which reflects the ratio of between-subject variance to total variance (between- and within-subject variance). It has been suggested that ICC values are sensitive to between-subject variation or sample heterogeneity, that is, that the ICC coefficient can vary according to the spread of the data in the sample (Bland and Altman, 1986). In order to address this, we calculated several additional summary measures, including the absolute mean difference between SSRT values calculated from the two random halves of the data, and the proportion of subjects with an average SSRT value that fell three standard deviations above the group mean for each approach. Each of these summary measures was calculated using data from the set of subjects included in each approach (sample sizes are listed in Table 2) and averaged across the 500 iterations.
Results
As our goal was not to solely examine SSRT reliability, but to examine the influence that SSRT calculation methods and outlier calling has on resulting SSRT reliability estimates, several indicators were used to evaluate these different approaches, including ICC, variability, and sample size. ICC values index the degree to which a participant’s score on some variable is consistent, and were interpreted according to Cicchetti’s guidelines for reliabilities: ICC < 0.40 is poor, 0.40-0.59 is fair, 0.60-0.74 is good, and 0.75-1.00 is excellent (Cicchetti, 2001). The standard deviation of SSRT values, which are calculated using those subjects included in each dataset and averaged across iterations, index the variability in SSRT values between subjects, while the absolute mean difference values index the stability of SSRT estimates between repeated random splits. Finally, the proportion of subjects that fall three standard deviations above the group mean reflects likely outliers within each dataset. These values supplement inspection of plots presented in Figures 1 and 2, which reflect SSRT calculated from two random halves according to each of the twelve approaches, with SSRT values from the first random half of data plotted against SSRT values from the second random half of data. SSRT values from a single iteration are presented in Figures 1 and 2 in order to illustrate the data that were used in each of the 500 iterations to produce the summary measures presented in Table 2. We repeated the random splitting of each run, for each of the twelve approaches, 500 times in order to ensure that ICC values were not driven by a given random splitting of the data for any one approach. The distribution of resulting ICC values are presented as boxplots in Figure 3. Finally, although all analyses were conducted within-subject, differences in SSRT between studies could influence the variability of SSRT if pooled across all studies, and so standard deviations for the different approaches are calculated within-study (Table 3).
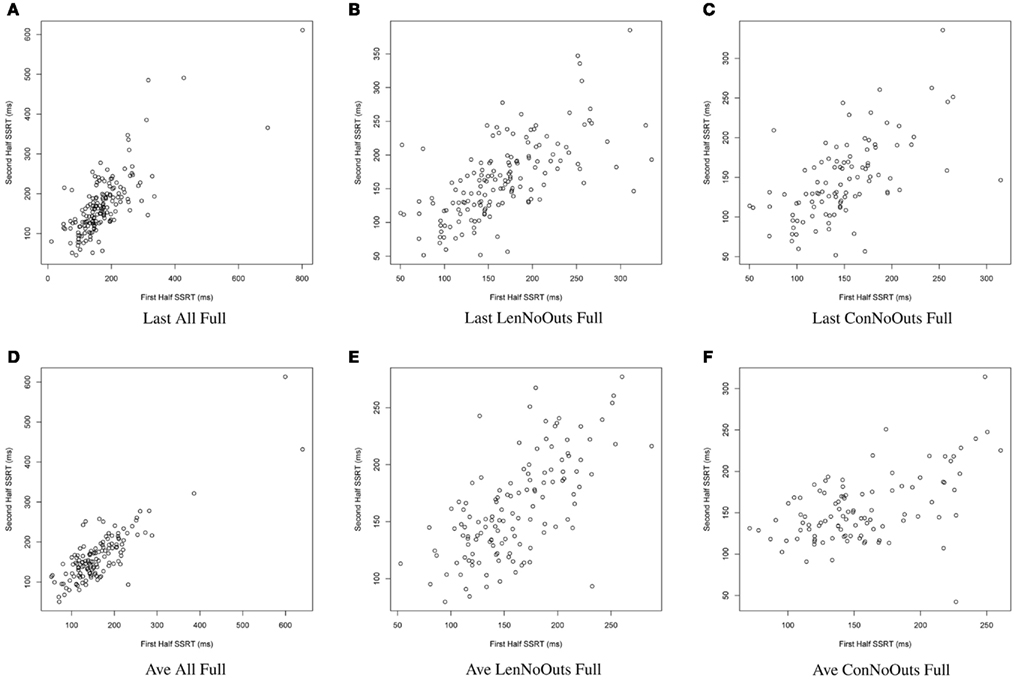
Figure 1. SSRT calculation approaches (A–F): plots of SSRT calculated from two random halves of trials according to the first six approaches. SSRT values (in ms) from the first random half of data (x-axis) are plotted against SSRT values from the second random half (y-axis) from a single iteration. The top row includes the last run of all available runs, while the bottom row includes an average of all available runs. The first column includes all available subjects; the second column excludes those subjects exceeding Lenient Outlier criteria; and the third column excludes those subjects exceeding Conservative Outlier criteria. Each of these six approaches used all trials from the selected runs. SSRT, stop-signal reaction time.
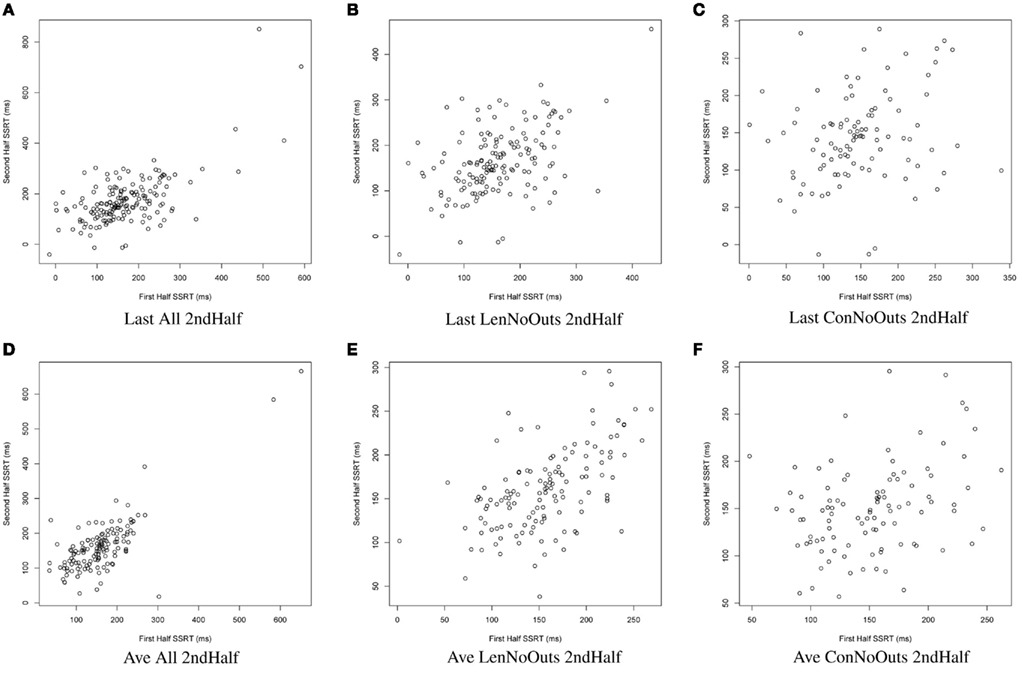
Figure 2. SSRT calculation approaches (A–F): plots of SSRT calculated from two random halves of trials according to the latter six approaches. SSRT values from the first random half of data (x-axis) are plotted against SSRT values from the second random half (y-axis) from a single iteration. The top row includes the last run of all available runs, while the bottom row includes an average of all available runs. The first column includes all available subjects; the second column excludes those subjects exceeding Lenient Outlier criteria; and the third column excludes those subjects exceeding Conservative Outlier criteria. Each of these six approaches used only the second half of trials from the selected runs. SSRT, stop-signal reaction time.
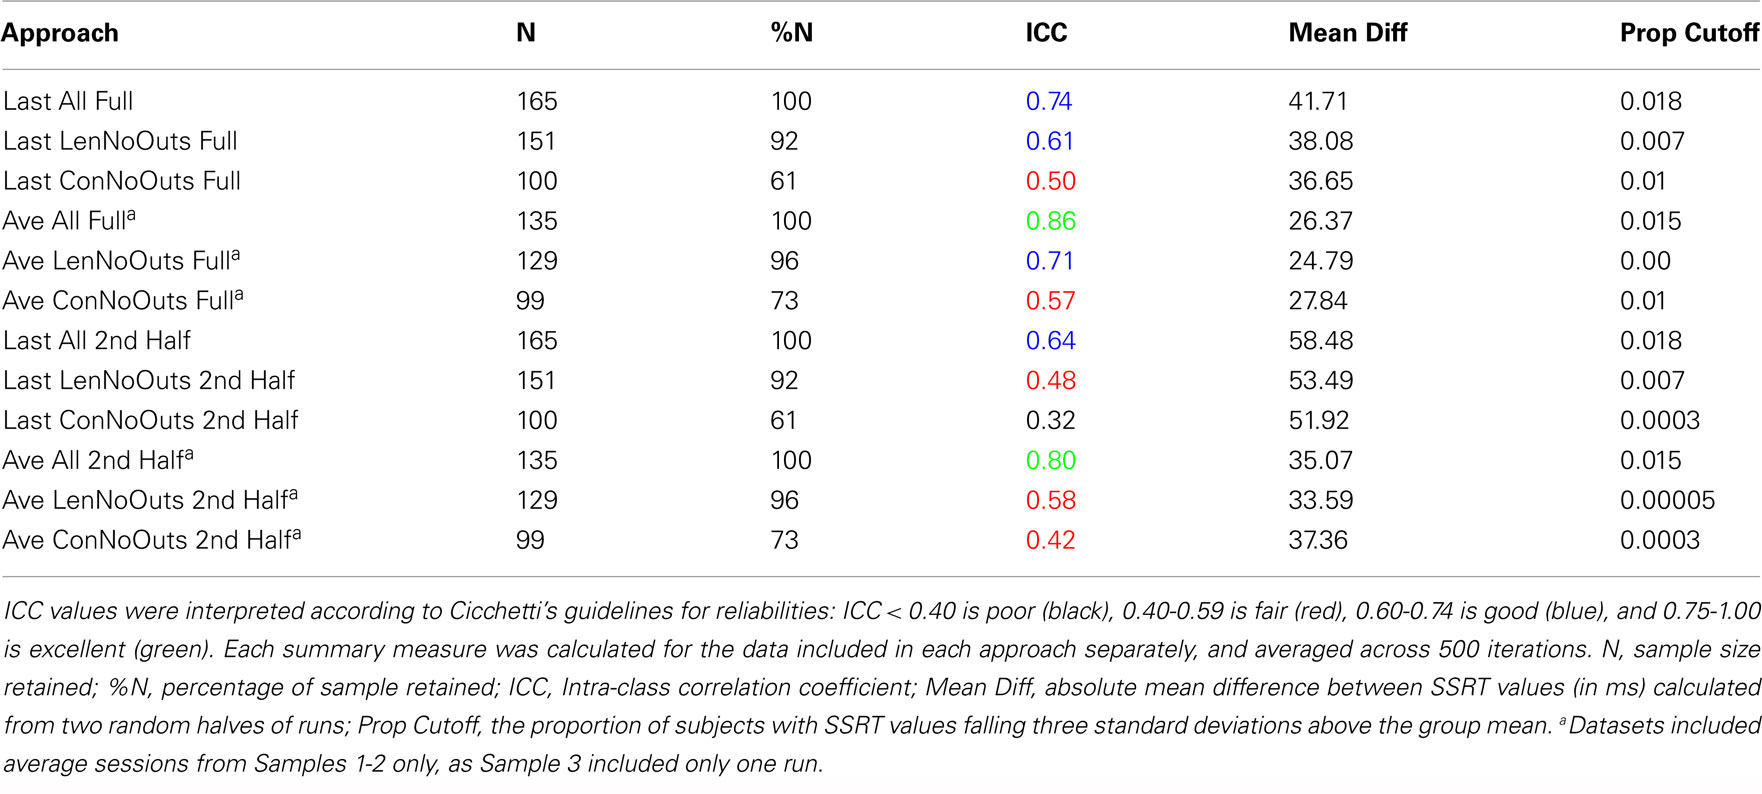
Table 2. Reliabilities of SSRT calculation approaches.
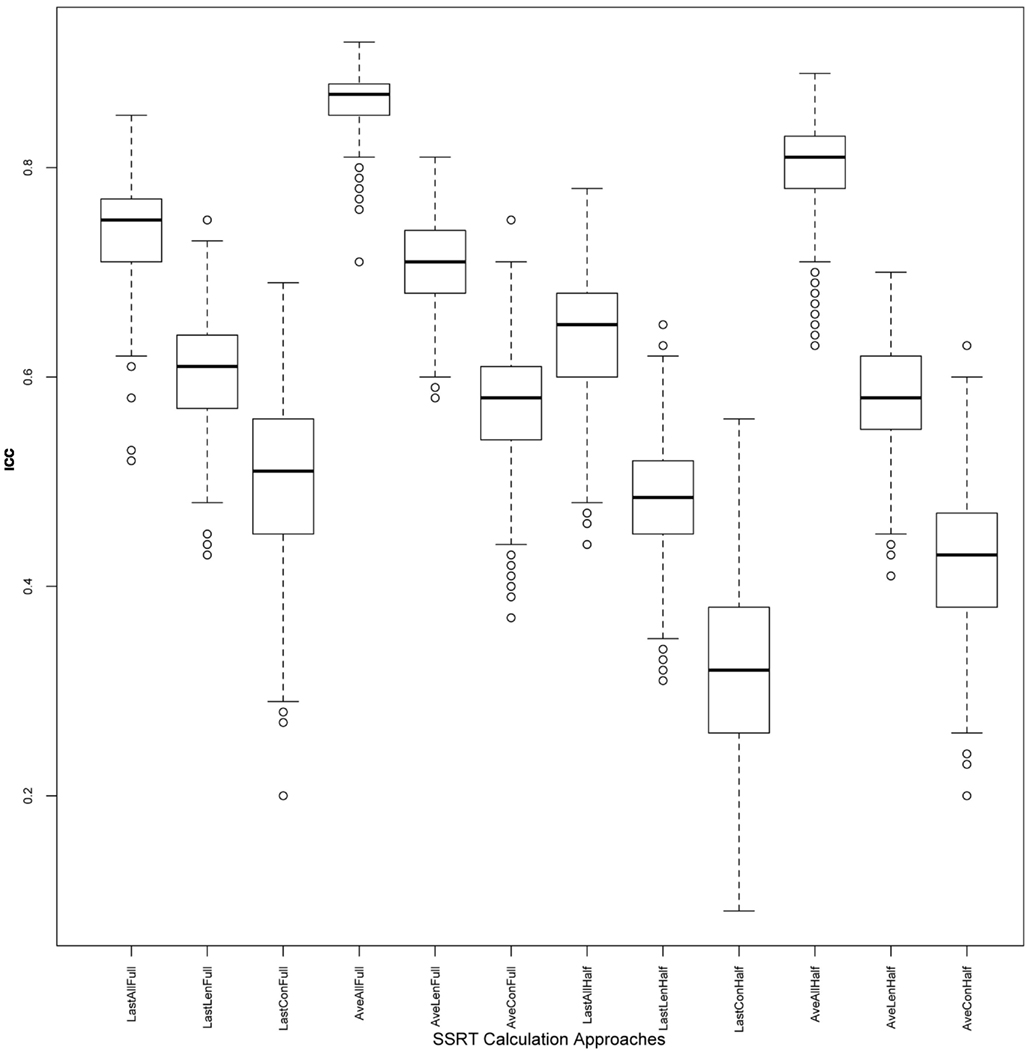
Figure 3. ICC values across iterations: boxplots illustrating distribution of ICC values, for each of the 12 approaches, across 500 iterations. ICC, intra-class correlation coefficient; SSRT, stop-signal reaction time.
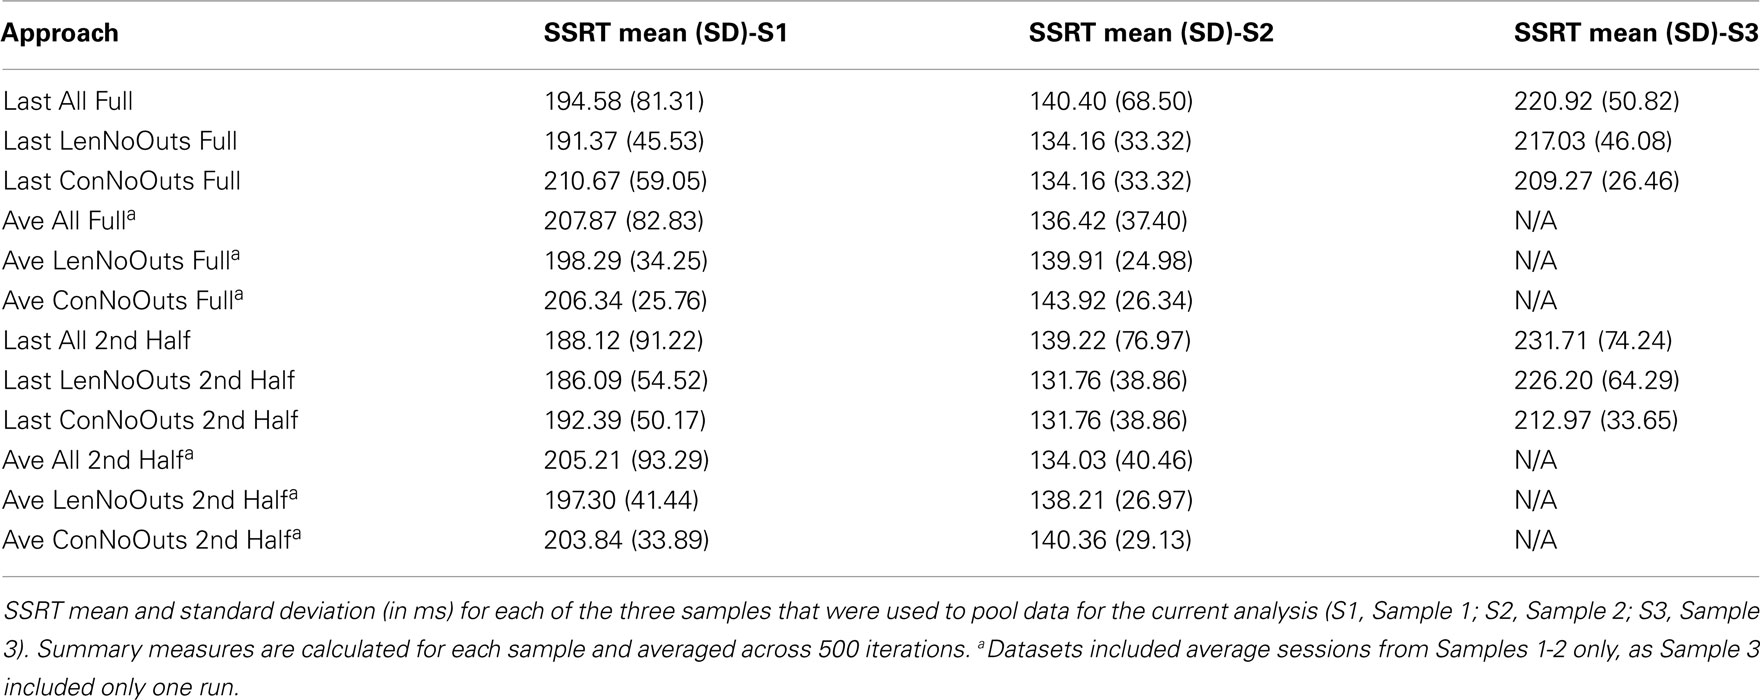
Table 3. SSRT summaries by group and SSRT calculation approaches.
Reliabilities of SSRT values calculated from each of the 12 approaches are presented in Table 2. While the majority of ICC values fall in the fair-to-excellent range (0.42-0.86), with one ICC value falling in the poor range (0.32), there are important differences between approaches. ICC values from approaches using all trials of each session (rows 1-6, 0.50-0.86) are higher than approaches using only the second half of a session (rows 7-12, 0.32-0.80). In addition, ICC values are higher for approaches using an average of all available sessions (rows 4-6 and 10-12, 0.42-0.86) than using only the last available session (rows 1-3 and 7-9, 0.32-0.74), even though ICC coefficients were only calculated using data from Samples 1-2 (with included more than one run) for the Average approach. In order to ensure that the inclusion of data from Sample 3 in approaches that used only the Last session (as Sample 3 included only one run and therefore may not have been able to estimate SSRT as reliably as the other samples), were not driving down ICC estimates, we calculated ICC values for approaches in rows 1-3 (all trials of Last session) and 7-9 (2nd half of Last session) without Sample 3. In each case, the resulting ICC coefficients were either the same as those listed in Table 2, or worse (results not presented).
Of these 12 approaches, the approaches that included all trials within each session and an average of all available sessions (rows 4-6) had overall higher ICC values while retaining the most usable subjects, as compared to the remaining sets of approaches. While the ICC coefficients between SSRT halves were highest when using all available subjects, sessions, and trials (row 4), an inspection of our additional summary measures paired with the distribution of SSRT values in Figure 1D reveals the presence of clear outliers. That is, when using an average of all available subjects, sessions, and trials (row 4, Ave All Full), we find an ICC coefficient of 0.86 and relatively high group SSRT standard deviations (SSRT mean and standard deviation values are provided, per group, in Table 3). When using an average of all available subjects and sessions, but excluding outliers based on lenient criteria (row 5, Ave LenNoOuts Full), we find an ICC coefficient of 0.71 and low group SSRT standard deviations. In the case of Sample 2, this approach produces the lowest SSRT standard deviation for this sample. In addition, while over 1% of the sample had SSRT values that were three standard deviations above the mean for the Ave All Full approach (row 4), none of the subjects were classified as outliers for the Ave LenNoOuts Full approach (row 5). This difference is best reflected in the first and second plots of the bottom panel of Figure 1, with clear outliers present in Figure 1D and absent in Figure 1E.
An approach using the average of all sessions and all trials but that excluded subjects according to conservative criteria (row 6, Ave ConNoOuts Full) resulted in an ICC value of 0.57, but also resulted in the exclusion of 36 subjects. In contrast, an approach that used the average of all sessions and all trials but excluded according to lenient criteria (row 5, Ave LenNoOuts Full) resulted in an ICC value of 0.71, while only excluding 6 subjects. As an additional test, we tested the difference in SSRT between the two random halves of each approach, across 500 iterations, between the twelve approaches. The mean difference values for the approach that used the average of all sessions and all trials but excluded according to lenient criteria (row 5, Ave LenNoOuts Full) was significantly lower in comparison to all other methods, p < 0.0001 in all comparisons (corrected for multiple comparisons using permutation based maximum T distribution). These results, paired with an inspection of the ICC values and Figures 1 and 2, suggests that an approach which uses the average of all available sessions, all trials of each session, and excludes outliers based on predetermined lenient criteria (row 5) yields reliable and stable SSRT estimates and low within-subject variability, while not excluding too many participants.
Discussion
In this set of analyses, we examined the influence that SSRT calculation strategies and the treatment of outliers had on the reliability and variability of Stop-signal task performance measures. We pooled data from 165 healthy participants, who were not pre-selected based on performance or any other criteria (other than the exclusion criteria listed in Methods), and present evidence in support of a particular way of calculating SSRT, which makes use of all available trials from all available runs, but which excludes participants that exceed lenient outlier criteria. An inspection of the distribution in SSRT values in Figure 1E reveals that this approach also retains a broad distribution of SSRT values, but does not include clear outliers. It is perhaps not surprising that an approach that makes use of most of the data yields the most reliable estimates of SSRT. However, the adaptive Stop-signal task design means that trials differ, and performance shifts, over the course of a run, meaning that it is possible that later trials provide more reliable estimates of an individual’s inhibitory control ability than earlier trials. Despite this dynamic task design, our results suggest that an approach that makes use of all runs and all trials, while retaining the majority of available subjects for analysis, yields good reliability coefficients.
Reliability estimates from the method of SSRT calculation which we determined to be optimal (average ICC of 0.71 across 500 iterations) are highly similar to those reported in a sample of ADHD children (ICC of 0.72; Soreni et al., 2009). As previously described, there has been attention given to the optimal method of SSRT estimation, following the horse-race model of stopping, and there have been two previous investigations of SSRT reliability. Williams et al. (1999) report high reliability estimates (r = 0.83) while examining a wide age range, whereas Logan et al. (1997) report lower estimates (r = 0.39) in a sample of undergraduates. While both of these previous reports used a tracking version of the task, their method of SSRT estimation differed slightly from the current quantile method. To the best of our knowledge, this is the first illustration of how different methods of SSRT calculation and outlier calling influence SSRT reliability and sample size. We have chosen to include only the quantile method of SSRT estimation in our current analyses given previous evidence that other methods (e.g., mean method, or subtracting mean SSD from mean Go reaction time) are less reliable than the quantile method, and more susceptible to violations of assumptions underlying the race model (Band et al., 2003); however, other users of the task may be interested in examining the influence that different SSRT calculation approaches have on the range of SSRT estimation approaches. Indeed, our reliability estimates can be applied only to the data included in the present analyses, and additional work is needed to characterize the reliability of Stop-signal task performance when varying a range of testing and subject-specific features. Nonetheless, we believe that these results complement other examinations of SSRT methods, and will prove to be useful for future studies.
We relied on several measures to evaluate each of the twelve methods of calculation: ICC coefficients, variability, and sample sizes retained. These indicators revealed that there are important differences across the twelve methods of SSRT calculation. For example, an approach that excludes participants based on conservative outlier criteria excludes too many participants (in our dataset, up to 27% of participants when using conservative outlier criteria and either data from only the second half of trials or all trials). In contrast, approaches that include all possible runs, trials, and participants most certainly include outliers. Of course, defining an outlier objectively can be challenging. While the assessment of behavioral performance arguably involves less measurement error than, for example, self-report trait questionnaires, there is still some uncertainty in defining the boundary between high SSRT scores and outliers. In our present analyses, the incorporation of standard deviations of SSRT across iterations, and a count of participants falling three standard deviations above the group mean, complemented visual inspection of SSRT distributions. While there is variability in how outliers are called across studies, by including measures of variability, stability, and reliability here we helped to objectively distinguish between likely noise and variability.
Our choice of outlier criteria was largely influenced by previous studies that have characterized optimal performance in the Stop-signal task (Logan et al., 1984; Logan, 1994; Band et al., 2003), as well as our previous experience with Stop-signal data. Specifically, our lenient and conservative criteria approximately identify values that are two and one standard deviations outside of the mean, respectively. The purpose of our current analyses was to examine the influence of these criteria on SSRT reliability. However, to confirm that these thresholds are suitable given the distribution of data in our pooled sample, we compared our lenient criteria to distribution-specific thresholds. When looking at the last session for all trials, in all subjects, for Percent Inhibition, two standard deviations above (75.79%) and below (25.55%) the mean are similar to our lenient criteria (75 and 25%); for Go-Response, two standard deviations below the mean (60.03%) corresponds to our lenient criterion (60%); and for Go-Errors, two standard deviations above the mean (14.44%) is slightly higher than our lenient criterion (10%). The correspondence between our fixed criteria and thresholds based on the distribution of data remains when looking at the average of all sessions, as well. Our reasons for choosing these criteria are therefore supported by the distribution of actual data, but also allow us to use them as real-time guides (e.g., flag participants within a testing session that inhibit on less than 25% or more than 75% of trials and provide feedback in order to collect usable data).
Our results also suggest that, while the total number of trials available to estimate SSRT influences reliability estimates (with higher ICC values seen from approaches using an average of all available runs as compared to the last run only, and all trials as compared to the second half of trials only), inclusion of data from a sample with only one run of the task did not negatively affect reliability estimates. That is, reliability estimates of SSRT were not substantially reduced by including Sample 3 (which had the lowest number of trials). These data suggest that even though few trials were available from Sample 3, which included only one run, their inclusion contributed to the reliability of SSRT in the pooled analysis. However, our overall results suggest that SSRT reliability estimates are improved when including all trials from multiple runs (and for a more detailed description of optimal trial numbers, see Band et al., 2003).
Finally, group average SSRT values (across 500 iterations) range from 146.00 to 171.80 ms across the twelve approaches, suggesting that the different approaches do not have a dramatic effect on the resulting average SSRT for the final group of participants included in each approach. While the group average does not vary substantially between approaches (as can be seen by mean SSRT values, broken down by group and approach, in Table 3), the presence vs. absence of outliers does clearly vary across approaches, and this is most evident in Figures 1 and 2, as well as in the range of SSRT standard deviation values across the three samples. The influence of this difference in maximum SSRT scores between approaches is likely to be seen in studies in which SSRT is examined in relation to some other individual difference measure (e.g., trait impulsivity).
The issue of defining outliers is a particularly important one when it comes to assessing neurocognitive phenotypes, as we assume a given phenotype not only has sufficient variance, but also is valid, or accurately reflects what we intend to measure. As such, whether an SSRT value over 400 ms in a sample of healthy participants reflects extremely poor inhibitory control or is an outlier has implications for both the reliability of the phenotype but also our sensitivity to detect a significant association with genetic variants, fMRI signal, or other measures of neurobiological function. Variability in study design, SSRT calculation, and populations studied are factors likely to contribute to much of the noise in the response inhibition literature. Thus, an evaluation of SSRT definition and measurement is a necessary step toward further establishing validity and ultimately elucidating biological mechanisms underlying response inhibition. For this reason, we believe that the methods used to calculate SSRT and determine outliers should be made explicit in future studies, and hope that our results can be used as guidelines in making such decisions.
Conclusion
Our findings provide additional support for the reliability of SSRT, which is commonly used as an index of inhibitory control, and provide additional support for its continued use as a neurocognitive phenotype. However, the method of calculation of SSRT that we conclude has good reliability and sufficient variability needs to be examined in relation to other indicators in samples characterized by a wide range of impulsivity, including clinical samples characterized by elevated impulsivity, in order to further understand the relationship between this index and behavioral features.
Conflict of Interest Statement
The authors declare that the research was conducted in the absence of any commercial or financial relationships that could be construed as a potential conflict of interest.
Acknowledgments
We would like to thank Brenda Gregory and Natalie Picchetti for help with data collection of Sample 3. This work was supported by grants from the NIH (F31 MH079643 (E. Congdon, PI); an NIH/NINDS training grant (T32 NS048004; Nelson Freimer, PI); PL1MH083271 and UL1DE019580 (Robert Bilder, PI); R01MH082795 (R. Poldrack, PI); RL1MH083268 (N. Freimer, PI)), NSF BCS-0224221(T. Canli, PI), Office of Naval Research (R. Poldrack, PI), James S. McDonnell Foundation (R. Poldrack, PI), and UT Emerging Technology Fund (R. Poldrack, PI). The raw data for this study are available for download from http://www.poldracklab.org/data.
References
Aron, A. R., and Poldrack, R. A. (2006). Cortical and subcortical contributions to stop signal response inhibition: role of the subthalamic nucleus. J. Neurosci. 26, 2424–2433.
Band, G. P. H., van der Molen, M. W., and Logan, G. D. (2003). Horse-race model simulations of the stop-signal procedure. Acta Psychol. (Amst.) 112, 105–142.
Bedard, A.-C., Nichols, S., Barbosa, J. A., Schachar, R., Logan, G. D., and Tannock, R. (2002). The development of selective inhibitory control across the life span. Dev. Neuropsychol. 21, 93–111.
Bland, J. M., and Altman, D. G. (1986). Statistical methods for assessing agreement between two methods of clinical measurement. Lancet 1, 307–310.
Boucher, L., Palmeri, T. J., Logan, G. D., and Schall, J. D. (2007). Inhibitory control in mind and brain: an interactive race model of countermanding saccades. Psychol. Rev. 114, 376–397.
Cicchetti, D. V. (2001). The precision of reliability and validity estimates re-visited: distinguishing between clinical and statistical significance of sample size requirements. J. Clin. Exp. Neuropsychol. 23, 695–700.
Congdon, E., Constable, R. T., Lesch, K. P., and Canli, T. (2009). Influence of SLC6A3 and COMT variation on neural activation during response inhibition. Biol. Psychol. 81, 144–152.
Congdon, E., Mumford, J. A., Cohen, J. R., Galvan, A., Aron, A. R., Xue, G., Miller, E., and Poldrack, R. A. (2010). Engagement of large-scale networks is related to individual differences in inhibitory control. Neuroimage 53, 653–663.
Lijffijt, M., Bekker, E. M., Quik, E. H., Bakker, J., Kenemans, J. L., and Verbaten, M. N. (2004). Differences between low and high trait impulsivity are not associated with differences in inhibitory motor control. J. Atten. Disord. 8, 25–32.
Lijffijt, M., Kenemans, J. L., Verbaten, M. N., and van Engeland, H. (2005). A meta-analytic review of stopping performance in attention-deficit/hyperactivity disorder: deficient inhibitory motor control? J. Abnorm. Psychol. 114, 216–222.
Logan, G. D. (1994). “On the ability to inhibit thought and action: a users’ guide to the stop signal paradigm,” in Inhibitory Processes in Attention, Memory and Language, eds D. Dagenbach and T. H. Carr (San Diego: Academic Press), 189–239.
Logan, G. D., and Cowan, W. B. (1984). On the ability to inhibit thought and action: a theory of an act of control. Psychol. Rev. 91, 295–327.
Logan, G. D., Cowan, W. B., and David, K. A. (1984). On the ability to inhibit responses in simple and choice reaction time tasks: a model and a method. J. Exp. Psychol. Hum. Percept. Perform. 10, 276–291.
Logan, G. D., Schachar, R. J., and Tannock, R. (1997). Impulsivity and inhibitory control. Psychol. Sci. 8, 60–64.
Rubia, K., Halari, R., Mohammad, A.-M., Taylor, E., and Brammer, M. (2011). Methylphenidate normalizes frontocingulate underactivation during error processing in attention-deficit/hyperactivity disorder. Biol. Psychiatry 70, 255–262.
Rush, B. K., Barch, D. M., and Braver, T. S. (2006). Accounting for cognitive aging: context processing, inhibition or processing speed? Aging Neuropsychol. Cogn. 13, 588–610.
Schachar, R. J., Tannock, R., and Logan, G. D. (1993). Inhibitory control, impulsiveness, and attention deficit hyperactivity disorder. Clin. Psychol. Rev. 13, 721–739.
Shrout, P. E., and Fleiss, J. L. (1979). Intraclass correlations: uses in assessing rater reliability. Psychol. Bull. 86, 420–428.
Soreni, N., Crosbie, J., Ickowicz, A., and Schachar, R. (2009). Stop signal and conners’ continuous performance tasks: test–retest reliability of two inhibition measures in ADHD children. J. Atten. Disord. 13, 137–143.
Tannock, R., Schachar, R. J., and Logan, G. D. (1995). Methylphenidate and cognitive flexibility: dissociated dose effects on behavior and cognition in hyperactive children. J. Abnorm. Child Psychol. 23, 235–266.
Keywords: response inhibition, stop-signal reaction time, reliability
Citation: Congdon E, Mumford JA, Cohen JR, Galvan A, Canli T and Poldrack RA (2012) Measurement and reliability of response inhibition. Front. Psychology 3:37. doi: 10.3389/fpsyg.2012.00037
Received: 26 October 2011;
Accepted: 31 January 2012;
Published online: 21 February 2012.
Edited by:
Hans Colonius, Universität Oldenburg, GermanyReviewed by:
Eric-Jan Wagenmakers, University of Amsterdam, NetherlandsGuido P. H. Band, Leiden University, Netherlands
Gordon Logan, Vanderbilt University, USA
Copyright: © 2012 Congdon, Mumford, Cohen, Galvan, Canli and Poldrack. This is an open-access article distributed under the terms of the Creative Commons Attribution Non Commercial License, which permits non-commercial use, distribution, and reproduction in other forums, provided the original authors and source are credited.
*Correspondence: Eliza Congdon, Center for Neurobehavioral Genetics, University of California Los Angeles, 695 Charles E. Young Drive South, Gonda Box 951761, Los Angeles, CA 90095-1761, USA. e-mail: econgdon@ucla.edu