
- 1 Institute of Psychology, University of Leipzig, Leipzig, Germany
- 2 Cognitive Brain Research Unit, Cognitive Science, Institute of Behavioural Sciences, University of Helsinki, Helsinki, Finland
- 3 Center of Excellence in Interdisciplinary Music Research, University of Jyväskylä, Jyväskylä, Finland
- 4 Cicero Learning, University of Helsinki, Helsinki, Finland
Dyslexic and control first-grade school children were compared in a Symbol-to-Sound matching test based on a non-linguistic audiovisual training which is known to have a remediating effect on dyslexia. Visual symbol patterns had to be matched with predicted sound patterns. Sounds incongruent with the corresponding visual symbol (thus not matching the prediction) elicited the N2b and P3a event-related potential (ERP) components relative to congruent sounds in control children. Their ERPs resembled the ERP effects previously reported for healthy adults with this paradigm. In dyslexic children, N2b onset latency was delayed and its amplitude significantly reduced over left hemisphere whereas P3a was absent. Moreover, N2b amplitudes significantly correlated with the reading skills. ERPs to sound changes in a control condition were unaffected. In addition, correctly predicted sounds, that is, sounds that are congruent with the visual symbol, elicited an early induced auditory gamma band response (GBR) reflecting synchronization of brain activity in normal-reading children as previously observed in healthy adults. However, dyslexic children showed no GBR. This indicates that visual symbolic and auditory sensory information are not integrated into a unitary audiovisual object representation in them. Finally, incongruent sounds were followed by a later desynchronization of brain activity in the gamma band in both groups. This desynchronization was significantly larger in dyslexic children. Although both groups accomplished the task successfully remarkable group differences in brain responses suggest that normal-reading children and dyslexic children recruit (partly) different brain mechanisms when solving the task. We propose that abnormal ERPs and GBRs in dyslexic readers indicate a deficit resulting in a widespread impairment in processing and integrating auditory and visual information and contributing to the reading impairment in dyslexia.
Introduction
Developmental dyslexia is a difficulty in achieving fluent reading skills, although overall intelligence is within a normal range, the reading instruction is adequate, and vision and hearing are normal. About 5–17% of children exhibit dyslexia and consequently face persisting problems in reading and writing (Shaywitz, 2003). Dyslexia may affect a child’s cognitive development and cause secondary problems, such as low motivation to learn and low self-esteem. Younger children with dyslexia face problems when, e.g., asked to operate with sounds within words, or to segment words into parts (Lyytinen et al., 2007). Older children who can read have in turn problems with words that are unknown to them (Wimmer and Schurz, 2010; Wimmer et al., 2010). This impairment is most evident when children are asked to read nonsense words that can only be decoded on the basis of letter-to-sound mapping principles.
A range of impairments have been reported to be associated with dyslexia. These include deficits in several modalities as well as in crossmodal functions. More specifically, in the auditory modality, deficits have been observed in phonological awareness (Bradley and Bryant, 1978; Snowling, 2000; Gabrieli, 2009) and in speech and non-speech sound discrimination (Schulte-Körne et al., 1998; Baldeweg et al., 1999; Ramus, 2004; Lachmann et al., 2005; Kujala et al., 2006; Lovio et al., 2010; for a review, see Kujala, 2007). In the visual modality, the findings emphasize the dysfunctionality of the magnocellular system (Stein and Walsh, 1997) and working memory functions (Lyytinen et al., 2007). Furthermore, impairments in integrating information from different sensory modalities have been reported in dyslexia (Laasonen et al., 2000). It was even suggested that the problems of dyslexic individuals are more pronounced in tasks requiring sensory integration than in those limited to one modality (Laasonen et al., 2000). Moreover, Blomert (2011) suggested a specific deficit in audiovisual integration to be a proximal cause for the reading deficit in developmental dyslexia. Froyen et al. (2011) reported that unlike normal-reading children, dyslexic children showed no early crossmodal effects in an audiovisual letter-speech sound oddball paradigm. The mismatch negativity (MMN) event-related potential (ERP) component to speech sounds was enhanced in normal readers when presented together with letters but not in dyslexic children. Blomert and Froyen (2010) and Blomert (2011) discussed this finding in the context of the specific requirements for orthographic-phonemic binding during reading acquisition.
Recent intervention studies suggest that problems in audiovisual integration may have a causal role in reading impairments by showing that audiovisual training improves reading skills of dyslexic children (Kujala et al., 2001; Törmänen and Takala, 2009; Brem et al., 2010; for a review, see Loo et al., 2010). It was suggested that auditory exercises primarily improve phonological awareness skills but often have little effect on reading or spelling skills. Yet, pairing of audiovisual stimuli seems to be essential for not only improving phonological awareness, but also reading and spelling skills (Loo et al., 2010). It has been shown that both audiovisual exercises involving speech related (Lyytinen et al., 2007) and unrelated material (Kujala et al., 2001) can improve reading skills of dyslexic children. Lyytinen et al. (2007) found that exercises requiring the matching of visually and auditorily presented letters improved reading skills of 6- to 7-year-old children. The superior effects of this letter-based computer assisted training over regular reading intervention were confirmed during intervention period and also in 12 and 16 month follow-up tests in a longitudinal study (Saine et al., 2011).
Kujala et al. (2001) investigated whether exercises including matching of visual and auditory patterns would improve reading skills of first-grade dyslexic children and affect their ERPs. During training sessions, children were presented with visual patterns of 3–15 rectangular elements each representing a sound in a sound pattern. Vertical offset, length, and thickness of visual elements was corresponding to sound pitch, duration, and intensity, respectively. Children were asked to practice two tasks: In one task they were presented with two visual patterns and had to indicate to which of the two patterns the sound pattern was corresponding. In a second task they had to follow a single visual pattern and had to indicate the onset of the last sound of the corresponding sound pattern as fast as possible by pressing a button. Whereas there were no group differences in reading skills before training, after the 7-week training period, children in the training group read significantly more words correctly than the control group and tended to have a faster reading speed. Furthermore, the training modulated the MMN, a brain response reflecting automatic detection of deviant events in an otherwise regular auditory input (Näätänen, 1992). The MMN for tone-order reversals was larger in the training than control group after the intervention, whereas no MMN group differences were found in the baseline recording. These results suggest that audiovisual non-linguistic training both improves reading skills and facilitates the neural basis of auditory discrimination.
The present study aimed to examine the brain processes involved in audiovisual perception and integration in dyslexic children. To this end, a Symbol-to-Sound matching paradigm developed by Widmann et al. (2004) based on the audiovisual training game described by Kujala et al. (2001) was used. In their previous study, Widmann et al. (2004) presented normal-reading adults with visual patterns of four to six rectangles. Each rectangle was corresponding to a subsequently played sound pattern (cf. Figure 1). The visual element’s vertical offset predicted the corresponding sound element’s pitch. In half of the patterns a single sound element was incongruent with the visual rectangle. Participants’ task was to press a button as fast as possible after the onset of the last sound and subsequently to discriminate whether visual and auditory patterns were congruent or incongruent. ERP responses to incongruent sounds compared to congruent sounds were characterized by a distinct pattern of an incongruency response (IR, an MMN like negativity peaking about 100 ms past sound onset and inverting polarity at mastoidal leads), followed by an N2b and a P3a component. The incongruency response was interpreted as reflecting a mismatch of visually induced prediction and auditory sensory information detected and processed at early levels of auditory sensory processing. Additionally, in the oscillatory brain responses an evoked auditory gamma band response (GBR; phase locked to sound onset) was observed in response to congruent but not to incongruent sounds peaking around 40 ms past sound onset in normal-reading adults (Widmann et al., 2007). Subsequently, an induced auditory GBR (not phase locked to sound onset) was observed also only in response to congruent but not to incongruent sounds between 100 and 200 ms past sound onset. Evoked GBR was interpreted as reflecting the resonant actual matching process between visually induced prediction and auditory sensory information as suggested by the match-and-utilization model (Herrmann et al., 2004). Induced GBR observed in the Symbol-to-Sound matching paradigm was supposed to reflect the integration of visual and auditory representation, which could only be successful in congruent sounds.
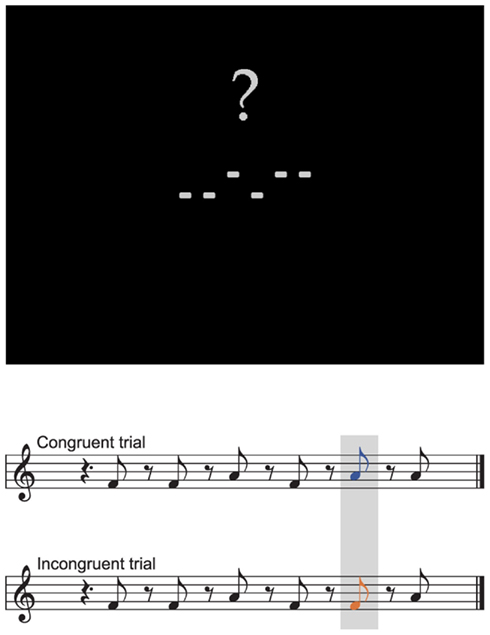
Figure 1. Prototypical visual display and corresponding auditory stimulation. Each trial started with the display of a visual pattern. After 1 s a corresponding sound pattern was presented either congruent to the visual pattern in all elements (congruent trial) or deviating in a single element (incongruent trial). Sound duration was 300 ms. Stimulus onset asynchrony was 600 ms. Three hundred milliseconds after the offset of the last sound a question mark was overlayed indicating the subject to discriminate congruent and incongruent trials by button press.
Here we investigated whether the electrophysiological signatures of audiovisual brain processes are deteriorated in dyslexic children. To this end, we tested whether the brain responses elicited in the Symbol-to-Sound matching paradigm can be observed in children and whether they are different in normal-reading children compared to dyslexic children. As it has been shown that in particular audiovisual integration and/or synchronization is impaired in dyslexic individuals and that an audiovisual training analog to the Symbol-to-Sound matching task has remediating effects on dyslexic children (Kujala et al., 2001), we hypothesized that no or only reduced ERP (IR, N2b, and P3a; cf., Widmann et al., 2004) and GBRs (evoked and induced; cf., Widmann et al., 2007) can be observed in these children.
Materials and Methods
Participants
Twenty-one 7-year-old Finnish first-grade school children from three schools in the Helsinki city area participated in the experiment. Eleven children (five females, six males) were rated as dyslexic and 10 (six females, four males) as normal readers by their class teachers. All of them reported normal or corrected to normal vision and normal hearing and were right-handed. None of the participants had a history of neurological disease or injury. The children were paid for their participation in the experiment and their parents gave informed consent after the details of the procedure had been explained to them. The study was approved by the Ethical Committee of the Department of Psychology, University of Helsinki.
The performance IQ (PIQ) was measured with the Performance Subtest of WISC III. The subtests of reading short and long words were chosen from a Finnish test battery of Poskiparta et al. (1994) designed for diagnosing reading skills in pre-school and first-grade children. The subtest of determining the borders of two to four words written without a space between the words was chosen from the Finnish reading test battery of Lindeman (1998) for elementary-school children.
Stimuli and Apparatus
The experiments were conducted in the schools during the school day in quiet rooms in which only the child and two experimenters were present. The children were comfortably seated in front of a notebook with an LCD-display. Their right index and middle fingers were placed on two color-marked keys on the notebook’s keyboard. Visual stimuli consisted of four to six light gray rectangles presented simultaneously on black background aligned horizontally above and below the horizontal midline of the screen (see Figure 1 for a sample screenshot). The rectangles subtended a visual angle of 0.44° × 0.22°. The empty spaces between the rectangles were of the same width as the rectangles. The upper corners of the rectangles were placed 0.27° above or 0.05° below the horizontal midline of the screen. Auditory stimuli consisted of triangle waves with a frequency of 352 (F4) or 440 Hz (A4) with a duration of 300 ms, including 5 ms rise and 5 ms fall time (Hann windowed). Auditory stimuli were presented to the subjects via headphones. Each trial started with the visual presentation of an element pattern of four to six rectangles on the screen. Visual stimuli remained on screen until the end of the trial. The presentation of the auditory stimuli started 1,000 ms after the onset of the visual display. Four to six auditory stimuli were presented with an offset-to-onset interstimulus interval (ISI) of 300 ms. The visual and auditory patterns contained the same number of elements and were related to each other in the manner that high tones were represented by a rectangle above and low tones by a rectangle below the horizontal midline. In half of the trials one element was incongruent, that is, either a high tone was presented when there was a rectangle below the midline at the corresponding position of the visual pattern, or a low tone was presented when there was a rectangle above the midline. Incongruent elements could occur on each position in the pattern with equal probability. Three hundred millisecond after the offset of the last sound a question mark was presented above the visual stimuli prompting the subject to respond. Depending on whether the response was correct or not either a smiley was presented for 400 ms replacing the question mark or no feedback was given. The next trial started 1,200 ms after the subject responded.
Design and Procedure
The IQ and reading tests were performed on a separate day before the experimental session.
The experiment started with a series of training blocks. In the first training block only congruent trials were presented. Each of the rectangles was highlighted in green when the corresponding tone was played. In the second training block also incongruent trials were presented. The rectangles were highlighted in green for congruent events and in red for incongruent events when the corresponding tone was played. When the question mark appeared the subjects had to indicate whether there was an incongruent event in the trial by pressing one of the two buttons. If the subject’s response was correct a smiley was presented, if it was incorrect the trial was repeated without requiring the subject to respond. In the third training block the rectangles were no longer highlighted, but if an incorrect response was given highlighting was used for the repetition of the trial. In the last training block and in the experimental blocks no highlighting was used and the trial was not repeated, if an incorrect response was given, but a smiley was still presented, if a correct response was given. Each of the training blocks consisted of 53 trials and could be aborted or repeated depending on the subject’s performance.
Following the training blocks, 10 experimental blocks of 53 trials were presented. The trials consisted of four to six pseudo-randomly selected elements with the restrictions that the trial could not consist of only high or low visual or auditory elements. In addition, the visual pattern was never the same as in the preceding trial. The children were instructed to respond as accurately as possible. The children could have breaks between the blocks and get refreshments whenever needed.
The experimental blocks were followed by a passive oddball condition to ensure that the observed differences were not due to possible group differences in discriminative abilities. The oddball condition consisted of five blocks with 360 trials each, in which the same sounds as in the Symbol-to-Sound matching condition were presented with an ISI of 300 ms. Frequent high tones (90%; Standards) were randomly interspersed with rare low tones (10%; Deviants). At least one standard sound was presented between two deviant sounds. The children watched a self-selected movie with Finnish subtitles on the notebook display and were instructed not to pay attention to the auditory stimulation.
Data Recording
The electroencephalogram (EEG) was recorded with Ag-AgCl electrodes from Fz, Cz, and Pz (10–20-system), L1 and R1 (placed at 1/3 of the arc connecting Fz and the left and right mastoids, respectively) and from the left and right mastoids (M1, M2, respectively). The vertical electrooculogram (EOG) was recorded with a supraorbitally placed electrode above the left eye and the horizontal EOG with an electrode placed at the outer canthus of the left eye. All electrodes were referenced to the tip of the nose. Impedances of all electrodes were kept below 10 kΩ. EEG and EOG were recorded with BrainAmp DC EEG amplifier and BrainVision Recorder software (BrainProducts GmbH, Gilching, Germany) with a sampling rate of 250 Hz. Responses and response times were recorded for each trial.
Analysis of ERP Data
Electroencephalogram and EOG were filtered off-line with a 0.75- to 100-Hz bandpass FIR filter (Kaiser windowed, Kaiser β = 5.653, 607 points) and divided into epochs of 1,024 ms time locked to the onset of each auditory stimulus including a 312-ms pre-stimulus period. The first auditory stimulus of each sound pattern in the Symbol-to-Sound matching condition was excluded from analysis (since it required absolute judgment of pitch). From incongruent patterns only the incongruent events were included in the analysis. Only events increasing the signal-to-noise ratio were included in the analysis by applying the sorted averaging procedure as suggested by Rahne et al. (2008) separately for congruent, incongruent, standard, and deviant sounds. For each incongruent event the closest congruent event with identical pitch and pattern position was selected, resulting in equal numbers of trials and signal-to-noise ratio of congruent and incongruent events. The remaining epochs were averaged separately for congruent and incongruent elements. In the experimental condition on average 167.9 of 235 trials per condition and subject were included in the analysis (71.4%; SD = 25.4 trials; control children: 169.7 ± 26.3 trials, min 114, max 207 trials; dyslexic children: 166.3 ± 24.6 trials, min 137, max 220 trials). In the oddball control condition on average 141.5 of 180 trials per condition and subject were included in the analysis (78.6%; SD = 15 trials; control children: 141.5 ± 16 trials, min 119, max 166 trials; dyslexic children: 141.6 ± 14.1 trials, min 121, max 168 trials). Grand-average waveforms were computed from the individual average ERPs for the visualization of the results.
Analysis of Oscillatory Activity
To compute the time-frequency representation of oscillatory gamma band activity phase locked to stimulus onset (termed as evoked activity), the individual averages for congruent and incongruent stimuli were convolved with complex Morlet wavelets  normalized to unit energy A = (σt
  with σt = 1/(2 Π σf) (Tallon-Baudry et al., 1996). The wavelet family used was defined by f0/σf = 7 ranging from 30 Hz [duration (2 σt) 74.2 ms, spectral bandwidth (2 σf) 8.6 Hz] to 80 Hz (duration 27.9 ms, bandwidth 22.9 Hz) in 1-Hz steps. The amplitude of the evoked activity was calculated by taking the modulus of the time-frequency representation. The time-frequency representation of the total oscillatory gamma band activity (phase locked and non–phase locked) was calculated by averaging the modulus of the convolution of each epoch with the same family of complex Morlet wavelets separately for congruent and incongruent events and each subject. For each frequency band, the mean of a −200 to −50-ms pre-stimulus baseline was subtracted from the time-frequency representation in order to eliminate uncorrelated noise and effects not related to sound onset.
Statistical Analysis
Mixed-effect model ANOVAs with the between subject factors group (dyslexic vs. control children), and the within subject factors electrode location, and congruency (Symbol-to-Sound matching condition; congruent vs. incongruent events) or deviancy (Oddball condition; standards vs. deviants) were performed on the ERP mean amplitude values within post-stimulus time windows centered at the peaks of the difference wave of the grand-average difference waves [ERPs to incongruent minus ERPs to congruent events: IR/N2b early: 140–180 ms; N2b: 216–256 ms; P3a: 508–588 ms; or ERPs to deviants minus ERPs to standards: MMN: 108–148 ms; late discriminative negativity component (LDN): 408–488 ms]. In the behavioral data the same ANOVA was performed on the hit rates. Spearman rank-order correlation coefficients were calculated on the results of the reading tests and the mean incongruent minus congruent difference amplitudes within the N2b time window at electrode location Cz. Time-frequency windows for the analysis of oscillatory activity were centered on the peaks and troughs of mean 30–80 Hz total gamma band activity at electrode locations Fz, Cz, and Pz in response to congruent (204–284 ms) and incongruent events (344–424 ms) for control and dyslexic children, respectively. Synchronization and desynchronization presumably reflect different underlying brain processes. Thus, we preferred the analysis strategy testing synchronization and desynchronization separately in two time windows over a single omnibus-ANOVA. Group differences in IQ, reading score and reading times were tested with t-tests. Degrees of freedom were adjusted for t-tests where statistically significant differences of group variances were detected by the Levene test. All t-tests reported are two-sided. Greenhouse-Geisser corrected degrees of freedom were used when a statistically significant violation of sphericity was detected by the Mauchly test. An alpha level of .05 was defined for all statistical tests.
Results
Reading Skills and Behavioral Performance
The dyslexic and control groups did not differ in their PIQ but differed significantly in their average reading score and their average reading time of short and long words (see Table 1). All children were able to perform the Symbol-to-Sound matching task and had hit rates clearly above chance level. However, control children performed somewhat better than dyslexic children [F(1,19) = 4.744, p = 0.042,  ]. Accuracy was higher in congruent trials than in incongruent trials [0.93 vs. 0.85; F(1,19) = 18.296, p < 0.001,
  ].
].
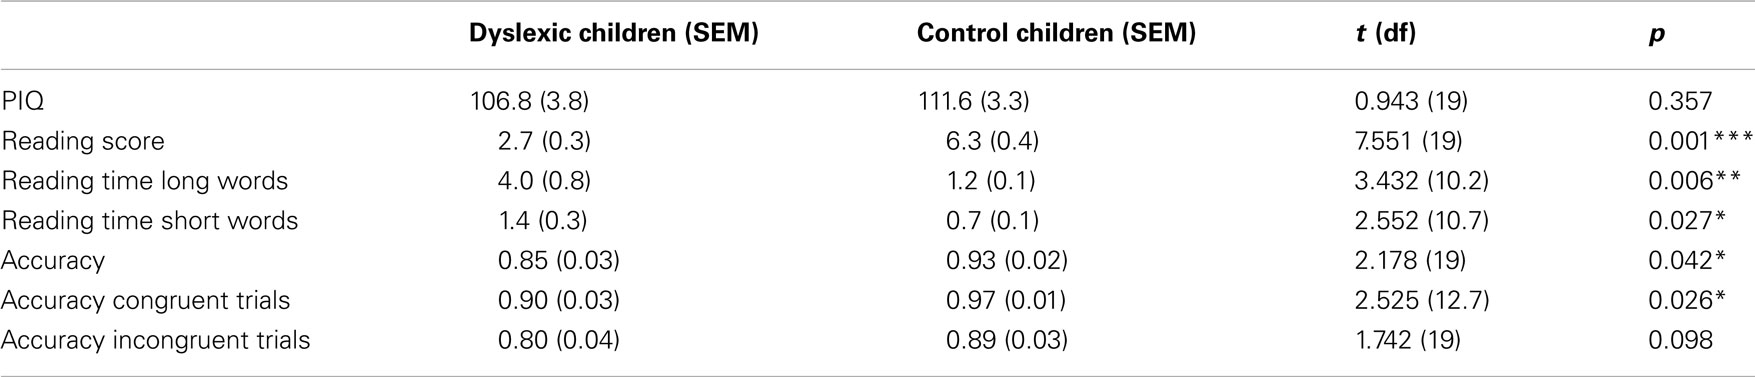
Table 1. Performance IQ, reading score, reading times, and accuracy mean and SE values for dyslexic and control children.
Event-Related Potentials
The ERPs to congruent and incongruent events in the Symbol-to-Sound matching condition (Figure 2A) and to standard and deviant sounds in the control condition (Figure 2B) are shown in Figure 2 for control (first row) and dyslexic children (second row). The corresponding incongruent minus congruent and deviant minus standard subtraction waves are shown in the third row.
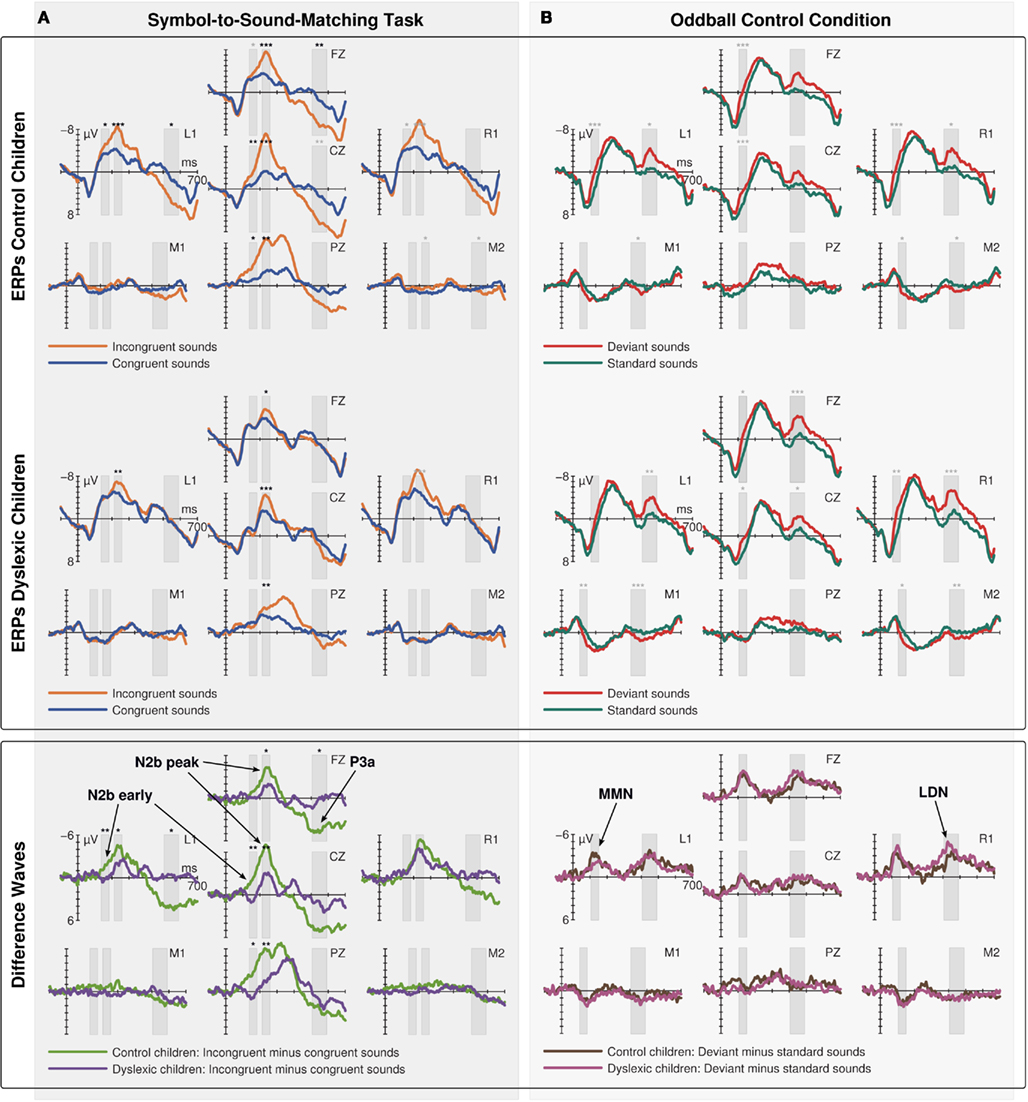
Figure 2. Event-related potentials (ERPs) to congruent and incongruent events in the Symbol-to-Sound matching condition (A) and to standard and deviant sounds in the passive oddball control condition (B) for control (first row) and dyslexic children (second row) and the corresponding incongruent minus congruent and deviant minus standard subtraction waves (third row). Bars indicate the time windows used for statistical analysis. Black asterisks indicate statistical significance of results in the respective time windows as described in Section “Results” (interaction of condition and group for difference waves; follow-up test of within group difference between incongruent and congruent trials for ERPs on electrode locations with significant interactions; gray asterisks indicate statistical significance of additional within group contrasts not motivated by significant interactions).
IR/N2b Early
Visual inspection of difference waves showed an earlier onset of N2b over left hemisphere and midline electrode locations in control children than in dyslexic children. This early negativity preceding N2b might also reflect the correlate of IR in children; however, as it did not invert polarity over mastoid leads, it will be referred to as N2b early. The ANOVA in this time window showed a three way interaction of the factors electrode location, condition, and group [F(6,114) = 3.699, p = 0.020, ε = 0.459,  ]. A significant interaction of condition and group was observed at electrode locations L1 [F(1,19) = 10.106, p = 0.005,
  ], Cz [F(1,19) = 8.261, p = 0.010,
  ], and Pz [F(1,19) = 7.768, p = 0.012,
  = 0.290]. Only control children showed a significant difference between congruent and incongruent trials at these electrode locations in this time window [L1: t(9) = 3.178, p = 0.011; Cz: t(9) = 3.222, p = 0.010; Pz: t(9) = 2.698, p = 0.024] while dyslexic children showed no difference at any of these electrode locations.
N2b
Difference waves showed a broadly distributed N2b component peaking at centro-parietal electrode sites 236 ms after sound onset. The ANOVA in this time window yielded a three way interaction of the factors electrode location, condition, and group [F(6,114) = 4.537, p = 0.004, ε = 0.601,  ]. A significant interaction of condition and group was observed on electrode locations L1 [F(1,19) = 5.543 p = 0.029,
  ], Fz [F(1,19) = 6.822, p = 0.017,
  ], Cz [F(1,19) = 10.255, p = 0.005,
  ], and Pz [F(1,19) = 10.173, p = 0.005,
  ]. However, both groups showed a significant difference between congruent and incongruent trials at these electrode locations in this time window [Control children: L1: t(9) = 5.758, p < 0.001; Fz: t(9) = 6.776, p < 0.001; Cz: t(9) = 6.650, p < 0.001; Pz: t(9) = 4.395, p = 0.002; dyslexic children: L1: t(9) = 3.633, p = 0.005; Fz: t(9) = 2.587, p = 0.027; Cz: t(9) = 4.433, p = 0.001; Pz: t(9) = 3.250, p = 0.009].
N2b incongruent minus congruent difference at Cz was significantly correlated with the reading score [rs(21) = −0.632, p = 0.002; see Figure 3], reading time of short words [rs(21) = 0.735, p < 0.001], and reading time of long words [rs(21) = 0.674, p = 0.001]. Children with better reading skills showed higher (more negative) N2b amplitudes.
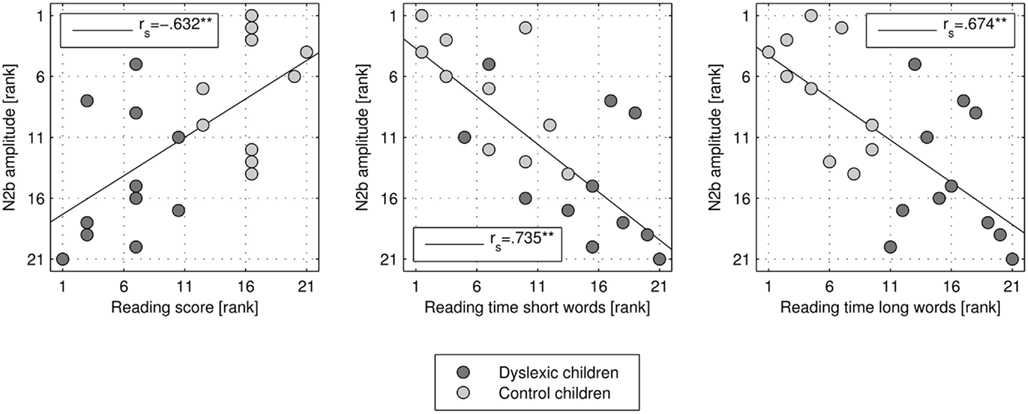
Figure 3. Scatter plot and correlation of N2b amplitude rank (negative up) at electrode location Cz and rank of reading score, and reading time of short and long words, respectively.
P3a
N2b was followed by a left-frontally distributed P3a component peaking 548 ms after sound onset. The ANOVA in this time window showed a three way interaction of the factors electrode location, condition, and group [F(6,114) = 3.671, p = 0.015, ε = 0.535,  ]. A significant interaction of condition and group was observed at electrode locations L1 [F(1,19) = 6.140, p = 0.023,
  ], and Fz [F(1,19) = 7.200, p = 0.015,
  ]. Only control children showed a significant difference between congruent and incongruent trials at these electrode locations in this time window [L1: t(9) = 2.793, p = 0.021; Fz: t(9) = 3.294, p = 0.009], while dyslexic children showed no difference at any of these electrode locations.
Oddball Control Condition
Mismatch negativity was elicited in response to deviant sounds peaking 128 ms after sound onset at frontal leads. MMN amplitude was not significantly different between the groups. The ANOVA in this time window showed a significant interaction of the factors electrode location and condition [F(6,114) = 30.969, p < 0.001, ε = 0.389,  ]. ERPs to deviants were significantly more negative than ERPs to standards on all electrodes locations above the sylvian fissure except Pz [L1: t(20) = 4.489, p < 0.001; Fz: t(20) = 5.249, p < 0.001; R1: t(20) = 5.654, p < 0.001; Cz: t(20) = 4.674, p < 0.001] and significantly more positive at mastoid leads [M1: t(20) = 4.270, p < 0.001; M2: t(20) = 3.716, p = 0.001].
Mismatch negativity was followed by a LDN component peaking 448 ms after sound onset at fronto-lateral leads and inverting polarity over mastoid leads. The ANOVA in this time window showed a significant interaction of the factors electrode location and condition [F(6,114) = 32.215, p < 0.001, ε = 0.422,  ]. ERPs to deviants were significantly more negative than ERPs to standards at all electrode locations above the sylvian fissure except Pz [L1: t(20) = 4.613, p < 0.001; Fz: t(20) = 4.473, p < 0.001; R1: t(20) = 5.145, p < 0.001; Cz: t(20) = 3.134, p = 0.005] and significantly more positive at mastoid leads [M1: t(20) = 5.405, p < 0.001; M2: t(20) = 4.584, p < 0.001].
Oscillatory Activity
No changes in evoked (phase-locked) oscillatory activity in the gamma band relative to baseline were observed. Thus, total gamma band activity reflects what is in the literature often referred to as induced gamma band activity (total activity minus evoked activity in the strict sense) and the terms will be used synonymously within this manuscript (Tallon-Baudry and Bertrand, 1999; Herrmann and Mecklinger, 2000). Spectrograms for total gamma band activity in response to congruent (Figure 4A) and incongruent sounds (Figure 4B) are shown in Figure 4 separately for control (first row) and dyslexic children (second row). The mean of total gamma band activity over time is shown on Figure 4C. The mean amplitudes to congruent sounds in the early time window and to incongruent sounds in the late time window in both groups are displayed in Figure 5.
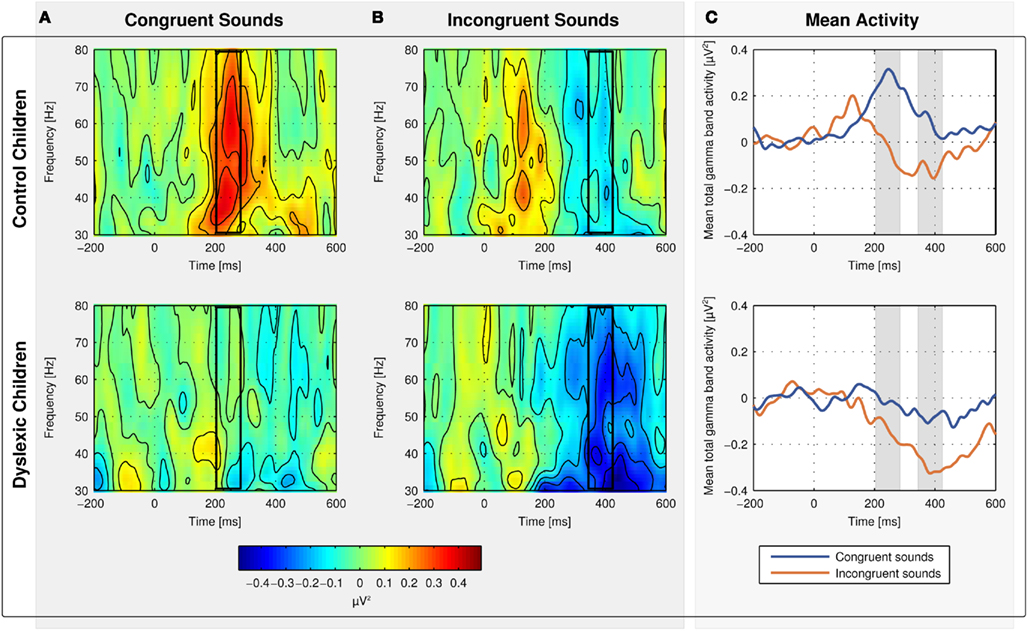
Figure 4. Spectrograms for mean total gamma band activity at electrodes Fz, Cz, and Pz in response to congruent (A) and incongruent sounds (B) for normal-reading (first row) and dyslexic children (second row). The mean of total gamma band activity is shown on (C).
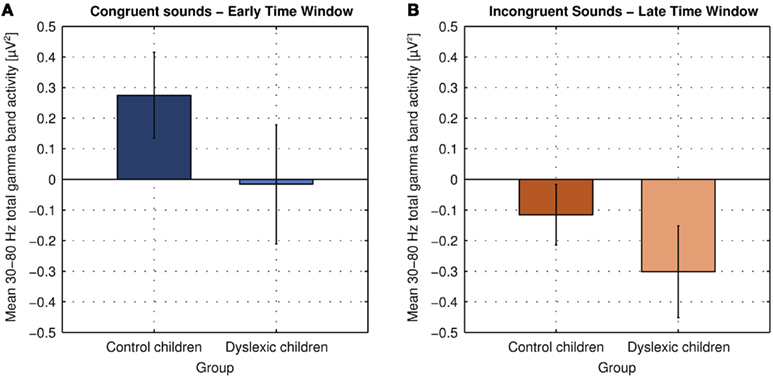
Figure 5. Mean 30–80 Hz total gamma band activity at electrodes Fz, Cz, and Pz in response to congruent sounds in the early analysis time window [204–284 ms; (A)] and to incongruent sounds in the late analysis time window in both groups [344–424 ms; (B); error bars indicate the 95% confidence intervals].
Control children showed an increase in total gamma band activity in response to congruent sounds relative to baseline peaking 244 ms after sound onset [t(9) = 4.426, p = 0.002]. Dyslexic children showed no change in total gamma band activity in response to congruent sounds relative to baseline [t(10) = 0.179, p = 0.862]. The group difference was statistically significant [t(19) = 2.661, p = 0.015].
The oscillatory brain responses to the incongruent sounds in both groups showed a decrease in total gamma band activity relative to baseline with a minimum at 384 ms after sound onset [control children: t(9) = 2.647, p = 0.027; dyslexic children: t(9) = 4.473, p = 0.001]. The decrease was significantly larger in dyslexic children than in control children [t(19) = 2.263, p = 0.036].
No significant group differences of uncorrected gamma band activity were observed in the baseline time window. Thus, the observed group effects in both time windows were not due to differences in baseline activity.
Discussion
Two groups of 7-year-old school children – a normal-reading control and a dyslexic group – were instructed to perform a Symbol-to-Sound matching task detecting incongruencies in asynchronously presented visual and sound patterns. Our main results were as follows: Both groups were able to perform the task. However, the performance was significantly worse in dyslexic children than in normal-reading children. ERP responses to incongruent compared to congruent sounds showed an N2b component in both groups; however, the N2b component in dyslexic children was delayed in onset and significantly smaller than the one found in the control children. Furthermore, the N2b amplitude correlated with children’s reading abilities. A P3a component for the incongruent sounds followed the N2b in the control, but not in dyslexic children. In addition, normal-reading children showed an early increase in induced gamma band power in response to congruent sounds, which was not observed in dyslexic children. Subsequently, both groups showed a decrease in induced gamma band activity in response to incongruent sounds, the decrease being significantly larger in dyslexic children.
Event-Related Potentials
In contrast to adults, the children showed no early incongruency response resembling the MMN component in latency (peaking around 100 ms after sound onset) and topography (bilateral frontal negativity and polarity inversion over mastoid leads; Widmann et al., 2004). The incongruency response component was interpreted as an initial error signal related to the detection of incongruency between the visual and the sound pattern. However, in the current study, a component which presumably is the N2b and which might be related to the incongruency response, was elicited. It has a significantly earlier onset in control than in dyslexic children (with the rising edge of N2b changing its slope at 150 ms post-stimulus onset).
Besides the N2b onset latency, impaired processing of congruency of symbol-sound combinations in dyslexia was also indicated by the N2b’s amplitude: in dyslexic children it was approximately half that found in control children. N2b is usually observed in response to deviant task-relevant stimuli in the active oddball paradigm and interpreted as reflecting processes related to attentive target discrimination (Ritter et al., 1979; Näätänen, 1992) and arousal or orienting response (Sokolov et al., 2002). As incongruent sounds are rare and can be interpreted as targets also in the Symbol-to-Sound matching paradigm, the later onset and lower amplitude of N2b found in dyslexic children might reflect later and less reliable processing of audiovisual congruency and discrimination of congruent against incongruent sounds at this level of stimulus processing. This N2b difference was restricted to the left hemisphere and central electrode locations, while the N2b was of equal amplitude over the right hemisphere electrode location. This finding indicates that the group difference is primarily due to differential processing in the left hemisphere corroborating evidence from the literature that dyslexia could be related to impaired left hemispheric processing. Blau et al. (2009), for example, argue that dyslexia is characterized by a deficit in phonological processing and an underactivation of the left superior temporal cortex, which, in turn, impairs the ability to map speech sounds onto their homologous visual letters. Our study shows that this deficit extends to non-linguistic stimulus material, while it still is confined to the hemisphere especially engaged in speech processing.
Furthermore, the N2b amplitude was significantly correlated with the children’s reading abilities, thus, presumably reflecting the impaired reading process in dyslexic children. However, it should be noted that the current task is not directly related to alphabetic or orthographic reading. Neither letters nor phonemes were used as stimulus material; instead they were substituted by visual symbols, which gain their “meaning” via their vertical offset and simple time-invariant sounds, which do not resemble phonemes. Thus, these results suggest that the difficulty in audiovisual integration might be a core deficit in dyslexia (Blomert, 2011), which is not confined to speech sounds and corresponding letters (letter-to-phoneme pairings), but rather more general in nature.
A P3a component in response to incongruent compared to congruent sounds with left-frontal topography was only observed in control children. P3a is, for example, observed in response to novel and salient sounds in passive oddball paradigms (e.g., Wetzel and Schröger, 2007) and to target sounds in active oddball paradigms as an N2b-P3a-complex (Sokolov et al., 2002). It has been related to the behavioral relevance of a stimulus, even if it is not defined as a target in the present task context. Thus, it may be associated with an orienting response (Nieuwenhuis et al., 2011), an involuntary switch of attention (Escera et al., 2000), and with the evaluation whether an event is of potential significance (Ritter and Vaughan, 1969; Winkler and Schröger, in revision). The MMN response in the control condition was highly similar between dyslexic and control children and did not indicate any major group difference at levels of auditory sensory processing and deviance detection. The later and presumably more cognitive N2b (indicating target selection) did already differ to a higher extent. At the level of the P3a (indicating the behavioral relevance of a stimulus) dyslexic children were characterized by a complete lack of this component. Thus, the identification processes related to audiovisual matching are impaired in dyslexia. In the model suggested by Widmann et al. (2007), audiovisual matching (and subsequent audiovisual integration) is based on auditory representations pre-activated by the predictive visual symbols. Hence, the observed impairment in crossmodal processing could also be related to the general difficulty dyslexic individuals have in dynamically constructing stimulus-specific predictions (Ahissar et al., 2006).
In the passive oddball control condition the same auditory stimuli and ISIs as in the Symbol-to-Sound matching condition were employed. There, an MMN component followed by a LDN was elicited. No significant group or hemisphere differences were observed (cf. Figure 2). As the automatic deviance detection system did not indicate group differences when only processing our auditory stimuli, we conclude that the discriminative abilities were not different in these dyslexic children compared to normal-reading children. Thus, group differences found in the in the Symbol-to-Sound matching condition can be attributed to the audiovisual task.
Oscillatory Activity
No evoked auditory GBRs were observed for any sound type in children unlike in adults in our previous study (Widmann et al., 2007). This might be due to either a lower signal-to-noise ratio in the children’s compared to the adults’ data, or due to effects of maturation. As auditory middle latency responses, which are presumably related to the auditory evoked GBR, were shown not to be reliably detectable before the age of about 10 years, the latter alternative appears to be more plausible (Kraus et al., 1985).
An early induced auditory GBR to congruent stimuli was obtained in normal-reading control children but not in dyslexic children. Latency and topography were similar to those reported for adults (Widmann et al., 2007) with a broad scalp distribution maximal over parietal sites and peaking about 150 ms post-stimulus onset. This response reflects a synchronization of neural activity, which was related to the binding of visual and auditory information. This is plausible since only in sounds congruent to the corresponding visual symbol this information could be successfully integrated. The finding that gamma band activity is in fact related to subjective perceptual experience of audiovisual stimuli supports this interpretation (Kaiser et al., 2006). Also in response to synchronously presented animal pictures and vocalizations an enhanced induced GBR was observed (Yuval-Greenberg and Deouell, 2007), and in lower frequency bands an increase of oscillatory activity in response to congruent relative to incongruent letter-speech sound pairs was reported (Herdman et al., 2006). Thus, in dyslexic children no or less integration of visual symbolic and auditory sensory information into a unitary audiovisual object representation appears to occur.
A later decrease in induced gamma band activity in response to incongruent sounds was observed in both groups of children. However, this effect was significantly larger in dyslexic children. A decrease of gamma band activity in response to incongruent sounds can also be identified in normal-reading adults (Figure 2 in Widmann et al., 2007). Desynchronization of gamma band neural activity has been previously related to the dissolution of binding of corresponding perceptual elements by resetting gamma oscillations in thalamo-cortical networks (Ross et al., 2005). The observed gamma band desynchronization might thus reflect the separation of activated auditory and visual representations in incongruent events. Enhanced desynchronization in dyslexic children might indicate a compensatory strategy, which actively dissolves incongruent elements rather than automatically integrates congruent auditory and visual elements. Alternatively, a late (>400 ms) decrease in beta and low gamma band activity has also been related to activity of the executive control attention network (Fan et al., 2007). However, the latter explanation is assumed not to be valid, as observed gamma band desynchronization starts markedly before 400 ms post-stimulus onset and already peaks around 400 ms.
It has been suggested that both in the visual (Yuval-Greenberg et al., 2008) and auditory domains the induced GBR is susceptible to contamination by spike potentials generated by micro-saccadic eye movements (Yuval-Greenberg and Deouell, 2011). A correlation between gamma band activity and saccadic rate was observed, both showing a stereotypical decrease of activity after sound onset followed by a sustained increase 200–300 ms after sound onset. This stereotypical pattern we observed neither in the adults’ (Widmann et al., 2007) nor in the children’s oscillatory responses: (1) There was no decrease in activity after sound onset. (2) At least in adults, the onset and peak of the observed induced GBR to congruent sounds was earlier than the activity rebound observed by Yuval-Greenberg. (3) Finally, the observed response was of transient, but not sustained nature in adults and in children; rather a decrease was observed in response to incongruent sounds. As we did not perform eye tracking together with the EEG to control for micro-saccades in this study, we cannot completely exclude the contamination of gamma band activity with spike potentials. However, as the observed activity pattern is so fundamentally different from the one reported by Yuval-Greenberg, we assume that our data reflect neural oscillatory activity rather than spike potentials.
To our knowledge, there is only a limited number of studies on higher frequency band oscillatory activity in general and gamma band activity in dyslexic subjects in particular. Amongst these, Rippon and Brunswick (2000) report impaired or reduced oscillatory activity. Nagarajan et al. (1999) and Ucles et al. (2009) observed reduced evoked gamma band activity in response to sounds. However, impairments in oscillatory neural activity at different time scales have been hypothesized to be the actual neurological deficit underlying dyslexia (for review see Llinas, 1993; Goswami, 2011). Our data are fully compatible with this hypothesis. Dyslexic children do not show an increase in induced oscillatory gamma band activity when congruent symbol and sound information is presented unlike adults and normal-reading control children. This can be interpreted as an impairment of binding or integrating multi-modal information.
Our results well support the hypothesis of a deficit in audiovisual integration as a possible proximal cause for the failure of reading acquisition in dyslexia as suggested by Blomert and Froyen (2010). Also in our study the missing induced GBR signature of binding of auditory and visual information and the reduced ERP responses to incongruent sounds are supposed to reflect a specific deficit in audiovisual integration. However, our Symbol-to-Sound mapping paradigm refrained from using language or reading related letter-speech sound material, employing rather artificial, culturally defined audiovisual relations. Rather simple, intuitive and rule-based audiovisual relations were employed instead and stimuli varied only in a single dimension (vertical offset and pitch, respectively). The fact that dyslexic children still showed severe impairments in the electrophysiological signatures of audiovisual integration emphasizes the fundamental nature of the deficit. Furthermore, the hypothesis of Blomert and Froyen (2010) was mostly based on more or less synchronous presentation of auditory and visual stimulation. Here we show that dyslexic children are not only impaired in integrating synchronously presented crossmodal information, but also are unable to activate auditory representations by predictive symbolic visual information when symbols are presented before the sounds. The finding that visual symbols can not automatically activate auditory (or audiovisual) representations even when connected by an intuitive, simple, uni-dimensional rule in dyslexic children is well compatible with the observation that dyslexic children do not reach fluent reading despite the mastery of letter-speech sound correspondence. Finally, as emphasized by Blomert (2011), orthographic-phonologic binding is mainly performed within a left lateralized posterior network within the left temporal cortex, in particular superior temporal sulcus and superior temporal gyrus and occipito-temporal areas. Interestingly, as our data demonstrate, the left hemispheric impairment in dyslexia with respect to audiovisual integration is not limited to language, speech, or letter related material, but also holds for non-language related stimulus material.
As outlined in the model by Widmann et al. (2007), several processes are assumed to be involved in audiovisual information processing and audiovisual integration in the Symbol-to-Sound matching paradigm. Visual symbols have to be dynamically mapped to pitch, and a corresponding auditory representation has to be activated. This auditory expectation has to be compared with the auditory sensory information received. In case of a mismatch, an error signal has to be generated, as reflected in the ERPs by the N2b. In case of a match, the visual representation and/or the auditory expectation have to be integrated with sensory information into a unitary object representation. The observed audiovisual deficit in dyslexic children could be due to one or more of these processes failing: The deficit could be due to impaired processes preceding and underlying comparison and integration; these processes include translation of symbolic visual information into auditory representations, dynamically constructing stimulus-specific predictions (Ahissar et al., 2006), and synchronization of auditory expectation and sensory input in time. The deficit could also be due to impaired comparison, integration, and target selection processes. In effect however, audiovisual processing of asynchronously presented visual symbols and sounds is impaired in dyslexia. The impaired neural functions resulting in the observed deficit in audiovisual processing and integration might also be responsible for other deficits observed in dyslexia in other tasks and paradigms, e.g., requiring dynamic predictions or temporal synchronization. Thus, the underlying deficit might not be necessarily audiovisual in nature. However, as reading and reading acquisition are functions relying fundamentally on audiovisual processing the observed audiovisual deficits might play a key role in our understanding of dyslexia as already suggested by other authors (e.g., Laasonen et al., 2000; Kujala et al., 2001; Lyytinen et al., 2007; Blau et al., 2010; Loo et al., 2010; Blomert, 2011; Froyen et al., 2011).
Given the large and significant differences between normal-reading and dyslexic children observed on the neurophysiological level in the Symbol-to-sound matching task, it is initially surprising that dyslexic children actually perform only slightly worse than controls and far above chance level on behavioral level in this task. Furthermore, as no difference in MMN amplitude in the passive oddball control condition was observed, it can be assumed that there were no major differences in auditory sensory discrimination abilities between the groups with the present stimulus set. On the basis of the observed gamma band activity we suggest that dyslexic children might solve the task using a different strategy: rather than more or less automatically integrating corresponding and congruent visual and auditory information, as normal-reading children do, dyslexic children operate by eliminating or “dis-integrating” non-matching information as reflected in the stronger decrease of induced gamma band activity in response to incongruent sounds. This interpretation is supported by the findings of Blau et al. (2010) showing that neural activation in response to letter-speech sound pairs reflecting integration is modulated by congruency only in normal-reading but not in dyslexic children. In future studies it should be tested whether the audiovisual training reported by Kujala et al. (2001) is effective by improving this compensatory strategy or by training to more successfully integrate graphemic and phonemic information. This should be reflected by an increase in induced gamma band activity in response to congruent sounds after the training. It should also be tested whether audiovisual training employing letter-speech sound material (Lyytinen et al., 2007, 2009) has differential effects from audiovisual training employing non-verbal material (Kujala et al., 2001) to further specify the nature of the neural deficit underlying dyslexia.
Conclusion
The present results emphasize the importance of audiovisual interaction and integration in our understanding of dyslexia. Dyslexic children show reduced N2b and P3a components in response to sounds incongruent with an asynchronously presented visual symbol in comparison with congruent sounds. This presumably reflects a correlate of the impaired processes resulting in a reading deficit also in non-verbal material. Furthermore, dyslexic children showed no induced GBR to congruent sounds but rather an enhanced gamma band desynchronization in response to incongruent sounds. Dyslexic children presumably do not solve the task by automatically activating auditory representations of the predictive visual symbols and integrating them into a audiovisual object representation, as normal-reading children do, but rather use a fundamentally different strategy; possibly they solve the task by eliminating non-matching incongruent stimuli as indicated by the observed desynchronization of brain activity. Based on the current evidence and its implications, the Symbol-to-Sound matching paradigm could provide a valuable tool for understanding the remediating effects of audiovisual training in dyslexia and shedding light on the question how the impairment in oscillatory activity is related to the neurological deficit in dyslexia.
Conflict of Interest Statement
The authors declare that the research was conducted in the absence of any commercial or financial relationships that could be construed as a potential conflict of interest.
Acknowledgments
We are grateful to Pasi Piiparinen and Leena Wallendahr for their help in conducting the experiment, to the teachers Matti Leppänen, Matti Leinonen, Sari Ukkonen, Reine Liikkanen, Katriina Eteläpää, Aini Kivelä, Jorma Fredriksson, Matti Isotalo, Maija-Leena Hakamo, and Satu Heusala for their assistance and cooperation, and to Anna Janska for her help in copyediting this manuscript. The research was supported by grants from the Deutscher Akademischer Austauschdienst (DAAD; German Academic Exchange Service), the German Research Foundation (a Koselleck grant to Erich Schröger), and The Academy of Finland (grant number 128840).
References
Ahissar, M., Lubin, Y., Putter-Katz, H., and Banai, K. (2006). Dyslexia and the failure to form a perceptual anchor. Nat. Neurosci. 9, 1558–1564.
Baldeweg, T., Richardson, A., Watkins, S., Foale, C., and Gruzelier, J. (1999). Impaired auditory frequency discrimination in dyslexia detected with mismatch evoked potentials. Ann. Neurol. 45, 495–503.
Blau, V., Reithler, J., Van Atteveldt, N., Seitz, J., Gerretsen, P., Goebel, R., and Blomert, L. (2010). Deviant processing of letters and speech sounds as proximate cause of reading failure: a functional magnetic resonance imaging study of dyslexic children. Brain 133, 868–879.
Blau, V., Van Atteveldt, N., Ekkebus, M., Goebel, R., and Blomert, L. (2009). Reduced neural integration of letters and speech sounds links phonological and reading deficits in adult dyslexia. Curr. Biol. 19, 503–508.
Blomert, L. (2011). The neural signature of orthographic-phonological binding in successful and failing reading development. Neuroimage 57, 695–703.
Blomert, L., and Froyen, D. (2010). Multi-sensory learning and learning to read. Int. J. Psychophysiol. 77, 195–204.
Bradley, L., and Bryant, P. E. (1978). Difficulties in auditory organisation as a possible cause of reading backwardness. Nature 271, 746–747.
Brem, S., Bach, S., Kucian, K., Guttorm, T. K., Martin, E., Lyytinen, H., Brandeis, D., and Richardson, U. (2010). Brain sensitivity to print emerges when children learn letter-speech sound correspondences. Proc. Natl. Acad. Sci. U.S.A. 107, 7939–7944.
Escera, C., Alho, K., Schröger, E., and Winkler, I. (2000). Involuntary attention and distractibility as evaluated with event-related brain potentials. Audiol. Neurootol. 5, 151–166.
Fan, J., Byrne, J., Worden, M. S., Guise, K. G., Mccandliss, B. D., Fossella, J., and Posner, M. I. (2007). The relation of brain oscillations to attentional networks. J. Neurosci. 27, 6197–6206.
Froyen, D., Willems, G., and Blomert, L. (2011). Evidence for a specific cross-modal association deficit in dyslexia: an electrophysiological study of letter-speech sound processing. Dev. Sci. 14, 635–648.
Gabrieli, J. D. (2009). Dyslexia: a new synergy between education and cognitive neuroscience. Science 325, 280–283.
Goswami, U. (2011). A temporal sampling framework for developmental dyslexia. Trends Cogn. Sci. (Regul. Ed.) 15, 3–10.
Herdman, A. T., Fujioka, T., Chau, W., Ross, B., Pantev, C., and Picton, T. W. (2006). Cortical oscillations related to processing congruent and incongruent grapheme-phoneme pairs. Neurosci. Lett. 399, 61–66.
Herrmann, C. S., and Mecklinger, A. (2000). Magnetoencephalographic responses to illusory figures: early evoked gamma is affected by processing of stimulus features. Int. J. Psychophysiol. 38, 265–281.
Herrmann, C. S., Munk, M. H., and Engel, A. K. (2004). Cognitive functions of gamma-band activity: memory match and utilization. Trends Cogn. Sci. (Regul. Ed.) 8, 347–355.
Kaiser, J., Hertrich, I., Ackermann, H., and Lutzenberger, W. (2006). Gamma-band activity over early sensory areas predicts detection of changes in audiovisual speech stimuli. Neuroimage 30, 1376–1382.
Kraus, N., Smith, D. I., Reed, N. L., Stein, L. K., and Cartee, C. (1985). Auditory middle latency responses in children: effects of age and diagnostic category. Electroencephalogr. Clin. Neurophysiol. 62, 343–351.
Kujala, T. (2007). The role of early auditory discrimination deficits in language disorders. J. Psychophysiol. 21, 239–250.
Kujala, T., Karma, K., Ceponiene, R., Belitz, S., Turkkila, P., Tervaniemi, M., and Näätänen, R. (2001). Plastic neural changes and reading improvement caused by audiovisual training in reading-impaired children. Proc. Natl. Acad. Sci. U.S.A. 98, 10509–10514.
Kujala, T., Lovio, R., Lepisto, T., Laasonen, M., and Näätänen, R. (2006). Evaluation of multi-attribute auditory discrimination in dyslexia with the mismatch negativity. Clin. Neurophysiol. 117, 885–893.
Laasonen, M., Tomma-Halme, J., Lahti-Nuuttila, P., Service, E., and Virsu, V. (2000). Rate of information segregation in developmentally dyslexic children. Brain Lang. 75, 66–81.
Lachmann, T., Berti, S., Kujala, T., and Schröger, E. (2005). Diagnostic subgroups of developmental dyslexia have different deficits in neural processing of tones and phonemes. Int. J. Psychophysiol. 56, 105–120.
Loo, J. H., Bamiou, D. E., Campbell, N., and Luxon, L. M. (2010). Computer-based auditory training (CBAT): benefits for children with language- and reading-related learning difficulties. Dev. Med. Child Neurol. 52, 708–717.
Lovio, R., Näätänen, R., and Kujala, T. (2010). Abnormal pattern of cortical speech feature discrimination in 6-year-old children at risk for dyslexia. Brain Res. 1335, 53–62.
Lyytinen, H., Erskine, J., Kujala, J., Ojanen, E., and Richardson, U. (2009). In search of a science-based application: a learning tool for reading acquisition. Scand. J. Psychol. 50, 668–675.
Lyytinen, H., Ronimus, M., Alanko, A., Poikkeus, A. M., and Taanila, M. (2007). Early identification of dyslexia and the use of computer game-based practice to support reading acquisition. Nord. Psykol. 59, 109–126.
Nagarajan, S., Mahncke, H., Salz, T., Tallal, P., Roberts, T., and Merzenich, M. M. (1999). Cortical auditory signal processing in poor readers. Proc. Natl. Acad. Sci. U.S.A. 96, 6483–6488.
Nieuwenhuis, S., De Geus, E. J., and Aston-Jones, G. (2011). The anatomical and functional relationship between the P3 and autonomic components of the orienting response. Psychophysiology 48, 162–175.
Poskiparta, E., Niemi, P., and Lepola, J. (1994). Diagnostiset testit: I Lukeminen ja kirjoittaminen (Diagnostic Tests: I Reading and Writing). Turku: University of Turku.
Rahne, T., Von Specht, H., and Mühler, R. (2008). Sorted averaging–application to auditory event-related responses. J. Neurosci. Methods 172, 74–78.
Ramus, F. (2004). Neurobiology of dyslexia: a reinterpretation of the data. Trends Neurosci. 27, 720–726.
Rippon, G., and Brunswick, N. (2000). Trait and state EEG indices of information processing in developmental dyslexia. Int. J. Psychophysiol. 36, 251–265.
Ritter, W., Simson, R., Vaughan, H. G. Jr., and Friedman, D. (1979). A brain event related to the making of a sensory discrimination. Science 203, 1358–1361.
Ritter, W., and Vaughan, H. G. Jr. (1969). Averaged evoked responses in vigilance and discrimination: a reassessment. Science 164, 326–328.
Ross, B., Herdman, A. T., and Pantev, C. (2005). Stimulus induced desynchronization of human auditory 40-Hz steady-state responses. J. Neurophysiol. 94, 4082–4093.
Saine, N. L., Lerkkanen, M. K., Ahonen, T., Tolvanen, A., and Lyytinen, H. (2011). Computer-assisted remedial reading intervention for school beginners at risk for reading disability. Child Dev. 82, 1013–1028.
Schulte-Körne, G., Deimel, W., Bartling, J., and Remschmidt, H. (1998). Auditory processing and dyslexia: evidence for a specific speech processing deficit. Neuroreport 9, 337–340.
Sokolov, E. N., Spinks, J. A., Näätänen, R., and Lyytinen, H. (2002). The Orienting Response in Information Processing. Mahwah, NJ: Lawrence Erlbaum Associates Publishers.
Stein, J., and Walsh, V. (1997). To see but not to read; the magnocellular theory of dyslexia. Trends Neurosci. 20, 147–152.
Tallon-Baudry, C., and Bertrand, O. (1999). Oscillatory gamma activity in humans and its role in object representation. Trends Cogn. Sci. (Regul. Ed.) 3, 151–162.
Tallon-Baudry, C., Bertrand, O., Delpuech, C., and Pernier, J. (1996). Stimulus specificity of phase-locked and non-phase-locked 40 Hz visual responses in human. J. Neurosci. 16, 4240–4249.
Törmänen, M. R., and Takala, M. (2009). Auditory processing in developmental dyslexia: an exploratory study of an auditory and visual matching training program with Swedish children with developmental dyslexia. Scand. J. Psychol. 50, 277–285.
Ucles, P., Mendez, M., and Garay, J. (2009). Low-level defective processing of non-verbal sounds in dyslexic children. Dyslexia 15, 72–85.
Wetzel, N., and Schröger, E. (2007). Modulation of involuntary attention by the duration of novel and pitch deviant sounds in children and adolescents. Biol. Psychol. 75, 24–31.
Widmann, A., Gruber, T., Kujala, T., Tervaniemi, M., and Schröger, E. (2007). Binding symbols and sounds: evidence from event-related oscillatory gamma-band activity. Cereb. Cortex 17, 2696–2702.
Widmann, A., Kujala, T., Tervaniemi, M., Kujala, A., and Schröger, E. (2004). From symbols to sounds: visual symbolic information activates sound representations. Psychophysiology 41, 709–715.
Wimmer, H., and Schurz, M. (2010). Dyslexia in regular orthographies: manifestation and causation. Dyslexia 16, 283–299.
Wimmer, H., Schurz, M., Sturm, D., Richlan, F., Klackl, J., Kronbichler, M., and Ladurner, G. (2010). A dual-route perspective on poor reading in a regular orthography: an fMRI study. Cortex 46, 1284–1298.
Yuval-Greenberg, S., and Deouell, L. Y. (2007). What you see is not (always) what you hear: induced gamma band responses reflect cross-modal interactions in familiar object recognition. J. Neurosci. 27, 1090–1096.
Yuval-Greenberg, S., and Deouell, L. Y. (2011). Scalp-recorded induced gamma-band responses to auditory stimulation and its correlations with saccadic muscle-activity. Brain Topogr. 24, 30–39.
Keywords: dyslexia, audiovisual, integration, mismatch, reading, gamma band, oscillatory activity, ERPs
Citation: Widmann A, Schröger E, Tervaniemi M, Pakarinen S and Kujala T (2012) Mapping symbols to sounds: electrophysiological correlates of the impaired reading process in dyslexia. Front. Psychology 3:60. doi: 10.3389/fpsyg.2012.00060
Received: 16 December 2011; Accepted: 15 February 2012;
Published online: 02 March 2012.
Edited by:
Lucia Melloni, Max Planck Institute for Brain Research, GermanyReviewed by:
Lisa D. Sanders, University of Massachusetts Amherst, USAJordi Costa-Faidella, University of Barcelona, Spain
Copyright: © 2012 Widmann, Schröger, Tervaniemi, Pakarinen and Kujala. This is an open-access article distributed under the terms of the Creative Commons Attribution Non Commercial License, which permits non-commercial use, distribution, and reproduction in other forums, provided the original authors and source are credited.
*Correspondence: Andreas Widmann, Institute of Psychology, University of Leipzig, Seeburgstr. 14-20, D-04103 Leipzig, Germany. e-mail: widmann@uni-leipzig.de