
- 1 Birmingham VA Medical Center, Birmingham, AL, USA
- 2 Department of Neurology, University of Alabama at Birmingham, Birmingham, AL, USA
Background: Despite general agreement that aphasic individuals exhibit difficulty understanding complex sentences, the nature of sentence complexity itself is unresolved. In addition, aphasic individuals appear to make use of heuristic strategies for understanding sentences. This research is a comparison of predictions derived from two approaches to the quantification of sentence complexity, one based on the hierarchical structure of sentences, and the other based on dependency locality theory (DLT). Complexity metrics derived from these theories are evaluated under various assumptions of heuristic use. Method: A set of complexity metrics was derived from each general theory of sentence complexity and paired with assumptions of heuristic use. Probability spaces were generated that summarized the possible patterns of performance across 16 different sentence structures. The maximum likelihood of comprehension scores of 42 aphasic individuals was then computed for each probability space and the expected scores from the best-fitting points in the space were recorded for comparison to the actual scores. Predictions were then compared using measures of fit quality derived from linear mixed effects models. Results: All three of the metrics that provide the most consistently accurate predictions of patient scores rely on storage costs based on the DLT. Patients appear to employ an Agent–Theme heuristic, but vary in their tendency to accept heuristically generated interpretations. Furthermore, the ability to apply the heuristic may be degraded in proportion to aphasia severity. Conclusion: DLT-derived storage costs provide the best prediction of sentence comprehension patterns in aphasia. Because these costs are estimated by counting incomplete syntactic dependencies at each point in a sentence, this finding suggests that aphasia is associated with reduced availability of cognitive resources for maintaining these dependencies.
Introduction
Individuals with aphasia often exhibit difficulty comprehending sentences even when their ability to understand single words is intact. Not all sentences are affected equally, however. Aphasic speakers of English perform better with sentences in which the order of elements in the sentence corresponds to the canonical order Agent–Verb–Theme (where Agent and Theme represent nouns that are assigned semantic roles by the verb). Sentences that deviate from this pattern are more difficult to comprehend. This observation is especially true of “semantically reversible” sentences, in which either of the semantic roles of the verb could be filled with either of the nouns. For example, consider sentences (1–3), below, all of which contain a relative clause in the subject.
(1) The dog that the cat chased was black.
(2) The dog that chased the cat was black.
(3) The apple that the boy ate was red.
Sentence (1) is non-canonical, because the object relative clause results in the word order Theme–Agent–Verb. Sentence (2) is canonical, with the typical Agent–Verb–Theme word order. Sentence (3) is non-canonical, but is not semantically reversible (because apples do not eat boys). Out of these three sentences, patients with aphasia exhibit significant difficulty interpreting the embedded verb only with sentences like (1) (Caramazza and Zurif, 1976). This pattern was originally described in patients with Broca’s or conduction aphasia, but more recent work suggests that it is not restricted to any particular aphasic syndrome (Caplan et al., 2007a). Caramazza and Zurif (1976) argue that this pattern emerges from degradation of syntax-like algorithms. Subsequent work has extended the finding to sentences with other structures, such as passive voice (Caplan et al., 1996; Grodzinsky, 2000).
There is a general consensus that sentence structures may be ordered in terms of their complexity, and that patients with aphasia have greater difficulty with more complex sentences. However, the issue of what makes one sentence more complex than another has not been resolved. Early work in psycholinguistics relates complexity to the number of transformations required to derive a sentence from a simpler kernel sentence (Miller and McKean, 1964), a hypothesis known as the Derivational Theory of Complexity. Subsequent work casts doubt on this theory (Martin and Roberts, 1966; Slobin, 1966), and some investigators currently working in psycholinguistics express dissatisfaction with the use of transformational grammar in psychological studies, a shift that likely began when Fodor et al. (1974) questioned the psychological reality of transformations (but see Marantz, 2005 for a nuanced view). Nevertheless, researchers studying aphasia continue to use the tools of linguistic theory, often with the goal of dichotomizing sentences into categories of “difficult” and “easy.” This approach has led to a number of insightful hypotheses, including the Trace Deletion Hypothesis (TDH; Grodzinsky, 1990; Grodzinsky, 1995a,b; Grodzinsky, 2000; Su et al., 2007), the Double Dependency Hypothesis (DDH; Mauner et al., 1993; Beretta and Munn, 1998; Beretta et al., 1999), the Mapping Hypothesis (Linebarger et al., 1983), a hypothesis based on Case theory (Druks and Marshall, 1995), and the Structural Prominence Hypothesis (SPH; Friederici and Gorrell, 1998). (For reviews of sentence comprehension in aphasia, see Clark (2011) and Dick et al., 2001.) Much work along these lines seeks to identify a specific feature of the grammar, as defined in syntactic theory, that appears to be degraded by brain damage. However, because the lesion is defined qualitatively (e.g., a trace is either deleted or not – there is no partial degradation), these hypotheses do not have sufficient flexibility to explain the more continuous variation that has been observed among patients and sentence structures. A goal of the current study is to explain continuous variation in sentence comprehension performance. One of two hypotheses that are compared, which found some support in previous work (Clark, 2009), resembles these other theories of aphasic sentence comprehension in that it makes use of hierarchical representations from theoretical syntax. This hypothesis is discussed in detail below.
The current work takes the position that aphasic sentence comprehension deficits do not arise from a categorical defect of some very specific construct from syntactic theory, and employs elementary probability theory to model continuous variation in sentence complexity and patient performance. Other investigators in aphasia have applied probability theory to the study of sentence comprehension (Drai and Grodzinsky, 2006), but still make use of categorical distinctions among sentence types. This work has drawn some criticism on linguistic and methodological grounds (De Bleser et al., 2006; Toraldo and Luzzatti, 2006). Much of the evidence supporting the presence of continuous variation (among patients and sentence structures) comes from the work of Caplan et al. (1996, 1997, 2007a). These investigators observe that patients who exhibit difficulty interpreting non-canonical sentence structures with moved elements [e.g., sentence (1), which has a subject–object relative clause] also exhibit difficulty with other sentence structures that do not have moved elements (such as sentences with reflexive pronouns). Factor analysis of the performance of 42 aphasic patients on 11 different sentence structures reveals that all 11 structures load heavily on the first factor (Caplan et al., 2007a). Theories that make categorical distinctions among sentence types predict that patients with agrammatism must guess on sentences that are classified as difficult. However, self-paced listening data from this study show that processing times of sentences that are subsequently misinterpreted differ from those of sentences that are interpreted correctly. This finding suggests that even in brain-damaged persons with sentence comprehension deficits, correct responses occur when parsing and interpretive mechanisms happen to function properly, rather than only when subjects guess correctly. Based on these and similar findings, the authors conclude that the dominant pattern of aphasic sentence comprehension arises due to degradation of a single resource that is important for normal syntactic and interpretive processes. One candidate for this resource is a relatively specialized form of working memory (Caplan and Waters, 1999), and this possibility has been supported with a computational model of sentence processing (Haarmann et al., 1997).
Although research in psycholinguistics no longer makes use of the original Derivational Theory of Complexity, the question of what factors make one sentence more complex than another continues to generate debate. There are two general approaches that have been applied in recent years to the study of non-brain-damaged individuals: those based on working memory, and those based on probabilistic expectations. Memory-based accounts propose that complexity is the result either of decaying activation of the representation of a previously encountered word, or of interference in the retrieval of a word due to interposed material that binds up scarce processing resources (Gibson, 2000; Lewis and Vasishth, 2005). Expectation-based accounts propose that the difficulty of processing any given word in a sentence context depends on the conditional probability of the word itself or of its syntactic type given the sentence context so far (Hale, 2001; Levy, 2008; Levy et al., 2012).
The work presented here focuses in part on one memory-based account, namely, the dependency locality theory (DLT; Gibson, 2000). According to this theory, difficulties of language parsing and interpretation arise from two concurrent processes that draw on the same cognitive resource. These processes are integration and storage. Integration consists of “connecting a [new] word into structure that has been built for the input thus far” (Gibson, 2000). Integration becomes costlier (more complex) with increasing distance between two elements that must be integrated. Gibson operationalizes integration as a simple count of new discourse referents and discourse referents that intervene between two phrases that must be integrated. When quantified in this way, integration costs account for difficulties with nested structures and for self-paced reading times of subject–subject and subject–object relative clauses. The other process in the theory, storage, consists of maintaining a mental representation of sentence structure, and also (perhaps more importantly) keeping track of predictions regarding which syntactic constituents should occur later in the input. Storage is operationalized by simply counting, at each word in the input, the minimal number of syntactic elements that would be sufficient to provide a coherent end to the sentence being apprehended. Measured in this way, storage costs associated with the expectation of additional verbs account for periods of slowing observed in online reading times (Chen et al., 2005).
Predictions of the DLT are directly compared here with the proposal that variation in the complexity of sentences arises from qualities of their hierarchical structure. Hypotheses that characterize sentence difficulty in terms of hierarchical syntactic relationships could provide a link between linguistic theory and the single-resource hypothesis. The original presentation of this hypothesis is couched in terms of economy of derivation, chiefly using data on language production and grammaticality judgment from two agrammatic speakers of Japanese (Hagiwara, 1995). Hagiwara concludes that aphasic speakers have greater access to functional heads that occur in lower positions in the syntactic derivation. Friederici and Gorrell (1998) provide observations across four different languages that aphasic individuals often assign the semantic Agent role to the most “structurally prominent” noun phrase in a syntactic representation. Again, this hypothesis emphasizes qualities of the syntactic derivation rather than a linear order mapping for determining sentence meaning. Subsequent observations from aphasic speakers of Hebrew and Palestinian Arabic have led to the formulation of the Tree Pruning Hypothesis, which is founded chiefly on observations that these individuals have difficulty producing material in proportion to its height in the syntactic tree (Friedmann and Grodzinsky, 1997). This hypothesis has been generalized to include language comprehension (Luzzatti and Guasti, 2001; Friedmann, 2006). A simulation of language comprehension using modified computational semantics software provides some evidence that hierarchical structure can account for quantitative patterns in aphasic sentence comprehension (Clark, 2009). Specifically, the accuracy of semantic representations assembled by a degradable parser was shown to correlate with the performance of a group of patients with aphasia. An advantage of this approach is that it is sufficiently flexible to account for the apparent continuous variation observed among both patients and sentence structures.
For the purposes of this research, the structures of the sentences under evaluation are made explicit using combinatory categorial grammar (CCG; Steedman, 1996; Steedman, 2001; Reitter et al., 2006, 2011). CCG derivations resemble those of traditional categorial grammar, in that every word is assigned a syntactic type that describes what type it will take as an argument, whether the argument should precede or follow the word, and what syntactic type will result when the word is applied to its argument. For example, the definite article “the” has type NP/N, indicating that (1) it takes a noun (N) as argument, (2) this noun must succeed the article (indicated by the forward slash), and (3) the resulting type will be an NP. In addition to syntactic types, words in CCG are associated with semantic information. Each step in the syntactic derivation is accompanied by a parallel compositional semantic step such that complete syntactic derivations result in logically complete interpretations. Importantly, the use of CCG for the current work permits the assumption that strings of words that are parsed are also interpreted, without the necessity of introducing additional interpretive machinery or of showing the semantic interpretations. CCG has the advantage that its weak generative capacity is mildly context sensitive – that is, it is capable of generating certain particular word sequences that occur in natural language, but that cannot be derived using less powerful computational formalisms, such as regular or context-free grammars (Joshi et al., 1991). CCG gains this additional power through the use of combinators, including function composition, substitution, and type-raising. (For a very entertaining introduction to combinatory logic, see Smullyan, 2000). See Figure 1 for an example of a CCG derivation.
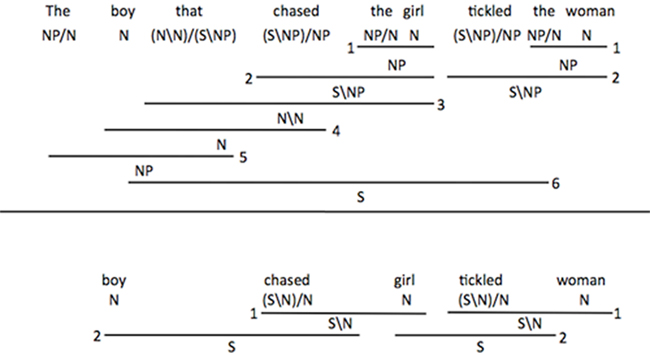
Figure 1. Syntactic derivations from combinatory categorial grammar (CCG). In this formalism, functions are represented by the schema (X/Y) or (X/Y), in which X is the output of the function, Y is the required argument, and the slash tells whether the argument must be found to the left or to the right of the function. For example, syntactic combination of the (NP/N) and girl (N) yields the girl (NP). (A) Parsing the subject with the subject relative clause requires the integration of material at levels 1, 2, 3, 4, and 5. Comprehension of the entire sentence requires additional integration steps at levels 1, 2, and 6. (B) A shallow heuristic parse of the content words from the subject phrase can be accomplished by integrating material only at levels 1 and 2, yielding the correct thematic role assignment. However, use of the same strategy on the second NVN sequence yields the wrong agent for the verb tickled.
Both the tree-based and the DLT-based methods for quantifying sentence complexity offer a means by which to generate numerically explicit predictions regarding patterns of sentence comprehension difficulty in aphasia. In both cases, the potential for a sentence to be considered complex can be described in terms of a list of numbers. (A “list” resembles a set but may contain more than one copy of any given element.) The work presented here starts from the assumption that the probability that an individual will adequately parse and interpret sentence-level information is degraded in proportion to two things: the severity of the individual’s aphasia and some quantification of sentence complexity derived from numerical tree-based or DLT-based descriptions.
Several lines of evidence indicate that cognitively normal individuals, and probably also individuals with aphasia, make use of heuristic strategies during language comprehension tasks (Townsend and Bever, 2001; Ferreira et al., 2002; Ferreira, 2003; van Herten et al., 2006; Ferreira and Patson, 2007). The work presented here assumes that individuals with aphasia may apply a heuristic in which the first two nouns of “noun–verb–noun” (NVN) or “noun–noun–verb” (NNV) sequences are interpreted as the semantic Agent and Theme of the verb. Predictions of aphasic sentence comprehension performance are made by combining complexity metrics, as sketched briefly above, with various assumptions regarding application of this heuristic.
This research is an effort to characterize the performance of a group of aphasic individuals on 16 sentence structures using elements of probability theory. The data come from Caplan et al. (2007a). The primary goal is to define a precise and methodical approach for evaluating and contrasting hypotheses that pertain to sentence comprehension in aphasia. There are four key questions. The primary question is which of several complexity metrics provides the best fit to observed comprehension patterns among aphasic individuals. The complexity metrics are all based either on the DLT (i.e., storage costs, integration costs, or a combination of the two) or on hierarchical sentence structures derived with CCG. The second question is whether aphasic patients employ an Agent–Theme heuristic when interpreting sentences. The third question is whether patients apply this heuristic obligatorily or vary in their tendency to apply it. Heterogeneity of heuristic use would provide another dimension along which aphasic patients might vary, potentially augmenting characterizations based solely on severity. (Alternatively, patients could apply the heuristic obligatorily but vary in their tendency to accept the interpretation it yields. This research does not distinguish between these possibilities.) The fourth question is whether heuristic skills are degraded by the lesion that produces aphasia. Conceivably, if the application of the heuristic is semantically driven, and neural structures supporting semantic cognition are more distributed across the cerebrum than those supporting syntax, heuristics might be relatively preserved in the setting of aphasia. On the other hand, if heuristic skills rely on some of the same machinery as syntax (or are, in fact, early steps in constructing a syntactic representation), then these skills could be degraded in proportion to the severity of the aphasia. As pointed out by Hagiwara and Caplan (1990), the most severely impaired patients of Caplan and Hildebrandt (1988) appear to be unable to use a heuristic strategy. It should be noted that both degradation of heuristic skills and reduced application of heuristics drive performance closer to chance levels, making the distinction of these possibilities difficult. The method for addressing this problem is discussed in detail in Section “Heuristics.”
The goal of this research was to compare tree-based and DLT-based metrics for explaining patterns of aphasic sentence comprehension. The approach was to generate a thorough numerical characterization of the expected patterns of aphasic sentence comprehension under a variety of different assumptions. Observations of actual patient performance were then compared to these numerical descriptions to determine which assumptions result in the best fit.
Materials and Methods
Overview
Data for this project came from work published in Caplan et al. (2007a,b), which include a generous set of patient-level data detailing demographic and clinical characteristics, lesion locations, and sentence comprehension abilities of 42 aphasic individuals with a wide range of anatomical lesions and clinical aphasia syndromes. All of the patients had sufficient comprehension ability to take part in the study, but a broad range of performance in sentence comprehension was observed. The patients were tested with three tasks: a sentence–picture verification (SPV) task using 10 sentence structures, a sentence–picture matching (SPM) task using 11 sentence structures (five of which overlapped those of the SPV task), and an object manipulation (OM) task that used the same sentences as the SPM task. Thus, the 42 patients were tested with 16 different sentence structures. Preliminary analysis suggested that accuracy with sentences that contained two propositions (such as subject–object and subject–subject relatives) dropped much more rapidly with increasing aphasia severity on the OM task than on the SPM or SPV tasks. This difference might be due to the necessity of either accurately interpreting multiple propositions or making separate interpretations or guesses for each proposition. Importantly, the necessary assumptions for modeling the OM data differ substantially from those required to model the more constrained tasks. As a result, only the SPM and SPV data were used for this analysis. The set of sentences from each task that used the same sentence structure is referred to as a “subtest” throughout the manuscript. There were 21 subtests (11 from SPM and 10 from SPV), but only 16 different sentence structures due to the fact that the SPM and SPV tasks had 5 sentences with the same structure. Items from the various subtests were administered in pseudorandom order, not in block format.
Hypotheses of sentence complexity were evaluated in four steps: (1) probability spaces were generated for each metric (see Generating a Probability Space), (2) patient data were fit to the probability spaces (see Fitting Patient Data to the Probability Space), (3) the model’s predictions were derived for each metric (see Deriving Predictions of the Model), and (4) the accuracies of the predictions of all the metrics were compared (see Comparison of Predictions Made by Different Hypotheses).
Generating a Probability Space
The term “probability space” is used loosely here. Strictly, the term should be applied to groups of disjoint outcomes with probabilities that sum to 1.0. Here, the term is being used to refer to a data structure that contains a large set of probability mass functions (PMFs; each of which satisfies the strict definition of probability space).
Each hypothesis of sentence complexity was made numerically explicit by specifying a quantitative complexity metric (see Table 1 for the 12 complexity metrics that were evaluated). For each complexity metric, a four-dimensional probability space was constructed. The four dimensions of the probability space were (1) aphasia severity (s), which ranged from 0.0 (unimpaired) to 1.0 (completely unable to use syntax), (2) heuristic acceptance probability (h), which ranged from 0.0 (never accepting the heuristic interpretation) to 1.0 (always accepting the heuristic interpretation), (3) sentence structure (of 16 possible structures, including active voice, reflexive genitive, etc.), and (4) scores on each test of sentence structures, which ranged from 0 up to either 9 or 10, depending on the specific subtest. Thus, this probability space contained a comprehensive sampling of the possible patterns of sentence comprehension that could occur under the hypothesis embodied by the metric. The value stored at each location in the space represented a probability. For example, under a given hypothesis, the coordinates {0.15, 0.4, active, 7/10} could contain the value 0.24, indicating that a patient with s = 0.15 and h = 0.4, when tested with active voice sentences, would obtain a score of 7/10 with 24% probability.
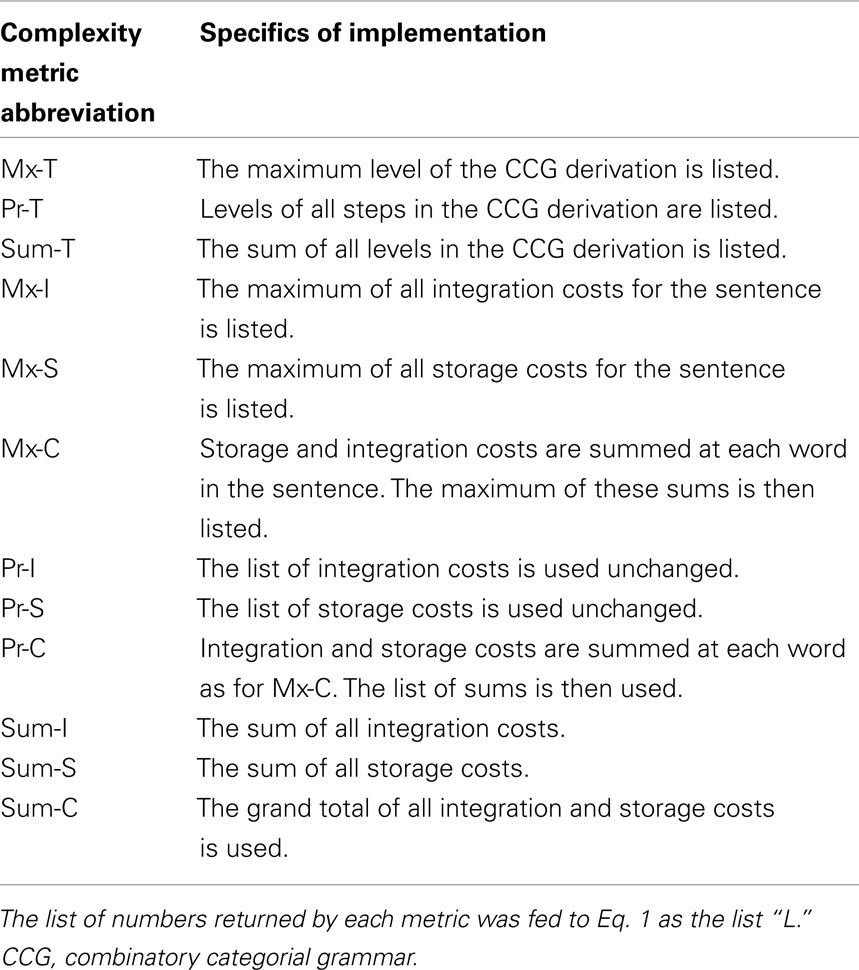
Table 1. Sentence complexity metric abbreviations and methods.
The goal of setting up this probability space was to find the point in the space where each aphasic patient fit and then to use the probabilities at that point as predictions of performance. Figure 2 provides a metaphorical illustration of the probability space. Two of the dimensions (aphasia severity s and heuristic acceptance probability h) were assumed to be unknown for every patient prior to fitting the patient’s data to the space. These two variables are represented in Figure 2 as the rows and columns in a two-dimensional grid of locked boxes. The remaining two dimensions, sentence structures and predicted subtest scores, are represented as a pattern of pins inside the lock on each box. This “pattern of pins” is actually a set of binomial PMFs over possible scores on the subtests for the sentence structures. The PMFs were dependent on the parameters s and h, because they were actually computed by applying the complexity metric that was being evaluated to each sentence structure under the assumption of specific values for these two parameters.
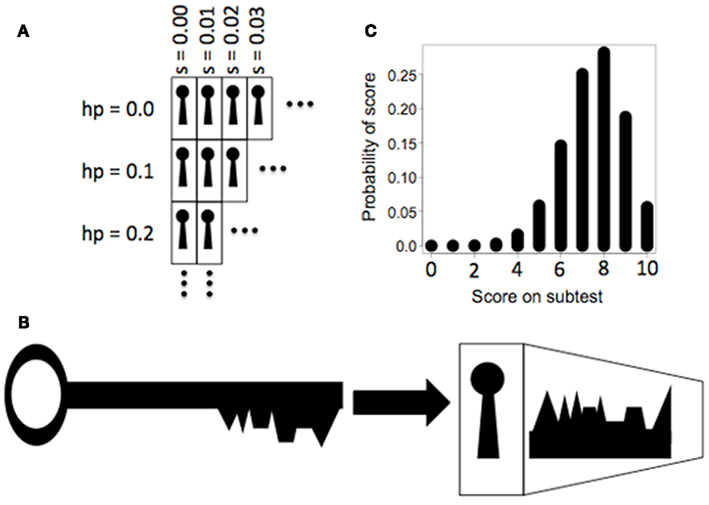
Figure 2. Lock and key metaphor for maximum likelihood estimation. (A) Two dimensions of the probability space lie along the axes of aphasia severity (s) and heuristic acceptance probability (h). These axes are depicted here as columns and rows of locked boxes. (B) Actual scores on sentence comprehension tests by an aphasic individual are depicted here as teeth on a key. The key has varying degrees of fit with the pins inside the locks. The pins represent estimates of scores based on a given sentence complexity metric. (C) A binomial probability mass function (PMF) describing the probabilities of different scores on a given subtest of the aphasia evaluation. The pins inside the lock are actually PMFs. Given a list of actual scores, these PMFs can be used to calculate the likelihood of those scores. By testing a given key in every available box, the values of the s and h parameters that provide the best fit can be determined.
Five specific steps were taken to generate the probability space. These are explained in detail in following sections below.
Numerical descriptions of sentence structures
Each sentence structure was assigned a numerical description pertaining to its potential for complexity. For tree-based metrics, the description consisted of the level of each node (i.e., function application, composition, or type-raising) in the hierarchical syntactic derivation. Syntactic derivations were typical canonical derivations from CCG. For the DLT-based metrics, the description consisted of the estimated storage or integration costs at each word. All CCG derivations and DLT-based costs are listed in Appendix and Table A1 in Appendix, respectively. Note that for both types of metrics, the information available for specifying a complexity metric consisted of a list of whole numbers (either a list of node levels or a list of DLT-based costs).
Application of complexity metrics to numerical sentence descriptions
A complexity metric was specified and applied to the numerical description of each sentence structure. This metric was an explicit method of assigning to each sentence structure a probability that a patient could successfully apply syntactic mechanisms to accurately interpret sentences with the structure. See Table 1 for a list of the complexity metrics that were evaluated. The probability of successfully using syntactic mechanisms to arrive at an accurate sentence interpretation was computed using Eq. 1:
where s represents the numerical aphasia severity (between 0.0 and 1.0) and L represents the a list of numbers that was specific to a given sentence structure and complexity metric. In cases where L consisted of only one number (such as a maximum or a sum), the probability returned by f(s) was reduced linearly in proportion to s. In cases where L consisted of a list of numbers (e.g., storage costs or tree node levels), the probability returned by f(s) was the product of a series of probabilities, each of which was reduced in proportion to s and λ. The assumption underlying this equation was that sentence comprehension relies on a series of structure building, interpretive, or memory operations, each of which has an independent chance of success or failure. Failure of any of these operations disrupts the process of comprehension.
Depending on the specific complexity metric being evaluated, Eq. 1 could refer to different processing events. One example of such an event would be successfully maintaining a prediction of syntactic constituents during the most demanding part of the sentence. The measurement of complexity associated with this event is embodied in the “Mx-S” metric. In this case there would be only one event in question, and the probability of a successful parse would decline linearly with aphasia severity. A second example of events represented by Eq. 1 would be the successful application of a sequence of syntactic functions during construction of a hierarchical representation. This series of events is embodied in the “Pr-T” metric. In this case, the overall probability is a product of probabilities, leading to a non-linear relationship between aphasia severity and the probability of an accurate parse. It should be noted that although the function f returns values that are treated as probabilities, the set of probabilities returned with different values of its arguments does not yield a probability distribution, as the outputs of the function are not required to sum to 1.0.
Probability tree diagram
A probability tree diagram was constructed describing each possible sequence of circumstances that would lead to success or failure on a single stimulus item for a sentence with a given structure. This tree diagram incorporated the probabilities of adequate syntactic parsing, of using and successfully applying a heuristic strategy to arrive at an interpretation, and of correctly guessing when heuristic and syntactic processes failed to generate a conclusion. See Figure 3 for the tree diagram that was used.

Figure 3. The probability tree diagram used for deriving functions for computing Bernoulli values. Abbreviations: sp = probability of a successful syntactic parse (a function of aphasia severity and levels in the CCG derivation, derived from Eq. 1); h = the probability that a given individual will use an Agent–Theme heuristic for interpreting sentences; sh = the probability of a successful heuristic parse (a function of aphasia severity and levels in the simplified heuristic derivation, derived from Eq. 1); hf = set to 1.0 if heuristics are favorable for comprehending a given sentence; set to 0.0 if heuristics are unfavorable; g2 = the probability of guessing correctly when presented with two options (always equal to 0.5).
Derivation of functions for computing Bernoulli values
Based on Eq. 1 and the probability tree diagram, functions were derived for each sentence structure. These functions took as arguments the aphasia severity s and heuristic acceptance probability h, and returned a Bernoulli value describing the probability of success with the sentence structure. See Figure 4 for examples of Bernoulli values generated by these functions.
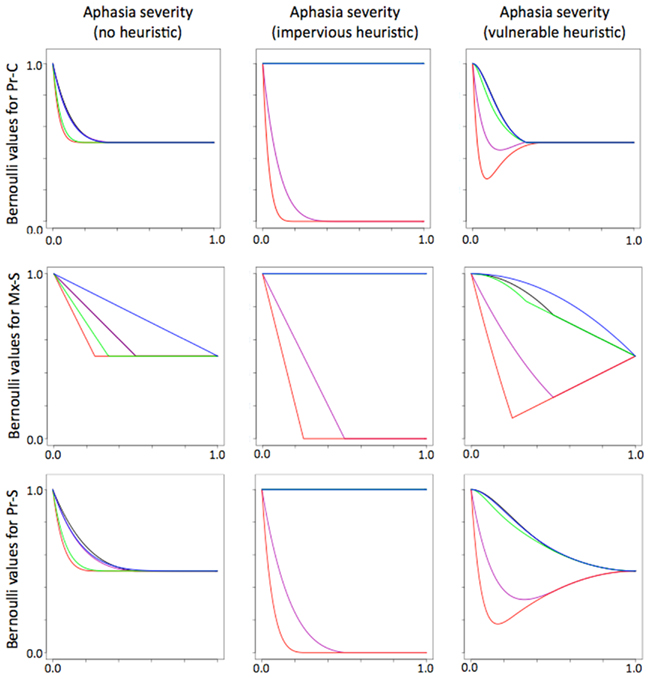
Figure 4. Bernoulli values at all levels of severity for five selected sentence structures, as computed for the Pr-C metric (top row), Mx-S metric (middle row), and Pr-S metric (bottom row). The five sentence structures included here are active voice (black), subject clefts (blue), passive voice (purple), subject–object relative (red), and subject–subject relative (green). The panels in the left column show the Bernoulli values derived with the assumption that subjects never apply an Agent–Theme heuristic. The middle and right columns show the Bernoulli values if subjects always accept a heuristically generated interpretation whenever syntax fails. The values in the middle column were computed with the assumption that aphasia does not degrade the patient’s ability to apply the heuristic (impervious heuristic). Those in the right column were computed with the assumption that aphasia degrades heuristic skills to a degree proportional to the severity of the aphasia (vulnerable heuristic).
Generation of binomial probability mass functions
Using the functions derived in the last step (see Derivation of Functions for Computing Bernoulli Values), a binomial PMF was generated for each sentence structure, each level of aphasia severity, and each heuristic acceptance probability. This PMF described the probability of obtaining every possible score across the range of scores afforded by a subtest. The probability space consisted of probabilities from these PMFs. See Figure 2 for a metaphorical illustration of the probability space. The probability of each possible score within a PMF was computed using Eq. 2,
where n represents the number of sentences in the subtest, k represents a certain score on that test (ranging from 0 to n), and p is the Bernoulli value computed in Section “Derivation of Functions for Computing Bernoulli Values,” above. The first term of this equation (in parentheses) is the binomial coefficient, which tells the number of possible ways to select a subset of k items from a set of n items. In this case, the binomial coefficient is the number of possible ways that a given score can be achieved. For example, a score of 1/10 could be obtained 10 different ways, by getting any 1 of the 10 items correct and missing the other nine.
Fitting Patient Data to the Probability Space
Scores from each patient were compared to each pattern in the probability space. Figure 2B depicts a patient’s profile of subtest scores, represented as the teeth on a key. Assuming that each key “opened” one and only one box, the fit of the key was tested on all of the boxes and the key was presumed to open only the box that gave the best fit. The position of the “best fit” box in the grid yielded an estimate of the patient’s aphasia severity and inclination to accept interpretations generated from heuristics (under the assumptions of whichever hypothesis was being tested – these assumptions were embodied in the specific complexity metric that gave rise to the probability space).
The search for the best aphasia severity (s) and heuristic acceptance probability (h) parameters amounts to likelihood maximization. Likelihood was computed as the product of probabilities for all of a patient’s scores, as defined by the PMFs in a given “box.” To make this example more concrete, consider a patient who scored 8/10 on a test of active voice sentences and 6/10 on a test of passives. In a given box of the grid, a score of 8/10 on actives may have a probability of 0.6 and a score of 6/10 on passives may have a probability of 0.4, yielding a likelihood for these two scores of (0.6 × 0.4) = 0.24. Comparison of the same scores to PMFs in a different box might yield probabilities of 0.3 and 0.2, resulting in a likelihood of 0.06. In this case, the first box would be considered the better fit. (Likelihood for the actual fitting was computed over all 21 of the subtests that were administered).
Deriving Predictions of the Model
Predictions for each patient were defined as the expected values of the binomial PMFs for each sentence structure at the point in the probability space that provided the best fit (i.e., maximum likelihood). Thus, if a patient’s scores were found to fit best with the PMFs at s = 0.6 and h = 0.3, it was PMFs derived from these parameters that were used to generate the expected values. (Expected values are averages of scores weighted by the probability of each score). These expected values constituted the predictions of the model for statistical analysis and comparison to other hypotheses.
Comparison of Predictions Made by Different Hypotheses
Planned comparisons
Routine analysis. Three measures of fit quality were calculated as follows. A linear mixed effects model was computed with subtest scores as the dependent variable and random effects of patient and sentence structure (Baayen et al., 2008; Bates et al., 2011). Fixed effects included task (SPM or SPV) and predictions of subtest scores derived by the methods detailed above. The first measure of fit quality was root mean squared error (hereafter referred to simply as “error”), calculated from the difference between the fitted values for the linear mixed effects model and the actual patient scores. The second measure of fit quality consisted of the percentage of fitted values that came within one-half point of the patient’s actual score (hereafter referred to as “precision”). The third measure of fit quality was the Akaike information criterion (AIC; Akaike, 1981) from the linear mixed effects model. Use of AIC permitted comparison of the mixed effects models in terms of their relative probability.
The relative predictive values of the hypotheses were determined by first ranking the quality of the predictions derived from each complexity metric and choosing the metrics that had the best performance. In terms of error and precision, metrics were compared using confidence intervals. Specifically, a 95% confidence interval was calculated for the complexity metric with the lowest error. Metrics that performed within the upper bound of this interval were listed along with the best metric. The same general procedure was followed for precision, but the metric with the highest precision was selected, the 95% confidence interval was constructed for this metric, and other metrics that scored above the lower bound were listed along with the best metric. AICs can be compared by means of Eq. 3,
in which the base of the natural logarithm (e) is raised to a power calculated as the difference between the lower AIC and the higher AIC, divided by two. The result is the probability that the model with the higher AIC will minimize information loss in comparison to the model with the lower AIC. The best metric was then listed along with metrics that had a greater than 5% chance of minimizing information loss when compared to it.
Cross-validation. Values for each of these measures of fit were recomputed using leave-one-out cross-validation to ensure that the model’s predictions had the capability of generalizing to data that were not used in the fitting. Specifically, for each subject, the score from one subtest was left out while the remaining scores were fitted to the probability space. The point in the probability that provided the best fit was then used to predict the left-out score. This procedure was repeated for each score and the winning metrics were selected by the same methods described above. Note that this method of cross-validation supports generalization of the findings to other sentence structures, but not to other aphasic individuals. It was not possible to perform a leave-one-out analysis of aphasic patients, because the data were fit to the probability space one subject at a time.
Post hoc permutation tests
The unknown parameter of aphasia severity s was permitted to vary between 0.0 and 1.0 by increments of 0.01, leading to 101 possible values. In the absence of heuristic use or with obligatory heuristic use, the parameter search took place only in this limited space. However, when the heuristic acceptance probability h was allowed to vary (also between 0.0 and 1.0, but by increments of 0.1, leading to 11 possible values), the size of the parameter space was expanded to the Cartesian product of these two sets of parameter values (i.e., 1,111 possible pairings of s and h). This considerable expansion raised the possibility that any improvement in fit observed with freely varying heuristics could be the result of increased flexibility in the model rather than a systematic improvement referable to heuristic use. To evaluate this possibility, permutation tests were undertaken by the following method: first, the top complexity metrics from the planned analyses were identified. Next, each of these metrics was used to generate 1,000 sets of predictions using all of the 1,111 pairings of the s and h parameters, but shuffling the Bernoulli values obtained for all h values greater than 0.0. (Probabilities associated with no heuristic use, i.e., h = 0, were kept constant to provide a conservative measure of the increased flexibility resulting from adding a parameter to this model.) Measures of fit quality performed on the original predictions were then compared to the predictions obtained using the shuffled values.
Heuristics
Complexity metrics were evaluated with the four steps described in Sections “Generating a Probability Space,” “Fitting Patient Data to the Probability Space,” “Deriving Predictions of the Model,” and “Comparison of Predictions Made by Different Hypotheses” under five different assumptions of heuristic use. Unimpaired individuals appear to use heuristics when interpreting sentences (Townsend and Bever, 2001; Ferreira and Patson, 2007) and this phenomenon is widely assumed to play a role in generating the patterns of aphasic sentence comprehension (Caramazza and Zurif, 1976; Caplan et al., 1997). The most common heuristic proposed for speakers of English consists of the default assignment of the Agent and Theme roles to the first and second nouns that occur (Ferreira and Patson, 2007). For this work, the heuristic was formalized as a NVN or NNV sequence. Interpretations that were expected to be available to aphasic patients were based on the content word sequences in each sentence structure that was studied. Sequences of nouns and verbs occurring in the 16 structures used for this research led in some cases to accurate interpretations (e.g., active voice sentences) and in some cases to faulty interpretations (e.g., passive voice sentences). Appendix lists the content word sequences for each sentence structure and whether application of the heuristic was favorable or unfavorable for generating the correct interpretation.
Use of the Agent–Theme heuristic was incorporated into the model in two qualitatively different ways to reflect two possible degrees of influence that brain damage may exert on an individual’s ability to make use of heuristics. First, there is a possibility that the neural mechanisms responsible for heuristic interpretation may be preserved under conditions of brain damage that result in aphasia. Throughout the remainder of this paper, heuristics that are not degraded in proportion to aphasia severity will be referred to as “impervious.” In this setting, heuristic interpretations (whether accurate or faulty) would remain accessible regardless of the severity of the syntactic deficit. This circumstance was simulated by setting the probability of heuristic success to 1.0 (sh in the tree diagram of Figure 3) and resulted in Bernoulli values like those of the center column in Figure 4. In this situation, once the aphasia exceeded a certain level of severity, the Bernoulli value for any given structure would settle at 0.0 or 1.0.
Alternatively, the Agent–Theme heuristic could make use of the same syntactic machinery as more detailed syntactic analysis, and would suffer according to the severity of the aphasia. Throughout the remainder of this paper, such a heuristic will be referred to as “vulnerable.” Degradation of heuristic interpretations was handled in much the same way as degradation of interpretations generated by more detailed syntactic analysis. Interpretation of NVN or NNV sequences was considered to rely on a simplified categorial grammar (for tree-based metrics) and limited storage and integration costs were estimated for the three-word heuristic sequences (for DLT-based metrics). The probability of heuristic success was computed in the same way as the probability of success with full syntactic analysis. As shown in the right-hand panels of Figure 4, Bernoulli values calculated with vulnerable heuristics converged on a value of 0.5 (corresponding to guessing) when the aphasia severity exceeded a certain level.
Figure 2 illustrates the probability space as a grid of boxes in which the columns correspond to different probabilities of using the Agent–Theme heuristic (or accepting an interpretation generated by it). However, it is not certain that subjects with syntactic disturbances have any capacity to suppress a heuristically generated interpretation, nor is it certain that the Agent–Theme heuristic has value for explaining variation in aphasic sentence comprehension performance. Separate searches for the best aphasia severity parameter were undertaken in which the search was restricted to the PMFs that presumed no use of heuristics (h = 0.0) or obligatory use of heuristics (h = 1.0) in addition to the default search in which patients were presumed to vary in their tendency to apply the heuristic (or to accept interpretations afforded by it). As a matter of convenience, these assumptions will be referred to hereafter as “no heuristic use,” “free heuristic use,” and “obligatory heuristic use.” Note that under the assumption of free heuristic use, the Bernoulli value generated for a given level of severity could fall anywhere between two extremes, depending on the heuristic acceptance probability, h. For a given complexity metric depicted in a row of Figure 4, these two extremes were defined by the Bernoulli value in the left-most column (where h = 0) and either the Bernoulli value in the middle column (where h = 1 and the heuristic was impervious) or the one in the right column (where h = 1 and the heuristic was vulnerable).
To summarize, each complexity metric was evaluated under the following five different assumptions regarding heuristic use: (1) with heuristic acceptance probability (h) set to 0.0 for all patients (i.e., no use of heuristics), (2) with free use of an impervious heuristic, (3) with free use of a vulnerable heuristic, (4) with obligatory use of an impervious heuristic, and (5) with obligatory use of a vulnerable heuristic. The difficulty noted in the introduction of discerning between heuristic degradation and individual differences in heuristic application was addressed by comparison of the model fit under these different assumptions.
Results
Root Mean Squared Error (Error)
Table 2 shows data from the comparison of the models’ predictions to actual patient scores with root mean squared error, after removal of task and random effects. This measure of fit quality revealed that Mx-S (the maximum of the storage costs) provided the most accurate predictions (error = 0.377) with free use of a vulnerable heuristic. No other complexity metrics fell within the 95% confidence interval (0.352–0.402) under any heuristic assumptions. In the cross-validated analysis, Pr-C provided the best fit (error = 0.467 with 95% CI 0.451–0.483) under the assumption of a freely varying vulnerable heuristic. Under the assumption of a freely varying impervious heuristic, the same metric achieved an error within the 95% CI (error = 0.478). Obligatory use of the impervious heuristic led to very inaccurate predictions, with error > 6. (Because most of the subtests consisted of 10 sentence presentations, it should be possible to achieve an error less than 5 by always predicting a score of 5 on every subtest. Therefore, an error of around 5 suggests chance performance by the model.)
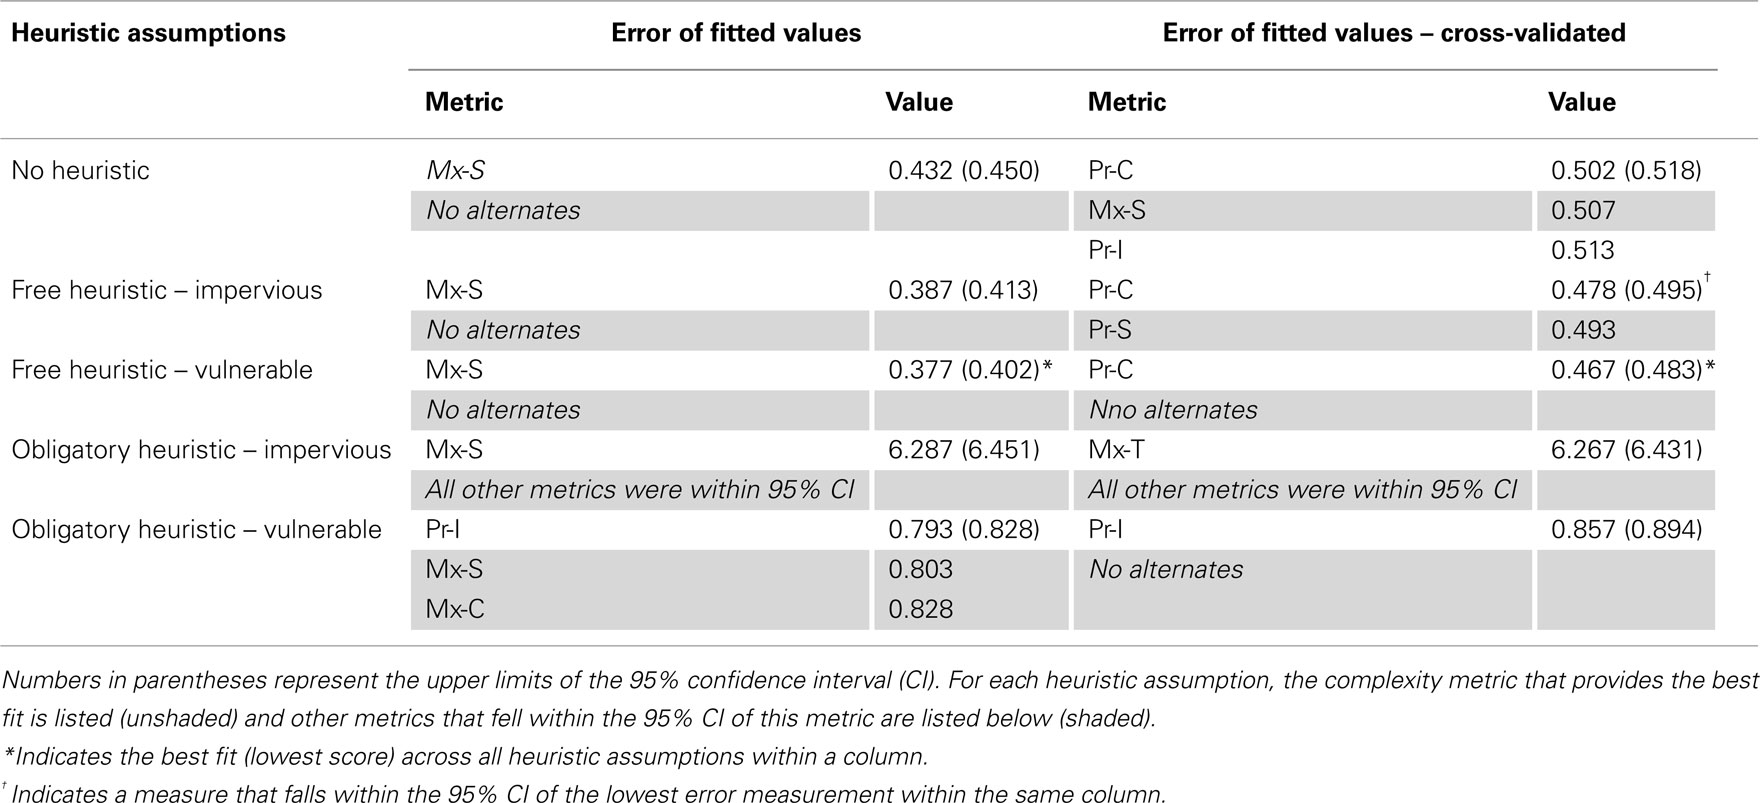
Table 2. Root mean squared error of fitted values in routine and cross-validated analyses.
Percentage of Fitted Values within One-Half Point of Actual Score (Precision)
The second measure of fit quality was the percentage of fitted values that came within one-half point of the actual patient score (precision – Table 3). In the routine analysis, Mx-S was associated with 84.7% precision when paired with a freely applied, vulnerable heuristic. Under these heuristic assumptions, no other complexity metric fell within the 95% confidence interval (82.3–87.1). However, when paired with other heuristic assumptions, the Mx-S metric still fell within this confidence interval. With the assumption of no heuristic use, Mx-S achieved 83.0% precision. With the assumption of free application of an impervious heuristic, Mx-S achieved 84.0% precision.
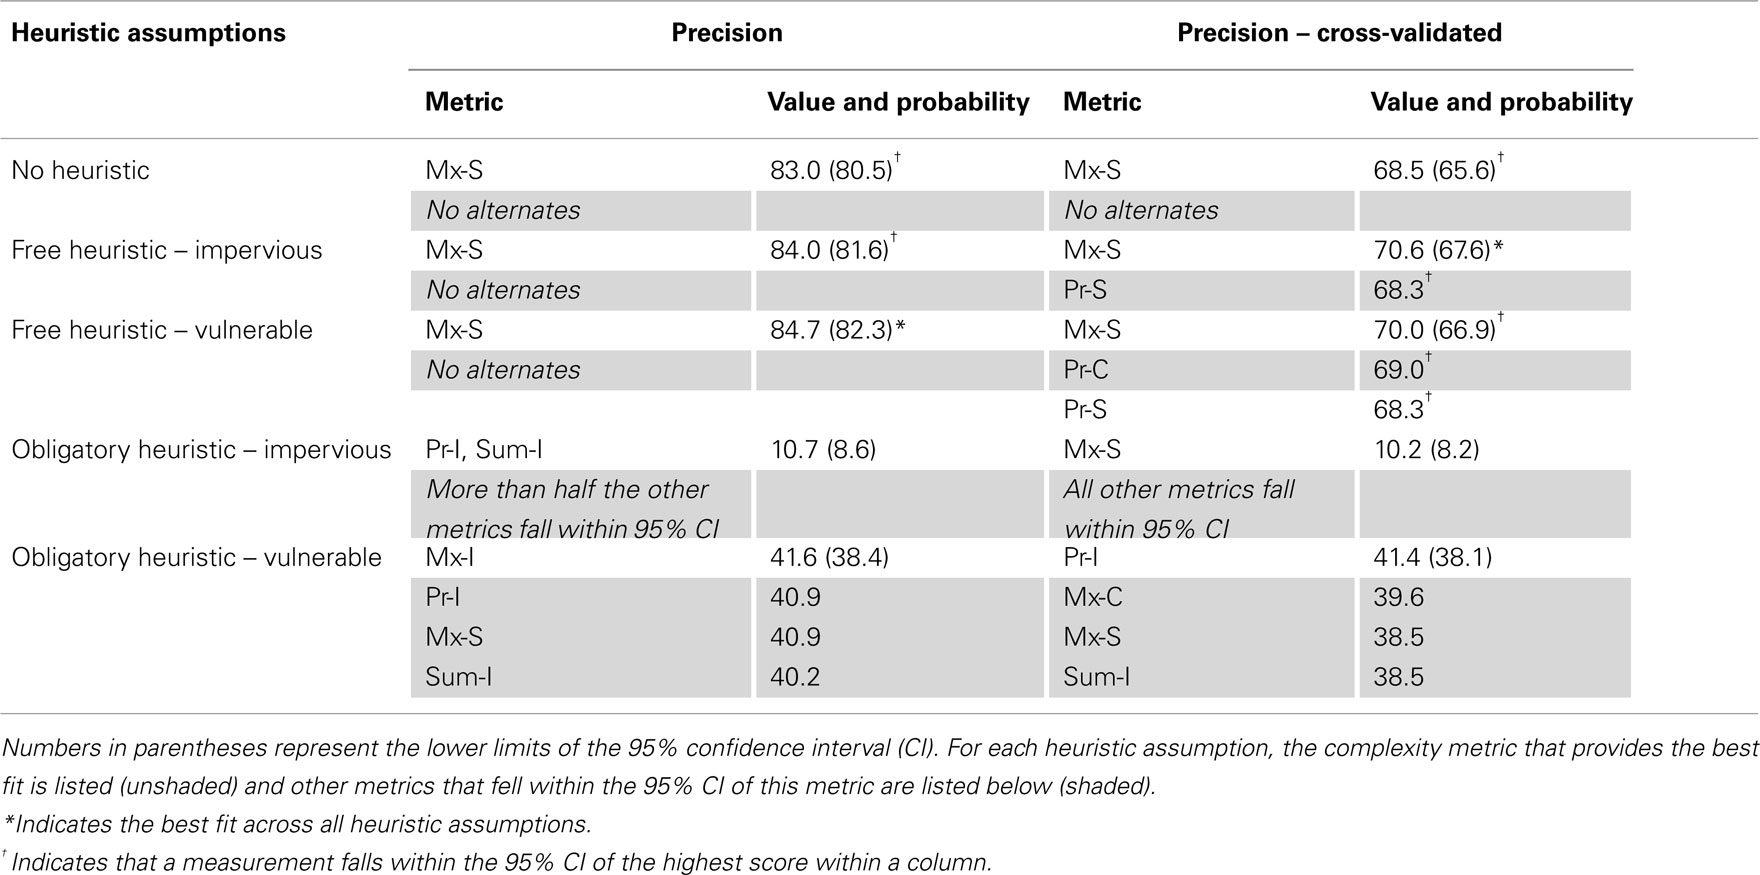
Table 3. Percent of predictions within one-half point of actual score in routine and cross-validated analyses.
In the cross-validated analysis, Mx-S gave the highest precision (70.6%) under the assumption of a freely varying, impervious heuristic. Under different heuristic assumptions, the same metric (Mx-S) yielded precisions within the 95% CI of the best result (i.e., between 67.6 and 73.6): with no heuristic use, the precision was 68.5% and with a freely varying, vulnerable heuristic, the precision was 70.0%. Again, the assumption of obligatory application of an impervious heuristic led to very low precision in both analyses (approximately 10%).
Akaike Information Criterion
The linear mixed effects models were then compared in terms of the AIC (Table 4). In the routine analysis, the best model paired Pr-S with free application of a vulnerable heuristic (AIC = 2988.82). Recall that the Pr-S metric was a product of probabilities, one probability per word, each of which was degraded in proportion to storage cost at that word. Under the same heuristic assumptions, Mx-S met the criterion of having greater than 5% probability of minimizing information loss (AIC 2922.66). Under the assumption of free application of an impervious heuristic, Pr-S and Mx-S met this criterion (AIC 2993.57 and 2994.51, respectively).
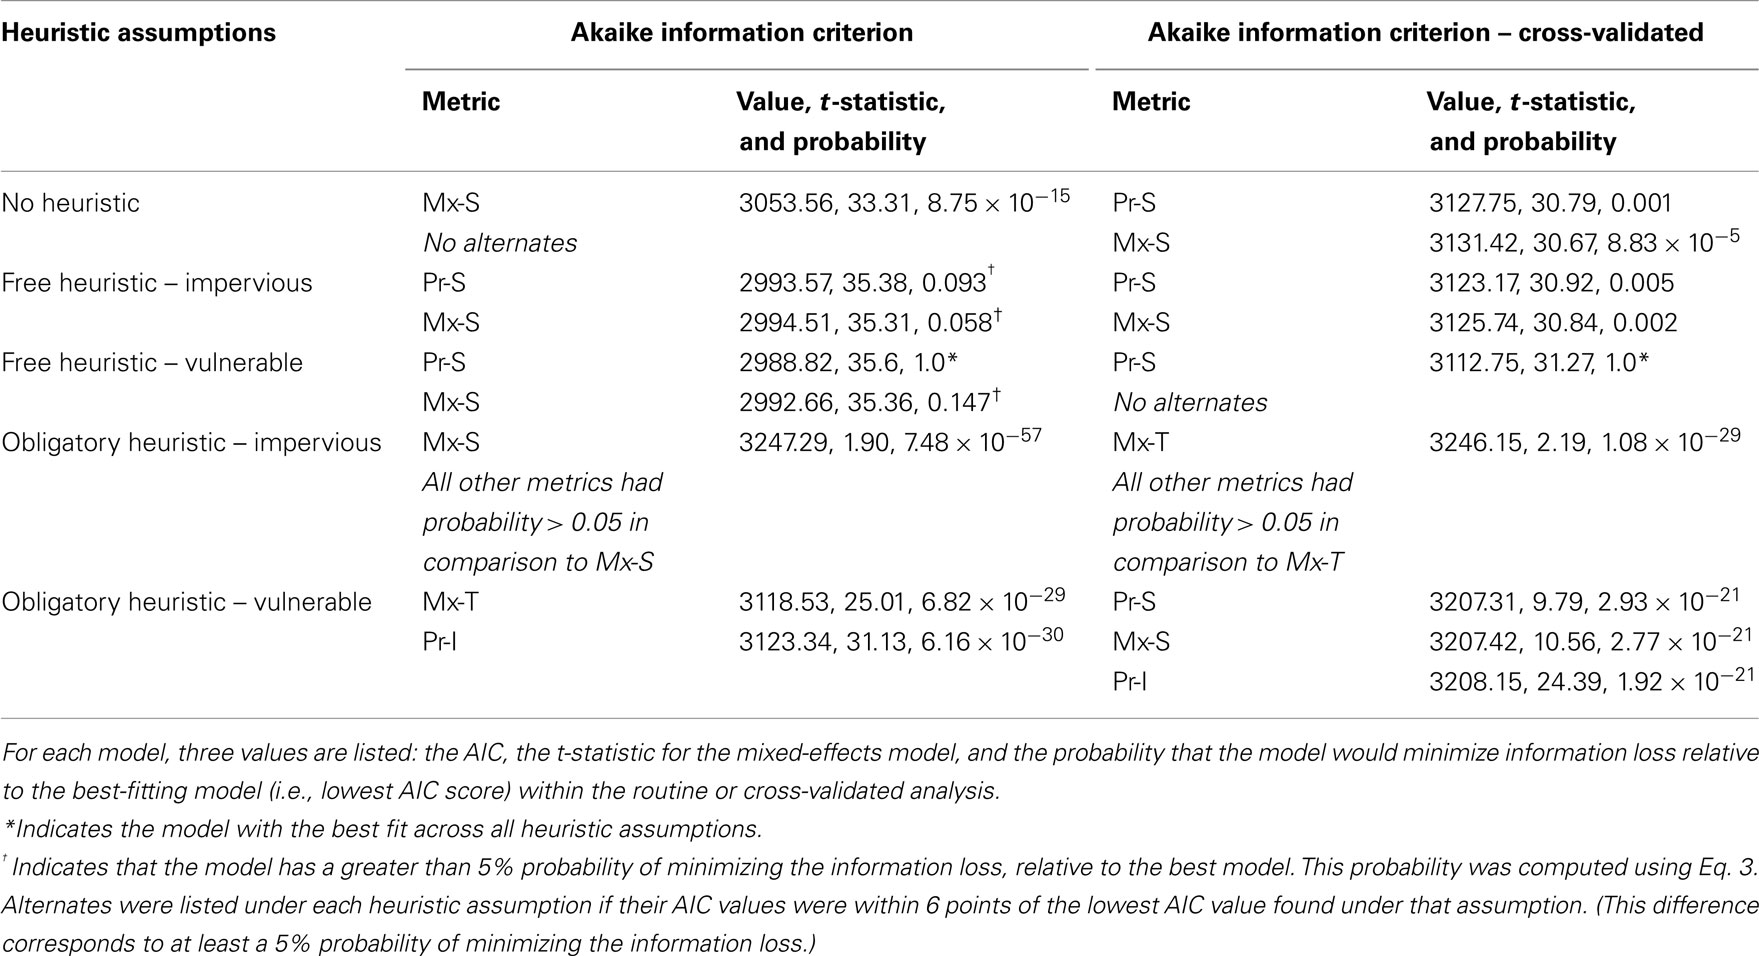
Table 4. AIC scores of the linear mixed effects models with predictions from each metric as an independent variable from the routine and cross-validated analyses.
In the cross-validated analysis, the best model consisted of the Pr-S metric, combined with free application of a vulnerable heuristic (AIC 3112.75). In this analysis, no other metrics met the criterion of having greater than 5% probability of minimizing information loss. Once again, obligatory application of an impervious heuristic led to the worst fit in both analyses.
Post hoc Permutation Tests
Permutation tests were undertaken to evaluate the best value obtained for each of the measures of fit quality in the routine and cross-validated analyses. In each case, the program was run 1,000 times, each time shuffling the probabilities in the probability space for all values of h greater than 0. This procedure yielded 1,000 distinct predictions of patient performance, each of which was evaluated with the corresponding measure of fit quality. The null hypothesis for each test was that fit quality would not be better than that expected to emerge by chance. The alternate hypothesis was that fit quality would be better (i.e., lower for error and AIC, and higher for precision) than measures generated with permuted data. The resulting measurements of fit quality were sorted and the one-tailed p-value of the best result produced for a given measure of fit quality (i.e., those measures marked with an asterisk in Tables 2– 4) was then calculated as the rank of the original best result among the 1,000 results from the permuted models.
In five out of six cases, the p-value estimated by the permutation test fell below 0.05 (Table 5). These findings support the belief that the improvement in fit observed with free variation in heuristic application probability was not caused by mere addition of a parameter. Rather, the fit was improved by the specific assumption of free variation in application of an Agent–Theme heuristic.
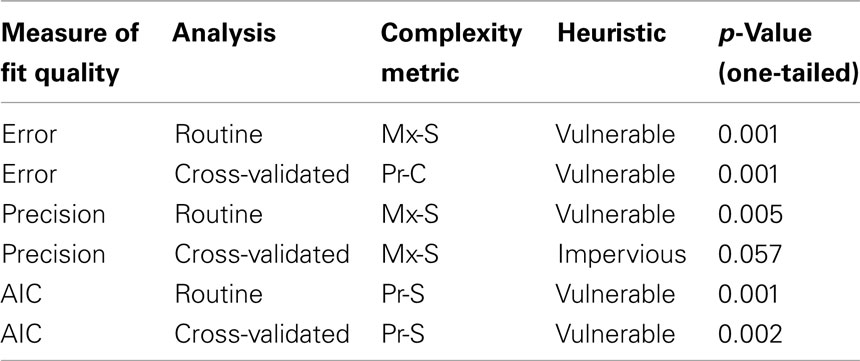
Table 5. p-Values of best error, precision, and AIC results, computed by permutation analysis.
Discussion
This research is an effort to discern differences in utility among 12 candidate metrics of sentence complexity for explaining patterns of aphasic sentence comprehension difficulty. The key findings are as follows. First, among the complexity metrics evaluated, DLT-based storage costs provide the best measure of sentence complexity for this population. Second, this research provides further support for the hypothesis that aphasic individuals employ an Agent–Theme heuristic when interpreting sentences. Third, aphasic individuals appear to vary in their tendency to make use of this heuristic. Fourth, the ability to derive an interpretation from the Agent–Theme heuristic may be degraded in proportion to aphasia severity.
Storage Cost-Based Measures of Sentence Difficulty
Compared to tree-based metrics and other DLT-based metrics, metrics based on DLT storage costs provide the most useful characterization of sentence complexity as it relates to comprehension performance in aphasia (see Tables 2– 4). Depending on the heuristic assumptions and the measure of fit quality that is employed, three DLT-based metrics emerge as winners: the maximum of the storage costs (Mx-S), the product of probabilities degraded in proportion to storage costs (Pr-S), and the product of probabilities degraded in proportion to combined storage and integration costs (Pr-C). The DLT proposes that variation in sentence complexity arises from both storage and integration costs and that these costs draw on the same pool of resources. This pool of resources is proposed to be either general working memory or a syntax-specific form of working memory. The results presented here, however, suggest that aphasia preferentially degrades storage, i.e., the online maintenance of predictions of which syntactic categories will occur as a sentence is presented. Some proponents of the DLT characterize storage costs as measuring language-specific processes that relate closely to syntax and semantics (Grodner et al., 2002). In contrast, these authors conjecture that integration costs “may be reflective of a domain general principle applicable to any serialized information processing” (p. 269).
The results presented here do not offer support to either side of the controversy regarding the notion of language-specific cognitive processes. One may speculate that syntactic computation in the brain is supported by a working memory system that processes information at a rate optimal for sentence interpretation, and that disruption of this system leads to intermittent failure of the processor to maintain expected dependencies long enough to link them with new words in the auditory stream. If so, then sentences might represent one of very few types of stimuli that require processing of sequences that unfold over an interval of hundreds to thousands of milliseconds, and thus place a burden on this system. Such a system may rely on low-frequency neural oscillations, just as more rapid linguistic transitions (i.e., phonemes and syllables) may be encoded with correspondingly rapid neural oscillations (Lohmann et al., 2010; Giraud and Poeppel, 2012). There is some evidence of anatomical and functional overlap between neural systems that process language and those that process music or other non-linguistic sequences with hierarchical structure (Koelsch et al., 2005; Bahlmann et al., 2009; Sammler et al., 2011). Syntax-like mechanisms underlying processing of these other stimuli may require a memory system tuned to transitions that occur at a rate similar to linguistic transitions at the level of phrases and sentences.
Agent–Theme Heuristic
This research offers support to the hypothesis that patterns of aphasic sentence comprehension are due, at least in part, to application of an Agent–Theme heuristic. Many accounts of aphasic sentence comprehension performance assume that subjects make use of some form of heuristic strategy (Caramazza and Zurif, 1976; Grodzinsky, 1995a; Caplan et al., 1997; Grodzinsky, 2000; Su et al., 2007), although the nature of the heuristic varies. In both the routine and cross-validated analyses presented here, the best fit was always obtained with the assumption that aphasic patients make use of an Agent–Theme heuristic. With two of the measures of fit quality (error and AIC – Tables 2 and 4) neither the routine nor the cross-validated analyses give any support to models that exclude the use of the heuristic.
A caveat arises in the interpretation of these data when precision is used as a measure of fit quality. Specifically, the Mx-S metric, paired with the assumption of no heuristic use, performs well enough that its precision falls within the 95% confidence interval of the winning metric in the routine and cross-validated analyses (Table 3). However, when paired with no heuristic use, the Mx-S metric makes incorrect predictions with one of the most commonly reported dissociations in aphasia (Berndt et al., 1996; Caplan et al., 1996; Grodzinsky, 2000). Specifically, this pairing assigns active and passive voice sentences identical Bernoulli values. Thus, in the absence of some form of heuristic use, the model can provide no explanation for the fact that passive voice sentences are empirically more difficult than actives, yet addition of the Agent–Theme heuristic does not lead to a statistically significant improvement in performance. These findings contrast with those from the other two measures of fit quality, and do not seem sufficient to exclude the use of heuristics for language comprehension. Nevertheless they do raise the concern that the Agent–Theme heuristic might be an incomplete characterization of the heuristic strategies employed by these patients.
Variation in Use of Heuristics
While the weight of evidence discussed in the previous section suggests that aphasic individuals do make use of an Agent–Theme heuristic, it does not appear that acceptance of interpretations derived from this heuristic is obligatory. This observation is particularly salient with obligatory acceptance of an impervious heuristic. Under these assumptions, the error is in the range of chance performance (Table 2), precision falls to 10% (Table 3), and the probability of minimizing the information loss is at most 1.08 × 10⁻²⁹. Obligatory application of the vulnerable heuristic fares somewhat better, but still shows a relatively poor fit across all measures in both the routine and cross-validated analyses. The best-fitting models that incorporate the heuristic usually comprise Bernoulli values derived with the assumption that patients vary in their tendency to accept interpretations generated by heuristics. These findings support the presence of variability in heuristic acceptance over the presence of heuristic degradation alone (cf. see Heuristics). Based on the results of a permutation analysis (Table 5), the improvement in the fit of the model under the assumption of free variation in heuristic acceptance does not appear to be solely due to the addition of a parameter.
Degradation of Heuristic Use by Aphasia
The findings reported here suggest that the ability to apply the Agent–Theme heuristic is disrupted by aphasia, as has been suggested by Hagiwara and Caplan (1990). In the routine analysis, the metrics that provide the best fit are paired with a vulnerable heuristic in every case. In the cross-validated analysis, the metrics that provide the best fit are paired with a vulnerable heuristic for two of the three measures of fit quality (error and AIC). However, with some of the measures of fit quality (precision and AIC in the routine analysis, error in the cross-validated analysis), it was not possible to completely exclude invulnerable heuristics. In one circumstance, an invulnerable heuristic provided the best fit (with use of precision in the cross-validated analysis). Although the findings are not in perfect harmony, it appears that the vulnerable heuristic generally outperforms the impervious heuristic across all three measures of fit quality.
Limitations
This research suffers from several limitations. Most importantly, the data were collected in an experiment that was not designed with the goal of discerning among different complexity metrics. Acquisition of the data with different tasks led to the exclusion of data from one task (OM) and added noise that could be only partly removed using linear mixed effects models. Future work should focus on a smaller number of candidate complexity metrics and should include materials designed specifically to differentiate among those metrics. Second, use of three different measures of fit quality carries the risk of drawing multiple conflicting conclusions, and in this case the measures do fail to identify a consistent winner among the metrics (albeit perhaps not among the theoretical foundations underlying the metrics). This failure is mitigated somewhat by the fact that all three “winning” metrics rely on storage costs from the DLT. None of them rely on tree-based measures or solely on DLT-based integration costs. Third, this work focuses on only one possible heuristic strategy. It is possible that other strategies may apply or that some sequences are preferred over others (i.e., perhaps NVN sequences are easier to parse than NNV sequences or erroneous interpretations of NVN sequences are more difficult to suppress than those arising from NNV sequences). Aphasic individuals may sometimes apply unusual heuristics or guessing strategies, such as those based on the spatial arrangement of individuals in pictures that are presented (Chatterjee et al., 1995). This work cannot account for such effects. Finally, the Bernoulli values here are calculated using a probability tree that represents the logical conditions of interpretive mechanisms rather than a necessary temporal ordering of events. For example, the tree (Figure 3) shows that acceptance of a (possibly erroneous) heuristic interpretation occurs “after” syntactic mechanisms have failed. In contrast, in some theories heuristics are proposed to be an early step in sentence comprehension, and may provide scaffolding on which more precise syntactic mechanisms rely (Townsend and Bever, 2001; Ferreira et al., 2002). If so, then generation of a complete syntactic parse might be impossible when heuristic mechanisms fail, and might be substantially easier when heuristic mechanisms succeed. Unfortunately, little is known about how these heuristically generated representations compete with or inform representations generated by the more precise syntactic algorithms (Tabor et al., 2004). This issue should be revisited with models that make explicit any potential mappings from heuristically generated representations to syntactically robust representations.
Conclusion
Linguistic theory provides a foundation on which we may construct an understanding of how language manifests in the brain and how language functions may be disrupted by brain damage. Both the tree-based and DLT-based metrics investigated here have roots in a line of inquiry that uses patterns in language itself as the sole source of evidence. Even the use of heuristics in language comprehension has been investigated from a purely linguistic viewpoint (Townsend and Bever, 2001). However, theories that depict natural language only in terms of discrete symbols predict a perfect dissociation between structures that are preserved and those that are disrupted when the system is damaged. Thus, they lack a fundamental property of neural systems known as graceful degradation. This work draws on probability theory to provide a description of patterns that may emerge when a symbol-processing system is partially degraded. The results give support to the hypothesis that reduction of a single resource is the chief source of variation among patients with aphasia, and that the degraded resource is likely to be a form of working memory involved in the storage of processed material and the prediction of material required for completing a sentence. However, individual differences in heuristic use also contribute to variation in comprehension among the aphasic individuals.
Conflict of Interest Statement
The author declares that the research was conducted in the absence of any commercial or financial relationships that could be construed as a potential conflict of interest.
Acknowledgments
David Clark is supported by VA Career Development Award E6553W, “Semantic Memory, Financial Capacity, and Brain Perfusion in MCI.” Drs. David Basilico, David Geldmacher, Hassan Fathalla, and Gary Cutter provided useful comments on an earlier version of the manuscript. Dr. Edward Gibson provided generous assistance with the estimation of storage and integration costs for the sentence structures used in this research. Dr. Glenn L. Clark assisted with the preparation of the manuscript.
References
Baayen, R., Davidson, D., and Bates, D. (2008). Mixed-effects modeling with crossed random effects for subjects and items. J. Mem. Lang. 59, 390–412.
Bahlmann, J., Schubotz, R., Mueller, J., Koester, D., and Friederici, A. (2009). Neural circuits of hierarchical visuo-spatial sequence processing. Brain Res. 1298, 161–170.
Bates, D., Maechler, M., and Bolker, B. (2011). Linear mixed-effects models using S4 classes. Available at: http://lme4.r-forge.r-project.org/
Beretta, A., and Munn, A. (1998). Double-agents and trace-deletion in agrammatism. Brain Lang. 65, 404–421.
Beretta, A., Pinango, M., Patterson, J., and Harford, C. (1999). Recruiting comparative crosslinguistic evidence to address competing accounts of agrammatic aphasia. Brain Lang. 67, 149–168.
Berndt, R., Mitchum, C., and Haendiges, A. (1996). Comprehension of reversible sentences in “agrammatism”: a meta-analysis. Cognition 58, 289–308.
Caplan, D., and Hildebrandt, N. (1988). Disorders of Syntactic Comprehension. Cambridge, MA: MIT Press.
Caplan, D., Hildebrandt, N., and Makris, N. (1996). Location of lesions in stroke patients with deficits in syntactic processing. Brain 119, 933–949.
Caplan, D., and Waters, G. (1999). Verbal working memory and sentence comprehension. Behav. Brain Sci. 22, 77–126.
Caplan, D., Waters, G., DeDe, G., Michaud, J., and Reddy, A. (2007a). A study of syntactic processing in aphasia I: behavioral (psycholinguistic) aspects. Brain Lang. 101, 103–150.
Caplan, D., Waters, G., Kennedy, D., Alpert, N., Makris, N., DeDe, G., Michaud, J., and Reddy, A. (2007b). A study of syntactic processing in aphasia II: neurological aspects. Brain Lang. 101, 151–177.
Caplan, D., Waters, G., and Hildebrandt, N. (1997). Determinants of sentence comprehension in aphasic patients in sentence-picture matching tasks. J. Speech Lang. Hear. Res. 40, 542–555.
Caramazza, A., and Zurif, E. (1976). Dissociation of algorithmic and heuristic processes in language comprehension. Brain Lang. 3, 572–582.
Chatterjee, A., Maher, L. M., Gonzalez-Rothi, L. J., and Heilmann, K. M. (1995). Asyntactic thematic role assignment: the use of a temporal-spatial strategy. Brain Lang. 49, 125–139.
Chen, E., Gibson, E., and Wolf, F. (2005). Online syntactic storage costs in sentence comprehension. J. Mem. Lang. 52, 144–169.
Clark, D. (2009). A computational semantics approach to aphasic sentence comprehension. Aphasiology 23, 33–51.
De Bleser, R., Schwarz, W., and Burchert, F. (2006). Quantitative neurosyntactic analyses: the final word? Brain Lang. 96, 143–146.
Dick, F., Bates, E., Wulfeck, B., Utman, J., Dronkers, N., and Gernsbacher, M. (2001). Language deficits, localization, and grammar: evidence for a distributive model of language breakdown in aphasic patients and neurologically intact individuals. Psychol. Rev. 108, 759–788.
Drai, D., and Grodzinsky, Y. (2006). A new empirical angle on the variability debate: quantitative neurosyntactic analyses of a large data set from Broca’s aphasia. Brain Lang. 96, 117–128.
Druks, J., and Marshall, J. (1995). When passives are easier than actives: two case studies of aphasic comprehension. Cognition 55, 311–331.
Ferreira, F., Bailey, K., and Ferraro, V. (2002). Good-enough representations in language comprehension. Curr. Dir. Psychol. Sci. 11, 11–15.
Ferreira, F., and Patson, N. (2007). The good enough approach to language comprehension. Lang. Linguist. Compass 1, 71–83.
Fodor, J., Bever, T., and Garret, M. (1974). The Psychology of Language: An Introduction to Psycholinguistics and Generative Grammar. New York: McGraw-Hill.
Friederici, A., and Gorrell, P. (1998). Structural prominence and agrammatic theta-role assignment. A reconsideration of linear strategies. Brain Lang. 65, 253–275.
Friedmann, N. (2006). Generalizations on variations in comprehension and production: a further source of variation and a possible account. Brain Lang. 96, 151–153.
Friedmann, N., and Grodzinsky, T. (1997). Tense and agreement in agrammatic production: pruning the syntactic tree. Brain Lang. 56, 397–425.
Gibson, E. (2000). “The dependency locality theory: a distance-based theory of linguistic complexity,” in Image, Language, Brain, eds Y. Miyashita, A. Marantz, and W. O’Neil (Cambridge, MA: MIT Press), 95–126.
Giraud, A., and Poeppel, D. (2012). Cortical oscillations and speech processing: emerging computational principles and operations. Nat. Neurosci. 15, 511–517.
Grodner, D., Gibson, E., and Tunstall, S. (2002). Syntactic complexity in ambiguity resolution. J. Mem. Lang. 46, 267–295.
Grodzinsky, Y. (1995b). Trace deletion, theta-roles, and cognitive strategies. Brain Lang. 51, 469–497.
Grodzinsky, Y. (2000). The neurology of syntax: language use without Broca’s area. Behav. Brain Sci. 23, 1–71.
Haarmann, H., Just, M., and Carpenter, P. (1997). Aphasic sentence comprehension as a resource deficit: a computational approach. Brain Lang. 59, 76–120.
Hagiwara, H. (1995). The breakdown of functional categories and the economy of derivation. Brain Lang. 50, 92–116.
Hagiwara, H., and Caplan, D. (1990). Syntactic comprehension in Japanese aphasics: effects of category and thematic role order. Brain Lang. 38, 159–170.
Hale, J. (2001). “A probabilistic Earley parser as a psycholinguistic model,” in Proceedings of the second meeting of the North American chapter of the Association for Computational Linguistics, Baltimore, 2, 159–166.
Joshi, A., Shanker, K., and Weir, D. (1991). “The convergence of mildly context-sensitive grammar formalisms,” in Foundational Issues in Natural Language Processing, eds P. Sells, S. Shieber, and T. Wasow (Boston, MA: MIT Press), 31–81.
Koelsch, S., Gunter, T., Wittfoth, M., and Sammler, D. (2005). Interaction between syntax processing in language and music: an ERP study. J. Cogn. Neurosci. 17, 1565–1577.
Levy, R., Fedorenko, E., Breen, M., and Gibson, E. (2012). The processing of extraposed structures in English. Cognition 122, 12–36.
Lewis, R., and Vasishth, S. (2005). An activation-based model of sentence processing as skilled memory retrieval. Cogn. Sci. 29, 375–419.
Linebarger, M., Schwartz, M., and Saffran, E. (1983). Sensitivity to grammatical structure in so-called agrammatic aphasics. Cognition 13, 361–392.
Lohmann, G., Hoehl, S., Brauer, J., Danielmeier, C., Bornkessel-Schlewesky, I., Bahlmann, J., Turner, R., and Friederici, A. (2010). Setting the frame: the human brain activates a basic low-frequency network for language processing. Cereb. Cortex 20, 1286–1292.
Luzzatti, C., and Guasti, M. (2001). Agrammatism, syntactic theory, and the lexicon: Broca’s area and the development of linguistic ability in the human brain. Behav. Brain Sci. 23, 41–42.
Marantz, A. (2005). Generative linguistics within the cognitive neuroscience of language. Linguist. Rev. 22, 429–445.
Martin, E., and Roberts, K. (1966). Grammatical factors in sentence retention. J. Verbal Learn. Behav. 5, 211–218.
Mauner, G., Fromkin, V., and Cornell, T. (1993). Comprehension and acceptability judgments in agrammatism: disruptions in the syntax of referential dependencies. Brain Lang. 45, 340–370.
Miller, G., and McKean, K. (1964). A chronometric study of some relations between sentences. Q. J. Exp. Psychol. 16, 297–308.
Reitter, D., Hockenmaier, J., and Keller, F. (2006). “Priming effects in combinatory categorial grammar,” in Proceedings of the 2006 Conference on Empirical Methods in Natural Language Processing, Sydney.
Reitter, D., Keller, F., and Moore, J. (2011). A computational cognitive model of syntactic priming. Cogn. Sci. 35, 587–637.
Sammler, D., Koelsch, S., and Friederici, A. (2011). Are left fronto-temporal brain areas a prerequisite for normal music-syntactic processing? Cortex 46, 659–673.
Slobin, D. (1966). Grammatical transformations and sentence comprehension in childhood and adulthood. J. Learn. Verbal Behav. 5, 219–227.
Su, Y., Lee, S., and Chung, Y. (2007). Asyntactic thematic role assignment role assignment by Mandarin aphasics: a test of the trace-deletion hypothesis and the double dependency hypothesis. Brain Lang. 101, 1–18.
Tabor, W., Galantucci, B., and Richardson, D. (2004). Effects of merely local syntactic coherence on sentence processing. J. Mem. Lang. 50, 355–370.
Townsend, D., and Bever, T. (2001). Sentence Comprehension: The Integration of Habits and Rules. Cambridge, MA: MIT Press.
van Herten, M., Chwilla, D., and Kolk, H. (2006). When heuristics clash with parsing routines: ERP evidence for conflict monitoring in sentence production. J. Cogn. Neurosci. 18, 1181–1197.
Appendix A
Structure: Active
Example: The man hit the father.
Content words: MAN HIT FATHER (favorable for NVN heuristic)
Canonical CCG parse: [ < [ > the man (1) ] [ > hit [ > the father (1) ] (2) ] (3) ]
Levels for complete sentence: 1, 1, 2, 3
Structure: Passive
Example: The boy was kissed by the girl.
Content words: BOY KISSED GIRL (unfavorable)
Canonical CCG parse:
[ < [ > the boy (1) ] [ < [ > was kissed (1) ] [ > by [ > the girl (1) ] (2) ] (3) ] (4) ]
Levels for complete sentence: 1, 1, 2, 3, 4
Structure: Cleft object
Example: It was the uncle who the boy kicked
Content words: UNCLE BOY KICKED (no heuristic parse)
Canonical CCG parse:
[ < it [ > was [ > the [ < uncle [ > who [ B> [ T> [ > the boy (1) ] (2) ] kicked (3) ] (4) ] (5) ] (6) ] (7) ] (8) ] (4)] (5)] (6)] (7)] (8)]
Levels for complete sentence: 1, 2, 3, 4, 5, 6, 7, 8
Structure: Cleft subject
Example: It was the boy who kicked the uncle.
Content words: BOY KICKED UNCLE (NVN – favorable)
Canonical CCG parse:
[ < it [ > was [ > the [ < boy [ > who [ > kicked [ > the uncle (1) ] (2) ] (3) ] (4) ] (5) ] (6) ] (7) ] (6)] (7)]
Levels for complete sentence: 1, 2, 3, 4, 5, 6, 7
Structure: Truncated passive
Example: The father was hit.
Content words: FATHER HIT (no heuristic parse)
Canonical CCG parse: [ < [ > the father (1) ] [ > was hit (1) ] (2) ]
Levels for complete sentence: 1, 1, 2
Structure: Reflexive genitive with semireflexive verb
Example: The uncle of the boy dressed himself.
Content words: (UNCLE) BOY DRESSED (NV heuristic – unfavorable)
Canonical CCG parse:
[ < [ < [ > the uncle (1) ] [ > of [ > the boy (1) ] (2) ] (3) ] [ > dressed himself (1) ] (4) ]
Levels for complete sentence: 1, 1, 2, 3, 1, 4
Structure: Reflexive genitive with transitive verb
Example: The uncle of the boy hit himself.
Content words: UNCLE BOY HIT (no heuristic parse)
Canonical CCG parse:
[ < [ < [ > the uncle (1) ] [ > of [ > the boy (1) ] (2) ] (3) ] [ > hit himself (1) ] (4) ]
Levels for complete sentence: 1, 1, 2, 3, 1, 4
Structure: Reflexive genitive baseline sentence
Example: The daughter of the aunt tickled the uncle.
Content words: DAUGHTER AUNT TICKLED UNCLE (NVN – unfavorable)
Canonical CCG parse:
[ < [ < [ > the daughter (1) ] [ > of [ > the aunt (1) ] (2) ] (3) ] [ > tickled [ > the uncle (1) ] (2) ] (4) ]
Levels for complete sentence: 1, 1, 2, 3, 1, 2, 4
Structure: Reflexive possessive with semireflexive verb
Example: The woman’s daughter dressed herself.
Content words: (WOMAN) DAUGHTER DRESSED (NV parse – favorable)
Canonical CCG parse:
[ < [ > the [ > woman [ > ‘s daughter (1) ] (2) ] (3) ] [ > dressed herself (1) ] (4) ]
Levels for complete sentence: 1, 2, 3, 1, 4
Structure: Reflexive possessive with transitive verb
Example: The woman’s daughter bit herself.
Content words: (WOMAN) DAUGHTER BIT (no heuristic parse)
Canonical CCG parse:
[ < [ > the [ > woman [ > ‘s daughter (1) ] (2) ] (3) ] [ > bit herself (1) ] (4) ]
Levels for complete sentence: 1, 2, 3, 1, 4
(As with reflexive genitives, Bernoulli values were calculated for both semireflexive and transitive verbs and averaged.)
Structure: Reflexive possessive baseline sentence
Example: The woman’s niece kicked the man.
Content words: (WOMAN) NIECE KICKED MAN (NVN parse – favorable)
Canonical CCG parse:
[ < [ > [ > the woman (1) ] [ > ‘s niece (1) ] (2) ] [ > kicked [ > the man (1) ] (2) ] (3) ]
Levels for complete sentence: 1, 1, 2, 1, 2, 3
Structure: Subject–object relative
Example: The brother who the sister hit chased the girl.
Content words: BROTHER SISTER HIT CHASED GIRL (no heuristic parse)
Canonical CCG parse:
[ < [ > the [ < brother [ > who [ B> [ T> [ > the sister (1) ] (2) ] hit (3) ] (4) ] (5) ] (6) ] [ > chased [ > the girl (1) ] (2) ] (7) ]
Levels for embedded clause: 1, 2, 3, 4, 5, 6
Structure: Subject–subject relative
Example: The brother who kicked the uncle pinched the woman.
Content words: BROTHER KICKED UNCLE PINCHED WOMAN (1st NVN heuristic is favorable, second is unfavorable)
Canonical CCG parse:
[ < [ > the [ < brother [ > who [ > kicked [ > the uncle (1) ] (2) ] (3) ] (4) ] (5) ] [ > pinched [ > the woman (1) ] (2) ] (6) ]
Levels for embedded clause: 1, 2, 3, 4, 5
Structure: Active, conjoined theme
Example: The pig chased the lion and the cow.
Content words: PIG CHASED LION COW (NVN heuristic – favorable)
Canonical CCG parse:
[ < [ > the pig (1) ] [ > chased [ < [ > the lion (1) ] [ > and [ > the cow (1) ] (2) ] (3) ] (4) ] (5) ]
Levels for complete sentence: 1, 1, 1, 2, 3, 4, 5
Levels for complete sentence: 1, 1, 1, 2, 3, 4, 5
(The NVN heuristic is favorable if all pictures used that show the pig chasing the lion also show the pig chasing the cow, i.e., that none show the pig and the cow chasing the lion or the cow watching the pig chase the lion. The NVN heuristic would lead to false truth conditions for the latter picture. All analyses reported here assumed the heuristic was favorable.)
Structure: Dative
Example: The elephant passed the dog to the horse.
Content words: ELEPHANT PASSED DOG HORSE (NVNN heuristic – favorable)
Canonical CCG parse:
[ < [ > the elephant (1) ] [ > [ > passed [ > the dog (1) ] (2) ] [ > to [ > the horse (1) ] (2) ] (3) ] (4) ]
Levels for complete sentence: 1, 1, 2, 1, 2, 3, 4
Structure: Dative passive
Example: The lion was pulled to the elephant by the horse
Content words: LION PULLED ELEPHANT HORSE (NVNN heuristic – unfavorable)
Canonical CCG parse:
[ < [ > the lion (1) ] [ < [ > [ > was pulled (1) ] [ > to [ > the elephant (1) ] (2) ] (3) ] [ > by [ > the horse (1) ] (2) ] (4) ] (5) ]
Levels for complete sentence: 1, 1, 1, 2, 3, 1, 2, 4, 5
Structure: Object–subject relative
Example: The horse kicked the elephant that touched the dog.
Content words: HORSE KICKED ELEPHANT TOUCHED DOG (first NVN heuristic is favorable, second is unfavorable)
Canonical CCG parse:
[ < [ > the horse (1) ] [ > kicked [ > the [ < elephant [ > that [ > touched [ > the dog (1) ] (2) ] (3) ] (4) ] (5) ] (6) ] (7) ]
Levels for complete sentence: 1, 1, 2, 3, 4, 5, 6, 7
Structure: Active, conjoined verb phrase
Example: The lion tagged the dog and chased the cow.
Content words: LION TAGGED DOG CHASED COW (first NVN heuristic is favorable, second is unfavorable)
Canonical CCG parse: [ < [ > the lion (1) ] [ < [ > tagged [ the dog (1) ] (2) ] [ > and [ > chased [ > the cow (1) ] (2) ] (3) ] (4) ] (5) ]
Levels for complete sentence: 1, 1, 2, 1, 2, 3, 4, 5
Appendix B
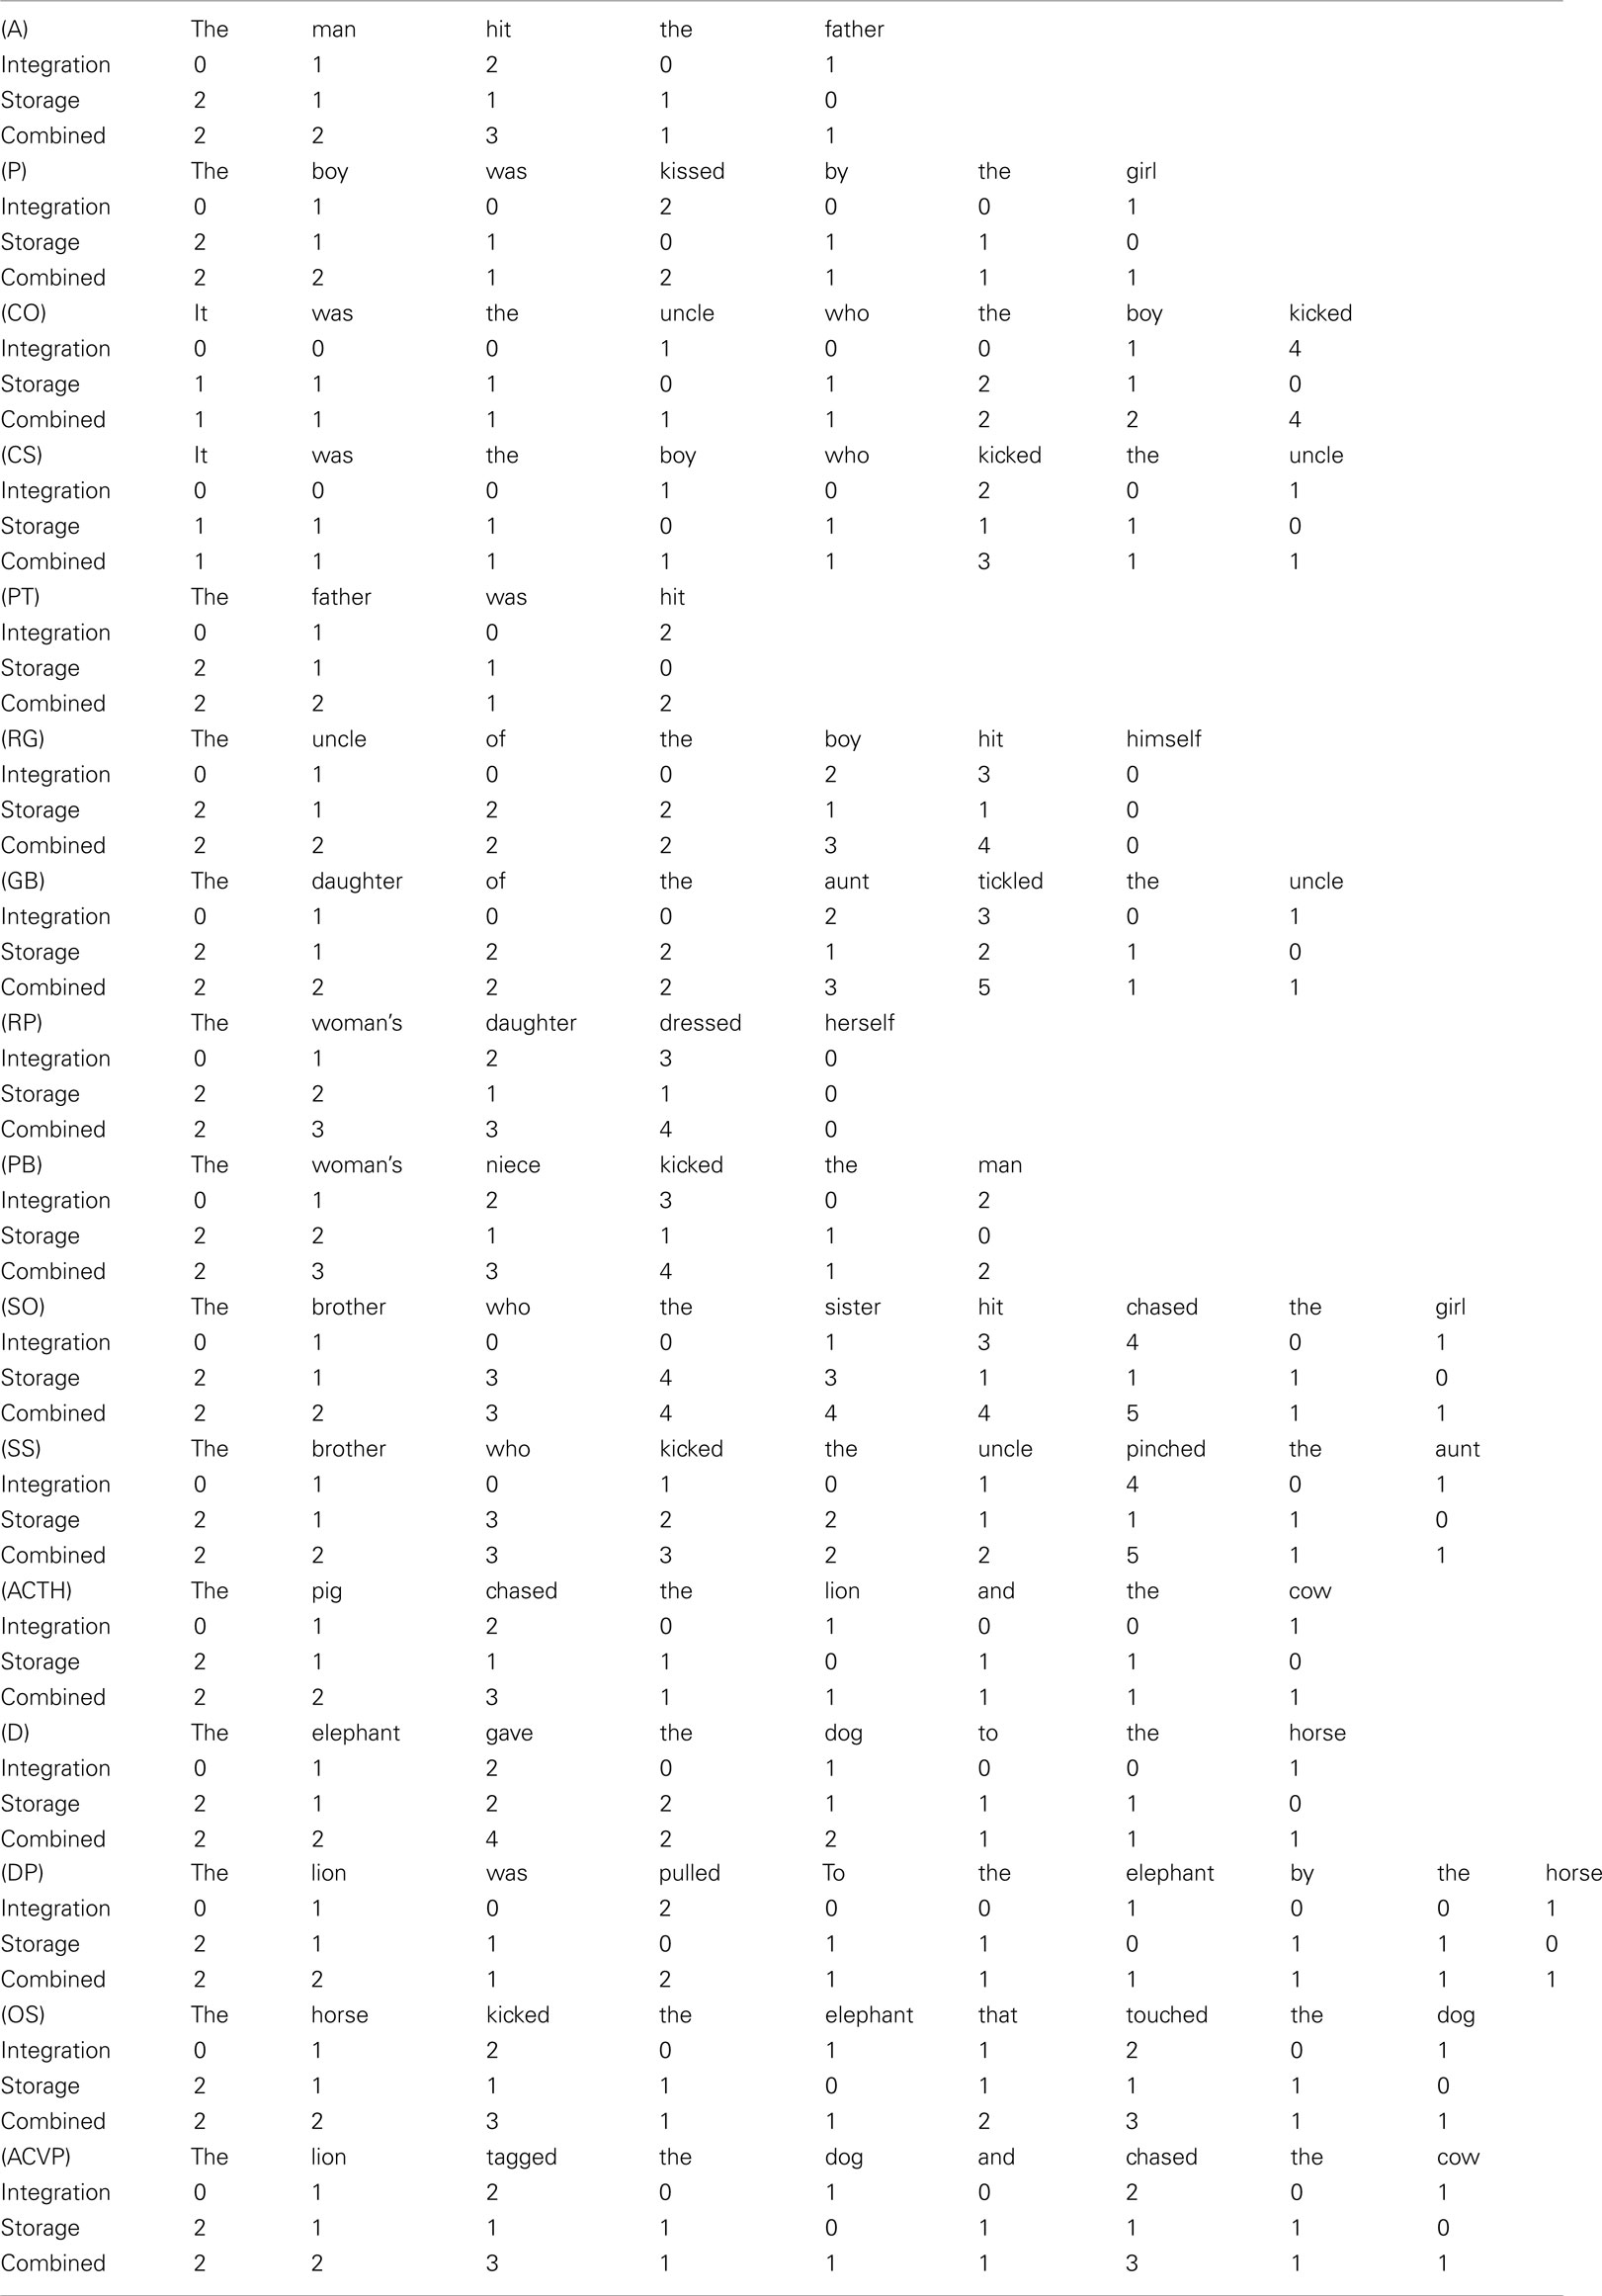
Table A1. Costs as estimated using dependency locality theory (DLT).
Keywords: aphasia, syntax, semantics, sentence comprehension
Citation: Clark DG (2012) Storage costs and heuristics interact to produce patterns of aphasic sentence comprehension performance. Front. Psychology 3:135. doi: 10.3389/fpsyg.2012.00135
Received: 03 February 2012; Accepted: 17 April 2012;
Published online: 10 May 2012.
Edited by:
Thomas F. Münte, University of Magdeburg, USAReviewed by:
Evelina Fedorenko, Massachusetts Institute of Technology, USADirk Koester, Bielefeld University, Germany
Copyright: © 2012 Clark. This is an open-access article distributed under the terms of the Creative Commons Attribution Non Commercial License, which permits non-commercial use, distribution, and reproduction in other forums, provided the original authors and source are credited.
*Correspondence: David Glenn Clark, Department of Neurology, University of Alabama at Birmingham, 1720 7th Avenue South SC 620C, Birmingham, AL 35294, USA. e-mail: dgclark@uab.edu