 Pierluigi Cordellieri1
 Francesca Baralla1
 Fabio Ferlazzo1
 Roberto Sgalla2
 Laura Piccardi3,4
 Anna Maria Giannini1*
- 1Department of Psychology, “Sapienza” University of Rome, Italy, Rome
- 2Department of Public Security, Ministry of Interior, Italy, Rome
- 3Department of Life, Health and Environmental Sciences, L'Aquila University, L'Aquila, Italy, Rome
- 4Neuropsychology Unit, IRCCS Santa Lucia Foundation, Italy, Rome
In the present study, we investigated gender-related effects on road safety attitudes in 2681 young drivers (1458 males, 54.4%; aged 18–22) who filled out several scales assessing attitudes toward road safety issues, driving behavior in specific hypothetical situations, accident risk perception, and concerns about such a risk. We focused only on young drivers to better understand the role of gender in road safety attitudes in a period of life in which risky behaviors are widespread for males and females. Indeed, there is still no agreement as to the nature of these gender differences. According to some authors, the effects of gender on being involved in a crash due to driving skills are either non-existent or largely explained by differences in alcohol consumption. In our study, we found gender differences in road safety attitudes (i.e., “negative attitude toward traffic rules and risky driving”; “negative attitude toward drugs and alcohol” and “tolerance toward speeding”) and in driver behavior (i.e., “errors in inattentive driving” and “driving violations”). This result is consistent in all drivers coming from nine different European countries. Our analyses yielded an important finding concerning risk perception. The results indicate that the level of risk perception during driving is the same for males and females. However, these two groups differ in the level of concern about this risk, with males being less concerned about the risk of a road accident. This suggests that the main difference between these two groups is not strictly related to judgment of the perceived risk probability but rather to the level of concern experienced about the consequences of the risk. This difference between risk perception and worry could explain differences in the frequency of car accidents in the two groups. The present findings may provide new insights for the development of gender-based prevention programs.
Introduction
Every year, many people worldwide are killed or severely injured in motor vehicle accidents (WHO, 2015; OECD, 2016). On the front line, road authorities all over Europe are trying different alternatives to change driver behavior to reduce road accidents and general costs to society. To investigate this phenomenon in depth, including a better understanding of the relationship between demographic factors (i.e., gender, educational level, age), personal attitudes and beliefs concerning driving behavior and dangerous driving, several contributions have evaluated the importance of “human factors” (Grayson and Maycock, 1988; Lajunen, 1997) in driving behavior (Lourens et al., 1999). The evaluation of driving behavior and driver's skills and their role in car accidents is particularly complex. The focus of behavioral factors in road safety research was initially approached by evaluating driving abilities and expertise in relation to the age of drivers (i.e., Matthews and Moran, 1986). Subsequently, research focused on willingness to take risks (i.e., risky driving behavior and the role of sensation seeking: Zuckerman and Neeb, 1980; Jonah, 1997; the determinants of risky driving behavior: Parker et al., 1992, 1998; Rutter et al., 1995), underestimating the risk while driving (Taubman-Ben Ari et al., 2004; Delhomme et al., 2009) and overestimating their driving skills (Kruegar and Dickson, 1994; Horswill et al., 2004).
Gender has been considered in relation to risky driving behavior in young drivers (Ulleberg and Rundmo, 2003; Teese and Bradley, 2008) and in general, it has been found that, in terms of risk behavior in road traffic, males are more willing to take risks than female (Whissell and Bigelow, 2003; Oltedal and Rundmo, 2006). Yagil (1998) has reported that the rate of men's involvement in fatal road accidents is twice as high as women's and, previously, Evans (1991) reported that a woman has a 25% less chance than a man to be involved in a road accident. Furthermore, according to other authors, men are involved in road accidents as a consequence of their violation of traffic laws (i.e., violations of speed limits and driving after drinking: Storie, 1977; Simon and Corbett, 1996; Harre et al., 1996), whereas women were involved in road accidents due to judgment errors (Storie, 1977). It has been furthermore found that women take fewer risks than men do when driving (Ebbesen and Haney, 1973; Katz et al., 1975).
Among demographic factors, age is another negative predictor of risky driving behavior. It has been well established by studies and accident databases from various countries that young novice drivers are more frequently involved in traffic accidents than drivers in other age groups (WHO, 2015; OECD, 2016). In general, a variety of factors, such as inadequate skills and/or a greater propensity to assume more risk, have frequently been indicated as the main causes of accidents in this age group (Deery, 1999; Underwood, 2007; Giannini et al., 2013). Although it is unanimously recognized that young people are more at risk than other age groups, it is unclear whether there are gender differences within this age group. Some studies found that young male drivers are more involved in road accidents (Arnett, 2002), aggressive driving (Simon and Corbett, 1996), and violation of traffic and road laws (Jonah and Dawson, 1987; Fletcher, 1995). Analysing risky attitudes, Matthews and Moran (1986) found that young male drivers tend to see themselves as relatively immune to the hazards threatening their peers. Moreover, Glendon et al. (1996) found that young male drivers tend to underestimate their own personal risk perception and overestimate their competence when compared to females.
However, more recent studies report that female drivers are now over-represented in crashes compared to males, due to errors in yielding, gap acceptance, and speed regulations (Classen et al., 2012). Laapotti et al. (2001, 2003) found that although females have a greater safety orientation than males, young female drivers show more problems in vehicle handling and mastering traffic situations.
Taking this evidence altogether suggests that age is a crucial demographic factor in terms of presence/absence of gender differences (Rhodes and Pivik, 2011). Recently, Lucidi et al. (2010) identified different types of young drivers' profiles in a large sample of 1800 young men and women 18–23 years of age with a valid driver's license. They classified three different profiles in detail (i.e., risky drivers; worried drivers and careful drivers) and found that the 75.4% of “risky drivers” are male.
Kelley-Baker and Romano (2010) reported that in the United States, the prevalence of women involved in fatal motor vehicle accidents is rising, while it is decreasing among men. Romano et al. (2008) observed that this increase could be mostly due to an increase in traffic exposure, as well as to an increase of riskier driving behavior in women, particularly in young female drivers. Furthermore, Kelley-Baker and Romano (2010) found that many of the gender-based differences associated to skill-related crashes were either non-existent or largely explained by gender differences in alcohol consumption. Therefore, the role of gender as a predictive factor in risky driving behavior deserves further investigation. Generally speaking, socio-cultural dynamics produce different opportunities to learning in males and in females. In the past, one negative consequence of these dynamics was to be encompassed in the so-called stereotype threat in which people are or feel themselves to be at risk of confirming negative stereotype about their group (Inzlicht and Schmader, 2012). Educational system, messages spread by mass media and society in general contribute to the diffusion of implicit information regarding sex roles in young people (Rolandelli, 1991) explaining also why young drivers have high risky behaviors of older drivers. It is also possible that scientific researches that have reported that male drivers are more prone to suffer from crashes have produced changes in women and men's self-belief and perceptions about driving behaviors interlaced with general society changes. This is in line with the above mentioned findings in which the prevalence of women involved in fatal motor-vehicle crashes is rising (e.g., Kelley-Baker and Romano, 2010). In the present study, we investigated gender-related effects on road safety attitudes.
As several studies have found an interactive effect of gender and age on driving behavior, our sample included only young drivers aged 18–22 years. We focused on young drivers because, as demonstrated by Gregersen and Bjurulf (1996), Maycock et al. (1991), Brown and Groeger (1988), and Deery (1999), they are more likely to underestimate the risk of being involved in a crash and to overestimate their own abilities as drivers. A possible explanation of this tendency could be found in a general tendency toward risky behavior regardless of the driving situation (e.g., Jessor, 1987). For such a reason, we investigated both the attitude toward risk and the risk perception for better understanding whether the presence of risky behaviors could be related to a deficit in the actual risk perception.
To our knowledge this is the first time that the investigation have been performed enrolling young drivers from nine different European countries, generally the topic is analyzed in just one country at a time. This large sample may allow understanding the role of gender in road safety attitudes in young drivers in a large geographical area.
Methods
Participants
A preliminary sample of 2681 young individuals from Italy, Austria, Bulgaria, Cyprus, Germany, Ireland, Latvia, Lithuania, and Poland participated in the study (1458 males, 54.4%, age range 18–22 years; Table 1). Participants were recruited from schools and universities that had been preliminarily selected at random from each different country according to different demographic districts. School classes and university courses were then randomly selected from each institute and students agreed or disagreed to participate.
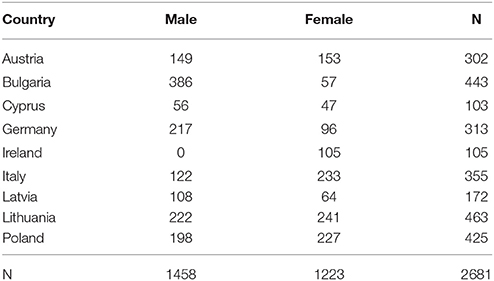
Table 1. Number of participants involved in the study separated for Gender and different European Countries.
According to the reported personal driving experience, each participant was assigned to one of three different groups: Car drivers (participants who usually drive a car, even if they also occasionally ride a powered two wheeler—PTW), Motorcyclists (participants who usually ride a PTW but not a car), and Non-drivers (participants who drive neither a car nor a PTW). The motorcyclists were under-represented in the general sample compared the other groups. The study was performed according to the ethical principles expressed in the Declaration of Helsinki and it was approved by the local ethics committee (Psychology Department, University “Sapienza” of Rome, Italy). All participants provided their written consent to participate in the study and filled out a questionnaire with their socio-demographic information.
Instruments and Procedure
Participants were required to complete a questionnaire on basic demographic information and driving records, including an estimation of how many kilometers they drive weekly. The questionnaire was aimed at assessing attitudes toward road safety issues, driving behaviors in specific hypothetical situations, accident risk perception, and the concerns over these risks. The questionnaire contained the following measures:
Attitude toward Road Safety Issues
(Driving Attitudes Scale—DAS—Iversen and Rundmo, 2004) This scale assesses road safety attitudes related to driving. Specifically, we assessed the attitudes toward rule violations and speeding, careless driving, as well as the attitude toward driving under the effects of alcohol and drugs (e.g., “Speed limits cannot be observed because they are too restrictive”). All the items were answered on six-point response scales ranging from “strongly disagree” (0) to “strongly agree” (5), with high scores indicating a negative attitude toward traffic safety (i.e., high preferences for risk-taking behavior).
Driver Behaviour: Violation, Errors, and Lapses (Driver Behaviour Questionnaire–DBQ)
This scale is currently one of the most widely used scales for assessing self-reported driving behaviors (Lajunen and Summala, 2003). Respondents are required to indicate, on a six-point scale ranging from “never to” (0) to “nearly all the time” (5), how often they committed specific driving violations (12 items), errors (8 items), and lapses (8 items) in the past year.
Accident Risk Perception
Two items measuring risk perception were also included. On a ten-point response scale, ranging from “very low” (1) to “very high” (10), respondents were asked to evaluate their likelihood of being involved in a car accident compared to their fellows (i.e., “If you drive a car, how would you assess your risk of having a road accident, as compared to people of your age?”) and to indicate their level of concern about this possibility (i.e., “How much are you worried about this possibility?”).
The scales were almost identical for the three groups (Car drivers, Motorcyclists, and Non-drivers), with the exception that items were adapted for the specific group of respondents.
Statistical Analyses
Data from the different groups (Car drivers, Motorcyclists, and Non-drivers) were separately submitted to exploratory factor analyses, using the Principal Axis method and the oblique Oblimin rotation. This step was necessary, as not all the scales are validated for all the countries included in this study. The different scale factor scores were then computed through the regression method for each factor and used for further statistical analyses. Specifically, to examine possible differences between groups in driving attitudes and imagined driving behavior, factor scores from the two scales (Attitudes and Behaviors) were separately submitted to an Analysis of Variance (ANOVA) with Group (males, females) and Factors from each scale as independent variables. To examine possible differences between the groups in risk perception and the level of concern about this risk, the scores from the two Accident Risk Perception items (Personal Accident Probability and Level of Concern) were also submitted to a 2 (males, females) × 2 (Accident Probability and Concern) ANOVA.
To investigate differences in Attitude toward road safety for each Country, factor scores from the component of the Driving Attitudes Scale were submitted to a mixed-design 2 × 3 ANOVA with Gender as the independent variable and DAS components as dependent variables, for every individual Country. The sample of each Country was balanced for gender. In the case of Ireland it was not possible to proceed to the analysis, because men in the sample were not represented. We also investigated possible gender differences for each Country, in driving behavior, factor scores from the components derived from the factorial analysis of the Driving Behavior Questionnaire (DBQ) were submitted to a 2 × 2 ANOVA mixed design with Gender as the independent variable and DBQ Components as dependent variables for each Country.
Results
Factor Analysis
Attitude Toward Road Safety Issues
Data from the Driving Attitudes Scale were submitted to exploratory factor analysis (Principal Axis method, Oblimin rotation). Measures of sampling adequacy, Kaiser-Meyer-Olkin = 0.854 and factorability of the correlation matrix, Bartlett's test of sphericity = 18350.62, p < 0.0001 were both adequate. The scree test yielded a third-factor solution accounting for 47.34% of the total variance. The first factor, labeled “Negative attitude toward traffic rules and risky driving,” accounts for 25.06% of the common variance and refers to the positive attitude toward risky driving behavior. Items such as “High-speed driving is possible if road conditions are good and there is nobody around” load on this factor.
The second factor, labeled “Negative attitude toward drugs and alcohol”, accounts for 15.37% of the common variance and refers to negative attitudes toward driving under the effects of psychoactive substances. Items such as “I would never drive after drinking alcoholic drinks” and “I would never drive under the influence of narcotic drugs” load on this factor. The third factor, labeled “Tolerance toward speeding”, accounts for 6.9% of the common variance and refers to a positive attitude toward riding in a car with a fast driver. Items such as “It is ok to ride in a car with a fast driver if it is the only way to go back home at night” load on this factor. This factor shows a slight positive correlation with the first factor (.42).
Driver Behavior: Violation and Lapses
Data from the Driving Behavior Scale were submitted to exploratory factor analysis (Principal Axis method, Oblimin rotation). Measures of sampling adequacy, Kaiser-Meyer-Olkin = 0.973 and factorability of the correlation matrix, Bartlett's test of sphericity = 44853.656, p < 0.001 were both adequate. The scree test yielded a two-factor solution accounting for 48.49% of the total variance. The first, labeled “Errors in inattentive driving,” accounts for 40.38% of the common variance and refers to driving without respecting and paying attention to road rules. Items such as “Drive without keeping a safe distance” load on this factor. The second factor was labeled “Driving violations”. Items such as “You exceed the speed limit by 10 Km/h” load on this factor. This second factor positively correlates with the first factor (.6).
ANOVA Results
Attitude toward Road Safety Issues
Factor scores from the component of the Driving Attitudes Scale were submitted to a mixed-design 2 × 3 ANOVA with Gender as the independent variable and DAS components (Negative attitude toward traffic rules and risky driving; Negative attitude toward drugs and alcohol; Tolerance toward speeding) as dependent variables. The ANOVA revealed a significant Gender X Component interaction, F(2, 5212) = 225,389, p < 0.001 (Table 1 and Figure 1). Planned comparisons revealed that males had higher scores on the Negative attitude toward traffic rules component, F(1, 2606) = 177.693, p < 0.001, d = −0.52, and for Tolerance toward speeding F(1, 2606) = 125.210, p < 0.001, d = 0.53 (Table 2 and Figure 1), while in the Negative attitude toward drugs and alcohol component, females showed higher scores, F(1, 2606) = 179.323, p < 0.001, d = −0.44]. These results show that male drivers are more prone to accept speeding, commit traffic violations, and use drugs and alcohol while driving.
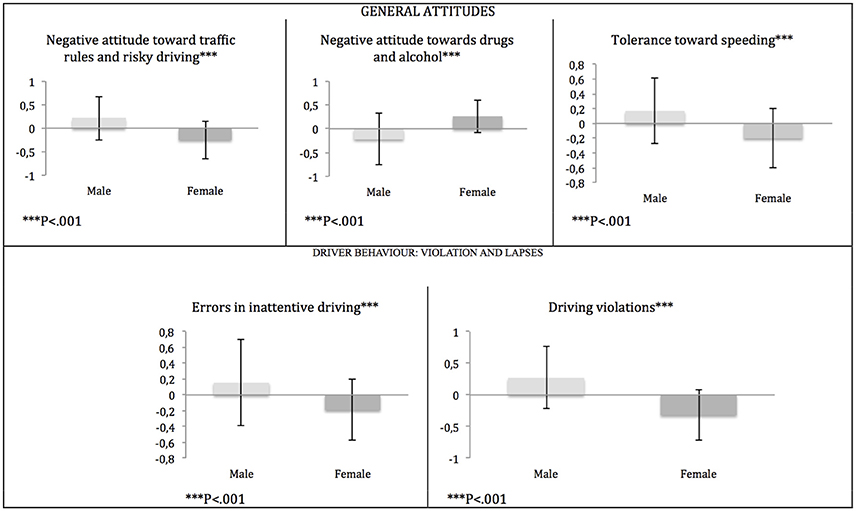
Figure 1. Mean factor scores for the three dimensions derived from the General Attitudes on road safety, and for the two factors of the Driver Behavior Questionnaire.
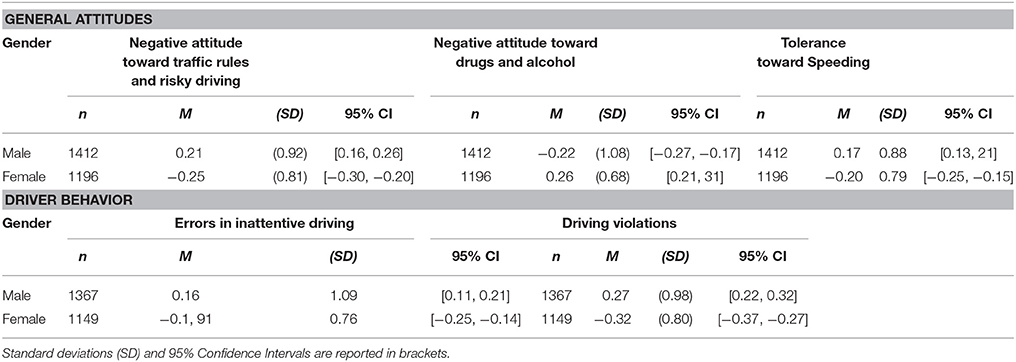
Table 2. Mean factor scores for the dimensions of the general attitudes and driver behavior are represented for gender.
Driver Behavior: Violation and Lapses
To investigate possible gender differences in driving behavior, factor scores from the components derived from the factorial analysis of the Driving Behavior Questionnaire were submitted to a 2 × 2 ANOVA mixed design with Gender as the independent variable and DBQ Components (Errors in inattentive driving, Driving violations) as dependent variables. The ANOVA revealed a significant Gender X Components interaction, F(1, 2514) = 55.715, p < 0.001, indicating that the Gender shows different score trends in the two scale components. Planned comparisons revealed that male participants had higher scores in Errors in inattentive driving, F(1, 2514) = 83.873, p < 0.001, d = −0.37, and in Driving violations, F(1, 2514) = 262.603, p < 0.001, d = −0.65 (Table 2 and Figure 1).
Gender differences in attitudes and driving behavior for individual Country.
Attitude toward Road Safety Issues
Austria
In the case of Austria the ANOVA revealed a significant Gender X Component interaction, F(2, 566) = 12.41, p < 0.001. Planned comparisons revealed that males had higher scores on the Negative attitude toward traffic rules component, F(1, 283) = 17.402, p < 0.001, d = −5.94 (see Table 3), and Tolerance toward speeding F(1, 283) = 4.34, p < 0.05, d = −0.25, while for Negative attitude toward drugs and alcohol females revealed higher scores F(1, 283) = 8.202, p < 0.01, d = 0.34.
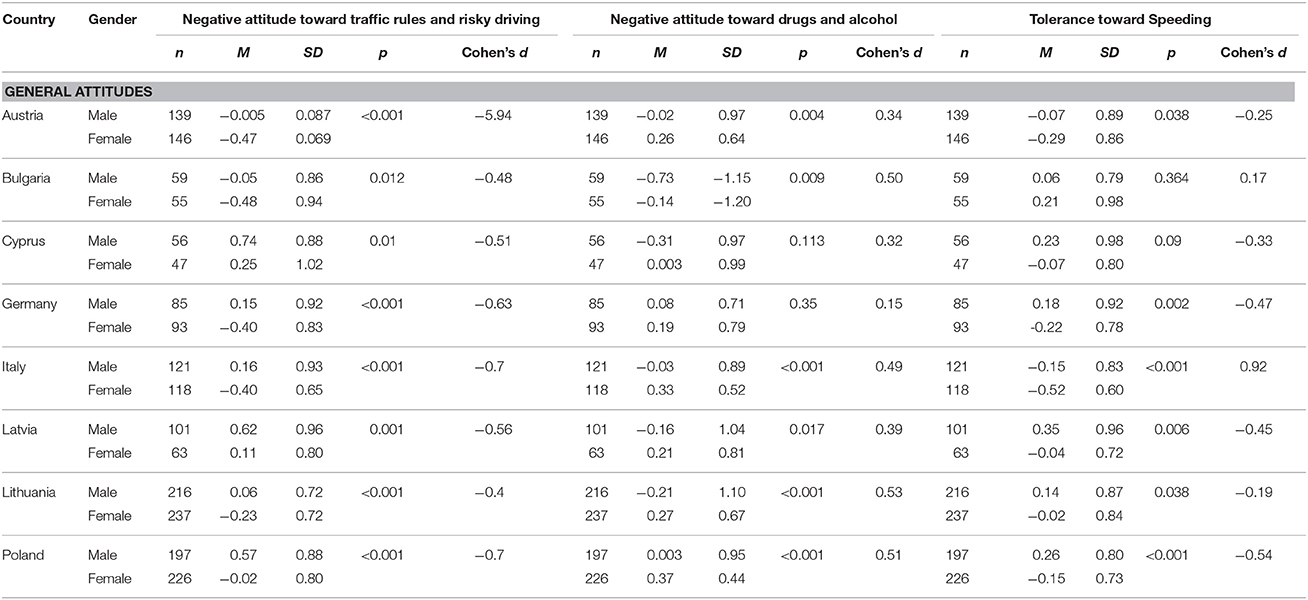
Table 3. Contrast for gender and DAS components (Negative attitude toward traffic rules and risky driving; Negative attitude toward drugs and alcohol; Tolerance toward speeding) for each Country.
Bulgaria
Also for Bulgaria the ANOVA showed a significant Gender X Component interaction, F(2, 202) = 5.57, p < 0.01. Planned comparisons revealed a higher scores for the males on Negative attitude toward traffic rules component, F(1, 112) = 6.52, p < 0.05, d = −0.48 (Table 3), while on the Negative attitude toward drugs and alcohol females showed higher scores F(1, 112) = 7.072, p < 0.01, d = 0.34. There were not significant differences for the gender on factor Tolerance toward speeding.
Cyprus
The ANOVA showed a significant Gender X Component interaction, F(2, 224) = 7.306, p < 0.01. Planned comparisons revealed that males had higher scores on the Negative attitude toward traffic rules component, F(1, 101) = 6.772, p < 0.001, d = −5.94 (see Table 3), but no significant differences were found for the factors Negative attitude toward drugs and alcohol and Tolerance toward speeding.
Germany
Also for Germany we found significant differences in Gender X Component interaction, F(2, 352) = 7.96, p < 0.001, and in the planned comparisons for the factors Negative attitude toward traffic rules component, F(1, 176) = 17.39, p < 0.001, d = −0.63 (Table 3), and Tolerance toward speeding F(1, 176) = 9.8, p < 0.01, d = −0.47. No significant differences were found for the Negative attitude toward drugs and alcohol.
Italy
Same result for the Italian sample: We found significant differences in Gender X Component interaction for the Italian sample, F(2, 474) = 23.19, p < 0.001. Planned comparisons revealed that males had higher scores on the Negative attitude toward traffic rules component, F(1, 237) = 29.28, p < 0.001, d = −0.7 (see Table 3), and Tolerance toward speeding F(1, 237) = 15.972, p < 0.001, d = 0.92, while for Negative attitude toward drugs and alcohol females revealed higher scores F(1, 237) = 14.54, p < 0.001. d = 0.49.
Latvia
The ANOVA presented a significant Gender X Component interaction, F(2, 324) = 11.606, p < 0.001. Planned comparisons revealed that males had higher scores on the Negative attitude toward traffic rules component, F(1, 162) = 12.347, p < 0.001, d = −0.56 (see Table 3), and Tolerance toward speeding F(1, 162) = 7.8, p < 0.01, d = −0.45, while on the Negative attitude toward drugs and alcohol females showed higher scores F(1, 162) = 5.79, p < 0.05, d = 0.39.
Lithuania
Also for Lithuania we found significant differences in Gender X Component interaction, F(2, 902) = 28.84, p < 0.001. Planned comparisons showed that males had higher scores on the Negative attitude toward traffic rules component, F(1, 451) = 18.96, p < 0.001, d = −0.4 (see Table 3), and Tolerance toward speeding F(1, 451) = 4.32, p < 0.05, d = −0.19, while on the Negative attitude toward drugs and alcohol females showed higher scores F(1, 451) = 32.6, p < 0.001, d = 0.53.
Poland
For the Polish sample we found a significant effect Gender X Component interaction, F(2, 842) = 47.29, p < 0.001. Planned comparisons revealed that males had higher scores on the Negative attitude toward traffic rules component, F(1, 421) = 51.73, p < 0.001, d = −0.7 (see Table 3), and Tolerance toward speeding F(1, 421) = 30.03, p < 0.001, d = −0.54, while on the Negative attitude toward drugs and alcohol females showed higher scores F(1, 421) = 27.67, p < 0.001, d = 0.51.
These results showed that for the negative attitude on traffic rules there are no differences for individual countries: Males drivers are generally more prone to no respect of the rules. Differently, for the Tolerance toward speeding and Negative attitude toward drugs and alcohol, we did not find gender difference in all countries.
Driver Behavior: Violation and Lapses
Austria
For the Austrian sample the ANOVA revealed a significant Gender X Component interaction, F(1, 259) = 8.26, p < 0.01. Planned comparisons revealed that male participants had higher scores in Errors in inattentive driving, F(1, 259) = 10.3, p < 0.001, d = −0.407, and in Driving violations, F(1, 259) = 31.4, p < 0.001, d = −1.83 (Table 4).
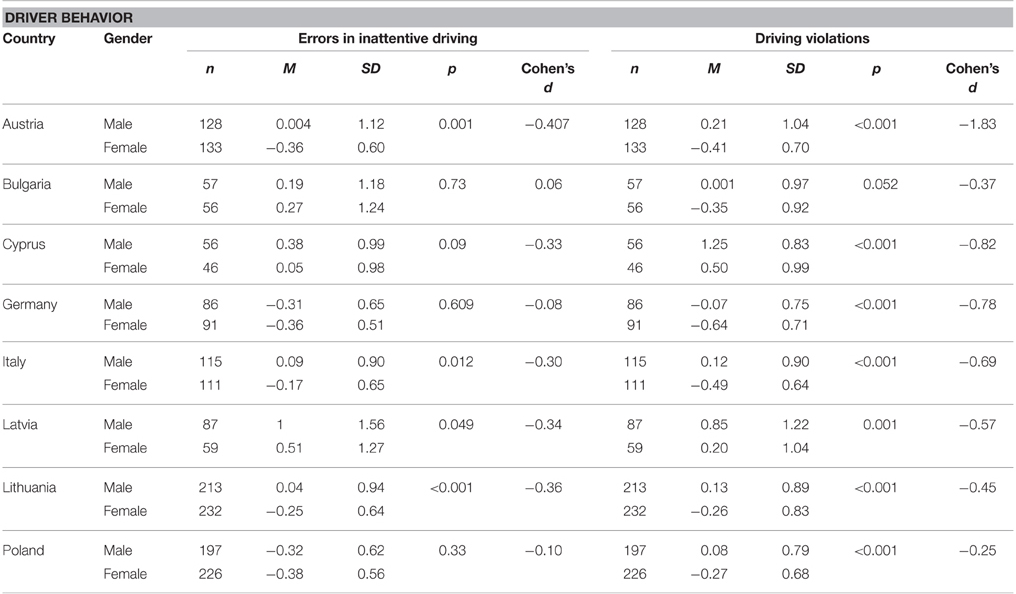
Table 4. Contrast for gender and DBQ Components (Errors in inattentive driving, Positive attitude toward traffic code, and Positive attitude toward Drugs and alcohol) for each Country.
Bulgaria
Also for Bulgaria the ANOVA showed a significant Gender X Component interaction, F(1, 111) = 6.501, p < 0.05. Planned comparisons not revealed a significant differences in Errors in inattentive driving and in Driving violations (Table 4).
Cyprus
The ANOVA presented a significant Gender X Component interaction, F(1, 100) = 6.46, p < 0.05. Planned comparisons revealed that males had higher scores in Driving violations, F(1, 100) = 17.29, p < 0.001, d = −0.82 (Table 4). We have not found gender differences in the factor Errors in inattentive driving.
Germany
Also for Germany we found significant differences in Gender X Component interaction, F(1, 175) = 33.09, p < 0.001, and in the planned comparisons for the factors Driving violations, F(1, 175) = 27.02, p < 0.001, d = −0.78 (Table 4). We have not found differences in Errors in inattentive driving.
Italy
We found significant differences in Gender X Component interaction for the Italian sample, F(1, 224) = 16.75, p < 0.001. Planned comparisons revealed that males had higher scores Errors in inattentive driving, F(1, 224) = 6.34, p < 0.05, d = −0.3, and in Driving violations, F(1, 224) = 33.9, p < 0.001, d = −0.69 (Table 4).
Latvia
The ANOVA showed a significant difference for the Gender X Component interaction, F(1, 144) = 7.21, p < 0.01. Planned comparisons revealed that males had higher scores in Errors in inattentive driving, F(1, 44) = 7.8, p < 0.01, d = −0.34, and in Driving violations, F(144) = 3.95, p < 0.001, d = −0.57 (Table 4).
Lithuania
Also for Lithuania we found significant differences in Gender X Component interaction, F(1, 443) = 25.87, p < 0.001. Planned comparisons showed that males had higher scores in Errors in inattentive driving, F(1, 44) = 15.43, p < 0.001, d = −0.36, and in Driving violations, F(144) = 23.78, p < 0.001, d = −0.45 (Table 4).
Poland
For the Polish sample we found a significant effect Gender X Component interaction, F(1, 421) = 21.26, p < 0.001. Planned comparisons revealed that males had higher scores in Driving violations, F(1, 421) = 24.71, p < 0.001, d = −0.25 (Table 4). We have not found differences for the factor Errors in inattentive driving.
Accident Risk Perception
Scores from the two Accident Risk Perception items were submitted to a 2 × 2 mixed-design ANOVA, with Gender as the independent variable and Accident Risk (Probability and Concern) as dependent variables. The ANOVA yielded a significant main effect for Gender, F(1, 2650) = 224.556, p < 0.001, and a significant Gender X Accident Risk interaction, F(1, 2650) = 101.546, p < 0.001, revealing that gender shows different trends for the two risk measures. Contrasts revealed that, while females and males did not differ significantly in the level of accident risk perception, these two groups clearly show a significant difference regarding the level of concern about this risk, with males being significantly less concerned than females about the risk of a road accident, F(1, 2652) = 115.552; p < 0.001, d = 0.42. This result is extremely interesting, as it shows that even if the accident risk perception is the same, males and females differ in their level of concern about this risk (see Figure 2).
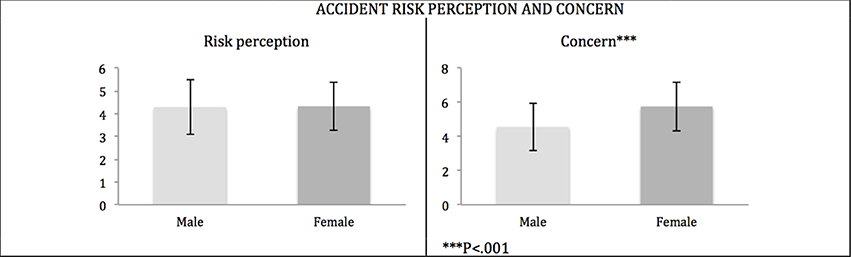
Figure 2. Mean scores of the Accident Risk Perception and Risk Concerns are represented for each group of road users (Car drivers, Motorcyclists, and Non-drivers).
Discussion
According to Romano et al. (2008), the increase in the number of women involved in fatal crashes could be explained by an increase in traffic exposure but could also be related to the changes in the role of women in society, which in some way bring women to behave like men. However, these authors also observed that risky driver behaviors can be attributed only to young female drivers and not to older females overall.
For this reason, in the present study, we aimed to investigate the gender-related effects on road safety attitudes focusing on young drivers aged 18–22 years. Moreover, we performed this investigation in nine different European countries to observe also for the presence of social and cultural effects. The scientific literature suggests that young drivers are more likely to underestimate the risk of being involved in a crash and to overestimate their own abilities as drivers. Moreover, if it is true that women are masculinized in their driving behavior and that this phenomenon is more present in the youngest, we should not have found any type of gender effect in our sample.
Specifically, our results identify three main factors in the attitude toward road safety issues that characterize our sample. The first factor is “Negative attitude toward traffic rules and risky driving” in which participants justify unsafe behaviors in accordance with environmental situations. The second factor concerns “Negative attitude toward drugs and alcohol,” and the third factor is “Tolerance toward speeding.” With respect to Driver Behavior (i.e., violation and lapses), two main factors also emerged: “Errors in inattentive driving” and “Driving violations.”
Present results show that male young drivers are more prone to accept speeding, traffic violations and drugs and alcohol use by the driver. Moreover, concerning the negative attitude on traffic rules there are no differences among individual countries. Indeed, in all countries males are generally more prone to no respect the rules. Interestingly, for the Tolerance toward speeding and Negative attitude toward drugs and alcohol, we did not find gender difference in all countries. This finding may reflect differences in the use and consumption of alcohol and drugs among countries as well as in differences due to national policies adopted to reduce alcohol/drug-related harm due to their abuse.
In general, our finding is in line with the observation that females are less involved in alcohol-related crashes and speeding-related crashes than males (Kelley-Baker and Romano, 2010). Furthermore, Kelley-Baker and Romano (2010) found that many of these gender differences can be largely explained by gender differences in alcohol consumption. Our data seem to support this observation as well as the presence of gender effects regardless of changes in gender roles or in women's driving behavior.
However, in the current study, the most interesting results regarding gender differences concern the evidence that both men and women have the same perception regarding dangerous or risky situations, but only women showed concerns about perceived risk. Worry and perceived risks are often investigated together. Sjöberg (1998) distinguishes worry from risk perception in terms of emotion vs. cognition. Indeed, worry has been described in terms of emotional responses to a threat (e.g., affective responses), while perceived risk has been considered a cognitive assessment (e.g., perceptions of vulnerability). Our results showed that the main difference is in terms of emotions; indeed, women appear more worried than men with respect to risk perception as a cognitive evaluation.
It is known that perception of risk is multi-dimensional (Slovic et al., 1980) and includes factors like perceived personal controllability of the hazard and voluntariness of exposure to risky situations. Gender is another factor, as women rate hazards as riskier than do men (Slovic, 2000). However, what factors are related to risk perception, in what way and why have yet to be clarified (Hawkes and Rowe, 2008). Furthermore, future studies must take into account that risk perception changes over time (Hawkes et al., 2009). For this reason, we can hypothesize that younger drivers are very different from older drivers and that a study on risk perception that considers the aging effect will also be useful in developing targeted prevention programs. An interesting finding has come from research aimed to reduce medical errors. Peters et al. (2006) found that worry about medical errors was a better predictor of intention to take precautionary actions than risk perceptions. Furthermore, a positive association between worry and health-protective behavior has been observed (McCaul and Mullens, 2003). Several studies demonstrate that worry about breast cancer leads to precautionary behavior to prevent the illness (e.g., Wilcox et al., 2002; Cameron and Reeve, 2006). In a study aimed at investigating five domains of risk taking (i.e., financial decisions, health/safety, recreational, ethical and social decisions) found that women appeared to be more risk-averse in all domains except social risk (Weber et al., 2002).
Our findings seem to suggest that worry over risky situations may help in reducing hazardous behaviors. Both men and women were able to understand and to detect risk, but only women showed concern about the risk. Furthermore, as observed in our sample, men's driving behavior seems to confirm that young men are more prone to accept road violations and to justify alcohol consumption. Surely, prevention programs should consider these aspects and focus on worries that could increase careful driving behaviors.
Author Contributions
Conceived and designed the experiments: AMG, FF, RS, PC, FB, LP. Performed the experiments: PC, FB. Analyzed the data: PC. Wrote the paper: LP, PC, FB, AMG.
Conflict of Interest Statement
The authors declare that the research was conducted in the absence of any commercial or financial relationships that could be construed as a potential conflict of interest.
Acknowledgments
This research was conducted thanks to collaboration by the ANIA Foundation for road safety (National Association of insurance companies). Data for the present study were collected from the I.C.A.R.U.S. European Project (Inter-Cultural Approaches for Road Users Safety; TREN/SUB/01-2008). The ICARUS project involved fifteen European countries (even if in the present paper only 9 countries data are reported) and aimed to develop a road safety training model to be shared among European countries.
References
Arnett, J. J. (2002). Developmental sources of crash risk in young drivers. Inj. Prev. 8, ii17–ii23. doi: 10.1136/ip.8.suppl_2.ii17
Brown, I. D., and Groeger, J. A. (1988). Risk perception and decision taking during the transition between novice and experienced driver status. Ergonomics 31, 585–597. doi: 10.1080/00140138808966701
Cameron, L. D., and Reeve, J. (2006). Risk perceptions, worry, and attitudes about genetic testing for breast cancer susceptibility. Psychol. Health 21, 211–230. doi: 10.1080/14768320500230318
Classen, S., Wang, Y., Crizzle, A. M., Winter, S. M., and Lanford, D. N. (2012). Gender differences among older drivers in a comprehensive driving evaluation. Accid. Anal. Prev. 61, 146–152. doi: 10.1016/j.aap.2012.10.010
Deery, H. A. (1999). Hazard and risk perception among young novice drivers. J. Safety Res. 30, 225–236. doi: 10.1016/S0022-4375(99)00018-3
Delhomme, P., Verlhiac, J., and Martha, C. (2009). Are drivers' comparative risk judgments about speeding realistic? J. Safety Res. 40, 333–339. doi: 10.1016/j.jsr.2009.09.003
Ebbesen, E. B., and Haney, M. (1973). Flirting with death: variables affecting risk-taking at intersections. J. Appl. Psychol. 3, 303–324. doi: 10.1111/j.1559-1816.1973.tb02398.x
Fletcher, D. (1995). A five year study of effects of fines, gender, race and age on illegal parking in spaces reserved for people with disabilities. Rehabil. Psychol. 40, 203–209. doi: 10.1037/0090-5550.40.3.203
Giannini, A. M., Ferlazzo, F., Sgalla, R., Cordellieri, P., Baralla, F., and Pepe, S. (2013). The use of video in road safety training: cognitive and emotional effects. Accid. Anal. Prev. 52, 111–117. doi: 10.1016/j.aap.2012.12.023
Glendon, A. I., Dorn, L., Davies, R., Matthews, G., and Taylor, R. G. (1996). Age and gender differences in perceived accident likelihood and driver competences. Risk Anal. 16, 755–762. doi: 10.1111/j.1539-6924.1996.tb00826.x
Grayson, G. B., and Maycock, G. (1988). “From proneness to liability,” in Road User Behaviour. Theory and Research, eds J. A. Rothengatter and R. De Bruin (Assen: Van Gorcum), 234–242.
Gregersen, N. P., and Bjurulf, P. (1996). Young novice drivers: towards a model of their accident involvement. Accid. Anal. Prev. 28, 229–241. doi: 10.1016/0001-4575(95)00063-1
Harre, N., Field, J., and Kirkwood, B. (1996). Gender differences and areas of common concern in the driving behaviours and attitudes of adolescents, J. Safety Res. 27, 163–173. doi: 10.1016/0022-4375(96)00013-8
Hawkes, G., Houghton, J., and Rowe, G. (2009). Risky and worry in everyday life: comparing diaries and interviews as tools in risk perception research. Health Risk Soc. 11, 209–230. doi: 10.1080/13698570902906439
Hawkes, G., and Rowe, G. (2008). A characterisation of the methodology of qualitative research on the nature of perceived risk: trends and omissions. J. Risk Res. 11, 617–643. doi: 10.1080/13669870701875776
Horswill, M. S., Waylen, A. E., and Tofield, M. I. (2004). Drivers' ratings of different components of their own driving skill: a greater illusion of superiority for skills that relate to accident involvement. J. Appl. Soc. Psychol. 34, 177–195. doi: 10.1111/j.1559-1816.2004.tb02543.x
Inzlicht, M., and Schmader, T. (2012). Threat: Theory, Process, and Application, Vol. 5. New York, NY: Oxford University Press, 141–143.
Iversen, I., and Rundmo, T. (2004). Attitudes towards traffic safety, driving behaviour and accident involvement. Accid. Anal. Prev. 28, 229–241. doi: 10.1080/00140130410001658709
Jessor, R. (1987). “Risky driving and adolescent problem behaviour: Theoretical and empirical linkage,” in Young Drivers Impaired by Alcohol and Other Drugs, ed T. Benjamion (London: Royal Society of Medicine Services), 97–110.
Jonah, B. A. (1997). Sensation seeking and risky driving: a review and synthesis of the literature. Accid. Anal. Prev. 29, 651–665. doi: 10.1016/S0001-4575(97)00017-1
Jonah, B. A., and Dawson, N. E. (1987). Youth and risk: age differences in risky driving, risk perception, and risk utility. Alcohol Drugs Driv. 3, 13–29.
Katz, A., Zaidel, D., and Elgrishi, A. (1975). An experimental study of driver and pedestrian interaction during the crossing conflict. Hum. Factors 17, 514–527.
Kelley-Baker, T., and Romano, E. (2010). Female involvement in U.S. nonfatal crashes under a three-level hierarchical crash model. Accid. Anal. Prev. 42, 2007–2010. doi: 10.1016/j.aap.2010.06.010
Kruegar, N., and Dickson, P. R. (1994). How believing in ourselves increases risk-taking: perceived self-efficacy and opportunity recognition. Decis. Sci. 25, 385–401. doi: 10.1111/j.1540-5915.1994.tb01849.x
Laapotti, S., Keskinen, E., Hatakka, M., and Katila, A. (2001). Novice drivers' accidents and violations - a failure on higher or lower hierarchical levels of driving behaviour. Accid. Anal. Prev. 35, 759–769. doi: 10.1016/S0001-4575(00)00090-7
Laapotti, S., Keskinen, E., and Rajalin, S. (2003). Comparison of young male and female drivers' attitude and self-reported traffic behaviour in Finland in 1978 and 2001. J. Safety Res. 35, 579–587. doi: 10.1016/j.jsr.2003.05.007
Lajunen, T. (1997). Personality Factors, Driving Style and Traffic Safety. Helsinki: University of Helsinki.
Lajunen, T., and Summala, H. (2003). Can we trust self-reports of driving? Effects of impression management on driver behaviour questionnaire responses. Tran Res. Part F 6, 97–107. doi: 10.1016/S1369-8478(03)00008-1
Lourens, P. F., Vissers, J. A. M. M., and Jessurun, M. (1999). Annual mileage, driving violations, and accident involvement in relation to drivers' sex, age, and level of education. Accid. Anal. Prev. 31, 593–597. doi: 10.1016/S0001-4575(99)00015-9
Lucidi, F., Giannini, A. M., Sgalla, R., Mallia, L., Devoto, A., and Reichmann, S. (2010). Young novice driver subtypes: relationship to driving violations, errors and lapses. Accid. Anal. Prev. 42, 1689–1696. doi: 10.1016/j.aap.2010.04.008
Matthews, M. L., and Moran, A. R. (1986). Age differences in male drivers' perception of accident risk: the role of perceived driving ability. Accid. Anal Prev. 18, 299–313. doi: 10.1016/0001-4575(86)90044-8
Maycock, J., Lockwood, C. R., and Lester, J. F. (1991). The Accident Liability of Car Drivers (Rep. No. 315). Crowthorne: Transport and Road Research Laboratory.
McCaul, K. D., and Mullens, A. B. (2003). “Affect, thought, and self-protective health behaviour: the case of worry and cancer screening,” in Social Psychological Foundations of Health and Illness, eds J. Suls and K. Wallston (Malden, MA: Blackwell), 137–168.
Organisation for Economic Co-operation Development (OECD) (2016). Road Accidents (Indicator). Available online at: http://data.oecd.org/transport/road-accidents.htm.
Oltedal, S., and Rundmo, T. (2006). The effects of personality and gender on riskyn driving behaviour and accident involvement. Safety Sci. 44, 621–628. doi: 10.1016/j.ssci.2005.12.003
Parker, D., Lajunen, T., and Stradling, S. (1998). Attitudinal predictors of interpersonal violations on the road. Trans. Res Part F 1, 11–24. doi: 10.1016/S1369-8478(98)00002-3
Parker, D., Manstead, A. S. R., Stradling, S., and Reason, J. T. (1992). Determinants of intention to commit driving violations. Accid. Anal. Prev. 24, 117–131. doi: 10.1016/0001-4575(92)90028-H
Peters, E., Slovic, P., Hibbard, J. H., and Tusler, M. (2006). Why worry? Worry, risk perceptions, and willingness to act to reduce medical errors. Health Psychol. 25, 144–152. doi: 10.1037/0278-6133.25.2.144
Rhodes, N., and Pivik, K. (2011). Age and gender differences in risky driving: the roles of positive affect and risk perception. Accid. Anal. Prev. 43, 923–931. doi: 10.1016/j.aap.2010.11.015
Rolandelli, D. R. (1991). Gender role portrayal analysis of children's television programming in Japan. Hum. Relat. 44, 1273–1299. doi: 10.1177/001872679104401203
Romano, E., Kelley-Baker, T., and Voas, R. B. (2008). Female involvement in fatal crashes: increasingly riskier or increasingly exposed? Accid. Anal. Prev. 40, 1781–1788. doi: 10.1016/j.aap.2008.06.016
Rutter, D. R., Quine, L., and Chesham, D. J. (1995). Predicting safe riding behaviour and accidents: demography, beliefs, and behaviour in motorcycling safety. Health Psychol. 10, 369–386. doi: 10.1080/08870449508401957
Simon, F., and Corbett, C. (1996). Road traffic offending, stress, age, and accident history among male and female drivers. Ergonomics 39, 757–780. doi: 10.1080/00140139608964497
Sjöberg, L. (1998). Worry and risk perception. Risk Anal. 18, 85–93. doi: 10.1111/j.1539-6924.1998.tb00918.x
Slovic, P., Fischhoff, B., and Lichtenstein, S. (1980). “Facts and fears: understanding perceived risk,” in Societal Risk Assessment: How Safe is Safe Enough?, eds R. Schwing and W. A. Albers Jr (New York, NY: Plenum), 181–216.
Storie, V. J. (1977). Male and Female Car Drivers: Differences Observed in Accidents (Rep. No. 761). England: Transport and Road Research Laboratory.
Taubman-Ben Ari, O., Mikulincer, M., and Iram, A. (2004). A multi-factorial framework for understanding reckless driving-appraisal indicators and perceived environmental determinants. Trans Res Part F 7, 333–349. doi: 10.1016/j.trf.2004.10.001
Teese, R., and Bradley, G. (2008). Predicting recklessness in emerging adults: a test of a psychosocial model. J. Soc. Psychol. 148, 105–126. doi: 10.3200/SOCP.148.1.105-128
Ulleberg, P., and Rundmo, T. (2003). Personality, attitudes and risk perception as predictors of risky driving behaviour among young drivers. Safety Sci. 41, 427–443. doi: 10.1016/S0925-7535(01)00077-7
Underwood, G. (2007). Visual attention and the transition from novice to advanced driver. Ergonomics 50, 1235–1249. doi: 10.1080/00140130701318707
Weber, E. U., Blais, A.-R., and Betz, N. E. (2002). A Domain-specific risk-attitude scale: measuring risk perceptions and risk behaviors. J. Behav. Decis. Making 15, 263–290. doi: 10.1002/bdm.414
Whissell, R. W., and Bigelow, B. J. (2003). The speeding attitude scale and the role of sensation seeking in profiling young drivers at risk. Risk Anal. 23, 811–820. doi: 10.1111/1539-6924.00358
Wilcox, S., Ainsworth, B. E., LaMonte, M. J., and DuBose, K. D. (2002). Worry regarding major diseases among older African-American, Native-American, and Caucasian women. Women Health 36, 83–99. doi: 10.1300/J013v36n03_06
World Health Organization (WHO) (2015). Global Status on Road Safety. Available online at: http://www.who.int/violence_injury_prevention/road_safety_status/2015/en/ (last accessed March 2016).
Yagil, D. (1998). Gender and age-related differences in attitudes toward traffic law and traffic violations. Trans. Res. Part F 1, 123–135. doi: 10.1016/S1369-8478(98)00010-2
Keywords: risk perception, worry, driving behavior, sex differences, young drivers
Citation: Cordellieri P, Baralla F, Ferlazzo F, Sgalla R, Piccardi L and Giannini AM (2016) Gender Effects in Young Road Users on Road Safety Attitudes, Behaviors and Risk Perception. Front. Psychol. 7:1412. doi: 10.3389/fpsyg.2016.01412
Received: 09 June 2016; Accepted: 05 September 2016;
Published: 27 September 2016.
Edited by:
Kath Woodward, Open University, UKReviewed by:
Peter Karl Jonason, Western Sydney University, AustraliaNicole Farris, University of West Alabama, USA
Copyright © 2016 Cordellieri, Baralla, Ferlazzo, Sgalla, Piccardi and Giannini. This is an open-access article distributed under the terms of the Creative Commons Attribution License (CC BY). The use, distribution or reproduction in other forums is permitted, provided the original author(s) or licensor are credited and that the original publication in this journal is cited, in accordance with accepted academic practice. No use, distribution or reproduction is permitted which does not comply with these terms.
*Correspondence: Anna Maria Giannini, annamaria.giannini@uniroma1.it