
- 1 Rebecca L Cooper Laboratories, Mental Health Research Institute of Victoria, Parkville, VIC, Australia
- 2 Department of Psychiatry, The University of Melbourne, Parkville, VIC, Australia
- 3 Department of Molecular Biology, The Scripps Research Institute, La Jolla, CA, USA
- 4 The Centre for Neuroscience, The University of Melbourne, Parkville, VIC, Australia
- 5 Department of Psychological Medicine, Monash University, Clayton, VIC, Australia
Our recent microarray study reported altered mRNA expression of several low density lipoprotein receptor-related proteins (LRP) associated with the first 4 years following diagnosis with schizophrenia. Whilst this finding is novel, apolipoprotein E (APOE), which mediates its activity through LRPs, has been reported by several studies to be altered in brains of subjects with schizophrenia. We used qPCR to measure the expression of LRP2, LRP4, LRP6, LRP8, LRP10 and LRP12 mRNA in Brodmann’s area (BA) 46 of the dorsolateral prefrontal cortex in 15 subjects with short duration of illness schizophrenia (SDS) and 15 pair matched controls. We also used Western blotting to measure APOE protein expression in BA46 from these subjects. Amongst the LRPs examined, LRP10 expression was significantly increased (P = 0.03) and LRP12 was significantly decreased (P < 0.01) in SDS. APOE protein expression was also increased in SDS (P = 0.01). No other marker examined in this study was altered with diagnosis. Our data supports a role for distinct members of the LRP family in the pathology of schizophrenia and adds weight to the hypothesis that aberrant apolipoprotein signaling is involved in the early stages of schizophrenia.
Introduction
Our recent microarray study of gene expression in the dorsolateral prefrontal cortex from subjects with schizophrenia of short (SDS) (<4 years) and long (LDS) (>22 years) duration of illness schizophrenia and age and sex matched controls reported altered expression of several low density lipoprotein receptor-related proteins (LRP) associated with SDS (Narayan et al., 2008 ). LRP’s are a structurally diverse family of transmembrane receptors that share a common lipoprotein related receptor protein binding domain (May and Herz, 2003 ; May et al., 2005 ). In addition to lipid metabolism, they are involved in a diverse array of processes involved in neuronal structural reorganization via interactions with glutamate, WNT signal transduction and APP processing (Beisiegel et al., 1989 ; Tamai et al., 2000 ; Hoe et al., 2006 ; Bell et al., 2007 ).
Whilst the LRP members serve as receptors for multiple of ligands, it is significant that one of the major molecules that signal through the LRPs; Apolipoprotein E (APOE), has been implicated in the pathophysiology of schizophrenia (Harrington et al., 1995 ; Dean et al., 2003 ). Levels of ApoE protein expression have been reported to be increased in subjects with schizophrenia (Dean et al., 2003 ; Digney et al., 2005 ). By contrast, APOE expression is decreased in the periphery of subjects with schizophrenia (Dean et al., 2008 ) suggesting an underlying level of complexity in the regulatory dysfunction of this protein. This is further evidenced by conflicting published data regarding the association between APOE polymorphisms and the incidence of schizophrenia (Harrington et al., 1995 ; Martinoli et al., 1995 ; Thibaut et al., 1998 ; Lee et al., 2001 ).
Our previous microarray study suggests altered mRNA expression of several LRPs in Brodmann’s Area (BA) 46 is associated with SDS (Narayan et al., 2008 ) but not LDS, suggesting altered LRP expression may be specifically involved in processes associated with the early progression of schizophrenia. Thus, we used qPCR to further interrogate the expression of several members of the LRP family that were identified as potentially altered in the initial screen of our microarray data, in BA 46 from subjects with SDS. We also examined the protein expression levels of ApoE in these subjects to see whether changes in LRP expression could be reflective of abnormal lipoprotein signaling.
Materials and Methods
Tissue Collection
All tissue was obtained from the Victorian Brain Bank Network at the Mental Health Research Institute of Victoria; the study was performed following the approval of the Ethics Committee of the Victorian Institute of Forensic Medicine and the Mental Health Research and Ethics Committee of Melbourne Health. The cohort used in this study was expanded from the cohort used in our microarray (Narayan et al., 2008 ). Due to limited tissue availability, the definition of SDS was expanded from <4 years as was used in our microarray study (Narayan et al., 2008 ) to <7 years duration of illness for this study to facilitate an increase in cohort size. Tissue from (BA46) of the left hemisphere was obtained post-mortem from 15 subjects diagnosed with schizophrenia <7 years prior to death and 15 subjects with no history of psychiatric illness (controls). For each subject, a consensus diagnosis was reached between a psychologist and a psychiatrist using the Diagnostic Instrument for Brain Studies (DIBS) (Keks et al., 1999 ); a semi-structured protocol for post-mortem assessment allowing psychiatric diagnosis according to DSM-IV criteria (American Psychiatric Association, 1994 ). Cadavers were refrigerated within 5 h and brain tissue was frozen to −70°C within 30 min of autopsy. The period between death and autopsy was taken as the post-mortem interval (PMI) where death was witnessed. In cases where death was not witnessed, only subjects who had been seen alive up to 5-h prior to being found dead were used in the study. In such instances, PMI was taken from the midpoint between the subject being found and being last seen alive. The pH of the CNS was measured as described previously (Kingsbury et al., 1995 ). Case details including demographic data and tissue quality markers are described in Table 1 . Subject drug history and cause of death are described in Table 2 .
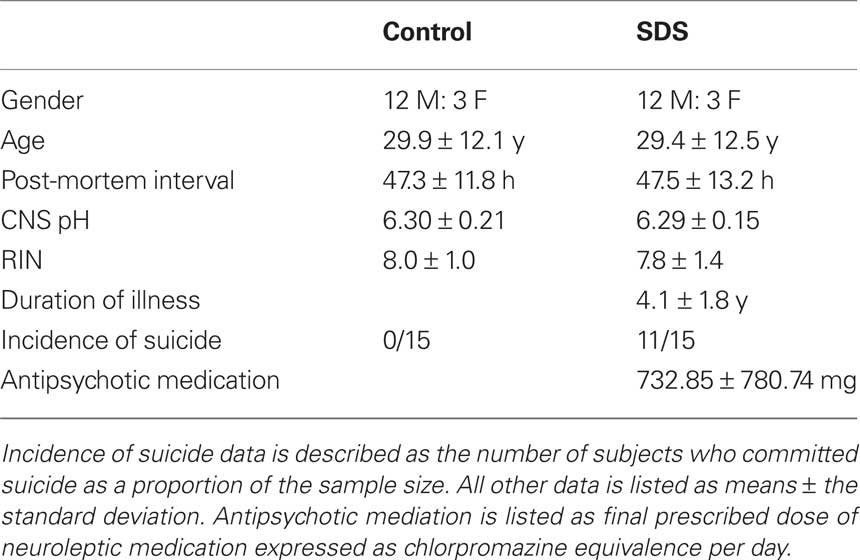
Table 1. A summary of the demographic and tissue condition data for subjects with short duration of illness schizophrenia (SDS) and control subjects used in the study. Gender data is described as the ratio of males (M) to females (F).
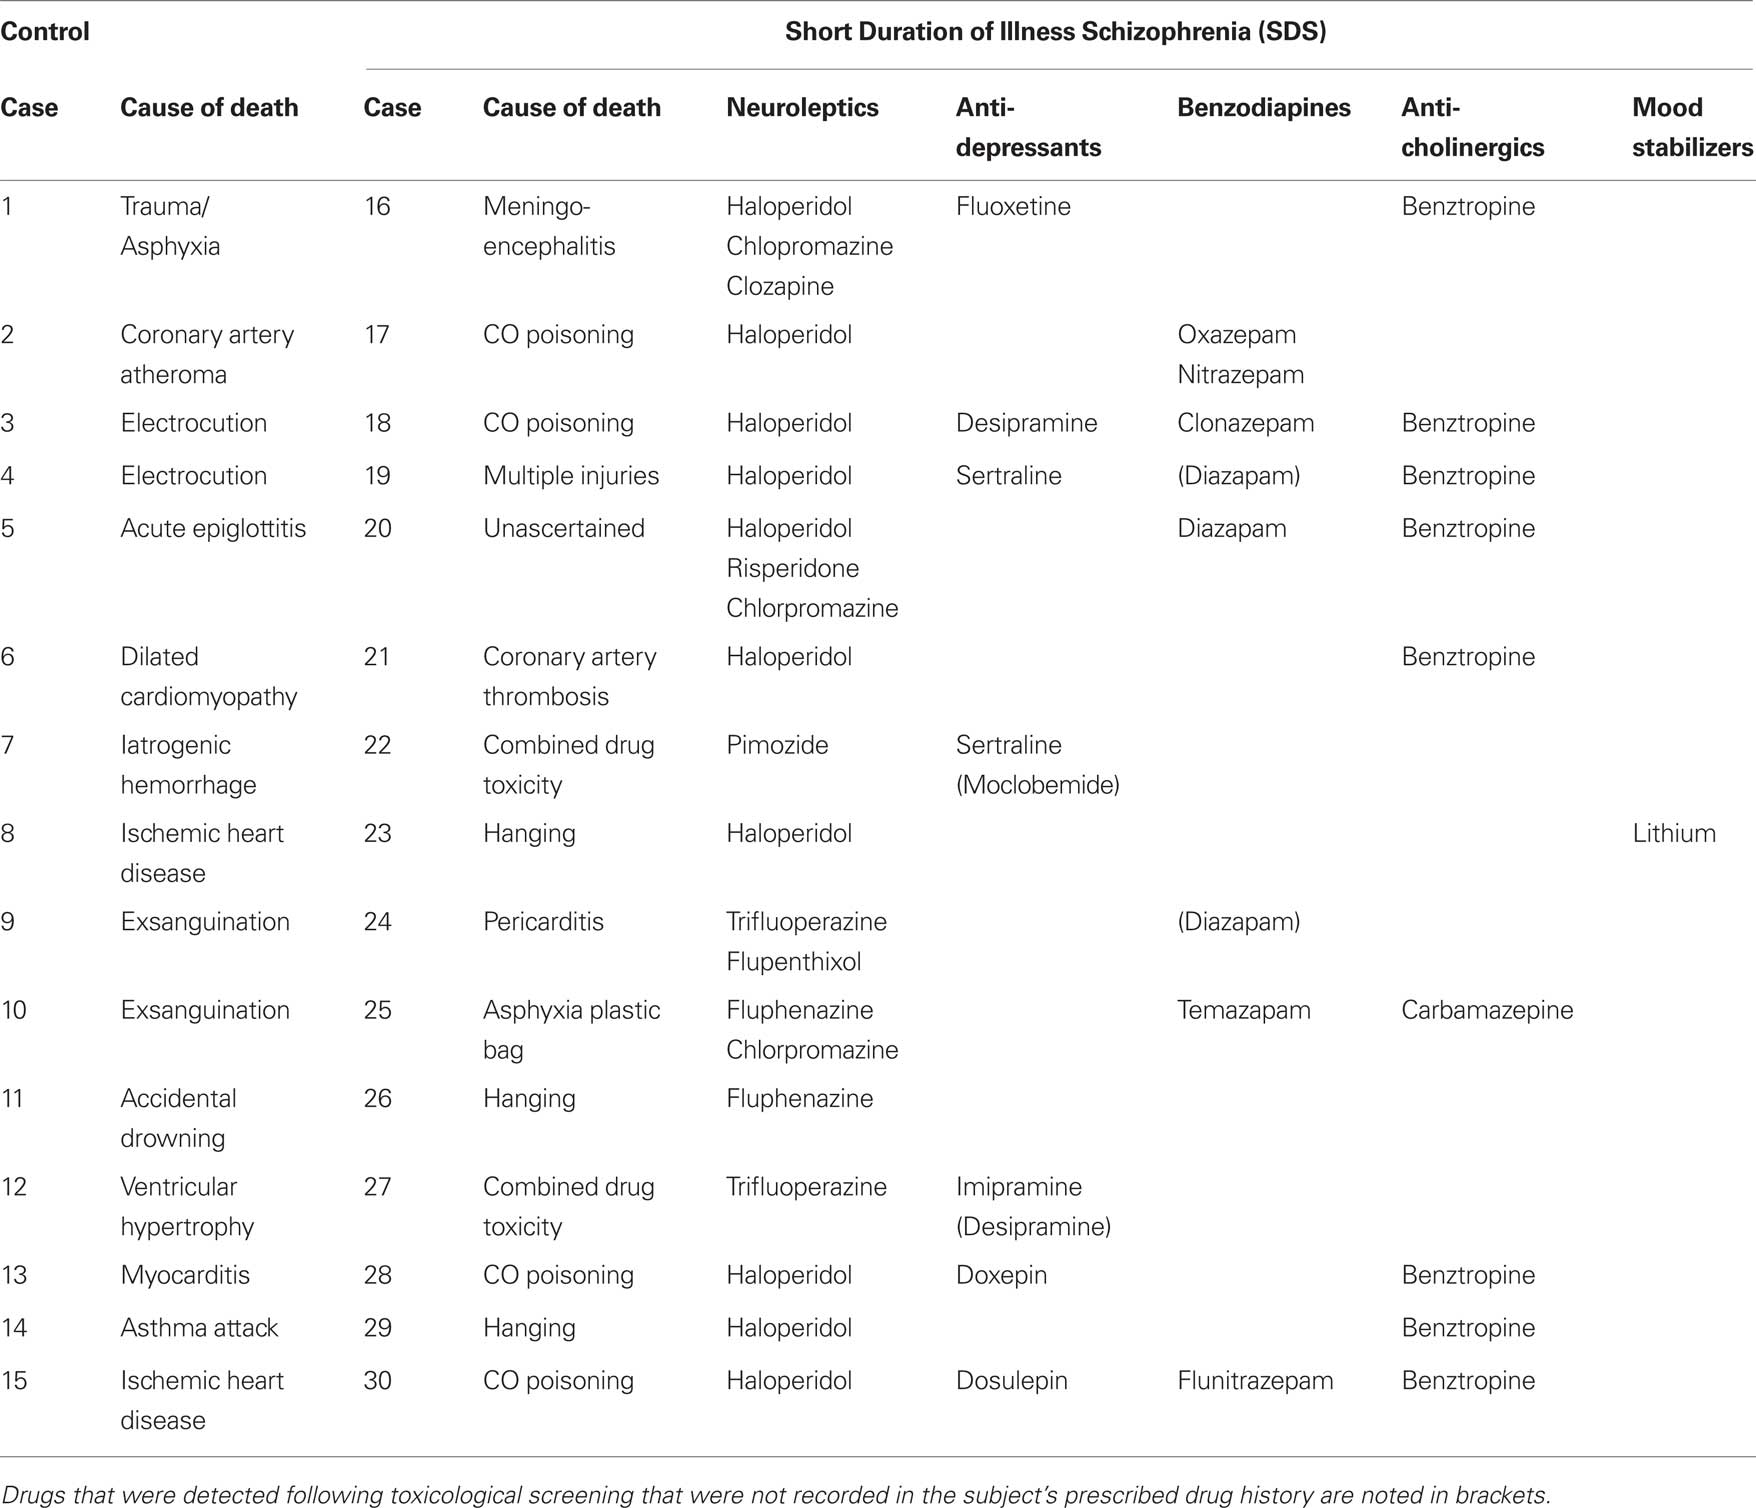
Table 2. The cause of death and medication history of the subjects used in this study.
Western Blotting
Homogenates were prepared from BA 46 tissue at 5% w/v in 10 mM Tris (pH 7.4), 1% SDS, 1 mM Na3VO4 and protein concentrations were determined using the Bio-Rad DC modified Lowry protein assay adapted for microplates. Thirty micrograms of protein samples were resolved on a 10% polyacrylamide gel. To minimize gel variation between diagnoses, protein samples from pair matched subjects were loaded in duplicate in consecutive lanes on the same gel. Molecular weight standards were loaded onto each gel. The proteins were transferred on to nitrocellulose membranes. Equal loading and protein transfer were confirmed by staining with 0.2% ponceau S in 3% trichloroacetic acid. The membranes were blocked in 5% non-fat milk powder in 1XTTBS, incubated in mouse anti-APOE monoclonal antibody (1:500, BD Biosciences, Franklin Lakes, NJ, USA; #610449) diluted in 5% milk powder in 1XTTBS for 1 h at RT. The membranes were then washed four times in 1XTTBS, incubated with HRP conjugated secondary antibody (1:1000, DAKO, Glostrup, Denmark; #P0447) and washed four times in 1XTTBS. The membranes were incubated with ECL™ (Amersham Biosciences, Amersham, UK) for 1 min and then imaged and analyzed using the Kodak 440 CF imaging system (Kodak Scientific Imaging Systems, NewHaven, CT, USA).
To facilitate measurement of the target protein without the needing to measure reference proteins, the intra- and inter-assay variations for the measurement of APOE protein established for an internal standard according to well established protocols (Digney et al., 2005 ; Scarr et al., 2006a ,b ; Gibbons et al., 2008 ). Thirty micrograms of samples from an internal standard protein preparation derived from a subject independent of the cohort was loaded in repeat into 12 lanes per gel across two gels. The intra- and inter-assay variation of the western data was <10% and <15% respectively. The internal standard is sample was subsequently run in duplicate on every gel, exposing each gel for a time that allowed the optical density of the internal standard to fall within the range established from the mean optical density of the assay variance gels ±2 standard deviations. Data from all subjects were standardized by expressing the antibody’s signal intensity of each subject as a ratio of the signal intensity of the membrane’s internal standard.
RNA Extraction and Reverse Transcription of the Extract
Total RNA from was extracted from human post-mortem prefrontal cortex using a modification of the guanidine isothiocyanate–phenol method (Chomczynski and Sacchi, 1987 ) using Trizol reagent (Invitrogen, Carlsbad, CA, USA) as described previously (Gibbons et al., 2009 ). The concentration, purity and integrity of the samples were determined using both spectrophotometry (Biospec Mini, Shimadzu Corporation, Kyoto, Japan) and a Bioanalyzer(Agilent Technologies, Santa Clara, CA, USA). Two micrograms of each RNA extract was reverse transcribed with 100 U MMLV (Ambion, Austin, TX, USA) in 500 mM Tris-HCl, pH 8.3, 750 mM KCl, 30 mM MgCl2 50 mM DTT, 0.5 mM dNTP’s, 2.5 μM oligo dT primer, 2.5 μM random decamers and 1 U/μl SUPERase In RNase inhibitor (Ambion, Austin, TX, USA). The reaction was incubated at 37°C for 1 h followed by heat inactivation of the enzyme.
Quantitative Real-Time PCR
qPCR of the sample cDNA was performed using the iQ5 real-time PCR detection system (Bio-Rad Laboratories, Hercules CA, USA). Oligonucleotides were designed using Beacon Designer 7.00 software (Premier Biosoft, Palo Alto, CA, USA) and the sequences are outlined in Table 3 . The efficiencies of the oligonucleotides ranged between 96.3% and 103.3%. qPCR reaction mixtures (50 μL) contained 40 ng of reverse transcription product, 0.4 nM of complementary oligonucleotide pairs and 1X IQ SYBR green supermix (Bio-Rad Laboratories, Hercules, CA, USA). The PCR cycle parameters were 95°C for 3 min and 40 cycles of 95°C for 10 s, 60°C for 15 s and 68°C for 15 s. qPCR data was acquired using IQ5 optical system 2.0 software (Bio-Rad Laboratories, Hercules, CA, USA). All samples were run in triplicate and the expression of calculated from the log 2 of the average triplicate value corrected for primer efficiency. Expression was normalized against the geometric mean of GAPDH, PPIA and SNCA expression as previously described (Gibbons et al., 2009 ).
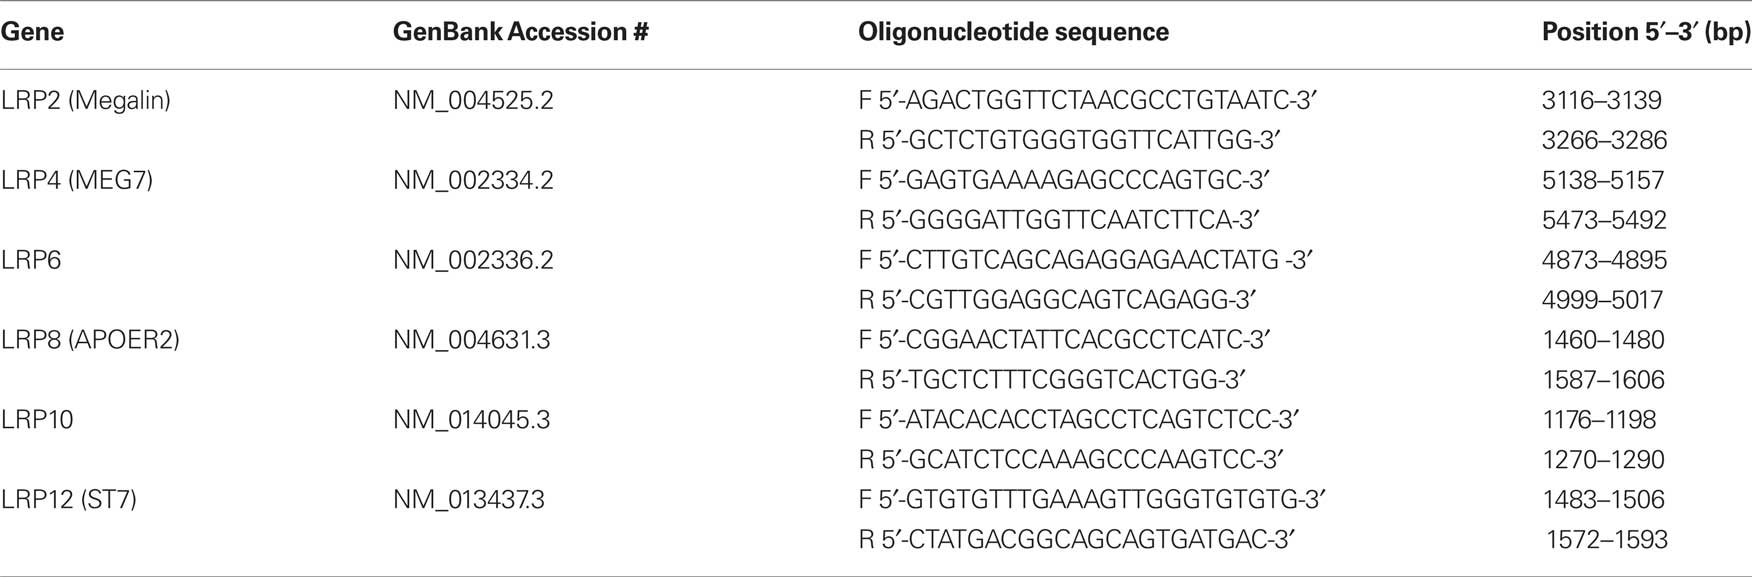
Table 3. A summary of the oligonucleotide primers used for real-time PCR analysis of LRP expression. Commonly used synonyms are provided in brackets.
Statistics
Grubbs test was used to identify outliers within the data and the data was subsequently analyzed by the D’Agostino and Pearson omnibus normality test to assess whether the data was normally distributed. Student’s t test was used to analyze the expression of the LRP genes. Statistical significance was accepted at P < 0.05. The relationship between demographic and tissue condition data were assessed using Pearson product moment correlation. R2 > 0.7 was considered to be a strong relationship (Gliner et al., 2002 ). Analyses were conducted using Prism 5.01 (Graphpad Software, La Jolla, CA, USA) and Minitab 13.01 (Minitab, State College, PA, USA) software.
Results
qPCR was not completed on one case (Case #28) because of a RIN of 3.5 which is indicative of poorly preserved mRNA. Examining each data set for outliers, the expression of LRP6 in Case #8, LRP8 in Case #29 and LRP 10 in Case #14 were identified as significant outliers (Z = 2.54; P < 0.05). These data points were, therefore, excluded from further analysis.
All data sets except the LRP6 (K2 = 9.19; P = 0.01) measurements in controls followed a Gaussian distribution (5.009 < K2 < 0.08; 0.96 < P < 0.08). Therefore, LRP6 data was analyzed using non-parametric statistics while all other data was analyzed using parametric statistics. As we could not assume a relationship between the expression of the genes examined, Student’s t test or Mann–Whitney’s U test was used to analyze the expression of the LRP genes. Statistical significance was accepted at P < 0.05. Confirming this assumption, multiple Pearson product moment correlation analysis failed to show a strong relationship between the expression levels of the individual genes against the other genes examined (LRP2: df = 5; R2 < 0.01; 0.60 > P > 0.55; LRP4: df = 5; 0.09 > R2 > 0.01; 0.71 > P > 0.38; LRP6: df = 5; 0.13 > R2 > 0.01; 0.69 > P > 0.34; LRP8: df = 5; 0.14 > R2 > 0.11; 0.37 > P > 0.33; LRP10: df = 5; 0.57 > R2 > 0.46; 0.08 > P > 0.05; LRP12: df = 5; 0.27 > R2 > 0.08; 0.47 > P > 0.22).
Western Blot Analysis
APOE protein expression was measured using western blotting. The predicted immunogenic band at 36 kDa was detected by the anti-APOE antibody in each sample (Figure 1 A). Levels of APOE were significantly increased in subjects with SDS compared to controls (U = 51.00; P = 0.01) (Figure 1 B).
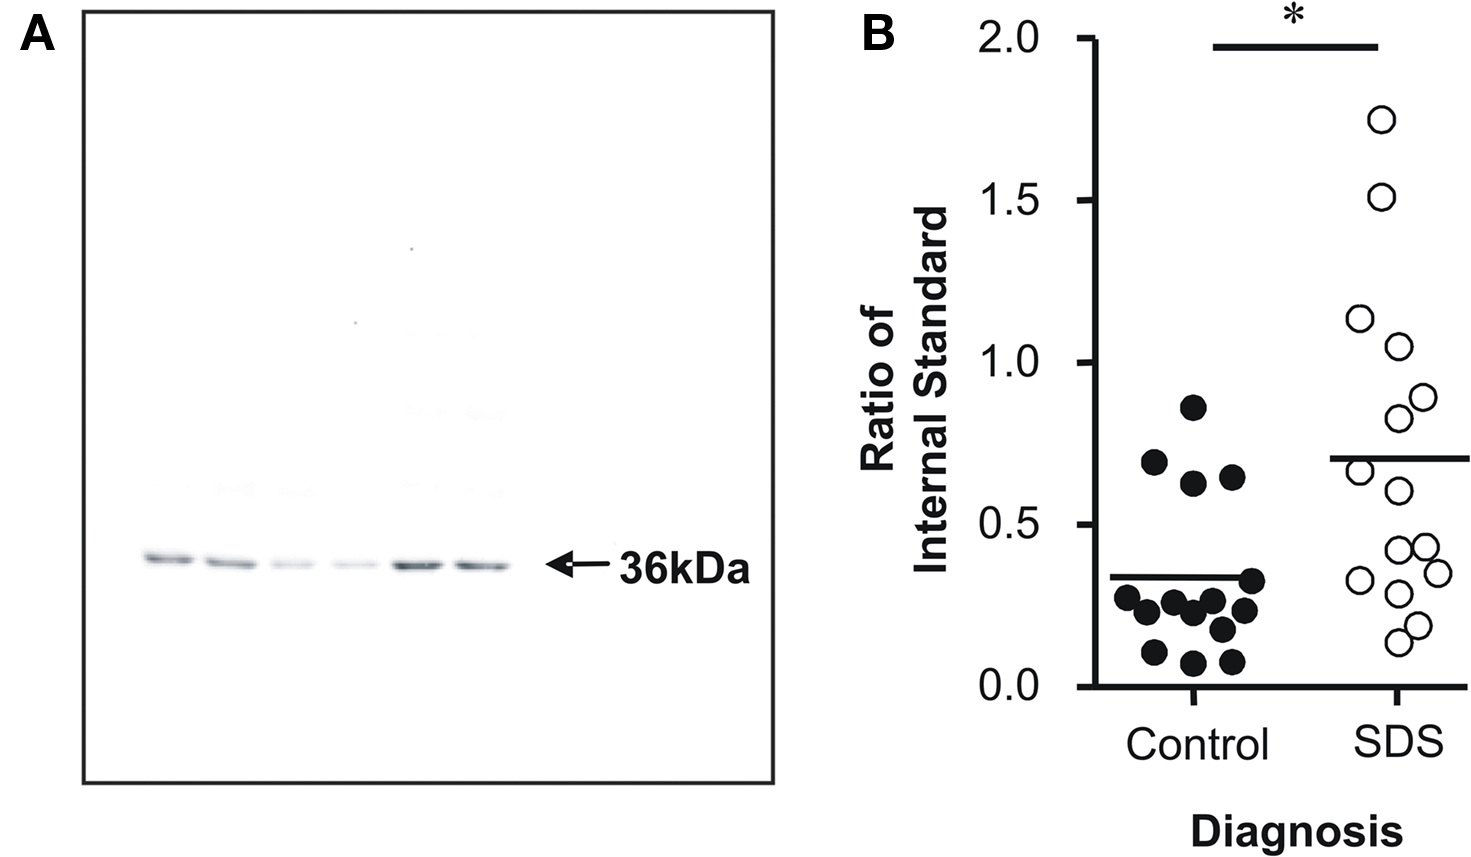
Figure 1. Western analysis of APOE protein expression in subjects with short duration of illness schizophrenia (SDS) was performed on a 36-kDa immunogenic band, which corresponded to the predicted size of APOE (A). The level of APOE protein expression was increased Brodmann’s area 46 from subjects with SDS compared to controls (B). Values are expressed as ratios of APOE expression in an independent BA9 protein extract (internal standard) * P < 0.05.
qPCR Analysis
Although measuring LRP protein levels, as the functional gene product, would have been ideal, we were unable to obtain reliable antibodies against the LRPs to measure protein expression. Therefore, we measured LRP mRNA expression instead using qPCR. Only LRP’s that were highlighted as potentially altered in initial microarray screen were examined. LRP10 mRNA levels were increased in subjects with SDS compared to controls (t = 1.91; df = 26; P = 0.03) (Figure 2 A). Conversely, there was a decrease in LRP12 mRNA levels in subjects with SDS compared to controls (t = 3.17; df = 27; P < 0.01) (Figure 2 B). Levels of mRNA for all other LRPs did not vary significantly with diagnosis: LRP2 (t = 1.42; df = 27; P = 0.08) (Figure 2 C), LRP4 (t = 0.78; df = 27; P = 0.22) (Figure 2 D), LRP6 (U = 81.00; P = 0.22) (Figure 2 E) and LRP8 (t = 0.19; df = 26; P = 0.42) (Figure 2 F). As there was a trend towards a significant decrease in LRP2 mRNA in SDS we completed a power analysis of these data which showed that the data would become significant with cohort sizes of n = 19. Due to a limited availability of tissue from subjects with SDS, we were unable to expand the size of this cohort to the n = 20 cohort sizes normally used by our group. However, this analysis suggests that, with such cohorts, we would have detected a significant decrease in LRP2 mRNA in SDS.
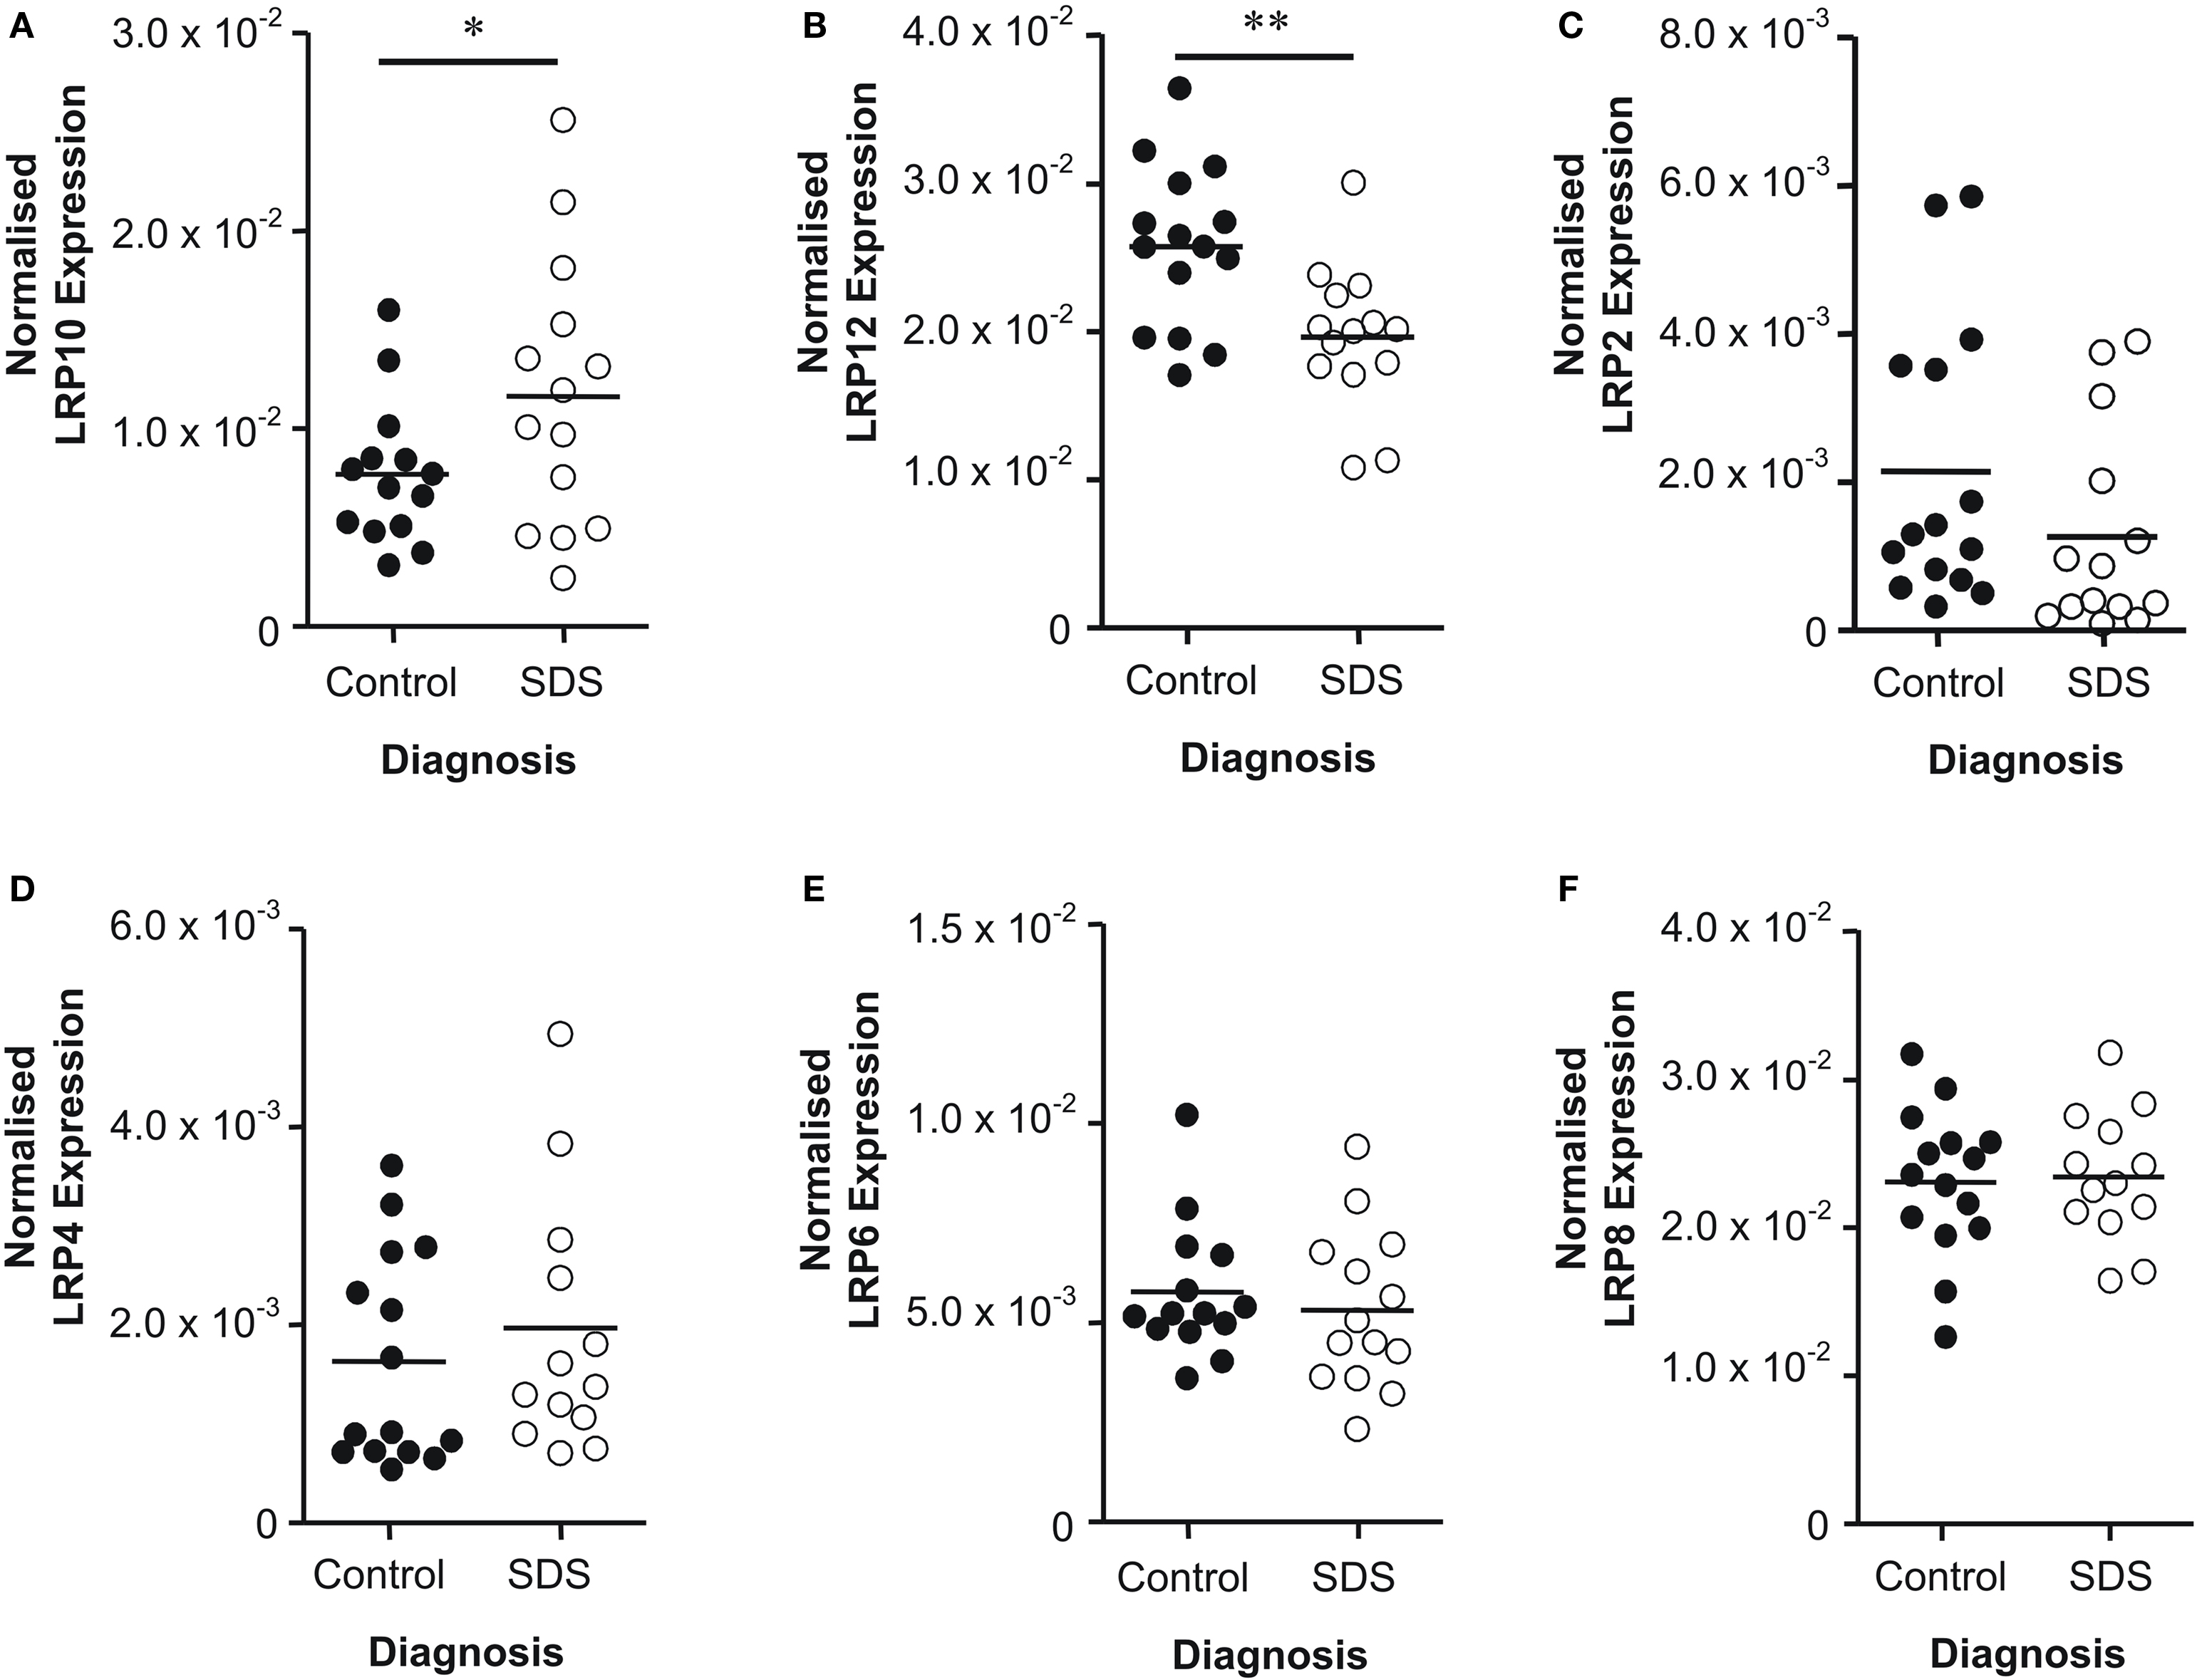
Figure 2. Levels of (A) LRP10, (B) LRP12, (C) LRP2, (D) LRP4, (E) LRP6 and (F) LRP8 mRNA expression in Brodmann’s area 46 from subjects with short duration of illness schizophrenia (SDS) and controls. LRP expression data is expressed as a ratio of the geometric mean of PPIA, SNCA and GAPDH expression. * P < 0.05; ** P < 0.01.
Potential Confounding Factors
In our previous microarray study, the SDS group was defined as having a duration of illness of <4 years. In order to expand the size of the cohort in this study, the duration of illness of the SDS group was expanded to include subjects with a duration of illness <7 years. To determine whether expanding the definition of SDS impacted the data Pearson product moment correlation was used to assess the relationship between duration of illness and expression. There was no strong relationship between duration of illness (0.22 > R2 > 1.42 × 10⁻³; 0.90 > P > 0.13) and expression in any dataset. Tissue quality markers such as PMI, CNS pH and RIN can potentially reflect poor integrity of the protein and RNA. We found no significant difference in pH (t = 0.17; df = 28; P = 0.87), PMI (t = 0.44; df = 28; P = 0.67) or RIN (t = 0.54; df = 28; P = 0.60) between diagnostic groups the integrity of our tissue is not likely to impact our data. Demographic factors that could potentially reflect environmental heterogeneity of the samples were also examined. There was no significant difference in gender (df = 1; P = 1.00) or age (U = 104.50; P = 0.75) between diagnostic groups. The incidence of suicide was increased in subjects with schizophrenia (df = 1; P < 0.01) compared to controls, however, there was no strong correlation between the incidence of suicide and the expression levels suggesting the incidence of suicide was unlikely to impact our data (df = 12; 0.18 > R2 > 1.29 × 10⁻⁴; 0.97 > P > 0.35).
As antipsychotic drug use has been associated with altered lipid metabolism (Bustillo et al., 1996 ; de Leon et al., 2007 ). Therefore, it was necessary to determine whether the past drug history of our subjects impacted our data. While all subjects in the schizophrenia group had been prescribed antipsychotic medication, two subjects had also been prescribed atypical antipsychotic medication (clozapine and risperidone). Data from these subjects did not represent unusually high or low values compared to the rest of the cohort and removing these subjects from analysis did no alter the level of significant difference in any dataset. There was no strong relationship between antipsychotic drug use expression in any other dataset (0.47 > R2 > 8.21 × 10⁻³; 0.76 > P > 0.01).
When the distribution of the expression data was visually examined, there appeared to be discrete clusters of data points within the control data sets for APOE (Figure 1 ), LRP2 (Figure 2 C) and LRP4 (Figure 2 D) that were separated from the main population of subjects. Neither the confounding factors examined nor the experimental bias could account for these clusters. Therefore, the observed distribution is likely to reflect the normal heterogeneity of expression levels for these genes.
Discussion
Our finding of increased APOE protein expression in BA46 in subjects with SDS adds to previous findings of increased APOE protein expression associated with schizophrenia in BA46 and BA9 (Dean et al., 2003 ; Digney et al., 2005 ). In our previous microarray study, we did not detect altered levels of APOE mRNA expression in SDS a subset (n = 8) of subjects used in this study (Narayan et al., 2008 ). Thus, the greater number of subjects used in this study may increase our power to detect a change in expression, or the increase in APOE protein measured in this study may be caused by changes in either post-transcriptional regulation of expression or the rate of degradation of the APOE protein.
Our study is novel in that we have also studied a family of receptors, some of which are used by APOE for signaling. These investigations have shown that mRNA for LRP10 is increased and mRNA for LRP12 is decreased in SDS, which is in agreement with our microarray data (Narayan et al., 2008 ). There is also a trend towards decrease in LRP2 mRNA in SDS which again reproduces findings on the gene using microarrays (Narayan et al., 2008 ).
At present little is known about the role of some LRPs in the CNS, however, it is possible be that the decrease in LRP10 expression is a normal physiological response to increased levels of APOE in the CNS of individuals with SDS. However, the fact that we have shown altered levels of expression of LRP10 and LRP12 expression in the dorsolateral cortex of subjects with schizophrenia would add weight to the argument that lipoprotein signaling is altered in SDS. The ligands that activate LRP10 and LRP12 have not yet been fully characterized. It is known that APOE-enriched VLDL signals through LRP10 (Sugiyama et al., 2000 ) again adding support for APOE signaling being disrupted in SDS. Moreover, there are strong structural homologies between LRP10 and LRP12 (Sugiyama et al., 2000 ), suggesting that both proteins will act as APOE receptors and, therefore, it would not be unreasonable to suggest that the changes we observed in LRP12 are a further indication of abnormal APOE signaling in the CNS of subjects with schizophrenia. It is, however, notable that LRP8, which is well established as a major receptor for APOE, was not altered in SDS. Similarly, there was no evidence from our original microarray study that another major APOE receptor, LRP1, was altered in SDS (Narayan et al., 2008 ). Both LRP1 and LRP8 bind to a number of other ligands in addition to APOE (May et al., 2005 ). Therefore, the expression of these LRPs may be less likely to be affected by altered expression of a single ligand, such as APOE.
We did not find changes in LRP4, LRP6 and LRP8 mRNA expression associated with SDS. This contrasts the finding of decreased LRP4 mRNA levels from our microarray study (Narayan et al., 2008 ). These differences may have resulted from an increase in heterogeneity in our cohort that was introduced when expanding the sample size of the original SDS cohort. However, we found no association between duration of illness and expression levels to suggest that this was the case. It has been recognized that there may be poor correlation between microarray and qPCR data, particularly where the changes gene expression are small in magnitude (Morey et al., 2006 ). Real-time PCR analysis is a more sensitive method for detected gene expression differences, hence, we would conclude that expression levels of LRP4, LRP6 and LRP8 are not altered in BA46 of subjects with SDS.
The observed increase in APOE and LRP10 expression coupled with a decrease in LRP12 expression are suggestive of a potential deregulation of lipid metabolism associated with SDS, a finding highlighted in a number of other microarray studies (Mimmack et al., 2002 ; Tkachev et al., 2007 ; Narayan et al., 2009 ). Importantly, our data would suggest such changes are particularly apparent early in the disease process. Significantly, dyslipidemia is a commonly encountered side effect of antipsychotic therapy (Patel et al., 2009 ) and, thus, our findings could be related to antipsychotic drug effects. All subjects with SDS used in this study had been treated with a milieu of antipsychotic drugs prior to death. Furthermore, antipsychotic drugs have been shown to increase APOE expression in cultured glial cells in a dose dependant manner (Vik-Mo et al., 2009 ). However, the fact that we found no strong relationship between antipsychotic drug dose and either APOE or LRP expression would suggest that the changes we have observed are unlikely to be caused by drug treatment. Furthermore, while two of the subjects with SDS used in this study were prescribed atypical antipsychotics, which are normally associated with a greater incidence of dyslipidemia (Bustillo et al., 1996 ; de Leon et al., 2007 ), neither subject showed abnormally high or low levels of APOE and LRP expression compared with subjects who had received typical antipsychotic drug treatment. This contrasts in vitro studies which show that clozapine induces considerably greater increase in APOE gene expression than haloperidol. This raises the possibility that abnormalities in lipid metabolism may be present in the CNS of subjects with schizophrenia early in the progression of the disorder and that these changes may be made worse by atypical antipsychotic drug treatment. The observation in our previous microarray study that altered LRP expression is associated with the period following diagnosis and is not maintained throughout the progression of the disorder would support the notion that altered LRP expression reflects a predisposition to metabolic dysfunction (Narayan et al., 2009 ). By contrast, an exacerbation of altered LRP expression in response to antipsychotic medication might be expected in response to the prolonged drug treatment in LDS. Given the well established link between peripheral metabolic problems and treatment with some antipsychotic drugs (Mackin et al., 2005 ), this phenomenon would warrant further investigation.
We were unable to ascertain the racial background or APOE genotypes of the subjects used in this study. Evidence surrounding the role of the major APOE polymorphisms in the pathology of schizophrenia is inconclusive (Harrington et al., 1995 ; Chen et al., 1999 ; Durany et al., 2000 ). Furthermore, we have previously reported that increased APOE expression in BA9 is not associated with APOE genotype (Dean et al., 2003 ), suggesting our data is unlikely to be impacted by the genotypes of our subjects. Our study was also limited by the inability to obtain substance abuse histories of for our subjects and we cannot exclude the influence of drug abuse on our data set.
Our study adds to other studies that have implicated altered lipid metabolism and apolipoprotein signaling in the pathology of schizophrenia (Thomas et al., 2001 ; Dean et al., 2003 ). Moreover, we have demonstrated these changes in lipid metabolism within the dorsolateral prefrontal cortex, which has well established roles in cognition (Levy and Goldman-Rakic, 1999 ; Perlstein et al., 2001 ; Yoon et al., 2008 ). Procedural cognitive deficits in schizophrenia have been shown to predict the capacity for non-verbal social functioning (Kawakubo et al., 2006 ). It is, therefore, significant that analogous procedural cognitive deficits are displayed by APOE−/− mice (Champagne et al., 2002 ). Furthermore, dietary challenged APOE−/− mice show deficits in spatial learning deficits (Troen et al., 2006 ). These latter data, alongside our findings, may indicate that changes in lipid metabolism in the dorsolateral prefrontal cortex of subjects with SDS could be associated with the genesis of the cognitive deficits displayed by most subjects with schizophrenia (Berman and Weinberger, 1990 ).
Financial Disclosure
The study was supported by Operational Infrastructure Support (OIS) from the Victorian State Government and by the funding grants; NIH RO1 MH069696-01 and NHMRC project grant 3503441. Brian Dean is a NHMRC Senior Research Follow (400016). Elizabeth Scarr is a Royce Abbey Postdoctoral Fellow (Australian Rotary Health Research Fund).
Conflict of Interest Statement
The authors declare that the research was conducted in the absence of any commercial or financial relationships that could be construed as a potential conflict of interest.
Acknowledgments
The authors gratefully acknowledge the assistance of Geoffrey Pavey for the preparation of post-mortem tissue and David Copolov, Christine Hill, Nicholas Keks and Kenneth Opeskin for their roles in tissue collection and diagnostic confirmation.
References
American Psychiatric Association. (1994). Diagnostic and Statistical Manual of Mental Disorders. Washington, DC: American Psychiatric Press.
Beisiegel, U., Weber, W., Ihrke, G., Herz, J., and Stanley, K. K. (1989). The LDL receptor related protein, LRP, is an apolipoprotein E-binding protein. Nature 341, 162–164.
Bell, R. D., Sagare, A. P., Friedman, A. E., Bedi, G. S., Holtzman, D. M., Deane, R., and Zlokovic, B. V. (2007). Transport pathways for clearance of human Alzheimer’s amyloid beta-peptide and apolipoproteins E and J in the mouse central nervous system. J. Cereb. Blood Flow Metab. 27, 909–918.
Berman, K. F., and Weinberger, D. R. (1990). The prefrontal cortex in schizophrenia and other neuropsychiatric diseases – in vivo physiological correlates of cognitive deficits. Prog. Brain Res. 85, 521–537.
Bustillo, J. R., Buchanan, R. W., Irish, D., and Breier, A. (1996). Differential effect of clozapine on weight: a controlled study. Am. J. Psychiatry 153, 817–819.
Champagne, D., Dupuy, J. B., Rochford, J., and Poirier, J. (2002). Apolipoprotein E knockout mice display procedural deficits in the Morris water maze: Analysis of learning strategies in three versions of the task. Neuroscience 114, 641–654.
Chen, J. Y., Hong, C. J., Chiu, H. J., Lin, C. Y., Bai, Y. M., Song, H. L., Lai, H. C., and Tsai, S. J. (1999). Apolipoprotein E genotype and schizophrenia. Neuropsychobiology 39, 141–143.
Chomczynski, P., and Sacchi, N. (1987). Single-step method of RNA isolation by acid guanidinium thiocyanate–phenol–chloroform extraction. Analytical Biochemistry. 162: 156–159.
de Leon, J., Diaz, F. J., Josiassen, R. C., Cooper, T. B., and Simpson, G. M. (2007). Weight gain during a double-blind multidosage clozapine study. J. Clin. Psychopharmacol. 27, 22–27.
Dean, B., Digney, A., Sundram, S., Thomas, E., and Scarr, E. (2008). Plasma apolipoprotein E is decreased in schizophrenia spectrum and bipolar disorder. Psychiatry Res 158, 75–78.
Dean, B., Laws, S. M., Hone, E., Taddei, K., Scarr, E., Thomas, E. A., Harper, C., McClean, C., Masters, C., Lautenschlager, N., Gandy, S. E., and Martins, R. N. (2003). Increased levels of apolipoprotein E in the frontal cortex of subjects with schizophrenia. Biol. Psychiatry 54, 616–622.
Digney, A., Keriakous, D., Scarr, E., Thomas, E., and Dean, B. (2005). Differential changes in apolipoprotein E in schizophrenia and bipolar I disorder. Biol. Psychiatry 57, 711–715.
Durany, N., Riederer, P., and Cruz-Sanchez, F. F. (2000). Apolipoprotein E genotype in Spanish schizophrenic patients. Psychiatr. Genet. 10, 73–77.
Gibbons, A. S., Scarr, E., McOmish, C. E., Hannan, A. J., Thomas, E. A., and Dean, B. (2008). Regulator of G-protein signalling 4 expression is not altered in the prefrontal cortex in schizophrenia. Aust. N. Z. J. Psychiatry 42, 740–745.
Gibbons, A. S., Thomas, E. A., and Dean, B. (2009). Regional and duration of illness differences in the alteration of NCAM-180 mRNA expression within the cortex of subjects with schizophrenia. Schizophr. Res. 112, 65–71.
Gliner, J. A., Morgan, G. A., and Harmon, R. J. (2002). Basic associated designs: analysis and interpretation. J. Am. Acad. Child Adolesc. Psychiatry 41, 1256–1258.
Harrington, C. R., Roth, M., Xuereb, J. H., McKenna, P. J., and Wischik, C. M. (1995). Apolipoprotein E type epsilon4 allele frequency is increased in patients with schizophrenia. Neurosci. Lett. 202, 101–104.
Hoe, H. S., Pocivavsek, A., Chakraborty, G., Fu, Z. Y., Vicini, S., Ehlers, M. D., and Rebeck, G. W. (2006). Apolipoprotein E receptor 2 interactions with the N-methyl-D-aspartate receptor. J. Biol. Chem. 281, 3425–3431.
Kawakubo, Y., Rogers, M. A., and Kasai, K. (2006). Procedural memory predicts social skills in persons with schizophrenia. J. Nerv. Ment. Dis. 194, 625–627.
Keks, N., Hill, C., Opeskin, K., Copolov, D. L., and Dean, B. (1999). “Psychiatric diagnosis after death: the problems of accurate diagnosis,” in Using CNS Tissue in Psychiatry Research: a Practical Guide, eds B. Dean, T M. Hyde, J E. Klienman (Sydney: J. Gordon & Breach Science Publishers), 19–37.
Kingsbury, A. E., Foster, O. J., Nisbet, A. P., Cairns, N., Bray, L., Eve, D. J., Lees, A. J., and Marsden, C. D. (1995). Tissue pH as an indicator of mRNA preservation in human post-mortem brain. Brain Res. Mol. Brain Res. 28, 311–318.
Lee, M. K., Park, A. J., Nam, B. Y., Min, K. J., Kee, B. S., and Park, D. B. (2001). Apolipoprotein E genotype in Korean schizophrenic patients. J. Korean Med. Sci. 16, 781–783.
Levy, R., and Goldman-Rakic, P. S. (1999). Association of storage and processing functions in the dorsolateral prefrontal cortex of the nonhuman primate. J. Neurosci. 19, 5149–5158.
Mackin, P., Watkinson, H. M., and Young, A. H. (2005). Prevalence of obesity, glucose homeostasis disorders and metabolic syndrome in psychiatric patients taking typical or atypical antipsychotic drugs: a cross-sectional study. Diabetologia 48, 215–221.
Martinoli, M. G., Trojanowski, J. Q., Schmidt, M. L., Arnold, S. E., Fujiwara, T. M., Lee, V. M. Y., Hurtig, H., Julien, J. P., and Clark, C. (1995). Association of apolipoprotein epsilon-4 allele and neuropathologic findings in patients with dementia. Acta Neuropathol. 90, 239–243.
May, P., and Herz, J. (2003). LDL receptor-related proteins in neurodevelopment. Traffic 4, 291–301.
May, P., Herz, J., and Bock, H. H. (2005). Molecular mechanisms of lipoprotein receptor signalling. Cell. Mol. Life Sci. 62, 2325–2338.
Mimmack, M. L., Ryan, M., Baba, H., Navarro-Ruiz, J., Iritani, S., Faull, R. L. M., McKenna, P. J., Jones, P. B., Arai, H., Starkey, M., Emson, P. C., and Bahn, S. (2002). Gene expression analysis in schizophrenia: Reproducible up-regulation of several members of the apolipoprotein L family located in a high-susceptibility locus for schizophrenia on chromosome 22. Proc. Natl. Acad. Sci. U.S.A. 99, 4680–4685.
Morey, J. S., Ryan, J. C., and Van Dolah, F. M. (2006). Microarray validation: factors influencing correlation between oligonucleotide microarrays and real-time PCR. Biol. Proced. Online 175–193.
Narayan, S., Head, S. R., Gilmartin, T. J., Dean, B., and Thomas, E. A. (2009). Evidence for Disruption of Sphingolipid Metabolism in Schizophrenia. J. Neurosci. Res. 87, 278–288.
Narayan, S., Tang, B., Head, S. R., Gilmartin, T. J., Sutcliffe, J. G., Dean, B., and Thomas, E. A. (2008). Molecular profiles of schizophrenia in the CNS at different stages of illness. Brain Res. 1239, 235–248.
Patel, J. K., Buckley, P. F., Woolson, S., Hamer, R. M., McEvoy, J. P., Perkins, D. O., Lieberman, J. A., and Investigators, C. (2009). Metabolic profiles of second-generation antipsychotics in early psychosis: Findings from the CAFE study. Schizophr. Res. 111, 9–16.
Perlstein, W. M., Carter, C. S., Noll, D. C., and Cohen, J. D. (2001). Relation of prefrontal cortex dysfunction to working memory and symptoms in schizophrenia. Am. J. Psychiatry 158, 1105–1113.
Scarr, E., Gray, L., Keriakous, D., Robinson, P. J., and Dean, B. (2006a). Increased levels of SNAP-25 and synaptophysin in the dorsolateral prefrontal cortex in bipolar I disorder. Bipolar Disord 8, 133–143.
Scarr, E., Keriakous, D., Crossland, N., and Dean, B. (2006b). No change in cortical muscarinic M2, M3 receptors or [35S]GTP[gamma]S binding in schizophrenia. Life Sci. 78, 1231–1237.
Sugiyama, T., Kumagai, H., Morikawa, Y., Wada, Y., Sugiyama, A., Yasuda, K., Yokoi, N., Tamura, S., Kojima, T., Nosaka, T., Senba, E., Kimura, S., Kadowaki, T., Kodama, T., and Kitamura, T. (2000). A novel low-density lipoprotein receptor-related protein mediating cellular uptake of apolipoprotein E-enriched beta-VLDL in vitro. Biochemistry 39, 15817–15825.
Tamai, K., Semenov, M., Kato, Y., Spokony, R., Liu, C. M., Katsuyama, Y., Hess, F., Saint-Jeannet, J. P., and He, X. (2000). LDL-receptor-related proteins in Wnt signal transduction. Nature 407, 530–535.
Thibaut, F., Coron, B., Hannequin, D., Segard, L., Martin, C., Dollfus, S., Campion, D., Frebourg, T., and Petit, M. (1998). No association of apolipoprotein epsilon 4 allele with schizophrenia even in cognitively impaired patients. Schizophr. Res. 30, 149–153.
Thomas, E. A., Dean, B., Pavey, G., and Sutcliffe, J. G. (2001). Increased CNS levels of apolipoprotein D in schizophrenic and bipolar subjects: Implications for the pathophysiology of psychiatric disorders. Proc. Natl. Acad. Sci. U.S.A. 98, 4066–4071.
Tkachev, D., Mimmack, M. L., Huffaker, S. J., Ryan, M., and Bahn, S. (2007). Further evidence for altered myelin biosynthesis and glutamatergic dysfunction in schizophrenia. Int. J. Neuropsychopharmacol. 10, 557–563.
Troen, A. M., Shukitt-Hale, B., Chao, W. H., Albuquerque, B., Smith, D. E., Selhub, J., and Rosenberg, I. H. (2006). The cognitive impact of nutritional homocysteinemia in Apolipoprotein-E deficient mice. J. Alzheimers Dis. 9, 381–392.
Vik-Mo, A. O., Ferno, J., Skrede, S., and Steen, V. M. (2009). Psychotropic drugs up-regulate the expression of cholesterol transport proteins including ApoE in cultured human CNS- and liver cells. BMC Pharmacol. 9, 10.
Yoon, J. H., Minzenberg, M. J., Ursu, S., Walters, R., Wendelken, C., Ragland, J. D., and Carter, C. S. (2008). Association of dorsolateral prefrontal cortex dysfunction with disrupted coordinated brain activity in schizophrenia: relationship with impaired cognition, behavioral disorganization, and global function. Am. J. Psychiatry 165, 1006–1014.
Keywords: schizophrenia, low density lipoprotein receptor-related proteins, apolipoprotein E, prefrontal cortex, Brodmann’s area 46
Citation: Gibbons AS, Thomas EA, Scarr E and Dean B (2010) Low density lipoprotein receptor-related protein and apolipoprotein E expression is altered in schizophrenia. Front. Psychiatry 1:19. doi: 10.3389/fpsyt.2010.00019
This article was submitted to Frontiers in Molecular Psychiatry, a specialty of Frontiers in Psychiatry.
Received: 31 March 2010;
Paper pending published: 20 April 2010;
Accepted: 11 June 2010;
Published online: 08 July 2010
Edited by:
Ming D. Li, University of Virginia, USAReviewed by:
Xiangning Chen, Virginia Commonwealth University, USAJu Wang, University of Virginia, USA
Copyright: © 2010 Gibbons, Thomas, Scarr and Dean. This is an open-access article subject to an exclusive license agreement between the authors and the Frontiers Research Foundation, which permits unrestricted use, distribution, and reproduction in any medium, provided the original authors and source are credited.
*Correspondence: Andrew Stuart Gibbons, The Rebecca L. Cooper Research Laboratories, The Mental Health Research Institute of Victoria, 155 Oak Street, Parkville, VIC 3052, Australia. e-mail: a.gibbons@mhri.edu.au