
- 1Department of Plant Pathology, University of Kentucky, Lexington, KY, USA
- 2Department of Statistics, University of Kentucky, Lexington, KY, USA
Although exchange of genetic information by recombination plays an important role in the evolution of viruses, it is not clear how it generates diversity. Understanding recombination events helps with the study of the evolution of new virus strains or new viruses. Geminiviruses are plant viruses which have ambisense single-stranded circular DNA genomes and are one of the most economically important plant viruses in agricultural production. Small circular single-stranded DNA satellites, termed DNA-β, have recently been found to be associated with some geminivirus infections. In this paper we analyze several DNA-β sequences of geminiviruses for recombination events using phylogenetic and statistical analysis and we find that one strain from ToLCMaB has a recombination pattern and is a recombinant molecule between two strains from two species, PaLCuB-[IN:Chi:05] (major parent) and ToLCB-[IN:CP:04] (minor parent). We propose that this recombination event contributed to the evolution of the strain of ToLCMaB in South India. The Hidden Markov Chain (HMM) method developed by Webb et al. (2009) estimating phylogenetic tree through out the whole alignment provide us a recombination history of these DNA-β strains. It is the first time that this statistic method has been used on DNA-β recombination study and give a clear recombination history of DNA-β recombination.
Introduction
Geminiviruses are emerging as one of the most economically important plant viruses in agricultural production (Abou-Jawdah et al., 2006; Briddon et al., 2008; Zhou et al., 2008). Begomovirus is the largest genus of the family of Geminiviridae and is phylogenetically and geographically divided into two groups; the Old World viruses and the New World viruses. The new world begomovirus consists of two viral genomes, DNA-A and DNA-B, while most of the Old World begomovirus just has one partite DNA-A (Briddon et al., 2008). About a decade ago, a satellite molecule called DNA-β was found to associate with some of the old world geminivirus (Saunders et al., 2000; Briddon et al., 2001).
DNA-β has a genome approximately 1.3–1.5 kb long, and depends on the helper virus DNA-A for its replication, movement, and transmission (Saunders et al., 2000; Briddon et al., 2001; Cui et al., 2004). It is grouped into sub-viral agents by the International Committee on Taxonomy of Viruses (ICTV). The most typical plant symptoms caused by geminivirus are due to an association of DNA-β with DNA-A, whereas DNA-A alone does not lead to severe damage to crops (Cui et al., 2004; Briddon et al., 2008). C1 gene encoded by DNA-β were found to suppress host defense systems (Cui et al., 2005) and modulate host development (Yang et al., 2008), and was believed to be one of the determining factors for geminivirus-induced disease symptom development (Briddon et al., 2008).
DNA-β has not been found in the New World (North American and South American continents) and is believed to be associated with Old World begomoviruses after the geographical divergence of “Old” and “New” continents (Mansoor et al., 2003b). Although DNA-β has relatively a large range of its selection on different species of the helper virus DNA-A (Mansoor et al., 2003a), it is proposed to co-evolve with the DNA-A component (Briddon et al., 2008).
Recombination plays an important role in geminivirus (Lefeuvre et al., 2009) and DNA-β evolution (Amin et al., 2006; Lefeuvre et al., 2007). A fragment of DNA-β genome infecting tomato was reported to migrate to cotton via recombination with other adaptive DNA-β molecules (Amin et al., 2006), indicating the role of a recombination event in evolution of DNA-β molecules.
Because of the important role of recombination in DNA-β evolution, analysis on recombination events of DNA-β becomes specially important for understanding this viral evolution and disease epidemic as well as development of potential control strategies.
In this paper, we apply a statistical phylogenetic analysis using a Bayesian stochastic method to infer changes in phylogeny along multiple sequence alignments while accounting for rate heterogeneity developed by Webb et al. (2009) to estimate potential recombination spots of DNA-β. It is the first time that this statistic method has been used on DNA-β recombination study and give a clear recombination history of DNA-β recombination. In order to confirm our results, we also apply a statistical phylogenetic method developed by Martin et al. (2005b) to the same data sets. We find that the results with the method in Webb et al. (2009) and with the method in Martin et al. (2005b) are very similar to each other. One strain of Tomato leaf curl Maharashtra betasatellite (ToLCMaB) has a recombination pattern and is possibly recombinant molecule between two strains from two distinct species, Papaya leaf curl betasatellite (PaLCuB) and Tomato leaf curl betasatellite (ToLCB), PaLCuB-[IN:Chi:05] (major parent) and ToLCB-[IN:CP:04] (minor parent). This recombination event may contribute to the evolution of Tomato leaf curl Maharashtra betasatellite.
Data Set
A proposed taxonomy of DNA-β using 78% nucleotide sequence identity as demarcation threshold was accepted and widely used for distinguishing species from strains of DNA-β (Briddon et al., 2008). This resulted in about 51 distinct species of DNA-β associated with begomoviruses.
Tomato leaf curl disease (ToLCD) is caused by begomoviruses associated with betasatellites. A recent report showed that different species of DNA-β associated with ToLCD in India are geographically isolated and distributed (Sivalingam et al., 2010). The DNA-β molecules in southern and central India are more closely related to each other than those in northern India.
To observe potential recombination events among these geographically related DNA-β species, we chose four strains from four distinct species of DNA-β associated with ToLCD in India. Among the four strains, ToLCBDB-[IN;Luk;05] (taxon-0) and ToLCB-[PK;RYK;97] (taxon-1) are from northern India, while PaLCuB-[IN;Chi;05] (taxon-2) and ToLCMaB-[IN;Pun;04] (taxon-3) are from southern India. In the same report as well as another report (Mazhar et al., 2009), species of ToLCBDB and ToLCB are closely related in phylogenetic tree, while PaLCuB and ToLCMaB are sisters (neighbors).
Another ToLCD associated DNA-β from Indonesia (taxon-4) was chosen as an out group. Other five species of non-ToLCD related DNA-β from eastern Asia and southeastern Asia (taxa-5, 6, 7, 8, and 9) were also chosen for the out group. See Table 1 for details.
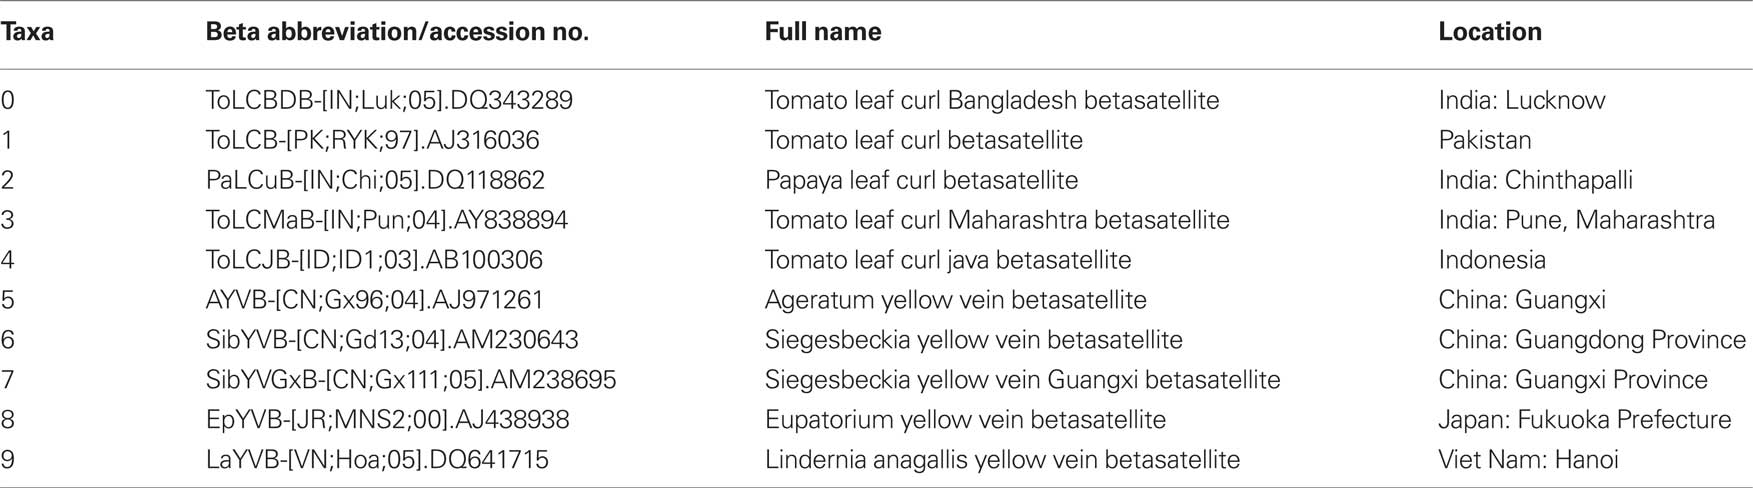
Table 1. Sequence information of 10 species used in this study.
Materials and Methods
First, a data set of 10 DNA-β genome sequences in fasta format was aligned using clustalw-multialign software with the following parameters: (Gap opening penalty 10.0, gap extension penalty 0.2, gap separation penalty range 8, DNA weight matrix: IUB) (Thompson et al., 1994).
To analyze recombination for DNA-β from geminiviruses, we used the software package from Webb et al. (2009). In this method they applied a hidden Markov model (HMM) to infer changes in phylogeny along multiple sequence alignments while accounting for rate heterogeneity. Under the HMM, the hidden states are all possible unrooted tree topologies with the number of leaves n fixed along each site. The observed state space is {A, C, G, T, −}. Under the evolutionary model, the evolution of homologous DNA/RNA sequences (or protein-coding sequences where the state space is of size 61) can be described by continuous time Markov chains on a phylogenetic tree. A continuous time Markov chain is characterized by a substitution rate matrix, and the phylogenetic tree summarizes the relationships between the species in terms of edge lengths (times since divergence) and common ancestors. The DNA sequences are only observed in the leaves, and information on the phylogenetic tree, substitution events (time and type) and edge lengths is missing. The transition matrix P(t) for a continuous time Markov process can be written as exp(Qt), where Q is a parametrized substitution rate matrix which determines the Markov process. In this method the evolutionary model was set as Hasegawa–Kishino–Yano (HKY) model (Hasegawa et al., 1985).
The rate matrix Q under HKY model is written as the following: Let Σ = {A, C, G, T} and let πa, a ∈ Σ, Σa πa = 1, denote the stationary distribution of the Markov chain. This distribution can be estimated from the nucleotide frequencies in a single sequence. HKY model has substitution rate matrix:
where the diagonal elements are such that each row sums to 0 and the two unknown parameters are α and β. The software from Webb et al. (2009) estimates the posterior distribution using Monte Carlo Markov Chain (MCMC) method under the HMM and then it outputs each tree topology with its posterior probability along each site (see Webb et al., 2009 for details).
We have used HKY model for phylogenetic analysis on our data sets in this paper, since the HMM software in Webb et al. (2009) uses HKY model. Also note that we have used the generalized time reversible (GTR) + gamma + invariant model, which is within the 95% confidence interval computed via Akaike’s information criteria (AIC) in the software jModelTest (Guindon and Gascuel, 2003; Posada, 2008), to reconstructing a ML tree and the ML tree under the GTR + gamma + invariant model has the same tree topology as the ML tree under HKY model in Figure 5 as well as the consensus tree under HKY model in Figure 4.
The generated alignment file in phylip format was put in to the HMM software (Webb et al., 2009) using the command “java -jar ST-HMM.jar” with the following parameter (iterations: 50000, burn-in: 25000, rates: 0.001, 0.003, 0.01, 0.03, 0.1, 0.3, 1.0, 3.0, 10.0, 100.0, lambda: 5, kappa: 2.0, tuningpar 0.4). Command “java -jar STHMMPosterior.jar” was used to summarize the posterior distribution, and trees with posterior probability above 0.05 were selected using the command “java -jar TreeSummary.jar”. The region 1–1000 nucleotide (nt) was found to have a clear pattern of recombination, while the region 1000–1505 nt seems to have a massive pattern of tree probability.
In order to apply phylogenetic analysis to the sequences of 1–1505 and 1000–1505 nt of the 10 viral sequences after aligning with the clustalw-multialign software into nexus format, we estimated the posterior distribution under the generalized time reversible (GTR) + Γ model and HKY model, and we estimated the maximum likelihood estimators. First we applied a software MrBayes (Bronquist and Huelsenbeck, 2003) to analyze the split of different taxa on the most consensus tree under the GTR + Γ and HKY models. 647300 generations were sampled for 1–1505 nt alignment, while 3600000 generations were sampled for 1000–1505 nt alignment. The first 25% of the data was burn-in. We ran four Markov chains for each model. We followed the recommendation of MrBayes which suggests running the chains until the standard deviation of the chains’ split frequencies is less than 0.01.
In addition, to verify our results we applied the software RDP3 (Martin et al., 2005b) to the same data sets. Sequence alignment in phylip format was used as input for RDP3. Parameters were set to default used by RDP3. In the software RDP3 they have implemented several different methods to find recombination sites, RDP (Martin and Rybicki, 2000), GeneConv (Padidam et al., 1999), BootScan (Martin et al., 2005a), Maxchi (Smith, 1992), Chimaera (Posada and Crandall, 2001), SIScan (Gibbs et al., 2000), and 3Seq (Boni et al., 2007).
The software RDP takes basically three steps: First they discard non-informative sites from the input data sets and then for every triplet of taxa {A, B, C…}, from the data set, choose the sister A and B. Second, they use a window of user-defined width moved among the aligned sub-sequences one nucleotide at a time and take an average percentage identifying each of the three possible sequence pairs among {A, B, C} at the each position. Third, the probability that the nucleotide arrangement in the identified region that results in A, B appearing more closely related to C may have occurred by chance is computed using a binomial distribution.
The software GeneConv is based on an earlier statistical approach for detecting gene conversion (Sawyer, 1989). They use the term fragment for an aligned or homologous pair of segments in the input alignment. In the process, the highest-scoring fragments in the given alignment are listed and assigned p-values based on the assumption of a random distribution of polymorphic sites. They assign scores as follows: First, all sites that are monomorphic in the alignment are discarded so that only polymorphic sites are considered. Secondly, for a given pair of sequences, matching bases are scored as +1 and mismatches as −m, where m depends on the pair of sequences. Fragments are assigned p-values similar to the BLAST procedure (Altschul et al., 1990; Karlin and Altschul, 1993). This p-value is an approximation of the proportion of permutations of the polymorphic sites for which that pair of sequences has some fragment with the observed score or larger (Sawyer, 1989).
The software BootScan takes two phases: “Scanning phase” and “Detection phase.” In “Scanning phase” first they discard non-informative sites from the input data sets and in each window of user-defined width move among the given aligned sequences. It makes bootstrap samples and compute rooted UPGMAs by definition rooted or mid-pointed neighbor-joining (NJ) trees. In “Detection phase” every combination of triplets is individually examined for bootstrap evidence that one of the sequences may be alternatively more closely related to each of the other two sequences at different positions along its length. The probability that the pattern of sites within a potential recombinant region could have occurred by a chance distribution of mutations is approximated using a Bonferroni corrected version of the binomial distribution.
The software MaxChi considers only polymorphic sites: For a given position of the moving window on the input sequence alignment and for a given pair of sequences, a chi-square statistic is computed to compare two proportions: the proportion of sites at which the sequences agree in the left half-window and the proportion of sites at which the sequences agree in the right half-window. Discordance between these two proportions may reflect a recombination event in the history of the two sequences. The maximum chi-square over all sequence pairs is recorded as a summary of the evidence for recombination at the window center. Significance of observed chi-square statistics is assessed by a Monte Carlo permutation test.
The software Chimaera is also a modification of Maynard Smith’s maximum χ2 method (Wiuf et al., 2001) with only variable sites. The statistic is the maximum χ2 in the original alignment. The p-value equals the number of times the original statistic is smaller than the statistic from permuted alignments divided by the number of permutations. For all calculations, a sliding window was used, with the width of the window set to the number of polymorphic sites divided by 1.5. This window moves in steps of one nucleotide at a time.
The software SIScan uses a similar idea as algorithms implemented in MaxChi and Chimaera, but instead of using contingency tables they use Gaussian distribution and use Z-score to compute the p-value.
The software 3Seq is similar to RDP: 3Seq discards non-informative sites from the input data sets and then for every triplet of taxa {A, B, C}, from the data set, it chooses the sister A and B: two parent sequences that may have recombined, with one or two breakpoints, to form the third sequence (the child sequence). Excess similarity of the child sequence to a candidate recombinant of the parents is a sign of recombination; they take the maximum value of this excess similarity as the test statistic. Then they rapidly calculate the distribution of the excess similarity and using this method they estimate the p-value.
Results
The most consensus trees found with the 1–1505 and 1000–1505 nt alignment were the same as the most dominant tree found with the HMM software (the pink tree in Figure 1).
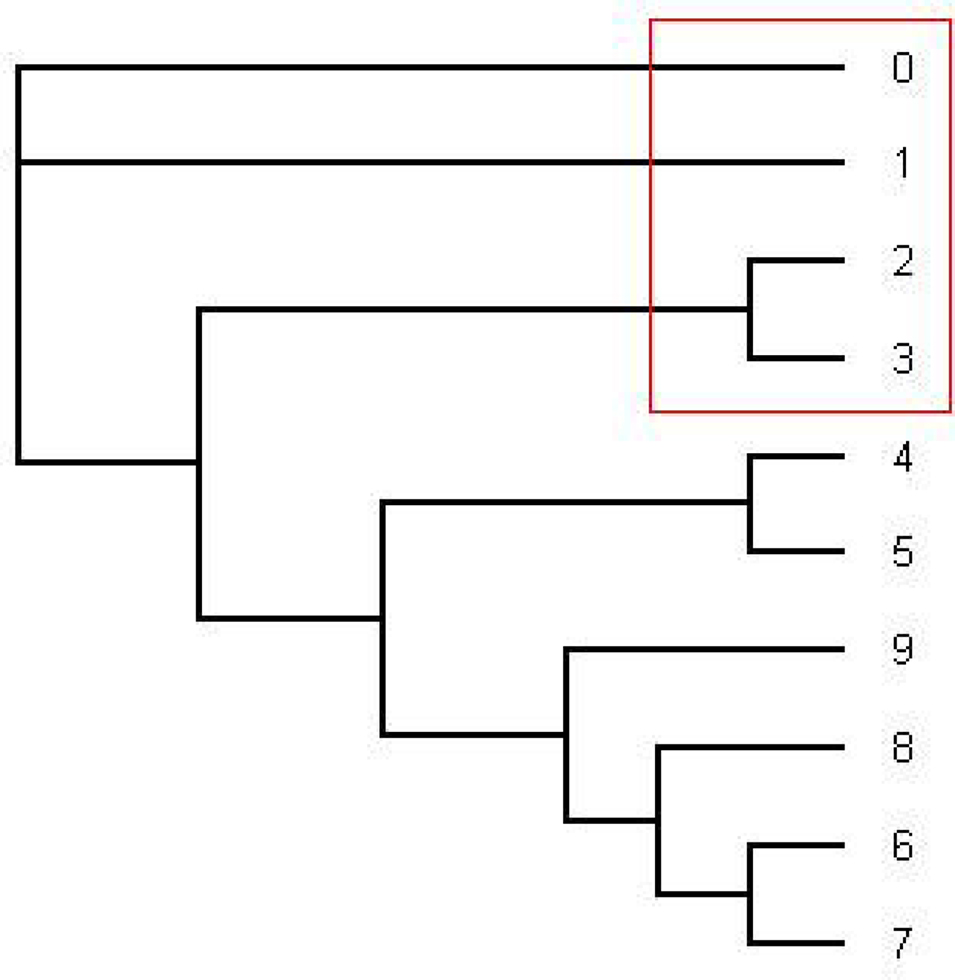
Figure 1. This is the tree topology written in pink (series 14) in Figure 2. This is an unrooted tree. This is the most likely tree topology from position 1 to 140 and position 300 to 1000. The software from Webb et al. (2009) and RDP3 Martin et al. (2005b) indicate a potential recombination event among taxa 0, 1, 2, and 3 in the red rectangle. Also the ML tree estimated by the software PHYML has the same tree topology under HKY model as well as the consensus tree estimated by the software MrBayes under HKY and GTR + Γ.
Then we estimated the maximum likelihood (ML) tree from the whole alignment (including position 1 through position 1505). Next we infer phylogenetic tree using maximum likelihoods method, using PHYML software (Guindon and Gascuel, 2003), with all settings default, namely the evolutionary model is HKY model, the tree topology search operation method is Nearest Neighbor Interchange (NNI), and the starting tree was computed using BIONJ (Gascuel, 1997). To analyze the splits of different taxa on the ML tree we applied bootstrapping on the columns of each alignment with the bootstrap sample size 1000. The ML tree found with the 1–1505 nt alignment was the same as the most dominant tree found with the HMM software (the pink tree in Figure 1).
From position 1 to position 141 and from position 312 to position 1000, the tree topology in Figure 1 has almost probability 1.0 (see Figure 2). Note that the estimated ML tree and the estimated consensus tree reconstructed with the whole sequences from an estimated posterior distribution have the same tree topology. However, from position 141 to position 311 in the alignment, the tree topology in Figure 3 has almost probability 1.0 (see Figure 2). The Robinson–Foulds (RF) distance (Robinson and Foulds, 1981) between the tree topology in Figure 3 and tree topology in Figure 1 is 6. Note that the largest possible RF distance for trees with n taxa is 2n − 6 which is 14 in our case (the normalized RF distance between these tree topologies is 0.43). Thus we do not think this happened because of the low support of a split but this seems to indicate strongly that around position 142 and position 311 there are possible recombination sites.
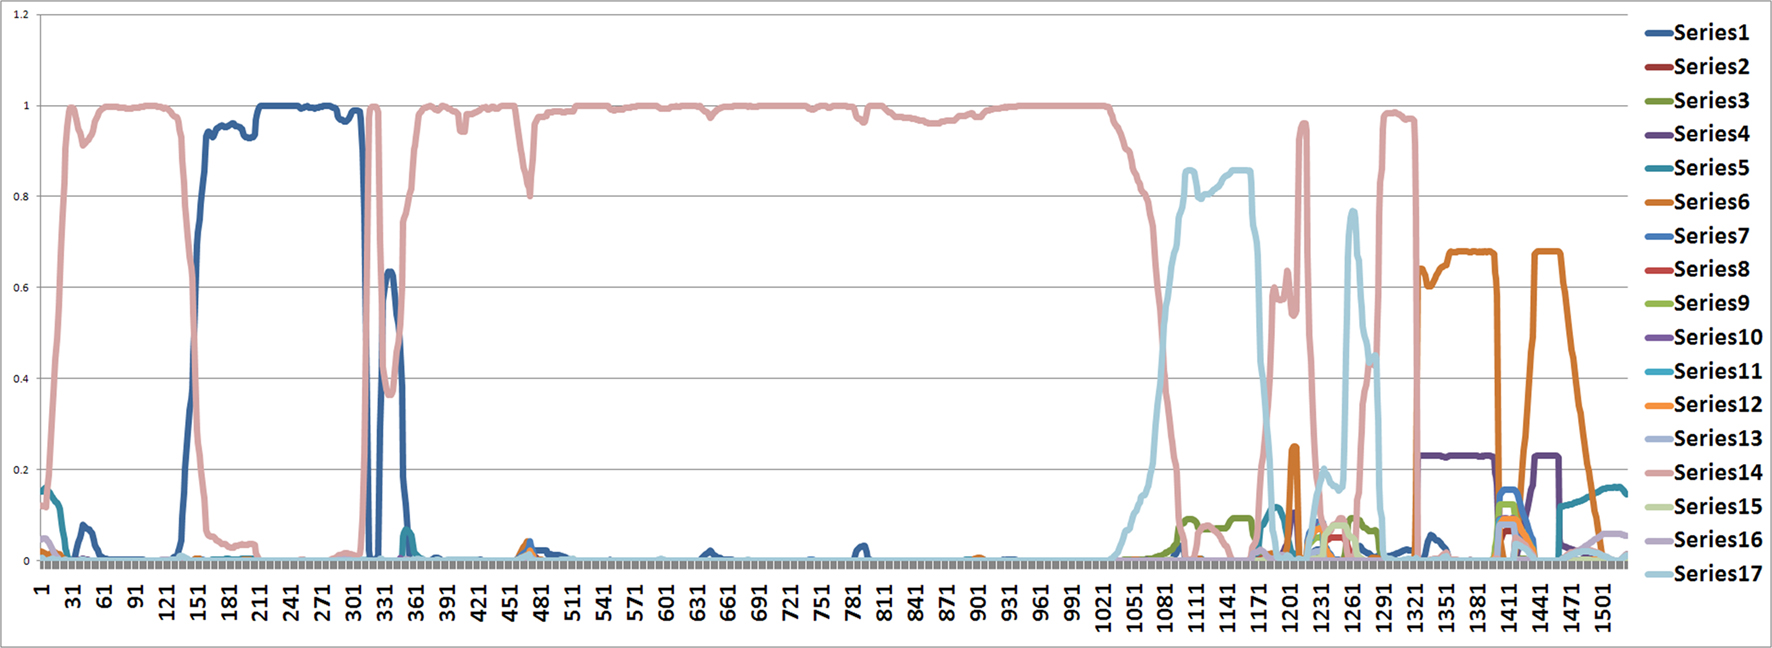
Figure 2. The figure shows an estimated probability of each tree topology along each site computed using the software from Webb et al. (2009). The label of “Series i” for i = 1,…,17 in the figure represents each different tree topology. The y-axis represents the probability for each tree topology and the x-axis represents position number. The tree written in pink is in Figure 1 and the tree written in the dark blue dominating from position 140 to 300 is in Figure 3.
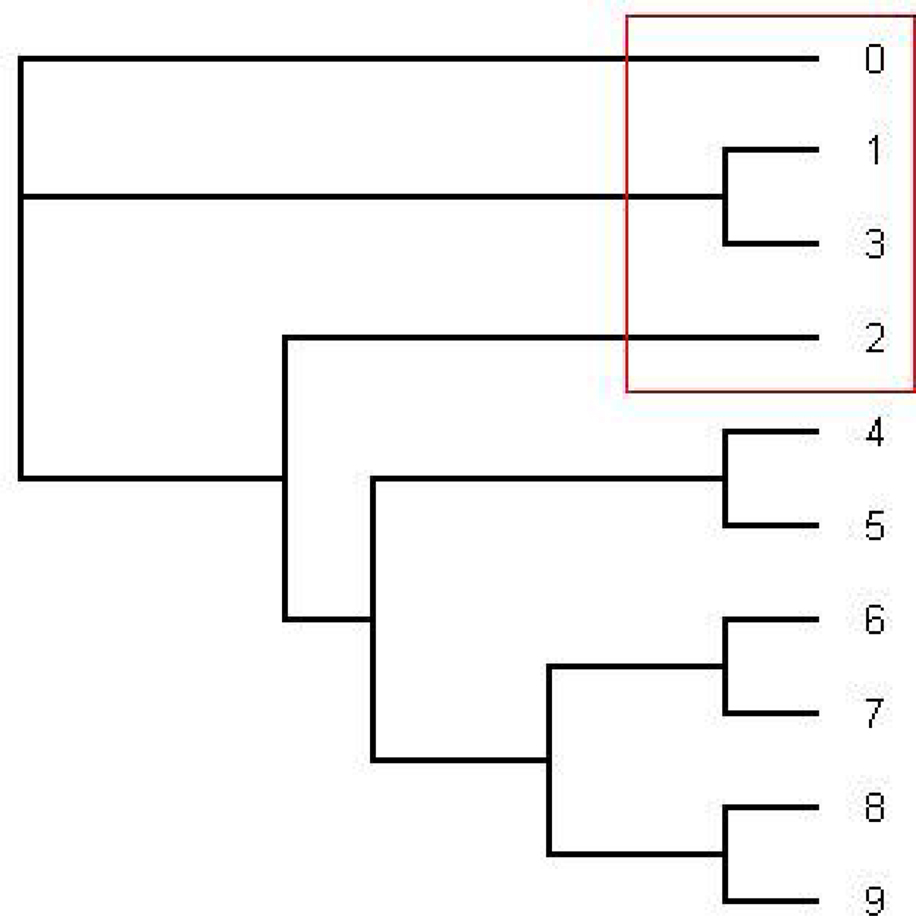
Figure 3. The tree written in the dark blue (series 1) in Figure 2. This is an unrooted tree. This is the most likely tree topology from position 140 to 300. The software from Webb et al. (2009) and RDP3 Martin et al. (2005b) indicate a potential recombination event among taxa 0, 1, 2, and 3 in the red rectangle.
In order to compute the support for each split we have also computed the consensus tree using the software MrBayes (Figure 4) and the ML tree using PHYML (Figure 5). For the consensus tree we used the posterior distribution and for the ML tree we use the bootstrap with the sample size 1000 to compute the support for each split. They have the same tree topology as the tree in Figure 1 and the support for each split in the ML tree and the consensus tree has very high probability. Especially, the probability of each split on the consensus tree estimated with the whole sequences under HKY is 1.0 (100%). (Even though one of the splits on the ML tree reconstructed with the whole sequences under HKY has about 90% of its support all other splits have strong support; Figure 5.).
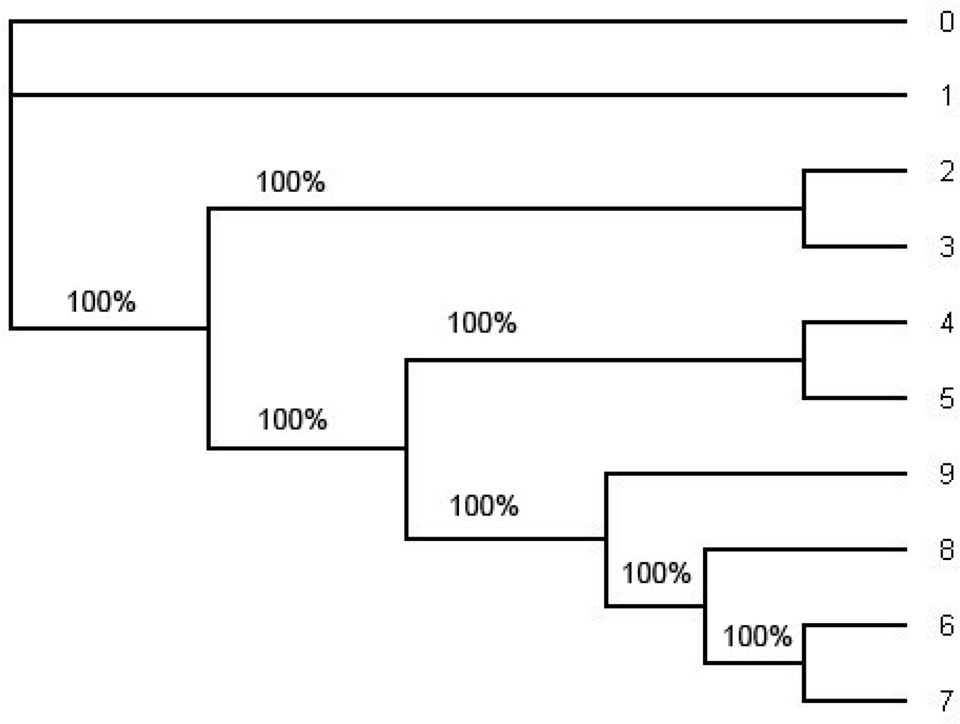
Figure 4. The consensus tree estimated by the software MrBayes under HKY from the whole alignment (including position 1 through position 1505). This is an unrooted tree. The number in each split represent the probability of the split. The consensus tree estimated under the GTR + Γ also has the same tree topology but it has smaller probabilities of some splits. Note that the tree topology of the consensus tree is the same as the tree topology of the ML tree in Figure 5 and the tree topology in Figure 1.
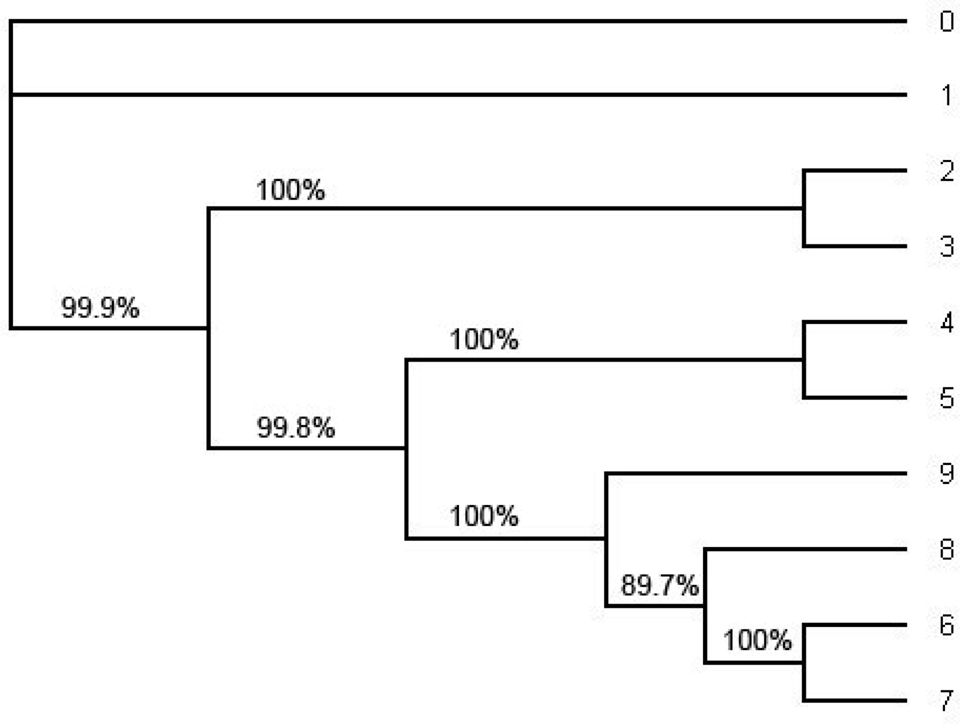
Figure 5. The ML tree estimated by the software PHYML under HKY model from the whole alignment (including position 1 through position 1505). This is an unrooted tree. The number in each split represents the probability of the split estimated by bootstrapping with the bootstrap sample size 1000. Note that the tree topology of the ML tree is the same as the tree topology of the consensus tree in Figure 4 and the tree topology in Figure 1.
The mutation rates along each site are also estimated by the software from Webb et al. (2009) and it seems that the mutation rates are between 0.1 and 0.3 (Figure 6).
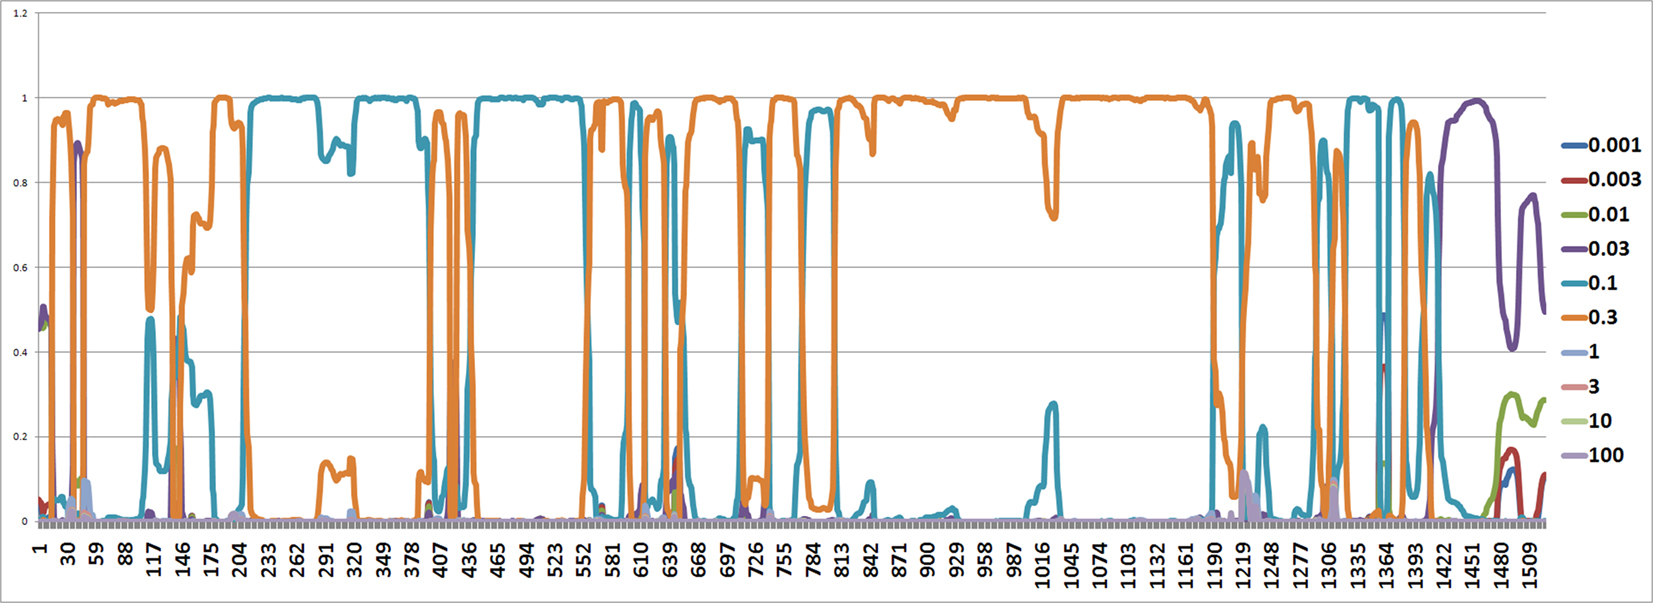
Figure 6. The figure shows an estimated probability of each mutation rate along each site computed using the software from Webb et al. (2009). The y-axis represents the probability for each mutation rate and the x-axis represents position number. It shows that the most common rates are 0.1 and 0.3.
RDP3 estimated a similar recombination event, where a small genome fragment of ToLCMaB-[IN;Pun;04] (taxon-3) (position 142–311 in alignment) is migrated from ToLCB-[PK;RYK;97] (taxon-1), as circled by red rectangle in Figure 7. RDP3 uses multiple methods for recombination estimation, and the average p-value from different methods are listed below (Table 2).
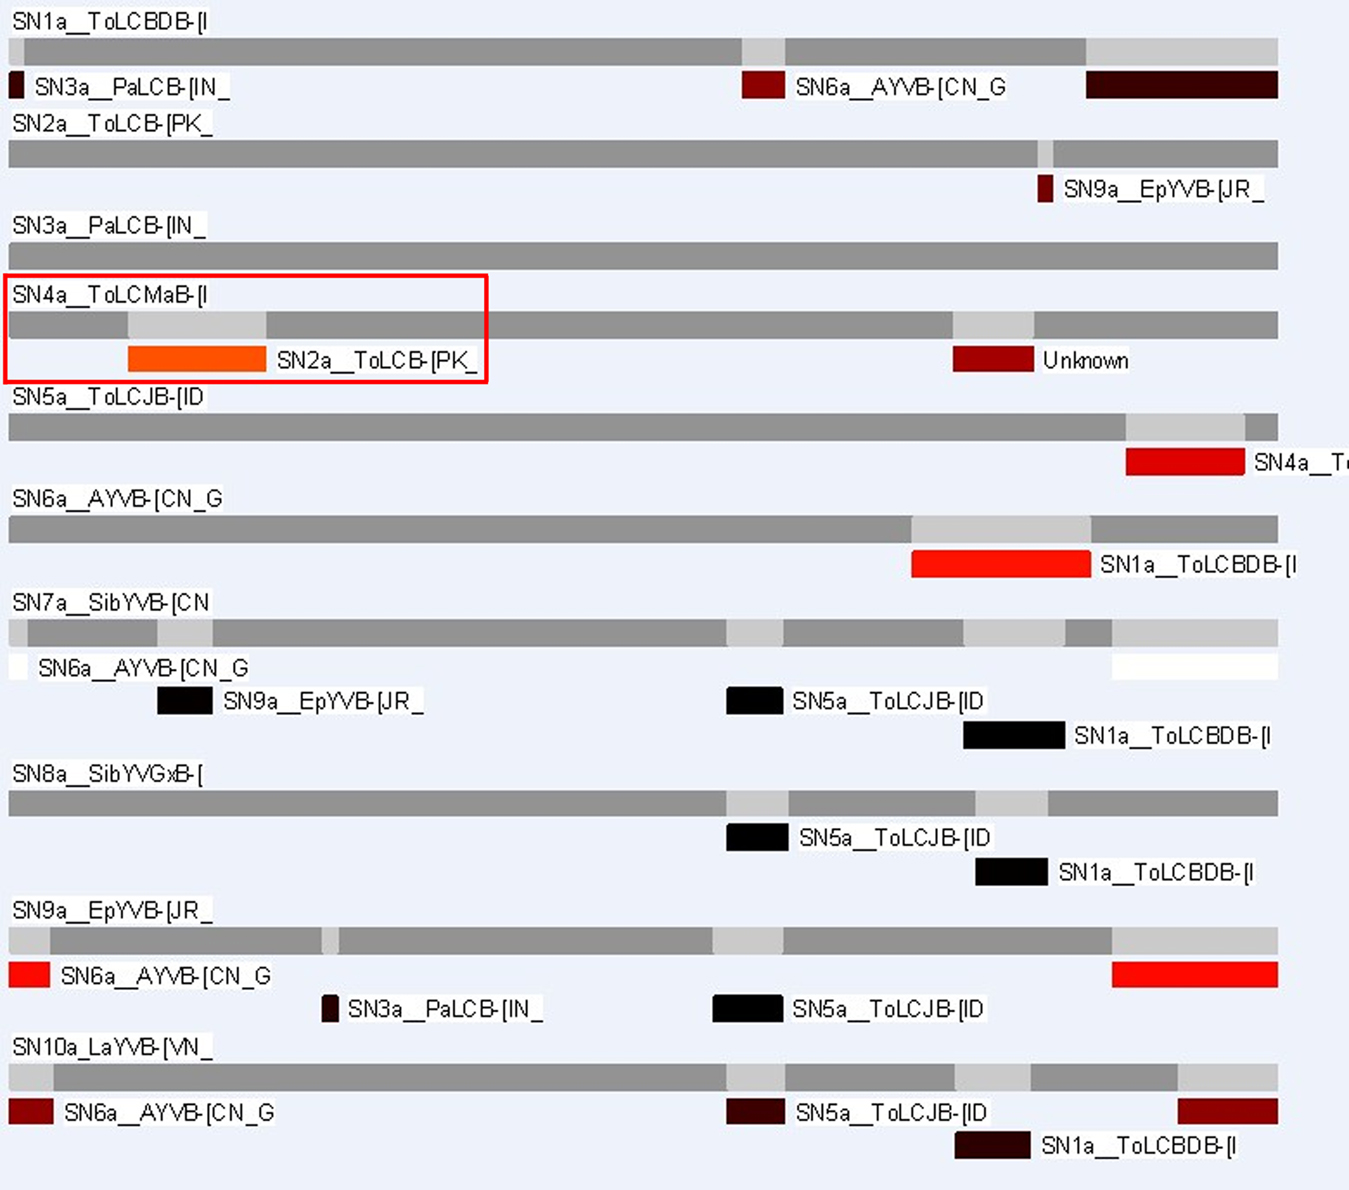
Figure 7. RDP3 infers the same 10 taxa alignment used in our study. Red rectangles indicate the same event inferred by a HMM method from Webb et al. (2009).
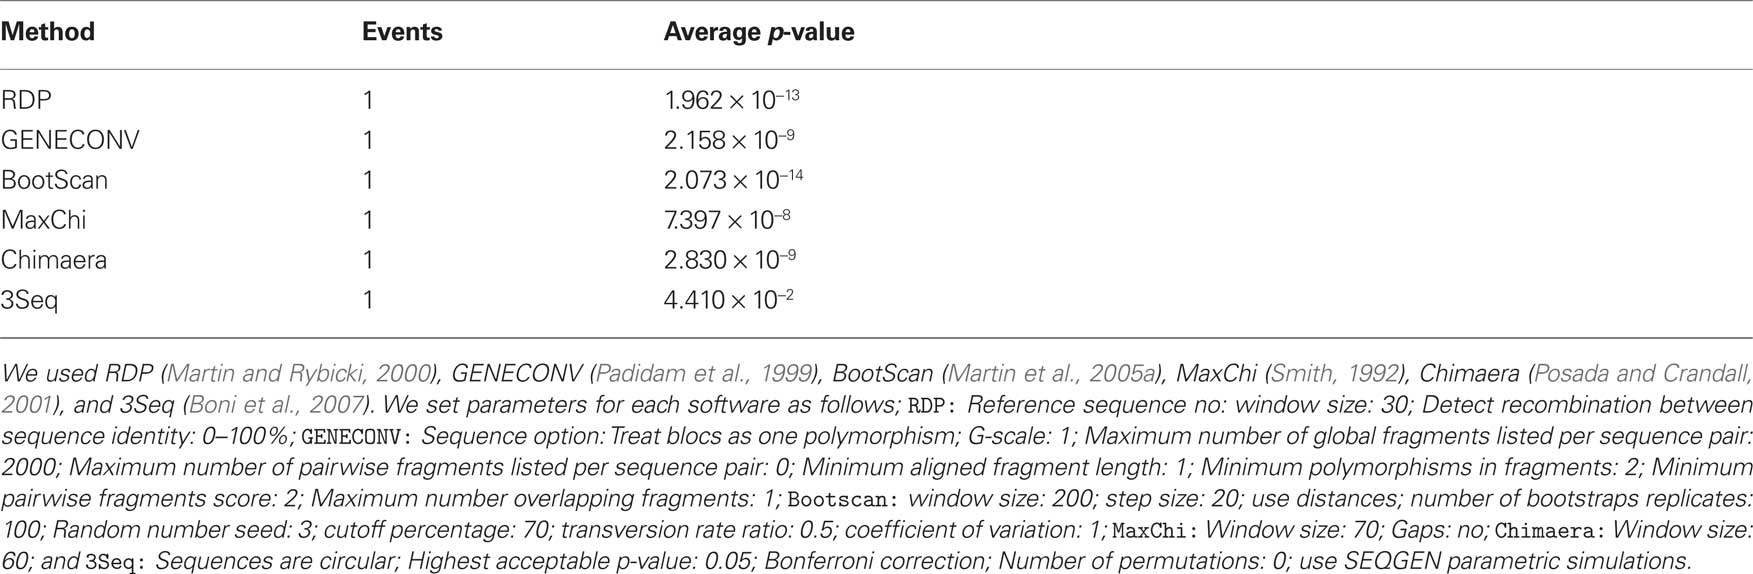
Table 2. Average p-value from different methods in RFP3 (Martin et al., 2005b) inferring the recombination event between ToLCMaB-[IN;Pun;04] and ToLCB-[PK;RYK;97] at position of 142–311.
Conclusion
We first reported a potential recombination event between taxa 1, 2, and 3, indicating that the strain ToLCMaB-(IN;Pun;04] (taxon-3) from ToLCMaB is a recombinant of two strains from two different species, ToLCB-[PK;RYK;97] (taxon-1) and PaLCuB-[IN;Chi;05] (taxon-2). As one study reported, ToLCMaB-[IN;Pun;04] (taxon-3) and PaLCuB-[IN;Chi;05] (taxon-2) are closely related in their phylogeny compared to other species (Sivalingam et al., 2010). Our study showed that ToLCMaB-[IN;Pun;04] (taxon-3) shares sequence identity mainly with PaLCuB-[IN;Chi;05] (taxon-2), while a small portion of its genome (position 141–312 nt in the alignment) is potentially migrated from another species, ToLCB-[PK;RYK;97] (taxon-1).
Our results indicate a recombination event happened between a northern India DNA-β strain ToLCB-[PK;RYK;97] (taxon-1) and a southern India DNA-β strain PaLCuB-[IN;Chi;05] (taxon-2), resulting a new strain ToLCMaB-[IN;Pun;04] (taxon-3) which was found in southern India. Different geographic locations provide different physiology of host, weather conditions, helper viruses, and so on. The phylogenetic relationship among ToLCB-[PK;RYK;97] (taxon-1), PaLCuB-[IN;Chi;05] (taxon-2), and ToLCMaB-[IN;Pun;04] (taxon-3) coincides with their distinct geographic relationship, suggesting that different genetic information on the viral genome from northern India or southern India may already adapt to their geographic distribution (Figure 8). However, although the recombination event lead to the possible emergence of a new strain in a different epidemic location in India, it still has a stronger relationship within its parents geographically and phlegmatically than other strains which are epidemic in other Asian countries.
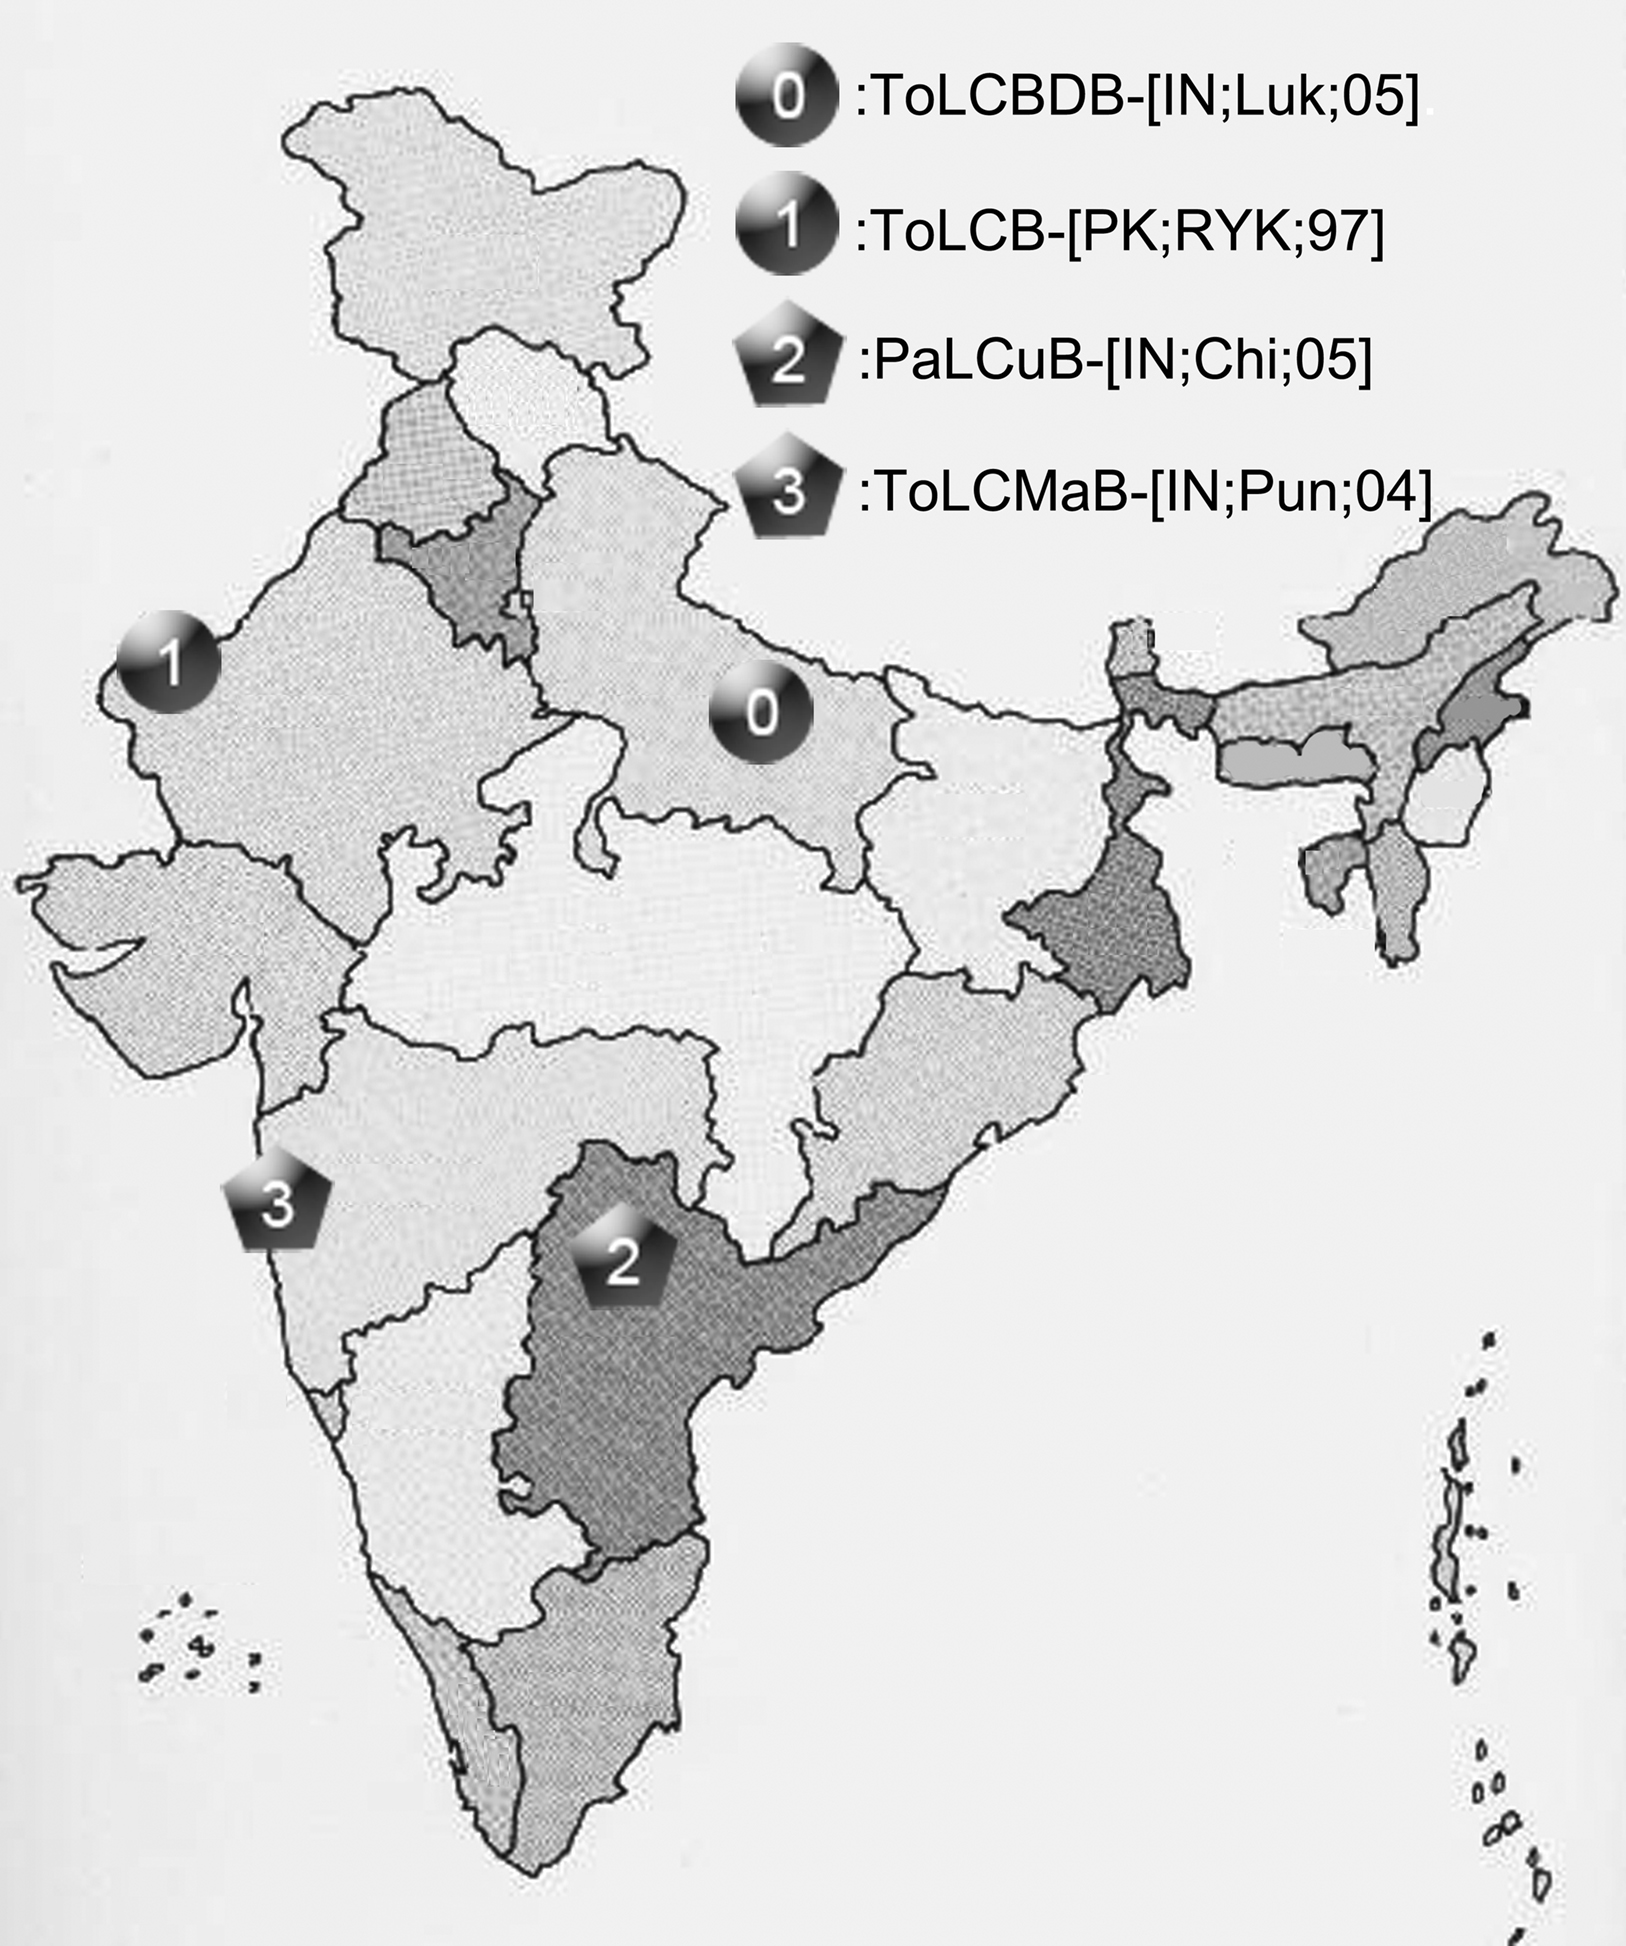
Figure 8. The geographic distribution of four betasatellites, ToLCBDB-[IN;Luk;05], ToLCB-[PK;RYK;97], PaLCuB-[IN;Chi;05], and ToLCMaB-[IN;Pun;04], associated with ToLCD in the India sub-continent.
βC1 protein, product of the C1 gene, can alter leaf development and suppress plant defense systems during infection (Cui et al., 2005; Yang et al., 2008). The recombination happened in approximate 100–220 nt of the genome (141–312 in alignment), which partially covers the C-Terminal of C1 gene on the betasatellite. ToLCB-[PK;RYK;97] (taxon-1) βC1 has 118 amino acids, while βC1 of PaLCuB-[IN;Chi;05] (taxon-2) has 122 amino acids. The recombination event leads to a βC1 protein of ToLCMaB-[IN;Pun;04] (taxon-3) with 118 amino acids, missing the 6 amino acids from major partent PaLCuB-[IN;Chi;05] (taxon-2) on the C-terminal of βC1, instead having 2 amino acids from C-terminal of βC1 on minor parent ToLCB-[PK;RYK;97] (taxon-1). Although functions of different domains of βC1 were unknown, the recombination on C-terminal of βC1 might modulate its function involving in virus–host interaction.
DNA-β was known to be capable to adapt to a new helper virus from distinct geographic location by modifying its genome (Nawaz-ul Rehman et al., 2009). The genetic modification on this southern Indian DNA-β strain ToLCMaB-[IN;Pun;04] (taxon-3) via a recombination event may contribute to the fitness of this DNA-β strain on its host.
Discussion
The advantage of our study is that estimating of phylogenetic tree through out the alignment by HMM method provide a clear history of DNA-β recombination. It is the first time that researches on DNA-β recombination use such statistic method and give this clear recombination history.
Our study also provides a way to understand DNA virus evolution through recombination events. From our results, it is likely that the specie of ToLCMaB is a result of recombination from two different species, namely ToLCB and PaLCuB. Such recombination event contributed to the occurrence of new DNA-β species as well as the evolution of DNA-β. By providing the recombination history together with geographic information, we could link the phylogeny information to the geographic information of DNA-β strains, thus help us understand evolution and epidemic of the virus.
Conflict of Interest Statement
The authors declare that the research was conducted in the absence of any commercial or financial relationships that could be construed as a potential conflict of interest.
Acknowledgments
Ruriko Yoshida is supported by NIH R01 grant 5R01GM086888. We thank David Haws for computations.
References
Abou-Jawdah, Y., El Mohtar, C., Atamian, H., and Sobh, H. (2006). First report of tomato chlorosis virus in lebanon. Plant Dis. 90, 378–378.
Altschul, S. F., Gish, W., Miller, W., Myers, E. W., and Lipman, D. J. (1990). Basic local alignment search tool. J. Mol. Biol. 215, 403–410.
Amin, I., Mansoor, S., Amrao, L., Hussain, M., Irum, S., Zafar, Y., Bull, S. E., and Briddon, R. W. (2006). Mobilisation into cotton and spread of a recombinant cotton leaf curl disease satellite. Arch. Virol. 151, 2055–2065.
Boni, M. F., Posada, D., and Feldman, M. W. (2007). An exact nonparametric method for inferring mosaic structure in sequence triplets. Genetics 176, 1035–1047.
Briddon, R. W., Brown, J. K., Moriones, E., Stanley, J., Zerbini, M., Zhou, X., and Fauquet, C. M. (2008). Recommendations for the classification and nomenclature of the DNA-β satellites of begomoviruses. Arch. Virol. 153, 763–781.
Briddon, R. W., Mansoor, S., Bedford, I. D., Pinner, M. S., Saunders, K., Stanley, J., Zafar, Y., Malik, K. A., and Markham, P. G. (2001). Identification of DNA components required for induction of cotton leaf curl disease. Virology 285, 234–243.
Bronquist, F., and Huelsenbeck, J. P. (2003). Mrbayes 3: Bayesian phylogenetic inference under mixed models. Bioinformatics 19, 1572–1574.
Cui, X., Li, G., Wang, D., Hu, D., and Zhou, X. (2005). A begomovirus DNAbeta-encoded protein binds DNA, functions as a suppressor of RNA silencing, and targets the cell nucleus. J. Virol. 79, 10764–10775.
Cui, X., Tao, X., Xie, Y., Fauquet, C. M., and Zhou, X. (2004). A DNAbeta associated with tomato yellow leaf curl china virus is required for symptom induction. J. Virol. 78, 13966–13974.
Gascuel, O. (1997). Bionj: an improved version of the nj algorithm based on a simple model of sequence data. Mol. Biol. Evol. 14, 685–695.
Gibbs, M. J., Armstrong, J. S., and Gibbs, A. J. (2000). Sister-scanning: a Monte Carlo procedure for assessing signals in recombinant sequences. Bioinformatics 16, 573–582.
Guindon, S., and Gascuel, O. (2003). A simple, fast, and accurate algorithm to estimate large phylogenies by maximum likelihood. Syst. Biol. 52, 696–704.
Hasegawa, M., Kishino, H., and Yano, T. (1985). Dating the human-ape splitting by a molecular clock of mitochondrial DNA. J. Mol. Evol. 22, 160–174.
Karlin, S., and Altschul, S. F. (1993). Applications and statistics for multiple high-scoring segments in molecular sequences. Proc. Natl. Acad. Sci. U.S.A. 90, 5873–5877.
Lefeuvre, P., Lett, J. M., Varsani, A., and Martin, D. P. (2009). Widely conserved recombination patterns among single-stranded dna viruses. J. Virol. 83, 2697–2707.
Lefeuvre, P., Martin, D. P., Hoareau, M., Naze, F., Delatte, H., Thierry, M., Varsani, A., Becker, N., Reynaud, B., and Lett, J. M. (2007). Begomovirus ‘melting pot’ in the south-west Indian ocean islands: molecular diversity and evolution through recombination. J. Gen. Virol. 88, 3458–3468.
Mansoor, S., Briddon, R. W., Bull, S. E., Bedford, I. D., Bashir, A., Hussain, M., Saeed, M., Zafar, Y., Malik, K. A., Fauquet, C., and Markham, P. G. (2003a). Cotton leaf curl disease is associated with multiple monopartite begomoviruses supported by single dna beta. Arch. Virol. 148, 1969–1986.
Mansoor, S., Briddon, R. W., Zafar, Y., and Stanley, J. (2003b). Geminivirus disease complexes: an emerging threat. Trends Plant Sci. 8, 128–134.
Martin, D., and Rybicki, E. (2000). Rdp: detection of recombination amongst aligned sequences. Bioinformatics 16, 562–563.
Martin, D. P., Posada, D., Crandall, K. A., and Williamson, C. (2005a). A modified bootscan algorithm for automated identification of recombinant sequences and recombination breakpoints. AIDS Res. Hum. Retroviruses 21, 98–102.
Martin, D. P., Williamson, C., and Posada, D. (2005b). Rdp2: recombination detection and analysis from sequence alignments. Bioinformatics 21, 260–262.
Mazhar, H., Shazia, I., Shahid, M., and Rob, W. B. (2009). A single species of betasatellite is prevalent in chilli across north central Pakistan and shows phylogeographic segregation. J. Phytopathol. 157, 576–579.
Nawaz-ul Rehman, M. S., Mansoor, S., Briddon, R. W., and Fauquet, C. M. (2009). Maintenance of an old world betasatellite by a new world helper begomovirus and possible rapid adaptation of the betasatellite. J. Virol. 83, 9347–9355.
Padidam, M., Sawyer, S., and Fauquet, C. M. (1999). Possible emergence of new geminiviruses by frequent recombination. Virology 265, 218–225.
Posada, D., and Crandall, K. A. (2001). Evaluation of methods for detecting recombination from DNA sequences: computer simulations. Proc. Natl. Acad. Sci. U.S.A. 98, 13757–13762.
Robinson, D. F., and Foulds, L. R. (1981). Comparison of phylogenetic trees. Math. Biosci. 53, 131–147.
Saunders, K., Bedford, I. D., Briddon, R. W., Markham, P. G., Wong, S. M., and Stanley, J. (2000). A unique virus complex causes ageratum yellow vein disease. Proc. Natl. Acad. Sci. U.S.A. 97, 6890–6895.
Sivalingam, P. N., Malathi, V. G., and Varma, A. (2010). Molecular diversity of the DNA-β satellites associated with tomato leaf curl disease in India. Arch. Virol. 155, 757–764.
Thompson, J. D., Higgins, D. G., and Gibson, T. J. (1994). Clustal w: improving the sensitivity of progressive multiple sequence alignment through sequence weighting, position-specific gap penalties and weight matrix choice. Nucleic Acids Res. 22, 4673–4680.
Webb, A., Hancock, J. M., and Holmes, C. C. (2009). Phylogenetic inference under recombination using bayesian stochastic topology selection. Bioinformatics 25, 197–203.
Wiuf, C., Christensen, T., and Hein, J. (2001). A simulation study of the reliability of recombination detection methods. Mol. Biol. Evol. 18, 1929–1939.
Yang, J. Y., Iwasaki, M., Machida, C., Machida, Y., Zhou, X., and Chua, N. H. (2008). betac1, the pathogenicity factor of tylccnv, interacts with as1 to alter leaf development and suppress selective jasmonic acid responses. Genes Dev. 22, 2564–2577.
Zhou, Y. C., Noussourou, M., Kon, T., Rojas, M. R., Jiang, H., Chen, L. F., Gamby, K., Foster, R., and Gilbertson, R. L. (2008). Evidence of local evolution of tomato-infecting begomovirus species in west Africa: characterization of tomato leaf curl mali virus and tomato yellow leaf crumple virus from mali. Arch. Virol. 153, 693–706.
Keywords: geminiviruses, DNA-β satellites, phylogenetic trees, recombination
Citation: Xu K and Yoshida R (2010) Statistical analysis on detecting recombination sites in DNA-β satellites associated with old world geminiviruses. Front. Psychiatry 1:138. doi: 10.3389/fpsyt.2010.00138
Received: 22 June 2010;
Paper pending published: 05 July 2010;
Accepted: 13 September 2010;
Published online: 25 October 2010.
Edited by:
Radhakrishnan Nagarajan, University of Arkansas for Medical Sciences, USAReviewed by:
Theodore Perkins, Ottawa Hospital Research Institute, Canada;Preetam Ghosh, University of Southern Mississippi, USA;
Nidhal Bouaynaya, University of Arkansas at Little Rock, USA
Copyright: © 2010 Xu and Yoshida. This is an open-access article subject to an exclusive license agreement between the authors and the Frontiers Research Foundation, which permits unrestricted use, distribution, and reproduction in any medium, provided the original authors and source are credited.
*Correspondence: Ruriko Yoshida, Department of Statistics, University of Kentucky, 817 Patterson Office Tower, Lexington, KY 40506-0027, USA. e-mail: ruriko.yoshida@uky.edu