 Franc C. L. Donkers* Shane R. Schwikert Anna M. Evans Katherine M. Cleary Diana O. Perkins Aysenil Belger
- Department of Psychiatry, University of North Carolina at Chapel Hill, Chapel Hill, NC, USA
Puberty is a critical period for the maturation of the fronto-limbic and fronto-striate brain circuits responsible for executive function and affective processing. Puberty also coincides with the emergence of the prodromal signs of schizophrenia, which may indicate an association between these two processes. Time-domain analysis and wavelet based time–frequency analysis was performed on electroencephalographic (EEG) data of 30 healthy control (HC) subjects and 24 individuals at familial risk (FR) for schizophrenia. All participants were between the ages of 13 and 18 years and were carefully matched for age, gender, ethnicity, education, and Tanner Stage. Electrophysiological recordings were obtained from 32 EEG channels while participants performed a visual oddball task, where they identified rare visual targets among standard “scrambled” images and rare aversive and neutral distracter pictures. The time-domain analysis showed that during target processing the FR group showed smaller event-related potentials in the P2 and P3 range as compared to the HC group. In addition, EEG activity in the theta (4–8 Hz) frequency range was significantly reduced during target processing in the FR group. Inefficient cortical information processing during puberty may be an early indicator of altered brain function in adolescents at FR for schizophrenia and may represent a vulnerability marker for illness onset. Longitudinal assessments will have to determine their predictive value for illness onset in populations at FR for psychotic illness.
Introduction
Little is known about how or why psychotic disorders like schizophrenia develop. Although structural brain abnormalities occurring early in life may be necessary for the future emergence of psychotic symptoms, the notion that psychotic symptoms do not typically manifest until after puberty has led researchers to believe that neurodevelopmental processes active during this period may also play a role in the pathogenesis of schizophrenia (Feinberg, 1982; Weinberger, 1987). Adolescence represents a period of active brain development, during which increases in neuronal efficiency are accompanied by a reduction (i.e., pruning) of excess synapses and by myelination of axonal connections in regions critical for higher order cognition, particularly the prefrontal cortex (Huttenlocher, 1979; Keshavan et al., 1994; Woods, 1998). The behavioral expression of schizophrenia-related neural disturbances also seems to vary with maturation, and becomes more “psychosis-like” the closer to the onset of a psychotic episode (Cannon, 2005). The fact that schizophrenia is increasingly viewed as a neurodevelopmental disorder suggests that potential precursors to psychotic illness may be detectable in individuals at familial risk (FR) for developing schizophrenia. Although, the idea of examining individuals at FR for developing schizophrenia is not new (e.g., Fish et al., 1992; Marcus et al., 1993; McNeil et al., 1993) to date there has been relatively little study into the neurodevelopmental changes occurring around puberty, and comparing those to the changes occurring in subjects at FR for developing schizophrenia. Focusing attention on young at-risk individuals provides a unique window on the unfolding pathophysiology of the illness, and does not suffer from the clouding effects of disease chronicity or long-term treatment that plague studies of patients with established illness. Longitudinal assessments of young at-risk relatives also provides an opportunity to determine whether biological or biobehavioral differences are present prior to typical onset of schizophrenia in those individuals who progress. These differences hold the potential to serve as vulnerability markers or predictors of illness, and may inform targets for prevention.
Electroencephalography (EEG) has long been used in search for biomarkers of schizophrenia through the analysis of event-related potentials (ERPs). ERPs can provide detailed information about neuronal events underlying sensory, cognitive, or motor functions. One of the most reliably demonstrated ERP abnormalities in schizophrenia is the amplitude reduction of the P3 (e.g., Ford, 1999; Jeon and Polich, 2003). The P3 is a late scalp-positive ERP component usually recorded in an auditory or visual “oddball” experimental paradigm in which a subject detects an infrequent deviant or task-relevant “target” stimulus randomly presented within a series of frequent non-target or “standard” stimuli. The P3 in oddball task paradigms has been associated with attention and memory processes (e.g., Donchin and Coles, 1998; Polich and Herbst, 2000). Evidence for the idea that the P3 indexes a genetic and biological vulnerability to schizophrenia has come from family based high-risk studies showing that this ERP component is also impaired in clinically unaffected family members who, by reason of their family history, are at high-risk for developing schizophrenia (see Bramon et al., 2005 for a meta-analysis). Few studies have examined the P3 in adolescents at FR for schizophrenia and the results of these studies have been mixed (e.g., Friedman et al., 1988; Schreiber et al., 1992). However, recent advances in neurophysiological techniques provide new opportunities to measure abnormal brain function in adolescents at FR for schizophrenia. Traditional ERP analysis assumes that the EEG response to relevant task processing is contained within a background of irrelevant neuroelectric noise. By averaging a large number of EEG trials, the background neuroelectric noise is minimized allowing only the “relevant” neural signal to remain. However, a growing body of evidence suggests that the activity removed in the ERP averaging process is not random or irrelevant, and that event-related changes in the magnitude and phase of the EEG signal across all frequencies may be relevant to information processing (e.g. Kolev and Yordanova, 1997; Demiralp et al., 1999; Makeig et al., 2004). A more thorough understanding of neuronal events can be gained through time–frequency decomposition of (single-trial) EEG data.
Time–frequency decomposition comprises many methods and can reveal the time evolution of the magnitude and phase of the EEG signals in different frequency bands in response to particular events. When the magnitude values of each time–frequency point are squared and then averaged over trials, all the signal change in the post-event period is captured irrespective of their phase angles. This measure quantifies the total activity [or total power (TP)] after event onset and is comprised of both phase-locked and non-phase-locked event-related EEG activity. Computing the time–frequency transform of the trial-averaged ERP and then squaring the magnitude values associated with each time–frequency point captures activity that is phase-locked to the event only since averaging across trials tends to cancel out the non-phase-locked activity [also known as evoked power (EP)]. When the magnitude values of each time–frequency point are unit normalized and then averaged across trials, a measure of cross-trial phase synchrony [or phase-locking factor (PLF)] is obtained. This measure describes the consistency of phase angles with respect to an event’s onset. Time–frequency decomposition of the ERP to target trials in oddball task paradigms has shown that the late scalp-positive P3 ERP occupies the delta (1–4 Hz) and theta (4–8 Hz) frequency range (e.g. Kolev et al., 1997; Spencer and Polich, 1999; Demiralp and Ademoglu, 2001) and abnormal activity in these low-frequency ranges has been observed during oddball task paradigms in patients with schizophrenia (e.g., Roschke and Fell, 1997; Ergen et al., 2008; Ford et al., 2008; Doege et al., 2009). Slow frequency EEG activity has been associated with long range interactions in larger scale brain networks (von Stein et al., 2000). Since the core cognitive domains affected in schizophrenia are the attention and memory systems that involve the activation of larger scale brain networks, it has been hypothesized that the cognitive deficits observed in schizophrenia can be attributed to abnormalities in the synchronization and efficiency of neural processes that integrate information from different brain regions. Time–frequency decomposition of (single-trial) EEG data could provide additional insight into whether abnormalities in the synchronization and efficiency of neural processes are compromised in schizophrenia.
In the current study we employed a visual oddball task in conjunction with EEG measurements to assess brain function associated with executive processing in a group of adolescents at FR for schizophrenia and a group of adolescents without such risk. We applied traditional time-domain analysis and wavelet based time–frequency analysis to the EEG data obtained from target response trials in order to assess potential group differences in ERPs and time–frequency decomposition measures between both groups. We hypothesized that compared to the HC group the FR group would show a reduction of the P3 amplitude accompanied by a reduction of low-frequency EEG activity in response to the target stimuli. We further aimed to establish whether these reductions are produced by deficits in (a) synchronization mechanisms, which would be reflected by a decrease in the EP and PLF measures, (b) by a decrease in the power of signals generated by underlying neural mechanisms, which would be reflected in a decrease in the TP measure, or (c) by a combination of both.
Materials and Methods
Participants
Subjects consisted of 24 adolescents at FR for schizophrenia and 30 HC subjects. All subjects were between the ages of 13–18 years and in Tanner Stage 3 or higher according to the Tanner Stage growth chart (Marshall and Tanner, 1969, 1970). Participants with FR were recruited from a referral network including community-based health providers and the UNC PRIME (Prevention through Risk Identification, Management and Education) research clinic. No participants with FR were seeking treatment. Controls were recruited from local schools and the general community. The groups did not significantly differ according to age, gender, race, education, handedness, and Tanner Stage (see Table 1). FR was defined as having a first-degree family member (sibling or parent) with a diagnosis of schizophrenia or schizoaffective disorder, as determined by the Family Interview for Genetics conducted with the participant’s parent (Maxwell, 1992). Diagnosis of the affected relative was confirmed by the Structured Interview for DSM-IV Disorders for adults and the Washington University Kiddie Schedule for Affective Disorders and Schizophrenia for children (Orvaschel et al., 1982). Of the 24 subjects with FR, six had an affected parent and 18 had an affected sibling. Race was classified by participant self-report at the time of screening by options defined by the investigators in order to match between groups. Tanner Stages were determined by a physical exam performed by a licensed medical physician, a questionnaire answered by a parent, or a cartoon illustration depicting the stages completed by the participant.
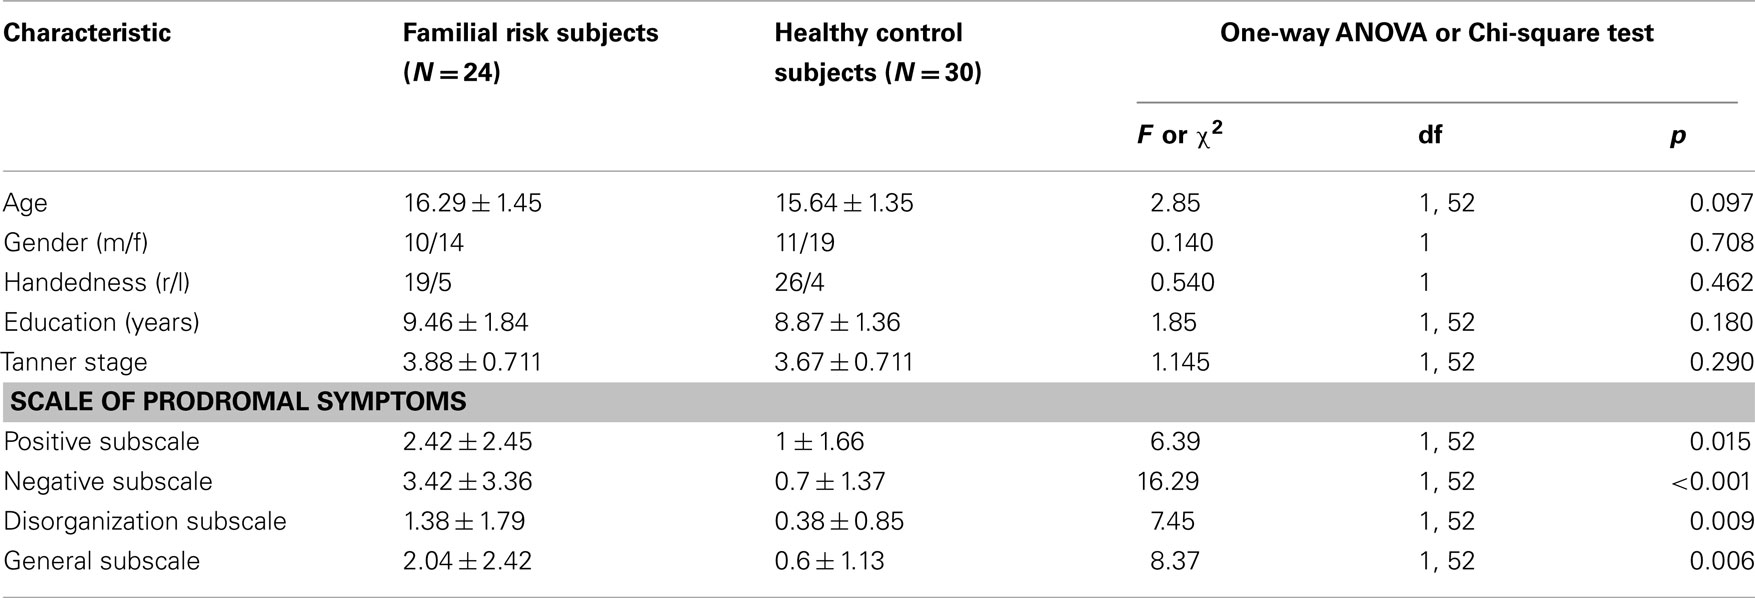
Table 1. Demographic and clinical characteristics of study groups.
Exclusion criteria for the FR group included presence of a past or current DSM-IV Axis I psychotic or bipolar affective disorder. Because FR for schizophrenia is associated with a high likelihood of premorbid disorders (Keshavan et al., 2008), we chose not to exclude high-risk individuals with other Axis I disorders. In our sample, 14 participants with FR had other diagnoses including attention-deficit hyperactivity disorder, learning disorder, conduct disorder, adjustment disorder, specific phobia, depressive disorder – not otherwise specified, and anxiety disorder. Other exclusion criteria for the FR group included central nervous system disorder (e.g., seizure disorder) or mental retardation (IQ less than 65), current treatment with an antipsychotic medication, and past history of over 12 weeks lifetime cumulative treatment with an antipsychotic. Exclusion criteria for the control group included history of a DSM-IV Axis I psychiatric disorder, any psychiatric disorder in a first-degree relative, neurological disorder, and substance abuse disorder. After complete description of the study to the subjects, written informed assent (or consent, if age 18) was obtained, with parents providing written consent as approved by the University of North Carolina at Chapel Hill Institutional Review Board.
The presence of positive, negative, disorganization, and general symptoms was assessed for all participants using the schedule of prodromal symptoms (SOPS; Miller et al., 1999). The FR group showed significantly more symptoms than the control group in positive, negative, disorganization, and general symptoms (Table 1).
Experimental Procedure
Participants were seated in a dimly illuminated and sound attenuated room 80 cm in front of a computer monitor. Electrophysiological data were collected while subjects performed a visual oddball task with novel distracters. Subjects attended to a series of four types of visual stimuli and where required to press a button to the infrequently occurring target stimulus only. The four stimulus types consisted of frequent “standard” scrambled images (N = 1040, 87.4%), aversive novel images (N = 50, 4.2%), neutral novel images (N = 50, 4.2%), and simple colored “target” circles (N = 50, 4.2%). The aversive and neutral novel stimuli were chosen from the International Affective Picture System database, which consists of complex pictures with standardized ratings from adults for arousal (calm to exiting) and valence (unpleasant to pleasant; Lang et al., 2005). The aversive IAPS pictures were selected to be age-appropriate for the children and adolescents in the study. The average valence and arousal ratings for the aversive stimuli were 3.38 (SD = 1.78) and 6.14 (SD = 2.08), respectively. Average valence and arousal ratings for the neutral stimuli were 6.21 (SD = 0.26) and 3.72 (SD = 2.15). All images were pseudo-randomized, with target or novel stimuli never occurring twice in a row. All stimuli were presented centrally for 500 ms on a black background, with a white fixation cross appearing during inter-stimulus intervals. The stimuli were presented on an Intel Core2 Quad computer, using Presentation software (Neurobehavioral Systems, Inc., Albany, CA, USA). The images occupied a maximum of 11.4° of visual angle vertically and 16.2° of visual angle horizontally. The inter-stimulus interval varied from 1050 to 1450 ms, with an average of 1200 ms. The task consisted of 40 unique aversive images (with 10 images being repeated twice, resulting in a total of 50 aversive images), 50 unique neutral images, 50 unique targets, and 140 unique “standard” images which repeated throughout the experiment. Total task time was 25 min, divided up into 10 time blocks of approximately two and a half minutes each. Here we report on the results obtained from the target trials only. Results for the novel stimuli will be presented elsewhere.
Electrophysiological Recording
The EEG was recorded from 30 electrode positions (Fp1, Fp2, F7, F3, Fz, F4, F8, FT7, FC3, FCz, FC4, FT8, T7, C3, Cz, C4, T8, TP7, CP3, CPz, CP4, TP8, P7, P3, Pz, P4, P8, O1, Oz, and O2) using an elastic cap (Electro-Cap International Inc.). The right mastoid served as the reference electrode and AFz as the ground. Bipolar recordings of the vertical and horizontal electro-oculogram were obtained by electrodes placed above and below the right eye and on the outer canthus of each eye, respectively. The EEG and electro-oculogram were amplified, bandpass filtered between 0.15 and 70 Hz (notch filter at 60 Hz), and digitized at 500 Hz. The EEG was acquired with a Neuroscan 4.3 (Neurosoft, Inc., Sterling, VA, USA) system and analyzed with Neuroscan Edit 4.4 and custom MATLAB scripts built on the open source EEGLAB (Delorme and Makeig, 2004) and FieldTrip (Oostenveld et al., 2011) toolboxes.
Behavioral Data Analysis
Behavioral performance measures consisted of the percentage of correctly detected targets (hit rate) and the time needed to respond correctly to targets (reaction time). Only button-press responses occurring between 200 and 1000 ms after target onset were considered correct responses.
EEG Data Analysis
Electroencephalography data sets from each participant were corrected for eye-movements using regression analysis as implemented in Neuroscan Edit 4.4 (Semlitsch et al., 1986) Continuous EEG data from all channels were subsequently segmented into epochs ranging from 4 s before target stimulus onset to 4 s after onset. The extended length of the epochs was necessary in order to perform the time–frequency analyses. EEG epochs associated with incorrect behavioral responses and responses occurring faster than 200 ms or slower than 1000 ms after target onset and containing amplitudes exceeding ±100 μV at any scalp electrode were excluded. Finally, epochs containing abnormally distributed data (i.e., joint probability or kurtosis >5 SD from expected mean values) were rejected. Extended infomax independent component analysis (ICA) using a weight change <10-7 as stop criterion was applied to the continuous data of one subject to remove heart rate artifact (Jung et al., 2000). Independent components representing heart rate were removed from the EEG data by back-projecting all but these components. Channel F7 was interpolated on two subjects and channel FP1 was interpolated on another subject to remove artifact caused by faulty electrodes. After data pre-processing, an average of 41 trials for the FR group and 45 trials for the control group remained for final analysis [F(1,52) = 4.57, p = 0.037].
Time-domain computations
Baseline correction was implemented by subtracting the average amplitude computed from the 200-ms interval immediately preceding the stimulus onset from each epoch. ERPs were obtained by averaging the baseline corrected EEG epochs for targets of each participant. After filtering the data with a low-pass 15 Hz filter an automatic peak detection procedure identified the most positive peak ranging from 300 to 700 ms to quantify the P3 amplitudes. A second time window identified the most positive peak ranging from 150 to 300 ms to quantify the P2 amplitudes1. Both peaks were identified on electrode channels F3, Fz, F4, C3, Cz, C4, P3, Pz, and P4 and were then manually checked to ensure correct selection.
Time–frequency computations
Time–frequency analysis was performed using a complex Morlet wavelet transform as implemented by the FieldTrip toolbox for MATLAB. Conceptually, a Morlet wavelet transformation is related to a windowed short-term Fourier transformation. By applying the wavelet transform to successive intervals of EEG data, both temporal and spectral information can be extracted from the signal. The Morlet wavelet f(t) is obtained by multiplying a complex sinusoidal waveform with a Gaussian envelope. The Morlet wavelet is characterized by a center frequency f0, a temporal SD σt, a center position tc and a width W:  , and f is zero otherwise. The Morlet wavelet is simultaneously localized in time (σt) and frequency (σf). These quantities are related as σt = 1/(2πσf), therefore an increased temporal specificity of the transform compromises spectral specificity, and vice versa. In the time–frequency literature (see Roach and Mathalon, 2008, for an overview), the parameters σt and the width W of the wavelet are commonly expressed in terms of two parameters: c = f0/σf = 2π(σt/T0) (or 2π multiplied by the number of cycles that fit in the Gaussian envelope) and m = W/σt, which is the width of the wavelet in terms of the width of the Gaussian envelope. In this analysis we used c = 7 (more than one cycle in the Gaussian envelope) and m = 3 (a wavelet width that is three times the length of the Gaussian envelope). These values represent an appropriate tradeoff between frequency and time resolution (Roach and Mathalon, 2008).
The Morlet wavelet was convolved with the EEG data at specified time (tc) and frequency (f0) center points, yielding for each trial n a wavelet spectrogram WSn(tc, f0); a two dimensional matrix of complex values. The measure of TP, as a function of frequency and time relative to stimulus onset, was derived by taking the squared absolute value of each point in the wavelet spectrogram and subsequently averaging across trials. We also estimated the PLF, which quantifies phase consistency across trials in response to the event (Tallon-Baudry et al., 1996). To calculate PLF, for each trial the complex value of the wavelet spectrogram is normalized to unit length and averaged across trials, taking the absolute value of the product. In mathematical terms:  , here Nt is the number of trials and |. | denotes the absolute value. A PLF of 1 represents complete phase coherence, whereas a value of 0 reflects a completely random distribution of phases across trials. The measure of EP was obtained by applying the Morlet wavelet transformation to the averaged ERP calculated using epochs aligned to the onset of the visual targets.
The time–frequency analysis procedure was applied using a 1300-ms (ranging from −500 ms before to 800 ms after) window within each epoch, whose location was shifted in steps of 10 ms. The wavelet’s central frequencies f0 ranged from 1.5 to 60 Hz in 0.5 Hz steps. In order to highlight changes in TP, it was divided by the mean baseline TPbaseline (the power in the 500-ms preceding stimulus onset, averaged across trials) and expressed in decibels, specifically 10 log10 (TP/TPbaseline). Therefore, the color scale in the TP figures reflects the deviation of the power from the baseline in decibels at each frequency and time point from the stimulus. For each subject, the maximum value of TP, PLF, and EP was identified during an early (150–300 ms) and a later (300–700 ms) time window after target onset at electrode locations F3, Fz, F4, C3, Cz, C4, P3, Pz, and P4. These two analyses windows were centered on the maxima of the P2 and the P3 peak respectively. Five frequency bands were analyzed: 1.5–3.5 Hz (delta), 4–8 Hz (theta), 8–16 Hz (alpha), 16–30 Hz (beta), and 30–50 Hz (gamma). These frequency windows were selected a priori based on the well know “natural frequencies” that occur in the brain in response to various cognitive functions (Basar et al., 2001). For each subject the TP, PLF, and EP mean values were quantified as the mean value in a window surrounding the TP, PLF, and EP peak. The window width was specifically tailored to each frequency band with slower oscillating bands having a larger window width than faster oscillating ones (i.e., ±95 ms for delta, ±75 ms for theta, ±50 ms for alpha, ±30 ms for beta, and ±20 ms for gamma).
Statistical Analysis
All statistical analyses were performed using SPSS (SPSS Inc., Chicago, IL, USA). In order to cope with the different correlations between electrode sites (Vasey and Thayer, 1987) individual means and latencies of EP, PLF, and TP for each frequency band of interest were subjected to a repeated measure multivariate analyses of variance (MANOVA) with Region (Frontal, Central, Parietal) and Laterality (Left, Middle, Right) as the within-subjects factors and Group as the between subjects factor. Follow-up separate ANOVAs were conducted for each electrode position to examine further the main effect of group for that electrode position. ERP amplitude and latency measures were subjected to the same analysis. Cohen’s d was computed to determine effect sizes if results on individual electrodes were significant.
Results
Performance Data
Table 2 shows behavioral performance data for both subject groups. Reaction times to target stimuli did not differ between groups [F(1,52) = 0.87, p = 0.356] but subjects with a FR for schizophrenia had a significant lower hit rate to target stimuli [F(1,52) = 8.90, p = 0.004] than the HC group.
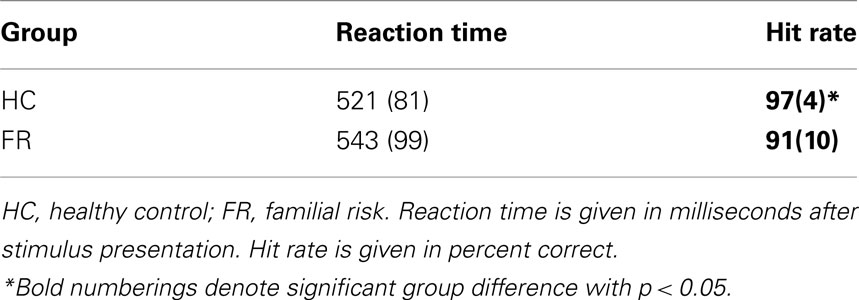
Table 2. Means and SD (in parentheses) of behavioral performance data.
Time-Domain Data
Figure 1 depicts the ERPs to target stimuli at electrodes F3, Fz, F4, C3, Cz, C4, P3, Pz, and P4 for both groups.
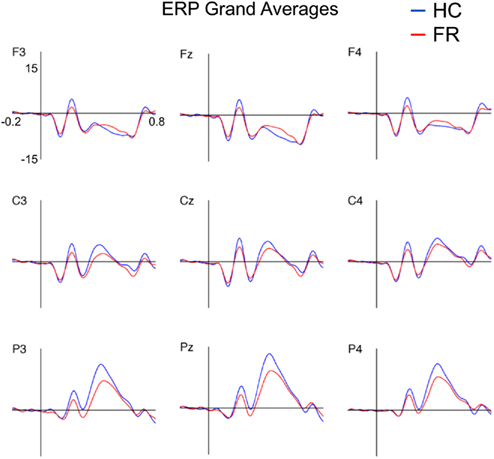
Figure 1. Grand-average event-related potentials to targets (15 Hz low-pass filtered) for the healthy control (HC) and familial risk (FR) groups for electrodes F3, Fz, F4, C3, Cz, C4, P3, Pz, and P4. Amplitude is indicated on the y-axis and ranges from +20 to −10 μV (positive plotted upward). Time is indicated on the x-axis and ranges from −0.2 to 0.8 s. Target onset is at time = 0 s.
P2
P2 peak amplitude was larger at the central and parietal electrode locations than at the frontal electrode locations [F(2,51) = 10.81, p < 0.001], and was larger at the midline electrode locations than at the lateral electrode locations [F(2,51) = 7.68, p = 0.001] for both groups. Post hoc analyses revealed that P2 amplitude was significantly smaller in the FR group than in the HC group on electrode locations: F3 [F(1,52) = 5.42, p = 0.024; d = 0.65], Fz [F(1,52) = 4.67, p = 0.035; d = 0.60], F4 [F(1,52) = 5.83, p = 0.020; d = 0.67], C3 [F(1,52) = 5.89, p = 0.019; d = 0.68], C4 [F(1,52) = 4.73, p = 0.034; d = 0.61], Cz [F(1,52) = 4.58, p = 0.037; d = 0.60], P3 [F(1,52) = 5.59, p = 0.022; d = 0.66], and Pz [F(1,52) = 5.65, p = 0.021; d = 0.66]. There were no group effects observed for P2 latency at these electrode locations.
P3
The P3 amplitude showed the characteristic scalp distribution with a parietal maximum [F(2,51) = 86.04, p < 0.001] and midline amplitudes being larger than lateral amplitudes [F(2,51) = 12.40, p < 0.001] for both groups (e.g., Duncan-Johnson and Donchin, 1977). Post hoc analyses showed that the P3 amplitude was larger in the HC group than in the FR group for the parietal electrode locations only: P3 [F(1,52) = 4.68, p < 0.035; d = 0.60], Pz [F(1,52) = 4.40, p < 0.041; d = 0.59], P4 [F(1,52) = 5.32, p = 0.025; d = 0.64]. No differences in P3 latency were observed. Means and SD of the P2 and the P3 amplitude and latency for nine electrode channels are listed in Table A1 in Appendix.
Time–Frequency Data
Figures 2–4 depict group comparisons of EP, PLF, and TP for both groups. Since group differences in EP, PLF, and TP were most prominent in the lower frequency ranges we restricted our statistical analyses to the delta, theta and alpha frequency ranges. Means and latencies for the EP, PLF, and TP peaks for the early (150–300 ms) and late (300–700 ms) time windows were assessed across delta, theta, and alpha frequency bands at nine electrode positions are listed in Tables A2 and A3 in Appendix.
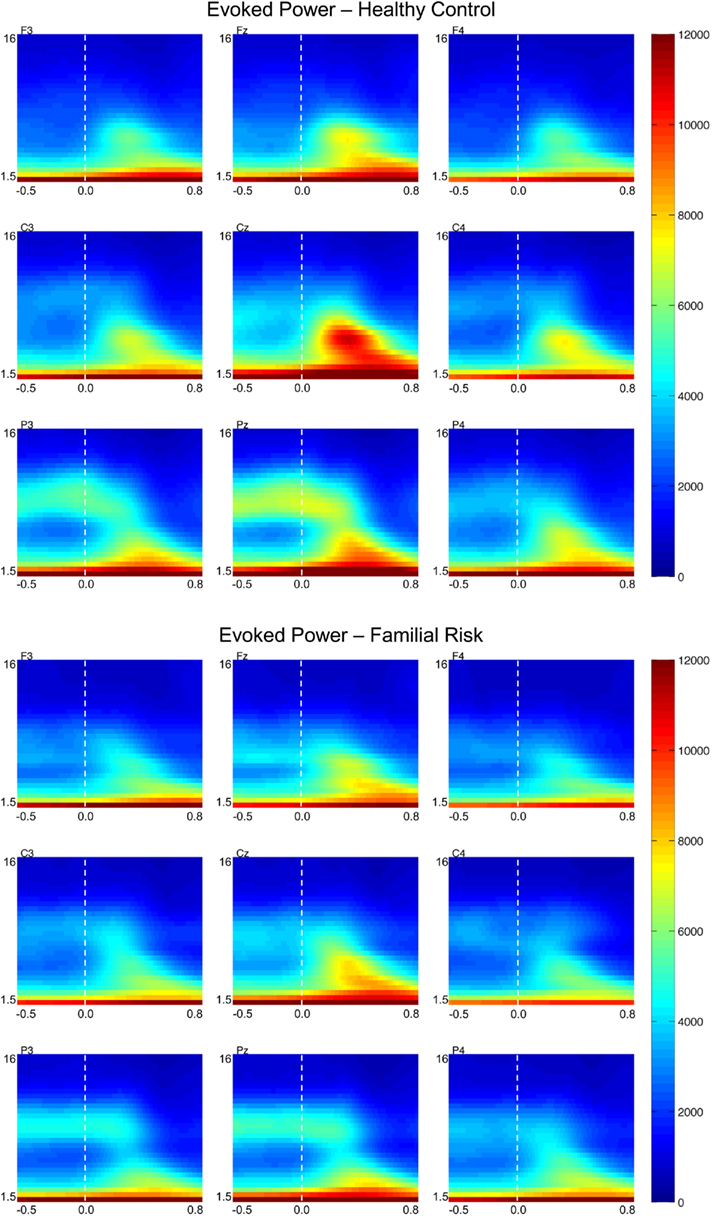
Figure 2. Grand-average evoked power (EP) time–frequency transformations for healthy control (HC) and familial risk (FR) groups at electrodes F3, Fz, F4, C3, Cz, C4, P3, Pz, and P4. EEG frequency is indicated on the y-axis for all panels ranging from 1.5 Hz to 16 Hz. Time is indicated on the x-axis and ranges from −0.5 to 0.8 s. Target onset is at time = 0.0 s. EP value is indicated on the far right and ranges from 0 to 12000. Greater EP values with respect to target onset are shown in warm colors.
Evoked power
Figure 2 shows EP plots for nine electrode locations for both groups. Group differences in EP values were observed in the theta frequency range only. For both groups EPtheta in the early time window was largest at the central electrode locations [F(2,51) = 10.50, p < 0.001] and was larger at the midline electrode positions compared to the lateral electrode positions [F(2,51) = 90.57, p < 0.001]. Post hoc analyses showed that compared to the HC group EPtheta was significantly reduced in the FR group on electrode position Pz only [F(1,52) = 5.27, p = 0.026; d = 0.64]. EPtheta in the later time window was also largest at the central electrode locations [F(2,51) = 11.98, p < 0.001] and was larger at the midline electrode position compared to the lateral electrode locations [F(2,51) = 95.10, p < 0.001]. Post hoc analyses showed that compared to the HC group EPtheta was significantly reduced in the FR group on electrode position Pz only [F(1,52) = 4.98, p = 0.030; d = 0.62]. There were no group differences in EPtheta peak latency during the early time window but during the later time window EPtheta peaked slightly earlier in the HC group than in the FR group on electrode positions Cz [F(1,52) = 4.43, p = 0.040; d = −0.57] and Pz [F(1,52) = 4.20, p = 0.045; d = −0.58].
Phase-locking factor
Figure 3 shows PLF plots for nine electrode locations for both groups. Group differences in PLF values were also confined to the theta frequency range. For both groups PLFtheta during the earlier time window was largest across the central electrode locations [F(2,51) = 35.02, p < 0.001] and was smaller at the left electrode locations compared to the central and right electrode locations [F(2,51) = 21.95, p < 0.001]. Post hoc analyses showed that PLFtheta during the early time window was significantly smaller in the FR group than in the HC group on electrode locations F3 [F(1,52) = 4.47, p = 0.039; d = 0.59], Fz [F(1,52) = 4.58, p = 0.037; d = 0.60], F4 [F(1,52) = 5.38, p = 0.024; d = 0.65], C3 [F(1,52) = 4.72, p = 0.034; d = 0.61], Cz [F(1,52) = 6.27, p = 0.015; d = 0.70], and C4 [F(1,52) = 4.67, p = 0.035; d = 0.60]. PLFtheta during the later time window was also largest at the central electrode locations [F(2,51) = 23.89, p < 0.001] and was smaller at the left electrode locations compared to the central and right electrode locations [F(2,51) = 9.58, p < 0.001] for both groups. Post hoc analyses showed that PLFtheta during the later time window was significantly smaller in the FR group than in the HC group on electrode locations F3 [F(1,52) = 4.16, p = 0.046; d = 0.57], Fz [F(1,52) = 5.29, p = 0.025; d = 0.64], F4 [F(1,52) = 7.04, p = 0.011; d = 0.74], C3 [F(1,52) = 4.03, p = 0.050; d = 0.56], and Cz [F(1,52) = 5.55, p = 0.022; d = 0.66]. There were no group effects observed for PLFtheta latency at these electrode locations during either the early or the later time window.
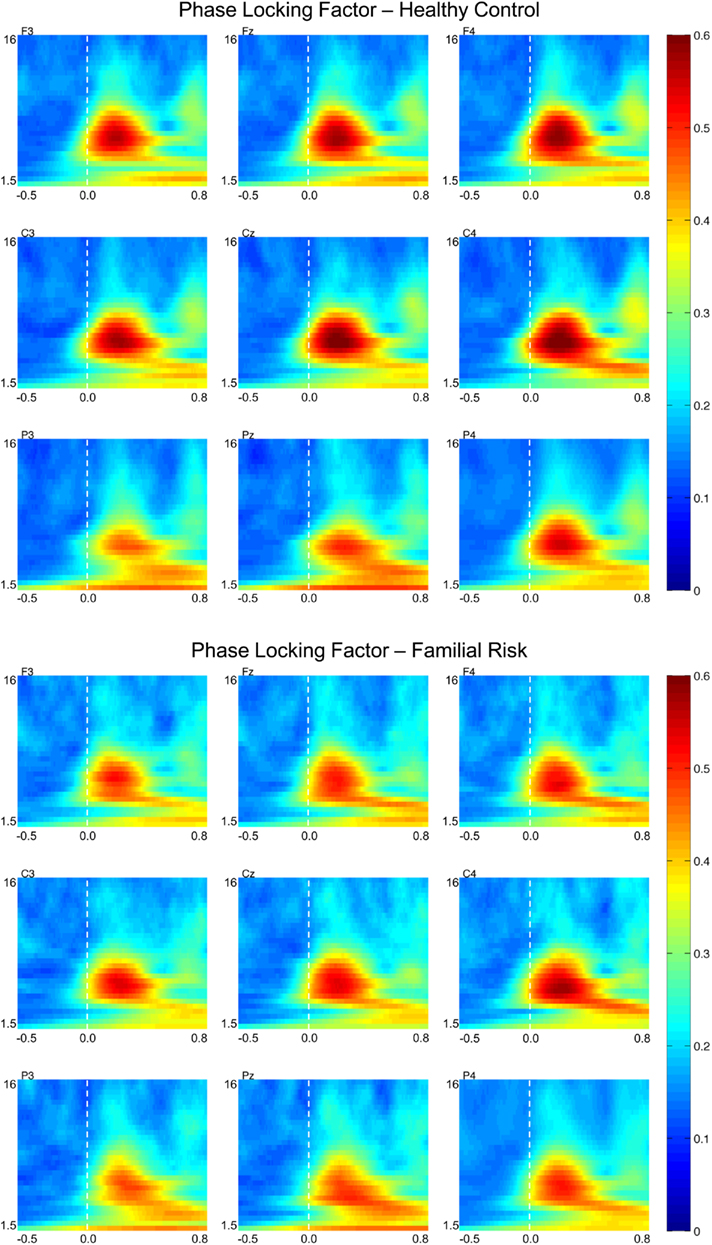
Figure 3. Grand-average phase-locking factor (PLF) time–frequency transformations for healthy control (HC) and familial risk (FR) groups at electrodes F3, Fz, F4, C3, Cz, C4, P3, Pz, and P4. EEG frequency is indicated on the y-axis for all panels ranging from 1.5 Hz to 16 Hz. Time is indicated on the x-axis and ranges from −0.5 to 0.8 s. Target onset is at time = 0.0 s. PLF value is indicated on the far right and ranges from 0 to 0.6. Greater PLF values with respect to target onset are shown in warm colors.
Total power
Figure 4 shows TP plots for nine electrode locations for both groups. Group differences in TP values were observed in the alpha frequency range only. For both groups TPalpha during the early time window was most negative (i.e., reduced compared to baseline activity) at the parietal electrode locations [F(2,51) = 22.76, p < 0.001] and was more negative at the left and right electrode positions compared to the midline electrode positions [F(2,51) = 9.59, p < 0.001]. Post hoc analyses showed that TPalpha in the earlier time window was significantly less negative in the FR group than in the HC group on electrode positions P3 [F(1,52) = 7.08, p = 0.010; d = −0.74], Pz [F(1,52) = 7.01, p = 0.11; d = −0.74], and P4 [F(1,52) = 5.59, p = 0.022; d = −0.66]. TPalpha during the later time window was also most negative (i.e., reduced compared to baseline activity) at the parietal electrode locations [F(2,51) = 90.91, p < 0.001] and more negative at the left and right electrode positions than at the midline electrode positions [F(2,51) = 3.99, p = 0.021] for both groups. Post hoc analyses showed that TPalpha in the later time window was significantly less negative in the FR group than in the HC group on electrode position Pz only [F(1,52) = 5.07, p = 0.029; d = −63]. There were no group effects observed for TPalpha peak latency at these electrode locations during either the early or the later time window.
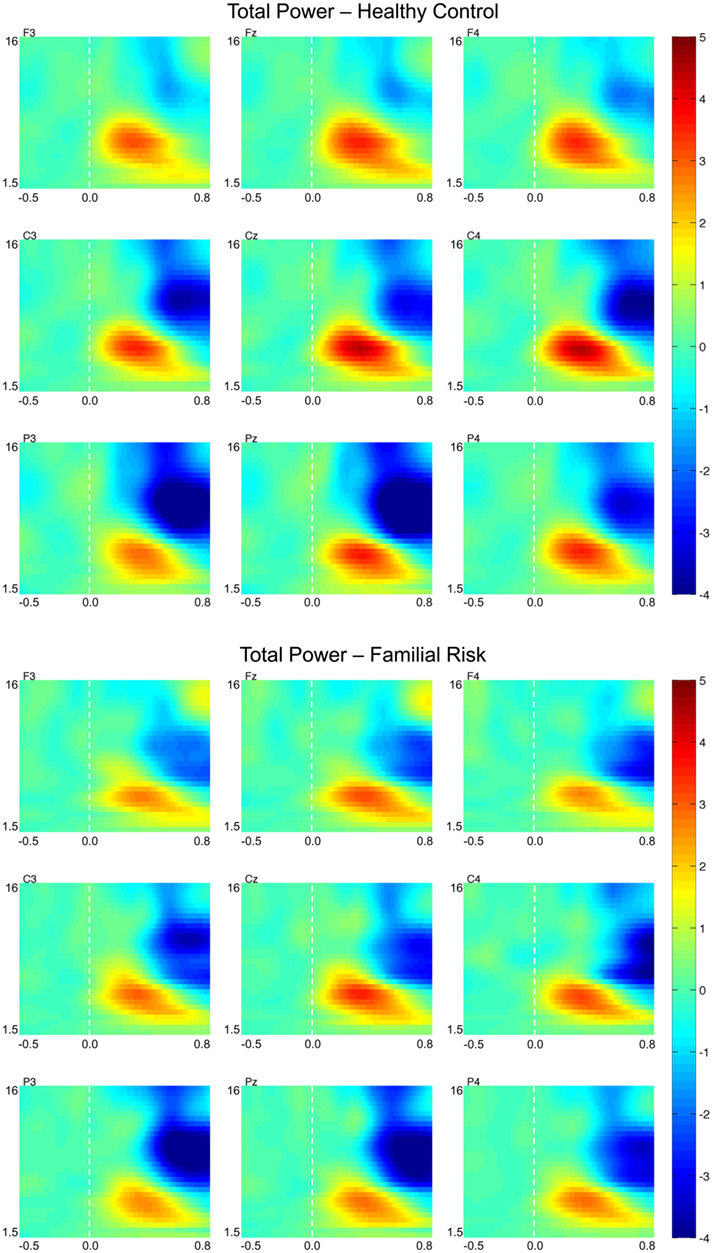
Figure 4. Grand-average total power time–frequency transformations for healthy control (HC) and familial risk (FR) groups at electrodes F3, Fz, F4, C3, Cz, C4, P3, Pz, and P4. EEG frequency is indicated on the y-axis for all panels ranging from 1.5 Hz to 16 Hz. Time is indicated on the x-axis and ranges from −0.5 to 0.8 s. Target onset is at time = 0.0 s. TP value is indicated on the far right and ranges from −4 to 5. Greater TP values with respect to target onset are shown in warm colors.
Additional Analyses
In order to determine if there was a relationship between clinical variables and the electrophysiological measures, we computed correlations between the SOPS scores (positive, negative, organizational, and general scales) and the P2, P3, EP, PLF, and TP peaks for the delta, theta and alpha frequency bands for both groups. However, none of these correlations were significant below a p-level of 0.01.
To differentiate the effects of comorbidity in the FR group, all analyses were also conducted on a subgroup that had no other psychopathologies. In spite of the fact that the remaining FR group was small (N = 10) our most important result remained stable. That is, PLF in the theta frequency range was still significantly smaller across the majority of the frontal and central electrode positions during both the early time window: F3 [F(1,38) = 3.22, p = 0.080], Fz [F(1,38) = 4.13, p = 0.049], F4 [F(1,38) = 4.78, p = 0.035], C3 [F(1,38) = 4.58, p = 0.039], Cz [F(1,38) = 4.85, p = 0.034] and C4 [F(1,38) = 4.43, p = 0.042] and the later time window: F3 [F(1,38) = 2.97, p = 0.093], Fz [F(1,38) = 4.00, p = 0.053], F4 [F(1,38) = 6.30, p = 0.016], C3 [F(1,38) = 4.30, p = 0.045], Cz [F(1,38) = 4.21, p = 0.047] and C4 [F(1,38) = 4.71, p = 0.036].
Discussion
The aim of this study was to examine whether neurophysiological response patterns associated with executive processing in a group of adolescents at FR for schizophrenia would differ from a group of adolescents without such risk. We examined traditional time-domain measures and wavelet based time–frequency domain measures of EEG data obtained during target trials in a visual oddball task. The results demonstrated that adolescents at FR for schizophrenia process target stimuli in an oddball task differently from healthy control subjects. The ERP results showed that the FR group had diminished P2 amplitudes across the frontal and central electrode locations as well as diminished P3 amplitudes across the parietal electrode locations compared to the healthy control (HC) group. Wavelet transformation of the averaged ERP to target trials showed that EP in the theta frequency range (4–8 Hz) was significantly reduced in the FR group at the midline parietal electrode location. Wavelet transformation of the single-trial target data showed that PLF in the theta frequency range was significantly smaller in the FR group than in the HC group across central and frontal electrode locations. The single-trial based TP computations did not show differences between groups in the theta frequency range but showed differences in the alpha frequency range instead. The FR group exhibited less of a reduction in alpha TP after target stimulus occurrence at parietal electrode locations than the HC group.
Significant group effects were observed in the P2 and P3 ERPs amplitude measures and in theta range EP and theta range PLF, but not in theta range TP. This finding suggests that weaker theta synchronization across target trials in the FR group is driving the observed differences as opposed to a decrease in the strength of the theta signal. Scalp topography of theta EP had a more posterior maximum whereas theta PLF had a more anterior maximum, suggesting that these measures are not reflecting identical processes. In spite of the fact that both measures are biased toward phase-locked EEG activity they could be reflective of a different cognitive and/or different neuroelectric process. On the other hand, a difference in scalp topography alone is not sufficient to assume a different neuroelectric source is driving them. Activity generated by the same neuroelectrical source could manifest itself on the scalp surface as being different by means of volume conduction effects. The functional meaning of the P2 ERP in visual task paradigms is ill-described but has been related to stimulus categorization processes (e.g., Pernet et al., 2003), while the P3 ERP has been associated with attention and memory processes (Donchin and Coles, 1998; Polich and Herbst, 2000). Both theta PLF and theta EP were reduced in the FR group in the absence of a reduction in theta TP, suggesting that cortical theta band timing with respect to stimulus presentation may be impaired and not the production of theta band activity. Theta band activity after target detection has been related to processes associated with focused attention and signal detection (e.g., Basar-Eroglu et al., 1992). Yordanova et al. (2000) have proposed that theta activity is related to cortico-hippocampal feedback loops related to the evaluation of stimuli that become activated in case of physical context deviations, which may lead to a subsequent controlled processing in the frontal cortex. Abnormal neural synchrony has been associated with aberrant neurodevelopmental changes that alter myelination and affect synchronous brain function. Accordingly, multiple genetic and environmental factors may interfere with the neurodevelopmental processes, resulting in a dysregulation of the complementary changes occurring in gray and white matter. These changes result in insufficient capacity to maintain temporal synchrony of widely distributed neural networks (Bartzokis, 2002). More recent studies have further demonstrated that a core deficit in fronto-temporal connectivity may indeed be associated with abnormal theta band synchronization in schizophrenia (Sigurdsson et al., 2010). Hence the smaller P2 and P3 amplitude and reduced theta activity observed in the FR group may be indicative of impaired stimulus categorization and/or attention allocation processes in this group and may reflect neurodevelopmental abnormalities in fronto-temporal connectivity.
It remains to be determined if abnormalities in fronto-temporal connectivity is really the cause of our observed findings, but our results are not in disagreement with such an account. If there is a malfunction in the feedback loop between frontal and hippocampal brain areas, a reduction in theta band inter-trial phase synchrony such as we reported here may be expected. The observation that alpha TP after target onset was reduced less in the FR group than in the HC group is not necessarily inconsistent with the observation of reduced theta findings. A reduction in alpha TP might actually be indicative of an increase in activation of the underlying neural sources. Since our task required visual attention to target stimuli it can be expected that cortical areas involved in the processing of visual stimuli should become more active after a visual stimulus is being presented. TP reductions in the alpha frequency range were progressively larger at electrode positions close to the visual cortex than at electrodes farther removed from it. The HC group might be better able to allocate their attention to the visual target stimulus and hence alpha activity was more suppressed in the short period that follows stimulus presentation in this group than it was in the FR group. This effect was primarily observed for the alpha TP measure and not for the alpha EP or PLF measures suggesting that it is the strength of the alpha activity, not its timing that is diminished in response to the occurrence of a visual stimulus.
The present results are in line with previous findings demonstrating that patients with full blown schizophrenia show reduced P3 amplitudes as well as reduced low-frequency EEG activity during target processing in oddball tasks compared to healthy control groups (e.g., Roschke and Fell, 1997; Ergen et al., 2008; Ford et al., 2008; Doege et al., 2009). Our findings extend these observations to adolescents at FR for schizophrenia and therefore hold promise to unfold the pathophysiology of the illness. It is important to acknowledge some limitations to the present study. First, group sizes were relatively small, and the findings require replication in larger subject samples before firm conclusions can be drawn. Second, the results might be compromised by confounding comorbid disorders. Finally, this cross-sectional study does not address the predictive value of the observed findings for illness onset in populations at FR for psychotic illness. Longitudinal follow-up will determine the true predictive value of our findings.
Conflict of Interest Statement
Dr. Perkins is currently receiving grant support from Janssen, and is a consultant to Dainippon. In the last 12 months, Dr. Perkins is or has been on speaker’s bureau for Eli Lilly and AstraZeneca. In the past, Dr. Perkins has received grants from AstraZeneca, Bristol-Myers Squibb, Otsuka, Eli Lilly, Janssen and Pfizer; and consulting and educational fees from AstraZeneca, Bristol-Myers Squibb, Eli Lilly, Janssen, Glaxo Smith Kline, Forest Labs, Pfizer and Shire. All other authors declare no biomedical financial interests or potential conflict of interest.
Acknowledgments
We thank Erin Douglas, M.S., Kathleen Monforton, B.S., and Carolyn Bellion, M.A. for their contributions to participant recruitment and clinical assessment. Nicholas Musisca, M.A., Nathaniel Lucena, M.A., and Josh Bizzell, M.S. contributed to data collection and/or analysis. We thank Zoë Englander, B.S. and Paul Tiesinga, Ph.D for their contribution to the development of the time-frequency analysis pipeline. Hongbin Gu, Ph.D. provided consultation on statistic alanalysis. We thank the two reviewers for their valuable comments on an earlier version of the manuscript. Finally, we would like to thank the children and their families for participating in this study. This study was supported by Conte center grant P50MH064065 from the National Institute of Mental Health.
Footnote
- ^Based on previous research in adults with schizophrenia our main ERP of interest was the P3 ERP. Since our data also seemed to show a group difference around the time of the P2 peak we also quantified group differences in this earlier time window.
References
Bartzokis, G. (2002). Schizophrenia: breakdown in the well-regulated lifelong process of brain development and maturation. Neuropsychopharmacology 27, 672–683.
Basar, E., Schurmann, M., Demiralp, T., Basar-Eroglu, C., and Ademoglu, A. (2001). Event-related oscillations are “real brain responses”-wavelet analysis and new strategies. Int. J. Psychophysiol. 39, 91–127.
Basar-Eroglu, C., Basar, E., Demiralp, T., and Schurmann, M. (1992). P300-response: possible psychophysiological correlates in delta and theta frequency channels. A review. Int. J. Psychophysiol. 13, 161–179.
Bramon, E., Mcdonald, C., Croft, R. J., Landau, S., Filbey, F., Gruzelier, J. H., Sham, P. C., Frangou, S., and Murray, R. M. (2005). Is the P300 wave an endophenotype for schizophrenia? A meta-analysis and a family study. Neuroimage 27, 960–968.
Cannon, T. D. (2005). Clinical and genetic high-risk strategies in understanding vulnerability to psychosis. Schizophr. Res. 79, 35–44.
Delorme, A., and Makeig, S. (2004). EEGLAB: an open source toolbox for analysis of single-trial EEG dynamics including independent component analysis. J. Neurosci. Methods 134, 9–21.
Demiralp, T., and Ademoglu, A. (2001). Decomposition of event-related brain potentials into multiple functional components using wavelet transform. Clin. Electroencephalogr. 32, 122–138.
Demiralp, T., Yordanova, J., Kolev, V., Ademoglu, A., Devrim, M., and Samar, V. J. (1999). Time-frequency analysis of single-sweep event-related potentials by means of fast wavelet transform. Brain Lang. 66, 129–145.
Doege, K., Bates, A. T., White, T. P., Das, D., Boks, M. P., and Liddle, P. F. (2009). Reduced event-related low frequency EEG activity in schizophrenia during an auditory oddball task. Psychophysiology 46, 566–577.
Donchin, E., and Coles, M. G. H. (1998). Context updating and the P300. Behav. Brain Sci. 21, 149–168.
Duncan-Johnson, C. C., and Donchin, E. (1977). On quantifying surprise: the variation of event-related potentials with subjective probability. Psychophysiology 14, 456–467.
Ergen, M., Marbach, S., Brand, A., Basar-Eroglu, C., and Demiralp, T. (2008). P3 and delta band responses in visual oddball paradigm in schizophrenia. Neurosci. Lett. 440, 304–308.
Feinberg, I. (1982). Schizophrenia: caused by a fault in programmed synaptic elimination during adolescence? J. Psychiatr. Res. 17, 319–334.
Fish, B., Marcus, J., Hans, S. L., Auerbach, J. G., and Perdue, S. (1992). Infants at risk for schizophrenia: sequelae of a genetic neurointegrative defect. A review and replication analysis of pandysmaturation in the Jerusalem Infant Development Study. Arch. Gen. Psychiatry 49, 221–235.
Ford, J. M., Roach, B. J., Hoffman, R. S., and Mathalon, D. H. (2008). The dependence of P300 amplitude on gamma synchrony breaks down in schizophrenia. Brain Res. 1235, 133–142.
Friedman, D., Cornblatt, B., Vaughan, H. Jr., and Erlenmeyer-Kimling, L. (1988). Auditory event-related potentials in children at risk for schizophrenia: the complete initial sample. Psychiatry Res 26, 203–221.
Huttenlocher, P. R. (1979). Synaptic density in human frontal cortex – developmental changes and effects of aging. Brain Res. 163, 195–205.
Jeon, Y. W., and Polich, J. (2003). Meta-analysis of P300 and schizophrenia: patients, paradigms, and practical implications. Psychophysiology 40, 684–701.
Jung, T. P., Makeig, S., Humphries, C., Lee, T. W., Mckeown, M. J., Iragui, V., and Sejnowski, T. J. (2000). Removing electroencephalographic artifacts by blind source separation. Psychophysiology 37, 163–178.
Keshavan, M., Montrose, D. M., Rajarethinam, R., Diwadkar, V., Prasad, K., and Sweeney, J. A. (2008). Psychopathology among offspring of parents with schizophrenia: relationship to premorbid impairments. Schizophr. Res. 103, 114–120.
Keshavan, M. S., Anderson, S., and Pettegrew, J. W. (1994). Is schizophrenia due to excessive synaptic pruning in the prefrontal cortex? The Feinberg hypothesis revisited. J. Psychiatr. Res. 28, 239–265.
Kolev, V., Demiralp, T., Yordanova, J., Ademoglu, A., and Isoglu-Alkac, U. (1997). Time-frequency analysis reveals multiple functional components during oddball P300. Neuroreport 8, 2061–2065.
Kolev, V., and Yordanova, J. (1997). Analysis of phase-locking is informative for studying event-related EEG activity. Biol. Cybern. 76, 229–235.
Lang, P. J., Bradely, M. M., and Cuthbert, B. N. (2005). International Affective Picture System (IAPS): Digitized Photographs, Instruction Manual and Affective Ratings. Technical Report A-6. Gainesville, FL: The Center for Research in Psychophysiology, University of Florida.
Makeig, S., Debener, S., Onton, J., and Delorme, A. (2004). Mining event-related brain dynamics. Trends Cogn. Sci. 8, 204–210.
Marcus, J., Hans, S. L., Auerbach, J. G., and Auerbach, A. G. (1993). Children at risk for schizophrenia: the Jerusalem Infant Development Study. II. Neurobehavioral deficits at school age. Arch. Gen. Psychiatry 50, 797–809.
Marshall, W. A., and Tanner, J. M. (1969). Variations in pattern of pubertal changes in girls. Arch. Dis. Child. 44, 291–303.
Marshall, W. A., and Tanner, J. M. (1970). Variations in the pattern of pubertal changes in boys. Arch. Dis. Child. 45, 13–23.
Maxwell, M. E. (1992). Manual for the FIGS (Family Interview for Genetic Studies). Bethesda, MD: Clinical Neurogenetics Branch, Intramural Research Program, National Institute of Mental Health.
McNeil, T. F., Cantor-Graae, E., and Cardenal, S. (1993). Prenatal cerebral development in individuals at genetic risk for psychosis: head size at birth in offspring of women with schizophrenia. Schizophr. Res. 10, 1–5.
Miller, T. J., Mcglashan, T. H., Woods, S. W., Stein, K., Driesen, N., Corcoran, C. M., Hoffman, R., and Davidson, L. (1999). Symptom assessment in schizophrenic prodromal states. Psychiatr. Q. 70, 273–287.
Oostenveld, R., Fries, P., Maris, E., and Schoffelen, J. M. (2011). FieldTrip: open source software for advanced analysis of MEG, EEG, and invasive electrophysiological data. Comput. Intell. Neurosci. 2011, 156869.
Orvaschel, H., Puig-Antich, J., Chambers, W., Tabrizi, M. A., and Johnson, R. (1982). Retrospective assessment of prepubertal major depression with the Kiddie-SADS-e. J. Am. Acad. Child Psychiatry 21, 392–397.
Pernet, C., Basan, S., Doyon, B., Cardebat, D., Demonet, J. F., and Celsis, P. (2003). Neural timing of visual implicit categorization. Brain Res. Cogn. Brain Res. 17, 327–338.
Polich, J., and Herbst, K. L. (2000). P300 as a clinical assay: rationale, evaluation, and findings. Int. J. Psychophysiol. 38, 3–19.
Roach, B. J., and Mathalon, D. H. (2008). Event-related EEG time-frequency analysis: an overview of measures and an analysis of early gamma band phase locking in schizophrenia. Schizophr. Bull. 34, 907–926.
Roschke, J., and Fell, J. (1997). Spectral analysis of P300 generation in depression and schizophrenia. Neuropsychobiology 35, 108–114.
Schreiber, H., Stolz-Born, G., Kornhuber, H. H., and Born, J. (1992). Event-related potential correlates of impaired selective attention in children at high risk for schizophrenia. Biol. Psychiatry 32, 634–651.
Semlitsch, H. V., Anderer, P., Schuster, P., and Presslich, O. (1986). A solution for reliable and valid reduction of ocular artifacts, applied to the P300 ERP. Psychophysiology 23, 695–703.
Sigurdsson, T., Stark, K. L., Karayiorgou, M., Gogos, J. A., and Gordon, J. A. (2010). Impaired hippocampal-prefrontal synchrony in a genetic mouse model of schizophrenia. Nature 464, 763–767.
Spencer, K. M., and Polich, J. (1999). Poststimulus EEG spectral analysis and P300: attention, task, and probability. Psychophysiology 36, 220–232.
Tallon-Baudry, C., Bertrand, O., Delpuech, C., and Pernier, J. (1996). Stimulus specificity of phase-locked and non-phase-locked 40 Hz visual responses in human. J. Neurosci. 16, 4240–4249.
Vasey, M. W., and Thayer, J. F. (1987). The continuing problem of false positives in repeated measures ANOVA in psychophysiology: a multivariate solution. Psychophysiology 24, 479–486.
von Stein, A., Chiang, C., and Konig, P. (2000). Top-down processing mediated by interareal synchronization Proc. Natl. Acad. Sci. U.S.A. 97, 14748–14753.
Weinberger, D. R. (1987). Implications of normal brain development for the pathogenesis of schizophrenia. Arch. Gen. Psychiatry 44, 660–669.
Woods, B. T. (1998). Is schizophrenia a progressive neurodevelopmental disorder? Toward a unitary pathogenetic mechanism. Am. J. Psychiatry 155, 1661–1670.
Keywords: schizophrenia, familial risk, P300, ERP, wavelet analysis, time–frequency decomposition, theta frequency, phase-locking factor
Citation: Donkers FCL, Schwikert SR, Evans AM, Cleary KM, Perkins DO and Belger A (2011) Impaired neural synchrony in the theta frequency range in adolescents at familial risk for schizophrenia. Front. Psychiatry 2:51. doi: 10.3389/fpsyt.2011.00051
Received: 21 February 2011; Accepted: 04 August 2011;
Published online: 22 August 2011.
Edited by:
Josephine Johns, University of North Carolina at Chapel Hill, USAReviewed by:
Juliana Yordanova, Bulgarian Academy of Sciences, BulgariaLinda Mayes, Yale University, USA
Copyright: © 2011 Donkers, Schwikert, Evans, Cleary Perkins and Belger. This is an open-access article subject to a non-exclusive license between the authors and Frontiers Media SA, which permits use, distribution and reproduction in other forums, provided the original authors and source are credited and other Frontiers conditions are complied with.
*Correspondence: Franc C. L. Donkers, Department of Psychiatry, University of North Carolina at Chapel Hill, Campus Box 7160, 367 Medical School Wing C, Chapel Hill, NC 27599, USA. e-mail: franc_donkers@med.unc.edu