
- 1 Department of Experimental Psychology, Helmholtz Institute, Utrecht University, Utrecht, Netherlands
- 2 Department of Developmental Psychology, Utrecht University, Utrecht, Netherlands
- 3 Department of Child and Adolescent Psychiatry, Rudolf Magnus Institute of Neuroscience, University Medical Centre, Utrecht, Netherlands
Visual form perception is essential for correct interpretation of, and interaction with, our environment. Form perception depends on visual acuity and processing of specific form characteristics, such as luminance contrast, spatial frequency, color, orientation, depth, and even motion information. As other cognitive processes, form perception matures with age. This paper aims at providing a concise overview of our current understanding of the typical development, from birth to adulthood, of form-characteristic processing, as measured both behaviorally and neurophysiologically. Two main conclusions can be drawn. First, the current literature conveys that for most reviewed characteristics a developmental pattern is apparent. These trajectories are discussed in relation to the organization of the visual system. The second conclusion is that significant gaps in the literature exist for several age-ranges. To complete our understanding of the typical and, by consequence, atypical development of visual mechanisms underlying form processing, future research should uncover these missing segments.
Introduction
Social interaction with parents and peers, and cognitive skills such as object categorization and reading a book all depend on perception and interpretation of visual information. For instance, social interaction depends heavily on face perception and reading on perception of letters. Without visual input, or with abnormal input during development, cognitive and social skills could develop in an atypical way. Current neurocognitive models suggest that abnormal visual processing could be central to several developmental disorders that are clinically characterized by social and/or cognitive impairments (e.g., Braddick and Atkinson, 2011).
Brain areas related to social and cognitive functions depend on input from areas involved in visual processing (Bullier et al., 1996; Gogtay et al., 2004). Specific visual brain areas are related to processing of specific forms, such as faces, letters, or more basic stimuli such as squares. An example of such a visual brain area is the fusiform face area, involved in face processing (FFA; Kanwisher et al., 1997). Brain areas related to processing of forms depend on input from visual brain areas related to processing of more basic visual information, which can be referred to as stimulus or form characteristics. These characteristics include among others luminance contrast, spatial frequency (SF), orientation, color, depth, and even motion information (Figure 1), and are restricted by visual acuity. Specific aspects of a form, such as facial expressions, can only be processed if enough information, i.e., details as well as more global properties, is actually processed correctly. This information depends on spatial frequencies and luminance contrast. Likewise, eye movements, changes in emotion, but also approaching persons and objects can only be perceived via processing of depth and motion information. Many social and cognitive processes thus require typically developed processing of form characteristics (from now on referred to as form-characteristic processing).
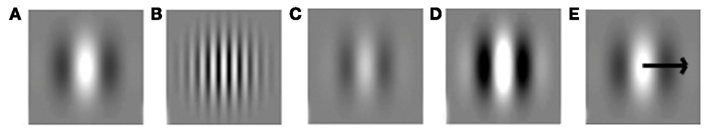
Figure 1. Visual grating stimuli often used for the investigation of processing of stimulus characteristics. (A) Low spatial frequency. (B) High spatial frequency. (C) Low luminance contrast. (D) High luminance contrast. (E) Motion.
To fully understand both typical and atypical development of processing of visual form characteristics and its relation to processing of socially relevant stimuli, a thorough understanding of its typical development is a prerequisite. Recently, Braddick and Atkinson (2011) provided a complete overview of the development of visual mechanisms underlying form-characteristic processing, with a focus on infancy. A comprehensive overview of the current knowledge on development beyond infancy, as is provided by the present paper, is required for a full understanding of the developmental trajectories of form-characteristic processing. In addition, this paper aims to serve as a guide to focus future typical developmental research to currently under-investigated age-ranges.
The visual mechanisms that will be reviewed here are those involved in low-level perception of luminance contrast, SF, color, orientation, depth, and motion (Figure 1; see Development of Visual Mechanisms Underlying Form Processing for further explanation). Since visual acuity is a prerequisite for visual perception, development of acuity will be reviewed as well1. Although the development of the to-be-discussed mechanisms is likely to be interrelated, for purpose of clarity, they will be reviewed separately (with the exception of SF and luminance contrast, which are typically investigated together). For each of the mentioned characteristics, literature on both behavioral and neurophysiological studies will be reviewed. We will describe the developmental trajectory from birth to adulthood (18 years and older). As a starting point, a general outline will be provided, which introduces how form characteristics are processed by the adult visual system, and explains the methods commonly used in developmental studies of these characteristics.
Neural Development of Visual Processing
The neural system for processing of visual form characteristics involves a hierarchy with pathways leading from the retina, through the lateral geniculate nucleus (LGN) of the thalamus, to the striate and the extrastriate cortex (Callaway, 2004; Kaplan, 2004). In the literature, the involvement of these pathways in visual form characteristic processing is typically discussed in different frameworks. One framework focuses on the specific contribution of parallel pathways, such as the M- and P-pathway, as related to SF, luminance contrast, motion, and color processing. Another framework focuses on the relative activation in feedforward versus recurrent connections, as related to integration of local information into a global form (For a more in-depth explanation, see Box 1).
Box 1. Structural and functional organization of the visual system.
The visual system, from the retina to extra-striate visual cortex, is characterized by a hierarchical organization (Figure 2). Each part of the visual system is sensitive to specific aspects of a stimulus, and two main organizing principles determine how stimulus characteristics are processed. First, features increasing in size and complexity are generally processed in increasingly higher-order visual areas. Second, processing occurs along partially independent parallel visual pathways (for critical reviews, see Nassi and Callaway, 2009; Schenk and McIntosh, 2010; de Haan and Cowey, 2011).
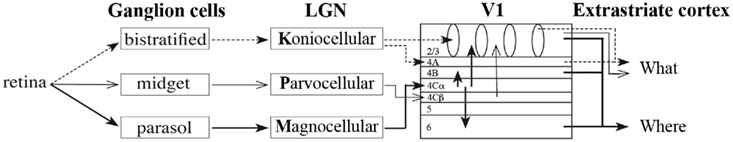
Figure 2. Schematic representation of the structure of the visual hierarchy, organized in parallel pathways.
In the visual cortex, lower areas are dedicated to the processing of stimulus details (often referred to as local information), while higher order areas are involved with information that consists of combined details (often referred to as global information). This is related to the structural organization of areas in the hierarchy: neurons in higher areas have larger receptive field (RF) sizes that cover increasingly larger parts of the stimulus and represent increasingly complex information. For example: neurons in the retina, LGN, V1 (and even some extra-striate areas) are involved in processing of stimulus features such as color, spatial frequency, and luminance contrast. Neurons in V1 and extra-striate areas (i.e., slightly higher areas in the visual hierarchy) are sensitive to orientation, depth, and motion as well. In general, neurons in areas higher in the visual hierarchy process larger parts of the stimulus, such as its general shape, which consists of local information (features) that is pooled (for a review see Nassi and Callaway, 2009). How the brain finally recognizes and categorizes forms is not yet fully understood. However, neurons in some extra-striate areas are found to be sensitive to specific forms, such as faces in the fusiform face area of the temporal lobe (Kanwisher et al., 1997). In addition, some neurons in the temporal lobe are sensitive to a very specific image, such as the Eiffel Tower (Quiroga et al., 2005).
The second organizational principle concerns the parallel visual pathways along which information is processed: the most recognized ones are the M- and P-pathways (see Figure 2). These continue into a dorsal stream toward the parietal and a ventral stream toward the temporal cortex, often referred to as the “where” and “what” pathways, respectively (Ungerleider and Mishkin, 1982). These visual pathways are each dedicated to the processing of different aspects of a visual stimulus. Cells in the M-pathway respond vigorously already at low contrasts and are tuned for lower spatial frequencies, higher temporal frequencies, and (from V1 onward) motion. This pathway processes the broad outlines of a form, which is, perhaps confusingly, also referred to as global information (see below; e.g., Carey and Diamond, 1977). Cells in the P-pathway respond more vigorously to high contrasts and are tuned for high spatial frequencies, low temporal frequencies, and color (mainly red and green). This pathway processes more local information, such as lines and details in an image. More recently, a third pathway is described, referred to as the K-pathway. This pathway also plays a role in the processing of color (mainly blue and yellow2; Callaway, 2004; Kaplan, 2004; Nassi and Callaway, 2009).
An important issue in (atypical) developmental research into object vision is the notion of local and global processing. Confusingly, “local” as well as “global” have in the literature been used for different concepts. On the one hand they are related to the size of (part of) a stimulus that is processed, related to the RF size of neurons in different brain areas of the visual hierarchy. For example, in orientation processing, multiple local details (e.g., lines) processed in V1 can be integrated into a global form in higher order areas (Braddick et al., 2000). Similarly, multiple moving elements of a stimulus (in for instance a random dot kinematogram), referred to as local motions, that are moving in the same direction and with equal speed can be integrated into (a coherently moving) global motion percept (Williams and Sekuler, 1984).
On the other hand the concepts of local and global are also related to the way stimuli are processed by the P- versus the M-pathway, which is for instance of interest in face processing (Carey and Diamond, 1977). This is related to properties of different neurons within one brain area, such as V1, and between the extrastriate pathways. When interested in P- versus M-pathway processing, specific stimulus characteristics such as spatial frequency, luminance contrast, color, and motion are typically manipulated. Often, stimuli with low spatial frequencies for instance are referred to as containing more global information and those with high spatial frequencies as containing more local information. Thus, “local” is in the literature either related to a relatively small (part of) a stimulus, or to a stimulus processed in the P-pathway, e.g., containing higher SFs. The term “global” is related to a relatively large (part of) a stimulus, or to a stimulus processed in the M-pathway, e.g., containing lower SFs.
For a long time information processing has been mainly described in terms of a feedforward direction along the visual hierarchy, as described above. Integration of details was believed to occur automatically at the moment processing arrived in higher order brain areas. However, there is increasing evidence that additional processing is required for the awareness of an integrated stimulus, namely recurrent connectivity, consisting of feedback connectivity (from higher to lower brain areas) and/or horizontal connectivity (within one brain area; Burkhalter, 1993; Burkhalter et al., 1993; Lamme et al., 1998; Roelfsema et al., 2002; Tucker and Fitzpatrick, 2004). In addition, integration of information even occurs as the result of interaction between extra-striate areas, in the so-called “where” and “what” pathways (the supposed continuations of the M- and P-pathways; Ungerleider and Mishkin, 1982; Zeki, 2001; but see Nassi and Callaway, 2009).
The neural system underlying visual processing is immature at birth in humans as well as in other animals and undergoes vast structural and functional changes during development (Hammarrenger et al., 2003; Khazipov and Luhmann, 2006). Structural changes involve for example the folding of the brain and myelinization of axons of (visual) neurons (Lenroot and Giedd, 2006; Pienaar et al., 2008). Functionally, not all neurons in the visual system are tuned for specific stimulus characteristics at birth. Some tuning is present at birth in animals (Khazipov and Luhmann, 2006) and probably in humans (Bednar and Miikkulainen, 2003; Khazipov and Luhmann, 2006). Nevertheless, animal studies showed that further development of visual processing occurs after birth and depends on external visual stimulation (Chapman and Stryker, 1993; Crair et al., 1998; Kiorpes and Movshon, 2004; White and Fitzpatrick, 2007). Development of the neural correlates of visual processing after birth in humans is most often investigated by means of electroencephalography (EEG), which will be further specified in the next section.
Techniques and Tasks in Developmental Visual Research
Studies investigating the development of visual processing typically employ specific experimental designs, using mostly behavioral or neurophysiological measures (see Table A1 in Appendix for a more in-depth description of methods used in each of the discussed studies). In behavioral studies, developmental stage is investigated by testing discriminative abilities between two stimuli with different degrees of a form characteristic, e.g., vertical versus horizontal orientation. A person is only able to see the difference between the stimuli if he or she is sensitive to the difference in both levels of the form characteristic. In infants, discriminative abilities are mainly studied by investigating whether one stimulus draws their attention more than the other stimulus. This is based on the finding that infants’ attention is typically drawn toward novel or salient stimuli. Attention is investigated using preferential looking or habituation paradigms (Teller, 1979; Atkinson et al., 1988). To investigate the discriminative abilities of older children, they are simply asked whether they perceive two stimuli as different.
Neurophysiological studies of visual development investigate stimulus characteristic processing within the early visual cortex. Unlike in animal studies, where development of the visual cortex can be studied by investigating neuronal tuning to different stimulus characteristics by means of several invasive methods, such as single unit recording and/or two-photon imaging (e.g., Crair et al., 1998; White and Fitzpatrick, 2007), stimulus characteristic processing in humans can only be measured by rather indirect measures. The main neurophysiological measure in human developmental vision research is measurement of visual evoked potentials (VEP), investigated using EEG. VEPs are averaged patterns of brain activity related to the processing of visual stimuli. Since (basic) visual information is processed in the occipital cortex, VEPs are most prominent at the occipital electrodes. These occipital VEP patterns typically consist of a positive and negative peak (Figure 3; Rugg and Coles, 1996; Crognale et al., 1998; Odom et al., 2004). The positive peak is referred to as the P1, evoked approximately 100 ms after stimulus onset. The negative peak is in different fields of research referred to as either N1, N2, or N200. The positive and negative peaks (Figure 3) will be referred to in this paper as the typical VEP pattern. The positive and negative peaks reflect visual processing that occurs relatively early in time, and their amplitude and latency depend on several stimulus characteristics such as luminance contrast or SF levels (e.g., Ellemberg et al., 2001) and, if present, task requirements (Norcia et al., 2005). It should be noted that a general issue in EEG-research is that it provides an indirect measurement of brain activity. As a result it cannot reveal the specific origin of the (changes in) peaks. However, it can show changes across ages in amplitude and latency and the presence and order of peaks (first negative, then positive versus first positive, then negative). In developmental research, the main interest has been in all of these aspects of the VEP pattern.
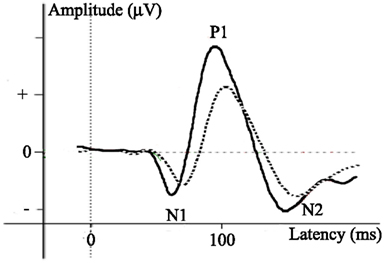
Figure 3. Example of visual evoked potentials (VEPs) with positive and negative peaks of varying latency and amplitude.
Development of Visual Mechanisms Underlying Form Processing
Visual Acuity
Visual acuity describes the sharpness and/or clearness of vision, and represents one of the limits of visual perception, which is determined by the structural organization of the retina. Its developmental trajectory is often investigated by measuring grating acuity3. This is done using grating stimuli, containing a pattern of black and white lines that vary in width4 (Figure 1A). The smallest width of the lines, and therefore the highest number of cycles of black and white that can be observed at a given distance, determines the visual acuity. This number is referred to as cycles per degree (cpd) of visual angle, controlling for the viewing distance5. In behavioral tests, this can be investigated using preferential looking or habituation paradigms (see Techniques and Tasks in Developmental Visual Research), and the result of an individual is typically reported in comparison to that of normally sighted individuals. Instead of gratings (used in the Teller acuity test, Teller et al., 1986), other stimuli can also be used for the investigation of grating acuity. These stimuli are, for instance, letters (Snellen acuity test, Snellen, 1965), or geometric symbols which contain gaps (e.g., the Landolt ring, NAS-NRC, 1980) of different sizes. These tests require detection of specific stimulus elements, such as the location of the gap, and are often applied in clinical settings in older children and adults. Grating acuity, as measured behaviorally, is at birth approximately 1/10th of that of adults. Adult-like acuity is reached by 4–6 years of age (Skoczenski and Norcia, 2002; Almoqbel et al., 2008).
Neurophysiological measures show VEP patterns evoked by grating stimuli up to 24.3 cpd in adults (Skoczenski and Norcia, 2002). In children of 1 month-of-age, VEPs are only evoked by grating stimuli up to 4.5 cpd (Norcia and Tyler, 1985). At this age, grating stimuli with more cpd do not evoke VEP patterns distinguishable from those evoked by noise. The VEP correlates of acuity mature further with age: at 8 months VEP patterns are evoked by grating acuity stimuli up to 10.4 cpd (Prager et al., 1999), and around the first year of age up to 20 cpd (Norcia and Tyler, 1985). By 6 years of age the VEP response has matured (Skoczenski and Norcia, 2002). These results indicate that an increasingly large number of cpd can be processed as a child matures, and, therefore, that acuity increases with age. The limited acuity in young children (among others due to migration of specific cells within the retina, Packer et al., 1990) leads to restricted vision, influencing perception of other characteristics, such as high spatial frequencies.
Spatial Frequency and Contrast Sensitivity
The SF of a stimulus is the measure of how often a cycle of luminance levels repeats per given distance, and is measured in cpd of visual angle (similar to cpd of grating stimuli described in Section “Visual Acuity”). The SF content of a stimulus is related to the amount of details in the stimulus: higher SFs (Figure 1B) carry detailed information in the stimulus, while lower SFs (Figure 1A) carry global information, and are typically discussed in relation to the parallel pathways (see Box 1). As a result, the specific SF-content of a stimulus aids specific visual processes. While, for instance, emotion-recognition in faces is related to lower-range SF processing (Deruelle et al., 2008), higher SFs are related to perception of edges in a stimulus and detailed changes such as pupil size. Of note, processing of higher SFs is limited by visual acuity.
Spatial frequency processing is closely related to luminance-contrast sensitivity (for brevity from now on called “contrast sensitivity,” or CS). CS is defined as the ability to discriminate between different luminance levels of two adjacent parts of a visual stimulus (Figures 1C,D). Its real world analog is the ability to detect differences in brightness of an object in comparison to that of the background. In both adults and children the perception of a certain SF depends on the luminance contrast of the stimulus and vice versa (Figure 4A). These two types of form characteristics are often investigated within same studies. For these reasons, the development of SF processing and contrast sensitivity will be discussed together.
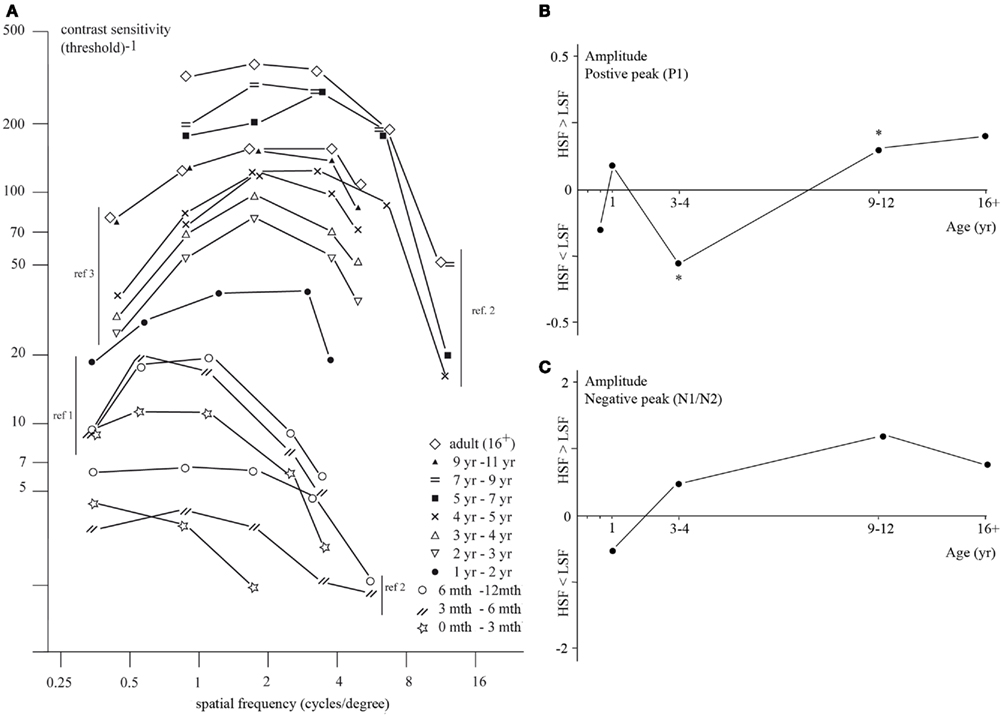
Figure 4. (A) Contrast sensitivity function for different ages (symbols): contrast sensitivity as a function of stimulus spatial frequency. Numbers in figure reflect references; 1. Adams et al., 1992; 2. Gwiazda et al., 1997; 3. Adams and Courage, 2002. (B) Amplitude [relative value of amplitude evoked by high versus low SFs; calculated as (HSF − LSF)/HSF] of the positive VEP peak (P1) at different age groups. (C) Amplitude [relative value of amplitude evoked by high versus low SFs; calculated as (HSF − LSF)/HSF] of the negative VEP peak (N1 or N2) at different age groups. Specific SFs for calculation of the relative amplitude value are those of the stimuli in studies investigating the depicted age ranges, and are further specified below. Asterisks represent significant amplitude differences evoked by high versus low SFs, noted by the authors of the study.
A design often used to investigate processing of SF and contrast information is a discrimination test, adapted for these characteristics by Adams et al. (1992) and Adams and Courage (2002), based on the preferential looking paradigm described in Section “Techniques and Tasks in Developmental Visual Research.” In this test, the discriminative threshold of SF processing is investigated for a particular contrast. Participants are presented with two stimuli, one of which contains a grating pattern while the other one does not. The luminance contrast of the grating is reduced over trials in order to calculate the threshold. The threshold results from behavioral studies investigating SF and CS are often depicted in a contrast sensitivity function (CSF), showing the threshold of minimum required contrast necessary for the detection of a certain SF (Figure 4A).
Behavioral studies investigating SF processing showed that newborns are only able to process lower but not higher SFs (a result that is not surprising, given newborns relatively low visual acuity). CS for lower SFs (0.5 cpd) is thus present early in life, while sensitivity for higher SFs (4.8 cpd) is absent at this stage (Adams et al., 1992; Hammarrenger et al., 2003). However, CS for higher SFs develops very fast in infancy and reaches adult-like levels by 3 or 6 years of age (Gwiazda et al., 1997; Adams and Courage, 2002), whereas sensitivity for lower SFs matures only around the age of 9–12 years (Beazley et al., 1980; Gwiazda et al., 1997; Adams and Courage, 2002). Thus, there is an earlier initial processing of lower as compared to higher SFs early in life, but a faster maturation of processing of higher SFs as compared to lower SFs (specific results from different studies are depicted in Figure 4A).
Neurophysiological studies indicate that the P1 peak is initially present for lower SFs, and both the P1 and N1 peak begin to appear for an increasingly large number of spatial frequencies and contrast levels over the first year of life (Norcia et al., 1990; Hammarrenger et al., 2003; Almoqbel et al., 2008). This indicates that neural sensitivity for contrast and SF changes with development over time. Neural mechanisms for CS in higher SF stimuli are adult-like by the age of 8 years, given that adults and 8-year-old children show comparable VEP patterns evoked by higher SF stimuli (with varying contrast levels). However, since no information is available for 1–8 years of age, it is possible that these processes mature at an earlier stage. CS for lower-SF stimuli becomes mature later in life, between 8 (not adult-like) and 11 (adult-like) years of age (Gordon and McCulloch, 1999). To our knowledge, no studies investigated CS for lower and higher SFs at intermediate ages.
So far we have discussed studies that have investigated CS at different spatial frequencies, but did not compare brain activity evoked by different SFs within children of the same age. A difference in VEP pattern evoked by higher versus lower SFs is found to change with age (Figures 4B,C for the value of relative difference in the discussed age groups): in infants and 3- to 4-year-old children, the P1 amplitude is larger for lower as compared to higher SFs (Vlamings et al., 2010a). On the other hand, in 9- to 10-year-olds, the P1 amplitude is smaller for lower than higher SFs (Boeschoten et al., 2007). In adults, the P1 amplitude is again larger for lower than for higher SFs (Ellemberg et al., 2001). Thus, both investigations of SF processing with varying contrast levels and comparisons between VEP patterns evoked by lower versus higher SFs reveal an immaturity of the cortical mechanisms underlying SF processing (see Box 1) in children under 11 years of age.
In summary, studies investigating behavior and neurophysiology of contrast sensitivity and SF processing show that CS for lower SFs begins to develop before that of CS for higher SFs, but that CS for higher SFs has matured earlier as compared to CS for lower SFs. This indicates that infants perceive relatively few details, but that this ability develops quickly in the first years of life, while global information can only be perceived to an adult-like extent at a later age.
Color
The development of color processing is usually investigated using stimuli with either red–green or blue–yellow color opponents, because of the different neuronal mechanisms related to these stimuli (see Box 1). Stimulus color is detected by means of specialized cones in the retina, each sensitive to a specific range of wavelengths (such as short-, middle-, and long-wavelengths, appearing as blue, green, and red, respectively) and predominantly projecting to cells in the different visual (P-, and K-) pathways. Red–green-opposite stimuli are mainly processed in the P-pathway, while the K-pathway mainly processes blue–yellow-opposite stimuli (Knoblauch and Shevell, 2004; Pokorny and Smith, 2004).
Behaviorally, 2-month-old infants can discriminate blue–yellow stimuli, while discrimination of other colors is not yet possible (Teller et al., 1978; Varner et al., 1985; Clavadetscher et al., 1988). At 3 months of age, infants are able to discriminate between red and green as well as between blue and yellow colors. Over time color processing becomes more specific, such that smaller color differences between stimuli can be detected as children grow older. Maturity levels are reached around adolescence (Peterzell et al., 1997, 2000; Knoblauch et al., 2001; Goulart et al., 2008).
Selective cortical activity related to color processing can be measured from around 4–6 weeks of age onward (Crognale et al., 1998). At this age, only the positive peak is evoked. A typical VEP pattern, containing both positive and negative deflections (Figure 3) is evoked by red–green stimuli in 4- to 6-month-old infants. At this age, the positive peak is followed by a negative one, a pattern known in color research as the positive–negative complex (Madrid and Crognale, 2000). Blue–yellow stimuli evoke a similar VEP pattern, although the development is slightly delayed as compared to red–green stimulus processing (Crognale et al., 1998; Knoblauch et al., 1998). Note that this neural developmental trajectory is opposite to that shown by behavioral measures, which will be further discussed in Section “Implications for Future Research.” The positive–negative complex gradually shifts into a negative–positive complex, that is typically related to color processing in adults. This complex is matured after the age of 19 years (Madrid and Crognale, 2000; Crognale, 2002; Pompe et al., 2006; Boon et al., 2007). Therefore, both behavioral and neurophysiological evidence indicate an increase in sensitivity for color processing with age, which reaches maturity during, or shortly after, adolescence.
Orientation Processing
Whereas visual acuity, SF, luminance contrast, and color processing are mainly investigated using fairly simple stimuli such as single gratings, orientation (as well as depth and motion) processing is studied using different stimulus-sets containing either simple (e.g., one grating) or more complex (e.g., multiple gratings) stimuli. Four main stimulus-sets are applied in developmental research on orientation processing. Please refer to Figure 5 for examples of the stimulus-sets. Each of these sets is used to investigate a different aspect of orientation processing, dependent on the level of integration of local elements required to perceive a global form. This is proposed to be related to different contributions of feedforward and recurrent (i.e., feedback and horizontal) neural connections (see Box 1). The first set is used to investigate homogeneous stimulus processing (Figure 5A). This is done by presenting two types of stimuli: one containing line-segments presented at a single orientation (homogeneous; Figure 5A) and one with another (homogeneous) orientation or a random pattern (Figure 5B). The difference between the two stimuli can only be detected if a person is sensitive to the difference in both line orientations (see Techniques and Tasks in Developmental Visual Research). Homogeneous stimulus processing has been hypothesized to be predominantly dependent on activation of feedforward connections, since details do not need to be integrated to perceive a form. Three other designs are typically used to investigate visual integration of details into a form (see Box 1). One design is to present a stimulus containing a single line with a different orientation compared to all other lines in the same stimulus (Figure 5C). In another stimulus-set, stimuli which contain shapes derived from differences in orientation (so-called textured stimuli; Figure 5D) are presented and compared to homogeneous stimuli. The final stimulus-set compares stimuli that contain a contour (so-called contour integration stimuli, Figure 5E) with varying levels of background noise (for instance Figure 5E versus Figure 5F). Processing of single-line, textured, and contour-integration stimuli requires more visual integration than homogeneous stimuli, which is proposed to be related to activation in recurrent connections in addition to feedforward connections. Therefore, the relative activation of recurrent connections can be investigated by comparing processing of single-line orientation, textured, or contour integration stimuli with that of homogenous ones (Lamme and Roelfsema, 2000)6.
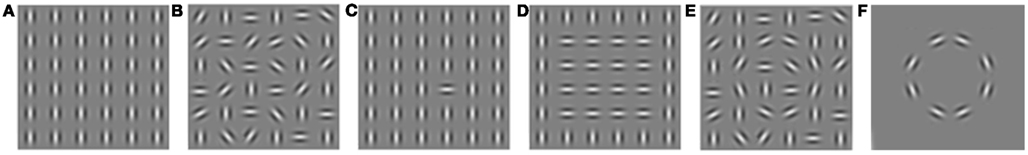
Figure 5. Examples of stimuli used in different orientation-processing tasks. (A) Homogeneous. (B) Randomly oriented. (C) Single line. (D) Texture. (E) Contour with high background noise levels. (F) Contour with low background noise levels.
Behavioral measures indicate that orientation processing of homogeneous stimuli is present at birth, given that newborns perceive a difference between lines in one direction and lines in another or random direction (Atkinson et al., 1988). This ability has not been investigated in children older than 1 year of age. The detection of a differently oriented single line emerges at 9 months of age, and gradually develops until it is mature at 13 years of age (Rieth and Sireteanu, 1994). Texture segregation based on orientation information emerges at 4–9 months of age, since infants of this age can detect a figure based on line orientations, and this ability also matures at 8–13 years of age (Sireteanu and Rieth, 1992; Atkinson, 1993; Rieth and Sireteanu, 1994). Contour integration is already possible at 3 months of age, yet with age, contours can be detected with increasing background noise, which implies that the ability to integrate contours continues to improve. Contour-detection with background noise at adult-like levels is present at 13–14 years of age (Quinn et al., 1997; Kovacs et al., 1999; Kovacs, 2000; Gerhardstein et al., 2004; Baker et al., 2008).
Neurophysiological measures reveal that homogeneous stimuli evoke VEP pattern at 2–5 months of age (youngest age tested), which gradually begin to resemble adult-like patterns over the first year of age (Norcia et al., 2005). Although the neural correlates of homogeneous stimulus processing are also investigated in older children (4–19 years of age), results have not been compared between different ages (Pei et al., 2009). VEP patterns evoked by single-line detection have not been investigated. VEP patterns evoked by texture segregation have only been investigated in infants and older children (average age of 13 years; Arcand et al., 2007; Kemner et al., 2007). For these stimuli, it is typical to investigate the VEPs evoked by textured stimuli in comparison to those evoked by homogeneous stimuli. This comparison reveals a negative peak in adults. In infants, this peak arises between 1 (not present) and 3 (present) months of age. At 1 year of age, the selective cortical activity related to texture processing is, however, not yet adult-like (Arcand et al., 2007). The age of maturation is unknown, since results for older children (average age 13 years) are not compared to those of adults (Kemner et al., 2007). Contour-stimuli evoke a positive and negative peak in the VEP pattern in infants of 6–13 months old (Norcia et al., 2005). As is the case with homogeneous stimulus processing, the neural system related to contour integration is investigated in older children (4–19 years of age), but results are not compared between age-ranges (Pei et al., 2009).
In summary, behavioral measures show that processing of all discussed stimulus sets emerges in the first year of life, and matures between 8 and 13 years of age. However, substantial gaps in the literature are present, especially with regards to neurophysiological measures.
Depth Perception
Perceiving depth depends on several cues, which can be monocular (perceived using one eye) or binocular (perceived using both eyes). Monocular cues are known as pictorial depth cues, which are for example occlusion of part of the object (i.e., when one object stands in front of the other), and texture gradients (i.e., a change in amount of details or size when an object is further away; Kavsek et al., 2009). Another monocular depth cue is motion parallax (i.e., information on the relative position between objects, derived by a change of viewpoint as a result of movement of the observer). Although development of this cue has been investigated (see Nawrot et al., 2009 for an overview), this ability is not necessary for form perception when a child is not moving. Therefore, processing of this cue will not be reviewed in the current paper. The binocular cue for depth perception is binocular disparity, i.e., the detection of a difference in image location as perceived through the left and right eye’s horizontal separation. Perceiving depth from binocular disparity is known as stereopsis or stereoacuity, and is processed by binocular disparity sensitive cells in V1 and further along the cortical hierarchy.
Behavioral evidence of depth perception using pictorial depth cues in infants are reviewed in a meta-analysis by Kavsek et al. (2009). He showed that most studies found that the initial processing of pictorial depth cues in infants emerges between 3 and 5 months or around 5 months of age, suggesting that infants perceive objects in depth only from that moment on. The developmental trajectory of pictorial depth cue processing after 1 year of age is investigated in only one study (Hagen, 1976). Here it is shown that 3-, 5-, and 7-year-old children could all perceive depth relations based on partial occlusion of objects. The age at which this ability is fully mature is, however, unknown. The age of onset of processing binocular disparity is 3–5 months of age, followed by a rapid development until 4–6 months of age (reviewed by Duckman and Du, 2006). After this, there is a fairly continuous development of binocular disparity processing (i.e., stereoacuity) until maturation at about 12 years of age (Walraven and Janzen, 1993; Sloper and Collins, 1998; Takai et al., 2005). The mentioned studies indicate that by 12 years of age, children can perceive the same levels of depth within and between objects as adults do.
So far, there have been no neurophysiological studies of development of pictorial depth cues. VEP patterns evoked by binocular disparity are however present at 3–5 months of age (Brown et al., 1999; Duckman and Du, 2006). The VEP correlates of binocular-disparity processing develop after this age, with decreasing amplitudes and latency for binocular depth cues between 5 and 10 years of age (Sloper and Collins, 1998). When the VEP patterns are adult-like is, however, unknown.
Together, both behavioral and neurophysiological measures revealed that depth perception is possible at 3–5 months of age. Behavioral evidence indicates that depth perception based on binocular cues is mature at 12 years of age, but the age of maturation is not investigated neurophysiologically.
Motion Processing
Motion processing, i.e., the perception of speed and direction of elements in a scene, can aid form processing in the cases when form or structure can be derived from motion (see below). For a full understanding of the development of this type of complex-motion stimulus processing, we will first discuss the development of motion perception itself. We will specifically focus on local and global first order motion processing, related to processes at different levels in the visual hierarchy (see Box 1)7. Local motion is the movement of a small object with the approximate size of one V1 receptive field or less. It is often investigated by varying luminance contrast levels of individual moving stimuli, e.g., individual Gabors (Figure 6A), or by varying displacement distances of individual dots in a stimulus referred to as random dot kinematogram (RDK; Julesz, 1960; Snowden and Braddick, 1989; Figure 6B). This stimulus contains multiple moving dots in which a percentage of dots are moving in a similar, thus coherent, direction. Movement of a stimulus or object that spans multiple V1 receptive fields is commonly referred to as global motion. This type of motion is typically processed in visual areas higher-up in the hierarchy, e.g., V5. The ability to process global motion can, for instance, be investigated using so-called motion-coherence thresholds in RDKs (Figures 6B,C). Discrimination between a stimulus with a percentage of dots moving in a coherent direction and a stimulus with dots moving in random directions is only possible if one can process information about motion from the whole stimulus. The lower the motion-coherence threshold of an individual, the better global motion is processed. Motion information directly aids form perception when a stimulus contains multiple similar elements, in which some adjacent elements are integrated and together appear as a form because they are moving together, in a direction different from the other elements (see Box 1 and Figure 6D; regularly used for investigation of global motion as well as form from motion processing). A form (e.g., multiple similarly moving dots) can therefore only be segregated from its background (e.g., dots similar to those defining the form) because they are moving in a different direction. In this way, the ability to process motion enables form from motion perception. A more complex variation of this type of stimulus enables structure from motion. This stimulus induces the perception of a 3D form, for instance a rotating sphere, even though it is presented in 2D. Processing of structure from motion requires depth perception. To perceive a form or structure based on motion information, interaction between motion processing areas such as V5 and brain areas involved in form processing, and thus interaction between the M- and P-pathways is required. In addition, local information needs to be integrated into a form, and segregated from the background, which is proposed to be related to activation in recurrent connections (Box 1).
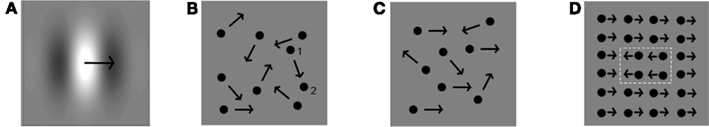
Figure 6. Examples of stimuli used in different motion-processing tasks. (A) Movement of a single Gabor. (B) Random dot kinematogram with 0% motion coherence, and dot displacement distance indicated for one dot from position 1 to position 2. (C) Random dot kinematogram with 50% motion coherence (in this case moving rightward). (D) Form from motion (white dotted lines depict the motion defined shape).
Braddick et al. (2003), Braddick and Atkinson(2009, 2011), and Lewis and Maurer (2005) reviewed behavioral evidence on motion processing in infancy. They reported that local motion processing based on cortical activation (as opposed to subcortical activation) is only present from 7 weeks of age on. Up to 10 years of age, local motion processing requires decreasing luminance levels with age (Ellemberg et al., 2003; Thibault et al., 2007; Bertone et al., 2008; Armstrong et al., 2009). Local motion is still immature at the age of 10 years, but has not been investigated in later pre-adult age-ranges. Behavioral studies revealed that global motion processing becomes apparent around the same time as local motion processing (Banton and Bertenthal, 1996), or soon after (Wattam-Bell, 1994), and develops rapidly afterward. The developmental trajectory and the age at which global motion processing is matured differ among studies. Results are summarized in Figure 7, which suggest that motion coherence thresholds may depend on stimulus speed. Thresholds can also depend on other stimulus properties, such as dot density or luminance contrast, probably explaining the very dissimilar findings by Ellemberg et al. (2004) versus Gunn et al. (2002) (see also Table A1 in Appendix for an overview of stimulus properties). Overall, global motion processing matures between 6 and 11 years of age (Ellemberg et al., 2002; Gunn et al., 2002; Parrish et al., 2005; Dawes and Bishop, 2008). Processing of form-from-motion is present at 2 months of age (youngest age tested; Johnson and Mason, 2002) and develops with age, reaching mature levels between 7 and 15 years of age (Schrauf et al., 1999; Parrish et al., 2005; Dawes and Bishop, 2008). Structure-from-motion processing is also present at 2 months of age (Arterberry and Yonas, 2000), but it is not clear at what stage it reaches maturity as it has not been investigated in older age groups.
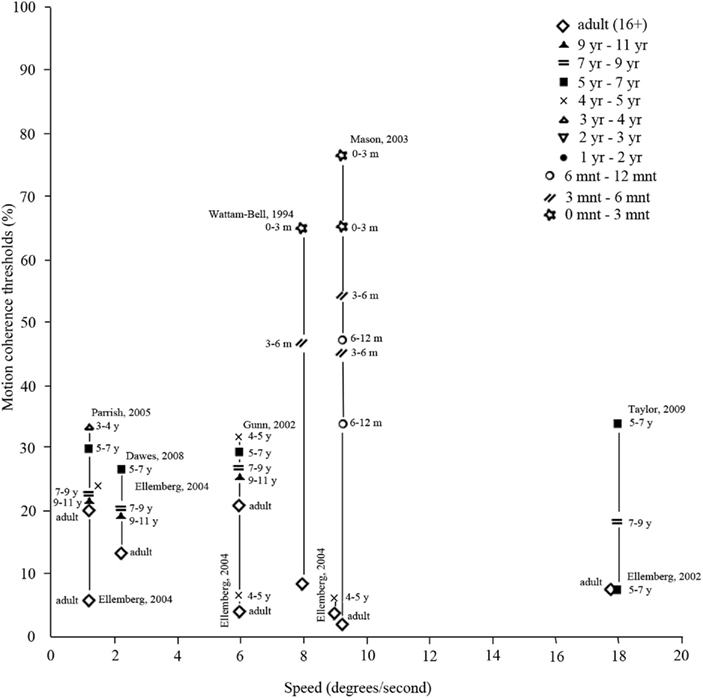
Figure 7. Motion coherence thresholds (y-axis), indicating the percentage of dots in a random dot kinematogram that are required to move in the same direction in order for the participant to discriminate from randomly moving dots (0% coherence). As is clear from the figure, thresholds depend on speed of motion (x-axis), as well as on age (symbols). (Data points taken from Wattam-Bell, 1994; Banton and Bertenthal, 1996; Ellemberg et al., 2002, 2004; Gunn et al., 2002; Mason et al., 2003; Parrish et al., 2005; Dawes and Bishop, 2008).
Visual evoked potentials are evoked by direction-reversal stimuli (i.e., the moment motion in a stimulus changes 180° direction) from 7 weeks of age onward. In infants, 4 months of age and older, local and global motion processing has also been investigated. Although neural activation related to both types of motion was present, it was immature in comparison to adults (Hou et al., 2009; Wattam-Bell et al., 2010; for a more extensive review, see Braddick et al., 2003; Braddick and Atkinson, 2009). VEPs indicate that local-motion processing is more adult-like than global-motion processing in 4- to 6-month-old infants. Between the ages of 6 and 10 years, amplitude and latency of the positive and negative VEP peaks decrease for local-motion processing, but are still not adult-like at 10 years of age (Mitchell and Neville, 2004; Coch et al., 2005). Thus, although the neural correlates of motion processing mature over time, motion is still not processed in the adult-like manner by the visual system at 10 years of age. To our knowledge, no studies have investigated VEPs evoked by global-motion stimuli in children older than 1 year of age, or local-motion in children between 1 and 6 years of age, or above 10 years of age. The developmental trajectory of form or structure from motion has not been investigated using EEG, but a functional magnetic resonance imaging (fMRI) study reported that the underlying brain mechanisms for structure from motion perception are not fully mature at 5 years of age (Klaver et al., 2008). Thus, the current understanding of development of cortical mechanisms underlying motion processing shows considerable gaps.
In summary, behavioral as well as neurophysiological measures have shown that motion processing is possible from 7 weeks of age onward and to develop over childhood and possibly adolescence. Behavioral measures indicate motion processing to be matured at 6–11 (global motion) or 7–15 years of age (form from motion).
Discussion and Conclusions
Current Knowledge on Developmental Trajectories
We have provided a comprehensive review of the development of visual acuity, and of mechanisms underlying form processing, with a focus on SF, luminance contrast, color, orientation, depth as well as basic motion processing, in children from birth to adulthood (summarized in Figure 8). As was to be expected, all discussed mechanisms are immature at birth, and mature over the course of childhood. Visual acuity reaches maturity at the age of 4–6 years. The development of contrast sensitivity and SF processing are often investigated together, since perception of these stimulus characteristics is interdependent. Both behavioral and neurophysiological evidence indicates that contrast sensitivity for the higher range of spatial frequencies is adult-like at an earlier age, i.e., around 3–6 years, as compared to that for the lower range of spatial frequencies, being mature around 9–12 years of age. Color discrimination, as studied behaviorally, is adult-like around puberty, while the related neural responses mature slightly later, at approximately 19 years of age. Most aspects of orientation processing, for example that of single orientations and contour integration, become adult-like between the ages of 8–14 years as studied behaviorally, but the developmental trajectory of the cortical processing remains, to our knowledge, unknown. Depth perception is adult-like at 12 years of age for binocular depth cues, as studied behaviorally. Neurophysiological measures show development of binocular depth cues until at least 10 years of age, while the developmental trajectory for monocular depth cues has not been investigated. Behavioral measures show motion processing to be mature at 6–11 years of age. The developmental trajectory of the VEPs remains unknown, although it is reported that for local motion processing the VEP pattern is still immature at 11 years of age. Thus, mechanisms for form characteristic processing develop at different rates (see Figure 8).
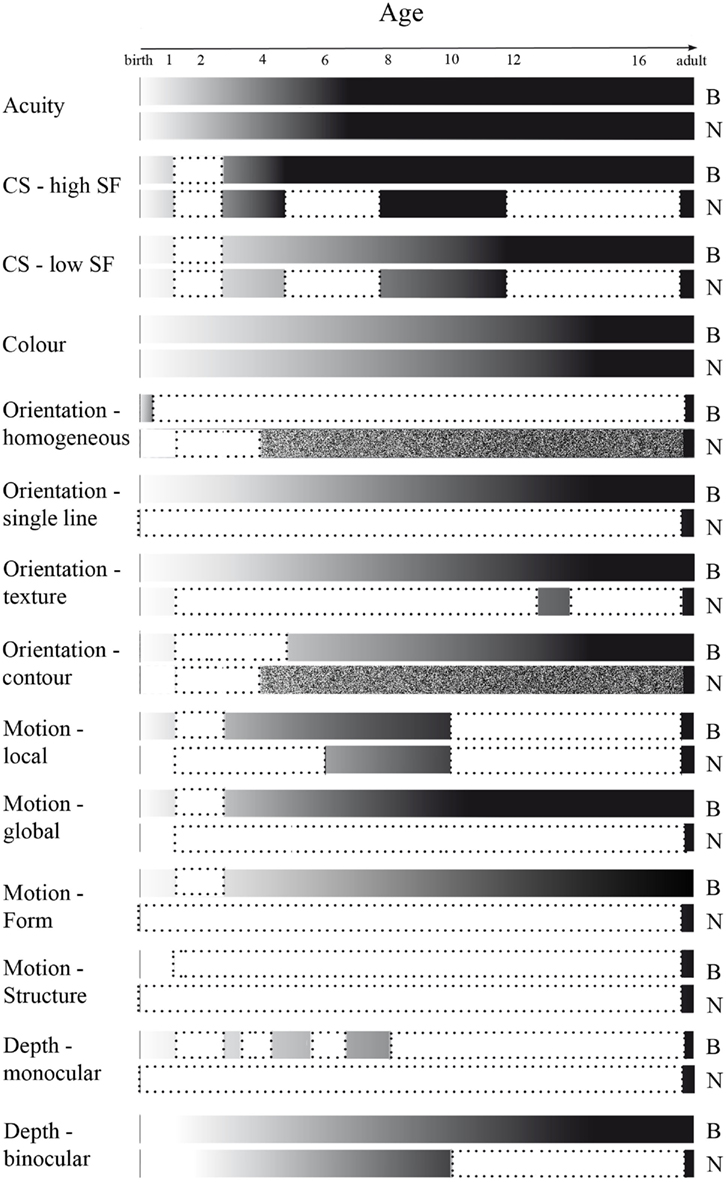
Figure 8. Overview of development of stimulus characteristic processing, and of gaps in literature, as measured behaviorally (B) and neurophysiologically (N). Development depicted from infant (white) to adult-like (black) levels of processing. Literature gaps, defined as a minimum of at least 1 year of life not being investigated, are depicted in white surrounded by a dotted line. Age ranges investigated but not compared to processing in other age ranges are depicted as textured.
Theories Regarding Developmental Trajectories
Based on the moment of first emergence and the age at which the discussed mechanisms are matured, some tentative conclusions can be drawn about the developmental order of different aspects of the visual system involved in form-characteristic processing. As mentioned “in the introduction”, the developmental trajectories can be discussed in terms of different theoretical frameworks on neural mechanisms underlying form-characteristic processing: on the one hand the parallel pathways, such as the M- and P- pathway, and on the other the feedforward and recurrent connection distinction (Box 1). Regarding the M- and P-pathway development, current data suggest that the initial development of the M-pathway begins earlier than that of the P-pathway (Hammarrenger et al., 2003). This is based on the finding that processing of stimuli typically related to M-pathway activation, such as motion and CS for stimuli with lower SFs, appear at an earlier age than stimulus processing related to P-pathway activation, e.g., CS for stimuli with higher SFs. However, the P-pathway development seems to speed up and reaches maturity at an earlier age as compared to the M-pathway. A factor influencing the relatively late initial development of the P-pathway may be visual acuity, which restricts processing of higher SFs. There is, however, some discussion in the literature regarding the hypothesis on the order of M- versus P-pathway development, which is mainly based on methodological variations and differential findings in VEP patterns related to spatial-frequency processing (Ellemberg et al., 2001; Hammarrenger et al., 2003). An additional challenge to the hypothesis on differential developmental trajectories of the P- and M-pathway is the late maturation of color processing (i.e., approximately 14 years of age), since color processing is mainly related to P-pathway activation. On the other hand, the late maturation of color processing might be influenced by the development of the K-pathway whose contribution to color processing is not yet fully understood. Overall, results suggest that the M- and P-pathway follow different developmental trajectories, but the exact order is still a matter of debate.
Another hypothesis that can be derived from the current review is that the developmental rate of the activity of feedforward connections differs from that of activity of recurrent connections in the visual cortex. Processing of homogeneous-orientation stimuli requires few integration of details, and is thus proposed to be processed mainly by feedforward connections. More integration and segregation is required to process single-line detection stimuli (i.e., processing of stimuli containing one distinct element compared to the other elements), texture segregation, contour integration, form-from-motion, and structure-from-motion, which is supposedly related to higher levels of activation in recurrent connections (Burkhalter, 1993; Burkhalter et al., 1993; Lamme and Roelfsema, 2000). Stimuli that require only activity of feedforward connections can be processed at an earlier age, compared with those that require activity of recurrent connections. This would thus imply that feedforward connections are fully functional at an earlier stage in comparison to recurrent ones. This idea is supported by neuroanatomical findings in humans, which showed that recurrent connections within V1 are immature until at least 5 years of age (Burkhalter et al., 1993) and that there is a slower postnatal development of recurrent as compared to feedforward connections between V1 and V2 (Burkhalter, 1993). A clear view on differences in maturation rates of feedforward versus recurrent connections is not yet possible. This is mainly due to a lack of studies investigating maturation of homogeneous-orientation-stimulus processing measured behaviorally, and of neurophysiological processing of homogeneous, textured, contour, and form- or structure-from-motion information. Thus, current results indicate specific trajectories in development of form-characteristic processing, with regard to M- and P-pathway as well as feedforward and recurrent connection activation, although future research on under-investigated age-ranges needs to confirm these ideas.
Implications for Future Research
Although the developmental trajectories of some of the mechanisms underlying form processing are well investigated, the current literature also shows many gaps in our knowledge on this matter (Figure 8). For a full understanding of the typical development of processing of form characteristics, it is imperative that future studies focus on filling these gaps in our knowledge. In addition, results of different studies sometimes conflicted. Contrasting findings could among others be due to methodological differences between studies, e.g., stimulus settings or task requirements, which are summarized in Table A1 in Appendix. In future studies, it is essential to control for these variations in order to fully understand the development of form-characteristic processing. Moreover, discrepancies are often observed between developmental trajectories as revealed by behavioral in comparison to neurophysiological studies. Both behavioral and neurophysiological measures of visual processing depend not only on development of specification of the visual system, but also on several other factors. For instance, neurophysiological measures depend on the sensitivity of the (EEG-) measurement system. Developmental changes, such as cortical folding, influence neuronal orientation, and therefore define neurons whose activity can be measured with EEG. It is plausible that these changes account for at least some of the developmental trajectories revealed by neurophysiological studies. Behavioral measures are influenced by cognitive processes, such as attention and motivation (Boon et al., 2007), which might facilitate or inhibit behavioral responses. These and other factors may explain the differences between developmental trajectories revealed by each of these techniques and should, thus, be taken into account when comparing behavioral and neurophysiological results.
Implications for Developmental Disorders
Once the typical development of form-characteristic processing is fully understood, atypical processing can be investigated from a developmental perspective in disorders such as autism, schizophrenia, attention deficit hyperactivity disorder (ADHD), Williams syndrome (WS), and dyslexia. These disorders are clinically characterized by social and/or cognitive impairments (American Psychiatric Association, 2000) but often show atypical visual processing as well. Such abnormalities are found in processing of forms as such (e.g., faces or letters, Marwick and Hall, 2008; Vidyasagar and Pammer, 2010; Vlamings et al., 2010b) as well as specific form characteristics (Braddick et al., 2003; Dakin and Frith, 2005; Gronlund et al., 2007; Butler et al., 2008; Simmons et al., 2009). For instance, ASD patients demonstrate, among others, abnormal SF and motion processing (Dakin and Frith, 2005; Simmons et al., 2009), while patients with schizophrenia are impaired in contrast processing (Butler et al., 2008), and WS patients in motion processing (Braddick et al., 2003). Visual brain areas related to form characteristic processing develop at a younger age as compared to areas related to cognitive and social skills (Gogtay et al., 2004). In developmental disorders, social and cognitive symptoms are not present at birth, but appear over time (e.g., Rogers, 2009). Since many cognitive and social processes depend on information provided by early visual areas, atypical form characteristic processing early in life might very well explain cognitive and social impairments at a later age. Studying form characteristic processing in these disorders from a developmental perspective would provide an answer to the imperative question of when and how the development exactly goes astray.
Conclusion
In conclusion, current studies of development of behavioral and neural correlates of visual acuity, and of mechanisms related to form processing, i.e., contrast sensitivity, SF, color, orientation, depth and motion reveal that all these processes are immature at birth. Development is demonstrated to occur throughout childhood, with adult-like performance and its neural correlate becoming apparent at different ages for different processes. However, this overview also reveals significant gaps in our current understanding of typical development of form characteristic processing. Filling these gaps is a necessity for making a solid comparison between typical development and that leading to developmental disorders, in order to completely understand where, when, and how development goes astray in disorders such as autism, schizophrenia, ADHD, and dyslexia. The next challenge in developmental neuroscience is to uncover these missing segments, and complete our understanding of the development of mechanisms underlying form processing.
Conflict of Interest Statement
The authors declare that the research was conducted in the absence of any commercial or financial relationships that could be construed as a potential conflict of interest.
Acknowledgments
The authors want to thank Titia Gebuis, Juul Jansen, Branka Milivojevic, Tineke Snijders, and Lilli van Wielink for comments on an earlier draft of the manuscript. This research was supported by the Dutch Organisation for Scientific Research (NWO), granted to Prof. Dr. C. Kemner.
Footnotes
- ^It should be noted that higher-level visual processes, such as form recognition of for instance faces or objects, are beyond the scope of the current review.
- ^The specific role of this pathway in visual processing is not yet fully understood, as is the differentiation between the P- and K-pathway in color processing.
- ^Another measure of acuity is Vernier acuity, which measures acuity using different types of stimuli, leading to comparable results as grating acuity.
- ^Or a sinusoidal variation in brightness, with varying period.
- ^Grating stimuli are also used to investigate specific neural processes related to spatial frequency processing (see Spatial Frequency and Contrast Sensitivity), as opposed to clearness of vision in visual acuity.
- ^Research in monkey and human adults pointed toward specific contributions of feedback and horizontal processing in these stimuli (e.g., Lamme et al., 1992; Lamme and Roelfsema, 2000). More in-depth investigation of the development of the visual cortex is required before suggestions on the specific contribution of feedback versus horizontal connections can be extended to the developing brain.
- ^Motion information is important for a number of different functions, from form extraction (presented here) to guiding self-motion through an environment. Therefore only a few of many different categories of motion stimuli are discussed here.
References
Adams, R., Mercer, M., and Courage, M. (1992). A new technique to measure contrast sensitivity in human infants. Optom. Vis. Sci. 69, 440–446.
Adams, R. J., and Courage, M. L. (2002). Using a single test to measure human contrast sensitivity from early childhood to maturity. Vis. Res. 42, 1205–1210.
Almoqbel, F., Leat, S. J., and Irving, E. (2008). The technique, validity and clinical use of the sweep VEP. Ophthalmic Physiol. Opt. 28, 393–403.
American Psychiatric Association. (2000). Diagnostic and Statistical Manual of Mental Disorders, 4th Edn. Text Revision. Washington, DC: American Psychiatric Association.
Arcand, E., Tremblay, E., Vannasing, P., Ouimet, C., Roy, M., Fallaha, N., Lepore, F., Lassonde, M., and McKerral, M. (2007). Development of visual texture segregation during the first year of life: a high-density electrophysiological study. Exp. Brain Res. 180, 263–272.
Armstrong, V., Maurer, D., and Lewis, T. L. (2009). Sensitivity to first- and second-order motion and form in children and adults. Vis. Res. 49, 2774–2781.
Arterberry, M. E., and Yonas, A. (2000). Perception of three-dimensional shape specified by optic flow by 8-week-old infants. Percept. Psychophys. 62, 550–556.
Atkinson, J. (1993). “Infant vision screening: prediction and prevention of strabismus and amblyopia from refractive screening in the Cambridge photorefraction programme,” in Early Visual Development: Normal and Abnormal, ed. K. Simons (New York: Oxford University Press), 335–348.
Atkinson, J., and Braddick, O. (1992). Visual segmentation of oriented textures by infants. Behav. Brain Res. 49, 123–131.
Atkinson, U. J., Hood, B., Wattam-Bell, J., Anker, S., and Tricklebank, J. (1988). Development of orientation discrimination in infancy. Perception 17, 587–595.
Baker, T. J., Tse, J., Gerhardstein, P., and Adler, S. A. (2008). Contour integration by 6-month-old infants: discrimination of distinct contour shapes. Vis. Res. 48, 136–148.
Banton, T., and Bertenthal, B. I. (1996). Infants’ sensitivity to uniform motion. Vis. Res. 36, 1633–1640.
Beazley, L., Illingworth, D., Jahn, A., and Greer, D. (1980). Contrast sensitivity in children and adults. Br. Med. J. 64, 863–866.
Bednar, J., and Miikkulainen, R. (2003). Learning innate face preferences. Neural Comput. 15, 1525–1557.
Bertone, A., Hanck, J., Cornish, K. M., and Faubert, J. (2008). Development of static and dynamic perception for luminance-defined and texture-defined information. Neuroreport 19, 225–228.
Boeschoten, M. A., Kenemans, J. L., van Engeland, H., and Kemner, C. (2007). Abnormal spatial frequency processing in high-functioning children with pervasive developmental disorder (PDD). Clin. Neurophysiol. 118, 2076–2088.
Boon, M. Y., Suttle, C. M., and Dain, S. J. (2007). Transient VEP and psychophysical chromatic contrast thresholds in children and adults. Vis. Res. 47, 2124–2133.
Braddick, O., and Atkinson, J. (2009). Infants’ sensitivity to motion and temporal change. Optom. Vis. Sci. 86, 577–582.
Braddick, O., and Atkinson, J. (2011). Development of human visual function. Vis. Res. 51, 1588–1609.
Braddick, O., Atkinson, J., and Wattam-Bell, J. (2003). Normal and anomalous development of visual motion processing: motion coherence and ‘dorsal-stream vulnerability’. Neuropsychologia 41, 1769–1784.
Braddick, O. J., O’Brien, J. M., Wattam-Bell, J., Atkinson, J., and Turner, R. (2000). Form and motion coherence activate independent, but not dorsal/ventral segregated, networks in the human brain. Curr. Biol. 10, 731–734.
Brown, R. J., Candy, T. R., and Norcia, A. M. (1999). Development of rivalry and dichoptic masking in human infants. Invest. Ophthalmol. Vis. Sci. 40, 3324–3333.
Bullier, J., Schall, J. D., and Morel, A. (1996). Functional streams in occipito-frontal connections in the monkey. Behav. Brain Res. 76, 89–97.
Burkhalter, A. (1993). Development of forward and feedback connections between areas V1 and V2 of human visual cortex. Cereb. Cortex. 3, 476–487.
Burkhalter, A., Bernardo, K. L., and Charles, V. (1993). Development of local visual circuits in human visual cortex. J. Neurosci. 13, 1916–1931.
Butler, P. D., Silverstein, S. M., and Dakin, S.C. (2008). Visual perception and its impairment in schizophrenia. Biol. Psychiatry 64, 40–47.
Callaway, E. M. (2004). “Cell types and local circuits in primary visual cortex of the macaque monkey,” in The Visual Neurosciences, eds L. M. Chalupa and J. S. Werner (Cambridge, MA: MIT Press), 680–694.
Carey, S., and Diamond, R. (1977). From piecemeal to configurational representation of faces. Science 195, 312–314.
Chapman, B., and Stryker, M. P. (1993). Development of orientation selectivity in ferret visual cortex and effects of deprivation. J. Neurosci. 13, 5251–5262.
Clavadetscher, J. E., Brown, A. M., Ankrum, C., and Teller, D. Y. (1988). Spectral sensitivity and chromatic discriminations in 3- and 7-week-old human infants. J. Opt. Soc. Am. 5, 2093–2105.
Coch, D., Skendzel, W., Grossi, G., and Neville, H. (2005). Motion and color processing in school-age children and adults: an ERP study. Dev. Sci. 8, 372–386.
Crair, M. C., Gillespie, D. C., and Stryker, M. P. (1998). The role of visual experience in the development of columns in cat visual cortex. Science 279, 566–570.
Crognale, M. A. (2002). Development, maturation, and aging of chromatic visual pathways: VEP results. J. Vis. 2, 438–450.
Crognale, M. A., Kelly, J. P., Weiss, A. H., and Teller, D. Y. (1998). Development of the spatio-chromatic visual evoked potentials (VEP): a longitudinal study. Vis. Res. 38, 3283–3292.
Dawes, P., and Bishop, D. V. M. (2008). Maturation of visual and auditory temporal processing in school-aged children. J. Speech Lang. Hear. Res. 51, 1002–1015.
de Haan, E. H. F., and Cowey, A. (2011). On the usefulness of ‘what’ and ‘where’ pathways in vision. Trends Cogn. Sci. 15, 460–466.
Deruelle, C., Rondan, C., Salle-Collemiche, X., Bastard-Rosset, D., and Da Fonseca, D. (2008). Attention to low- and high-spatial frequencies in categorizing facial identities, emotions and gender in children with autism. Brain Cogn. 66, 115–123.
Duckman, R. H., and Du, J. W. (2006). “Development of binocular vision,” in Visual Development, Diagnosis, and Treatment of the Pediatric Patient, ed. R. H. Duckman (Philadelphia: Lippincott Williams & Wilkins/Wolters Kluwer), 124–142.
Ellemberg, C., Lewis, T. L., Dirks, M., Maurer, C., Ledgeway, T., Guillemot, J.-P., and Lepore, F. (2004). Putting order into the development of sensitivity to global motion. Vis. Res. 44, 2403–2411.
Ellemberg, D., Hammarrenger, B., Lepore, F., Roy, M.S., and Guillemot, J.P. (2001). Contrast dependency of VEPs as a function of spatial frequency: the parvocellular and magnocellular contributions to human VEPs. Spat. Vis. 15, 99–111.
Ellemberg, D., Lewis, T. L., Maurer, D., Brar, S., and Brent, H. P. (2002). Better perception of global motion after monocular than after binocular deprivation. Vis. Res. 42, 169–179.
Ellemberg, D., Lewis, T. L., Meghji, K. S., Maurer, D., Guillemot, J.-P., and Lepore, F. (2003). Comparison of sensitivity to first- and second-order local motion in 5-year-olds and adults. Spatial Vision 16, 419–428.
Gerhardstein, P., Kovacs, I., Ditre, J., and Feher, A. (2004). Detection of contour continuity and closure in three-month-olds. Vis. Res. 44, 2981–2988.
Gogtay, N., Giedd, J. N., Lusk, L., Hayashi, K. M., Greenstein, D., Vaituzis, A. C., Nugent, T. F., Herman, D. H., Clasen, L. S., Toga, A. W., Rapoport, J. L., and Thompson, P. M. (2004). Dynamic mapping of human cortical development during childhood through early adulthood. Proc. Natl. Acad. Sci. U.S.A. 101, 8174–8179.
Gordon, G. E., and McCulloch, D. L. (1999). A VEP investigation of parallel visual pathway development in primary school age children. Doc. Ophthalmol. 99, 1–10.
Goulart, P. R. K., Bandeira, M. L., Tsubota, D., Oiwa, N. N., Costa, M. F., and Ventura, D. F. (2008). A computer-controlled color vision test for children based on the Cambridge Colour Test. Vis. Neurosci. 25, 445–450.
Gronlund, M. A., Aring, E., Landgren, M., and Hellstrom, A. (2007). Visual function and ocular features in children and adolescents with attention deficit hyperactivity disorder, with and without treatment with stimulants. Eye 21, 494–502.
Gunn, A., Cory, E., Atkinson, J., Braddick, O., Wattam-Bell, J., Guzzetta, A., and Cioni, G. (2002). Dorsal and ventral stream sensitivity in normal development and hemiplegia. Neuroreport 13, 843–847.
Gwiazda, J., Bauer, J., Thorn, F., and Held, R. (1997). Development of spatial contrast sensitivity from infancy to adulthood: psychophysical data. Optom. Vis. Sci. 74, 785–789.
Hagen, M. A. (1976). Development of ability to perceive and produce pictorial depth cue of overlapping. Percept. Mot. Skills 42, 1007–1014.
Hammarrenger, B., Lepore, F., Lippe, S., Labrosse, M., Guillemot, J. P., and Roy, M.-S. (2003). Magnocellular and parvocellular developmental course in infants during the first year of life. Doc. Ophthalmol. 107, 225–233.
Hou, C., Gilmore, R. O., Pettet, M. W., and Norcia, A. M. (2009). Spatio-temporal tuning of coherent motion evoked responses in 4–6 month old infants and adults. Vis. Res. 49, 2509–2517.
Johnson, S. P., and Mason, U. (2002). Perception of kinetic illusory contours by two-month-old infants. Child Dev. 73, 22–34.
Julesz, B. (1960). Binocular depth perception of computer-generated patterns. Bell Syst. Tech. J. 39, 1125–1162.
Kanwisher, N., McDermott, J., and Chun, M. M. (1997). The fusiform face area: a module in human extrastriate cortex specialized for face perception. J. Neurosci. 17, 4302–4311.
Kaplan, E. (2004). “The M, P, and K pathways of the primate visual system,” in The Visual Neurosciences, eds L. M. Chalupa, and J. S. Werner (Cambridge, MA: MIT Press), 481–493.
Kavsek, M., Granrud, C. E., and Yonas, A. (2009). Infants’ responsiveness to pictorial depth cues in preferential-reaching studies: a meta-analysis. Infant Behav. Dev. 32, 245–253.
Kemner, C., Lamme, V. A. F., Kovacs, I., and van Engeland, H. (2007). Integrity of lateral and feedbackward connections in visual processing in children with pervasive developmental disorder. Neuropsychologia 45, 1293–1298.
Khazipov, R., and Luhmann, H. J. (2006). Early patterns of electrical activity in the developing cerebral cortex of humans and rodents. Trends Neurosci. 29, 414–418.
Kiorpes, L., and Movshon, J. A. (2004). “Neural limitations on visual development in primates,” in The Visual Neurosciences, eds L. M. Chalupa, and J. S. Werner (Cambridge, MA: MIT Press), 892–907.
Klaver, P., Lichtensteiger, J., Bucher, K., Dietrich, T., Loenneker, T., and Martin, E. (2008). Dorsal stream development in motion and structure-from-motion perception. Neuron 39, 1815–1823.
Knoblauch, K., Bieber, M. L., and Werner, J. S. (1998). M- and L-cones in early infancy: I. VEP responses to receptor-isolating stimuli at 4- and 8-weeks of age. Vis. Res. 38, 1753–1764.
Knoblauch, K., and Shevell, S. K. (2004). “Color appearance,” in The Visual Neurosciences, eds L. M. Chalupa and J. S. Werner (Cambridge, MA: MIT Press), 892–907.
Knoblauch, K., Vital-Durand, F., and Barbur, J. L. (2001). Variation of chromatic sensitivity across the life span. Vis. Res. 41, 23–36.
Kovacs, I., Kozma, P., Feher, A., and Benedek, G. (1999). Late maturation of visual spatial integration in humans. Proc. Natl. Acad. Sci. U.S.A. 96, 12204–12209.
Lamme, V. A. F., and Roelfsema, P. R. (2000). The distinct models of vision offered by feedforward and recurrent processing. Trends Neurosci. 23, 571–579.
Lamme, V. A. F., Super, H., and Spekreijse, H. (1998). Feedforward, horizontal, and feedback processing in the visual cortex. Curr. Opin. Neurobiol. 8, 529–535.
Lamme, V. A. F., Van Dijk, B., and Spekreijse, H. (1992). Texture segregation is processed by primary visual cortex in man and monkey. Evidence from VEP experiments. Vis. Res. 32, 797–807.
Lenroot, R. K., and Giedd, J. N. (2006). Brain development in children and adolescents: insights from anatomical magnetic resonance imaging. Neurosci. Biobehav. Rev. 30, 718–729.
Lewis, T. L., and Maurer, D. (2005). Multiple sensitive periods in human visual development: evidence form visually deprived children. Dev. Psychobiol. 46, 163–183.
Madrid, M., and Crognale, M. (2000). Long-term maturation of visual pathways. Vis. Neurosci. 17, 831–837.
Marwick, K., and Hall, J. (2008). Social cognition in schizophrenia: a review of face processing. Br. Med. Bull. 88, 43–58.
Mason, A. J. S., Braddick, O. J., and Wattam-Bell, J. (2003). Motion coherence thresholds in infants – different tasks identify at least two distinct motion systems. Vis. Res. 43, 1149–1157.
Mitchell, T. V., and Neville, H. J. (2004). Asynchronies in the development of electrophysiological responses to motion and color. J. Cogn. Neurosci. 16, 1363–1374.
NAS-NRC. (1980). Recommended and standard procedures for the clinical measurement and specification of visual acuity: report of working group 39. Adv. Ophthalmol. 41, 103–148.
Nassi, J. J., and Callaway, E. M. (2009). Parallel processing strategies of the primate visual system. Nat. Rev. Neurosci. 10, 360–372.
Nawrot, E., Mayo, S. L., and Nawrot, M. (2009). The development of depth perception from motion parallax in infancy. Atten. Percept. Psychophys. 71, 194–199.
Norcia, A., Tyler, C., and Hamer, R. (1990). Development of contrast sensitivity in the human infant. Vis. Res. 30, 1475–1486.
Norcia, A. M., Pei, F., Bonneh, Y., Hou, C., Sampath, V., and Pettet, M. W. (2005). Development of sensitivity to texture and contour information in the human infant. J. Cogn. Neurosci. 17, 569–579.
Norcia, A. M., and Tyler, C. W. (1985). Spatial frequency sweep VEP: visual acuity during the first year of life. Vis. Res. 25, 1399–1408.
Odom, J., Bach, M., Barber, C., Brigell, M., Marmor, M., Tormene, A. P., Holder, G. E., and Vaegan, (2004). Visual evoked potentials standard. Doc. Ophthalmol. 108, 115–123.
Packer, O., Hendrickson, A. E., and Curcio, C.A. (1990). Development redistribution of photoreceptors across the Macaca nemestrina (pigtail macaque) retina. J. Comp. Neurol. 298, 472–493.
Parrish, E. E., Giaschi, D. E., Boden, C., and Dougherty, R. (2005). The maturation of form and motion perception in school age children. Vis. Res. 45, 827–837.
Pei, F., Baldassi, S., Procida, G., Igliozzi, R., Tancredi, R., Muratori, F., and Cioni, G. (2009). Neural correlates of texture and contour integration in children with autism spectrum disorder. Vis. Res. 49, 2140–2150.
Peterzell, D. H., Chang, S. K., Kelly, J. P., Hartzler, A. H., and Teller, D. Y. (1997). The development of spatial frequency covariance channels for color and luminance: psychophysical (FPL) and electrophysiological (sweep-VEP) studies. Perception 26, 759–760.
Peterzell, D. H., Chang, S. K., and Teller, D. Y. (2000). Spatial frequency tuned covariance channels for red-green and luminance-modulated gratings: psychophysical data from human infants. Vis. Res. 40, 431–444.
Pienaar, R., Fischl, B., Caviness, V., Makris, N., and Grant, P. E. (2008). A methodology for analyzing curvature in the developing brain from preterm to adult. Int. J. Imaging Syst. Technol. 18, 42–68.
Pokorny, J., and Smith, V. C. (2004). “Chromatic discrimination,” in The Visual Neurosciences, eds L. M. Chalupa and J. S. Werner (Cambridge, MA: MIT Press), 733–746.
Pompe, M. T., Kranjc, B. S., and Brecelj, J. (2006). Visual evoked potentials to red- green stimulation in schoolchildren. Vis. Neurosci. 23, 447–451.
Prager, T. C., Zou, Y. L., Jensen, C. L., Fraley, J. K., Anderson, R. E., and Heird, W. C. (1999). Evaluation of methods for assessing visual function of infants. J. AAPOS 3, 275–282.
Quinn, P. C., Brown, C. R., and Streppa, M. L. (1997). Perceptual organizations of complex visual configurations by young infants. Infant Behav. Dev. 20, 35–46.
Quiroga, R. Q., Reddy, L., Kreiman, G., Koch, C., and Fried, I. (2005). Invariant visual representation by single neurons in the human brain. Nature 435, 1102–1107.
Rieth, C., and Sireteanu, R. (1994). Texture segmentation and ‘pop-out’ in infants and children: the effect of test field size. Spat. Vis. 8, 173–191.
Roelfsema, P. R., Lamme, V. A. F., Spekreijse, H., and Bosch, H. (2002). Figure-ground segregation in a recurrent network architecture. J. Cogn. Neurosci. 14, 525–537.
Rogers, S. (2009). What are infant siblings teaching us about autism in infancy? Autism Res. 2, 125–137.
Rugg, M. D., and Coles, M. G. H. (1996). Electrophysiology of Mind. Event-related Brain Potentials and Cognition. Oxford: Oxford University Press.
Schenk, T., and McIntosh, R. D. (2010). Do we have independent visual streams for perception and action? Cogn. Neurosci. 1, 52–62.
Schrauf, M., Wist, E. R., and Ehrenstein, W. H. (1999). Development of dynamic vision based on motion contrast. Exp. Brain Res. 124, 469–473.
Simmons, D. R., Robertson, A. E., McKay, L. S., Toal, E., McAleer, P., and Pollick, F. E. (2009). Vision in autism spectrum disorders. Vis. Res. 49, 2705–2739.
Sireteanu, R., and Rieth, C. (1992). Texture segregation in infants and children. Behav. Brain Res. 49, 133–139.
Skoczenski, A. M., and Norcia, A. M. (2002). Late maturation of visual hyperacuity. Psychol. Sci. 13, 537–541.
Sloper, J. J., and Collins, A.D. (1998). Reduction in binocular enhancement of the visual-evoked potential during development accompanies increasing stereoacuity. J. Pediatr. Ophthalmol. Strabismus 35, 154–158.
Snellen, H. (1965). “Cited in Riggs LA. Visual acuity,” in Vision and Visual Perception, ed. C. H. Graham (New York: Wiley).
Snowden, R. J., and Braddick, O. J. (1989). Extension of displacement limits in multiple-exposure sequences of apparent motion. Vis. Res., 29, 1777–1787.
Takai, Y., Sato, M., Tan, R., and Hirai, T. (2005). Development of stereoscopic acuity: longitudinal study using a computer-based random-dot stereo test. Jpn. J. Ophthalmol. 49, 1–5.
Teller, D. Y. (1979). The forced-choice preferential looking procedure: a psychophysical technique for use with human infants. Infant Behav. Dev. 2, 135–153.
Teller, D. Y., McDonald, M. A., Preston, K., Sebris, S. L., and Dobson, V. (1986). Assessment of visual acuity in infants and children: the acuity card procedure. Dev. Med. Child Neurol. 28, 779–789.
Teller, D. Y., Peeples, D. R., and Sekel, M. (1978). Discrimination of chromatic from white light by two-month-old human infants. Vis. Res. 18, 41–48.
Thibault, D., Brosseau-Lachaine, O., Faubert, J., and Vital-Durand, F. (2007). Maturation of the sensitivity for luminance and contrast modulated patterns during development of normal and pathological human children. Vis. Res. 47, 1561–1569.
Tucker, T. R., and Fitzpatrick, D. (2004). “Contributions of vertical and horizontal circuits to the response properties of neurons in primary visual cortex,” in The Visual Neurosciences, eds L. M. Chalupa and J. S. Werner (Cambridge, MA: MIT Press), 733–746.
Ungerleider, L. G., and Mishkin, M. (1982). “Two cortical visual systems,” in Analysis of Visual Behavior, eds D. J. Ingle, M. A. Goodale, and R. J. W. Mansfield (Cambridge, MA: MIT Press), 549–586.
Varner, D., Cook, J. E., Schneck, M. E., McDonald, M., and Teller, D. Y. (1985). Tritan discriminations by 1- and 2-month-old human infants. Vis. Res. 25, 821–831.
Vidyasagar, T. R., and Pammer, K. (2010). Dyslexia: a deficit in visuo-spatial attention, not in phonological processing. Trends Cogn. Sci. 14, 57–63.
Vlamings, P. H. J. M., van Daalen, E., van der Gaag, R. J., and Kemner, C. (2010a). Basic abnormalities in visual processing affect face processing at an early age in autism spectrum disorder. Biol. Psychiatry 68, 1107–1113.
Vlamings, P. H. J. M., Jonkman, L. M., and Kemner, C. (2010b). An eye for detail: an event-related potential study of the rapid processing of fearful facial expressions in children. Child Dev. 81, 1304–1319.
Walraven, J., and Janzen, P. (1993). TNO stereopsis test as an aid to the prevention of amblyopia. Ophthalmic Physiol. Opt. 13, 350–356.
Wattam-Bell, J. (1994). Coherence thresholds for discrimination of motion direction in infants. Vis. Res. 34, 877–883.
Wattam-Bell, J. (1996a). Visual motion processing in one-month-old infants: preferential looking experiments. Vis. Res. 36, 1671–1677.
Wattam-Bell, J. (1996b). Visual motion processing in one-month-old infants: habituation experiments. Vis. Res. 36, 1679–1685.
Wattam-Bell, J., Birties, D., Nystrom, P., van Hofsten, C., Rosander, K., Anker, S., Atkinson, J., and Braddick, O. (2010). Reorganization of global form and motion processing during human visual development. Curr. Biol. 20, 411–415.
Williams, D. W., and Sekuler, R. (1984). Coherent global motion percepts from stochastic local motions. Vis. Res. 24, 55–62.
Zanker, J., Mohn, G., Weber, U., Zeitler-Driess, K., and Fahle, M. (1992). The development of vernier acuity in human infants. Vis. Res. 32, 1557–1564.
Zeki, S. (2001). Localization and globalization in conscious vision. Annu. Rev. Neurosci. 24, 57–86.
Appendix

Table A1. Overview of methods applied in studies investigating form characteristic processing.
Keywords: visual function, infant, childhood, adolescence, brain, psychophysics
Citation: van den Boomen C, van der Smagt MJ and Kemner C (2012) Keep your eyes on development: the behavioral and neurophysiological development of visual mechanisms underlying form processing. Front. Psychiatry 3:16. doi: 10.3389/fpsyt.2012.00016
Received: 23 June 2011; Accepted: 17 February 2012;
Published online: 12 March 2012.
Edited by:
Michael H. Bloch, Yale University, USACopyright: © 2012 van den Boomen, van der Smagt and Kemner. This is an open-access article distributed under the terms of the Creative Commons Attribution Non Commercial License, which permits non-commercial use, distribution, and reproduction in other forums, provided the original authors and source are credited.
*Correspondence: C. van den Boomen, Department of Experimental Psychology, Helmholtz Institute, Utrecht University, Heidelberglaan 2, Van Unnik Building, Room 16.17, 3584 CS Utrecht, Netherlands. e-mail: c.vandenboomen@uu.nl