 Sabin Khadka1
 Godfrey D. Pearlson1,2,3
 Vince D. Calhoun2,4,5
 Jingyu Liu4
 Joel Gelernter2
 Katie L. Bessette1
 Michael C. Stevens1,2*
- 1Olin Neuropsychiatry Research Center, Institute of Living, Hartford HealthCare, Hartford, CT, USA
- 2Department of Psychiatry, Yale University School of Medicine, New Haven, CT, USA
- 3Department of Neurobiology, Yale University School of Medicine, New Haven, CT, USA
- 4The Mind Research Network, Albuquerque, NM, USA
- 5Department of Electrical and Computer Engineering, University of New Mexico, Albuquerque, NM, USA
Background: Attention deficit hyperactivity disorder (ADHD) is a prevalent neurodevelopmental disorder affecting children, adolescents, and adults. Its etiology is not well understood, but it is increasingly believed to result from diverse pathophysiologies that affect the structure and function of specific brain circuits. Although one of the best-studied neurobiological abnormalities in ADHD is reduced fronto-striatal-cerebellar gray matter (GM) volume, its specific genetic correlates are largely unknown.
Methods: In this study, T1-weighted MR images of brain structure were collected from 198 adolescents (63 ADHD-diagnosed). A multivariate parallel independent component analysis (Para-ICA) technique-identified imaging genetic relationships between regional GM volume and single nucleotide polymorphism data.
Results: Para-ICA analyses extracted 14 components from genetic data and 9 from MR data. An iterative cross-validation using randomly chosen subsamples indicated acceptable stability of these ICA solutions. A series of partial correlation analyses controlling for age, sex, and ethnicity revealed two genotype–phenotype component pairs significantly differed between ADHD and non-ADHD groups, after a Bonferroni correction for multiple comparisons. The brain phenotype component not only included structures frequently found to have abnormally low volume in previous ADHD studies but was also significantly associated with ADHD differences in symptom severity and performance on cognitive tests frequently found to be impaired in patients diagnosed with the disorder. Pathway analysis of the genotype component identified several different biological pathways linked to these structural abnormalities in ADHD.
Conclusion: Some of these pathways implicate well-known dopaminergic neurotransmission and neurodevelopment hypothesized to be abnormal in ADHD. Other more recently implicated pathways included glutamatergic and GABA-eric physiological systems; others might reflect sources of shared liability to disturbances commonly found in ADHD, such as sleep abnormalities.
Introduction
Attention deficit hyperactivity disorder (ADHD) is a complex neurodevelopmental disorder (1) whose etiology is not fully understood. In attempts to understand its strong (70–80%) heritability (2, 3), linkage studies have identified potential susceptibility loci on reported chromosomal regions, including 16p13 and 17p11 (3). Candidate-gene studies have implicated some single nucleotide polymorphisms (SNPs) associated with dopaminergic (DA), serotonergic, and noradrenergic systems implicated by pharmacologic response and neuroimaging research (3, 4). A few genome-wide association studies (GWAS) have found evidence that CDH13, GFOD1, FBXO33, and SLC9A9 genes might be associated with ADHD (3, 5). Quantitative trait analysis of ADHD has shown associations between inattentive and hyperactive/impulsive symptoms and variations in glutamate receptor GRIN2B subunit genes (6). Also, GRIN2A and GRIN2B are reported to play role in neurodevelopment (7). While these findings represent a starting place, ADHD is believed to be a polygenic disorder that arises from the contributions of numerous known and yet-to-be-identified gene variants (8), along with noteworthy evidence for social, environmental, and/or gene × environment interactions (9, 10).
For such a complex disorder, simply identifying associations between genes and the broad diagnostic phenotype might not increase understanding as precisely or as rapidly as identifying links between the genes and specific features of the disorder, such as neuroimaging-measured brain structure (11). Meta-analyses of ADHD brain structure studies have revealed that ADHD samples often show reduced total and right cerebral gray matter (GM), cerebellum, right caudate, right putamen, and globus pallidus volumes (12, 13). Also, the parietal cortex and hippocampus are often, though less consistently, found to be abnormal in ADHD (10). One of the most reliable findings in ADHD is reduced frontal lobe volume or cortical thickness (10, 12–14) particularly in the right frontal lobe, which includes brain regions linked to the types of cognitive and executive impairments frequently found in ADHD (15).
Neuroimaging genetics approaches offer potential understanding of biological pathways related to numerous, likely interacting genes and specific mechanisms of brain growth and function that contribute to inherited behavioral and neuropsychiatric diseases. However, it remains statistically challenging to identify such genes. Univariate GWAS methods are constrained by large sample size requirements to detect the weak effects characteristic of common disease/common variant models, given the need to Bonferroni correction for number of SNPs evaluated. In recent years, multivariate analysis techniques, such as parallel independent component analysis (Para-ICA), have been developed. These techniques identify relationships between clusters of interrelated SNPs and complex phenotypic characteristics (e.g., brain structure) in a data-driven manner (16, 17). Para-ICA has been used successfully in imaging genetics studies (18) to yield robust, theoretically informative results with practical sample sizes (19, 20). Such multivariate techniques have a useful role in discovering likely relationships between genes and neurobiology within a psychiatric disorder, which then can be explored using conventional genetic approaches. Moreover, Para-ICA is particularly well suited in identifying and then annotating aggregates (or “networks”) of genes that contribute to particular physiological pathways. Pathway analysis using currently available maps [e.g., Kyoto Encyclopedia of Genes and Genomes (KEGG)] (21) of molecular interactions that could underlie biological processes or disease might rapidly advance our understanding of disorder pathophysiology. For instance, ADHD researchers have found that specific physiological pathways are linked to the broad ADHD phenotype (22), specific ADHD symptoms (23), or cognitive performance patterns within ADHD samples (24).
Because GWAS analysis are beyond the capability of the typical sample sizes collected in neuroimaging studies, we are not interested in attempting to link genes to broad ADHD behavioral phenotype. However, Para-ICA is ideally suited for identifying novel brain structure intermediate phenotypes in sample of modest size by linking aggregates of SNPs to specific GM volume characteristics already known to be relevant to ADHD. We used Para-ICA to elucidate the relationships between regional GM measurements previously found to be abnormal in ADHD and clusters of SNPs from an arrayof >240,000 putatively functional exomic markers. Specifically, we assessed genetic relationships of structural GM in DSM-IV-combined subtype ADHD with relatively low rates of psychiatric comorbidity and healthy comparison adolescents, simultaneously, by identifying what aspects of brain structure or genotype covaried systematically across the sample to form independent component (IC) aggregates. The study used Illumina HumanExome-12v1-2 chip (Illumina, San Diego, CA, USA) for genotyping and a voxel-based morphometry (VBM) approach (25) to characterize participants’ voxel-wise GM volume obtained from T1-weighted MRI scans of brain structure. The content of these components is determined from natural aggregation found within each datatype. Thus, it is not possible to specify a priori the content of different components within the genetic or the neuroimaging modalities. Instead, components are assigned simple names for convenient labeling (e.g., G1, G2, etc. for genetic data or S1, S2, etc. for brain structure data) so they can be later described in detail after group-based hypothesis-testing, which determines their relevance to the disorder. To identify genetic neuroimaging relationships that differed between ADHD and non-ADHD, we extracted subject-dependent loading coefficients (LCs) of each IC for random effects statistical testing. Finally, for those component pairs (e.g., G1–S2) that differed between study groups, we characterized various molecular biological pathways associated with detected gene aggregates to provide information about possible physiological processes that might have given rise to the ADHD brain structure abnormalities detected. We hypothesized that brain phenotype component depicting ADHD-relevant regions (fronto-striatal, fronto-parietal, or cerebellar) would be associated with specific gene networks related to brain development and catecholaminergic neurotransmission. Furthermore, we predicted that ADHD subjects would show differences in both brain phenotypes and gene networks when compared to healthy controls. To enrich results interpretation, post hoc tests explored relationships between Para-ICA-derived LCs and ADHD clinical features.
Materials and Methods
All study procedures were approved by Hartford Hospital’s Institutional Review Board. Written permission was obtained from parents/legal guardians of all participants, and assent was obtained from all participants under the age of 18. The sample comprised 63 community-recruited patients diagnosed with the combined subtype of ADHD (DSM-IV 314.01) and 135 healthy comparison participants. Psychiatric diagnoses for research purposes of all DSM-IV Axis I disorders were made using the Kiddie-Schedule for Affective Disorders and Schizophrenia-Present and Lifetime version (K-SADS-PL) (26) conducted by trained clinical research staff, under the supervision of a licensed clinical psychologist (Michael C. Stevens). Separate collateral interviews with at least one parent/guardian were incorporated into diagnostic decisions made after synthesizing information in weekly research group meetings. Participants were excluded if they (a) had lifetime history of bipolar disorder, psychotic disorder, obsessive–compulsive disorder, PTSD, Tourette’s disorder, pervasive developmental disorder; (b) had current DSM-IV substance dependence, major depressive disorder, or anxiety disorder; (c) had IQ estimate <80 determined by Wechsler abbreviated Scale of Intelligence; or (d) were taking Wellbutrin (Buproprion), Strattera (Atomoxetine HCl), Cylert (Pemoline), or Provigil (Modafinil). Sample characteristics are shown in Table S1 in Supplementary Material. Clinical assessment was supplemented with parent-reported Brown attention deficit disorder (ADD) scale (27) scores and performance on Conner’s continuous performance test (CPT-II) (28).
Structural MRI and Data Preparation
Structural MR images were obtained using a Siemens 3T Allegra MRI scanner at Olin Neuropsychiatry Research Center at Hartford Hospital (3D MPRAGE; TR = 2300 ms, TE = 2.74 ms, TI = 900 ms, flip angle = 8°, FOV = 17 mm × 256 mm, matrix = 176 × 256 × 176, voxel size = 1 mm × 1 mm × 1 mm, pixel bandwidth = 190 Hz; 7.09 min). MR images were examined and processed using VBM8 toolbox (29) with default settings, as follows: (i) bias-correction, (ii) tissue classification, (iii) spatial normalization to Montreal Neurological Institute (MNI) space, (iv) high dimensional non-linear diffeomorphic anatomical registration through exponentiated lie algebra (DARTEL) normalization, and (v) finally, the normalized GM segments were modulated to correct and preserve original local volume change. The processing pipeline is explained in detail in the VBM8 tutorial.1 Modulated GM volumes were smoothed with 4 mm full width half maximum Gaussian kernel.
SNPs Data Collection and Preprocessing
Genomic DNA was extracted from saliva collected from each participant using Oragene collection kits (30). The Illumina HumanExome-12v1-2 chip was used for genotyping. Genotype data were preprocessed using PLINK software (31) following quality control steps (32) detailed in Figure 1. SNPs in high linkage disequilibrium (LD) were removed (window size of SNPs = 50, number of SNPs to shift the window at each step = 5 and r2 = 0.7) to increase independence between markers. Custom Matlab scripts using an algorithm similar to EIGENSTRAT (33) performed principal component analysis of the genetic dataset. To correct for population stratification bias, genetic data were corrected using top two eigenvectors that showed significance association with self-reported race/ethnicity. Logistic regression (adjusting for age, sex, and top two eigenvectors representing self-reported ethnicity) was performed to clean the data and reduce the number of SNPs. SNPs showing association with ADHD (uncorrected p-value < 0.1) were considered for further analysis. The total number of SNPs further considered with Para-ICA was 3139 (see Table S2 in Supplementary Material for complete list of SNPs and their associated genes used for Para-ICA). The entire set of markers was annotated to genes based on their coordinates using ANNOVAR software (34).
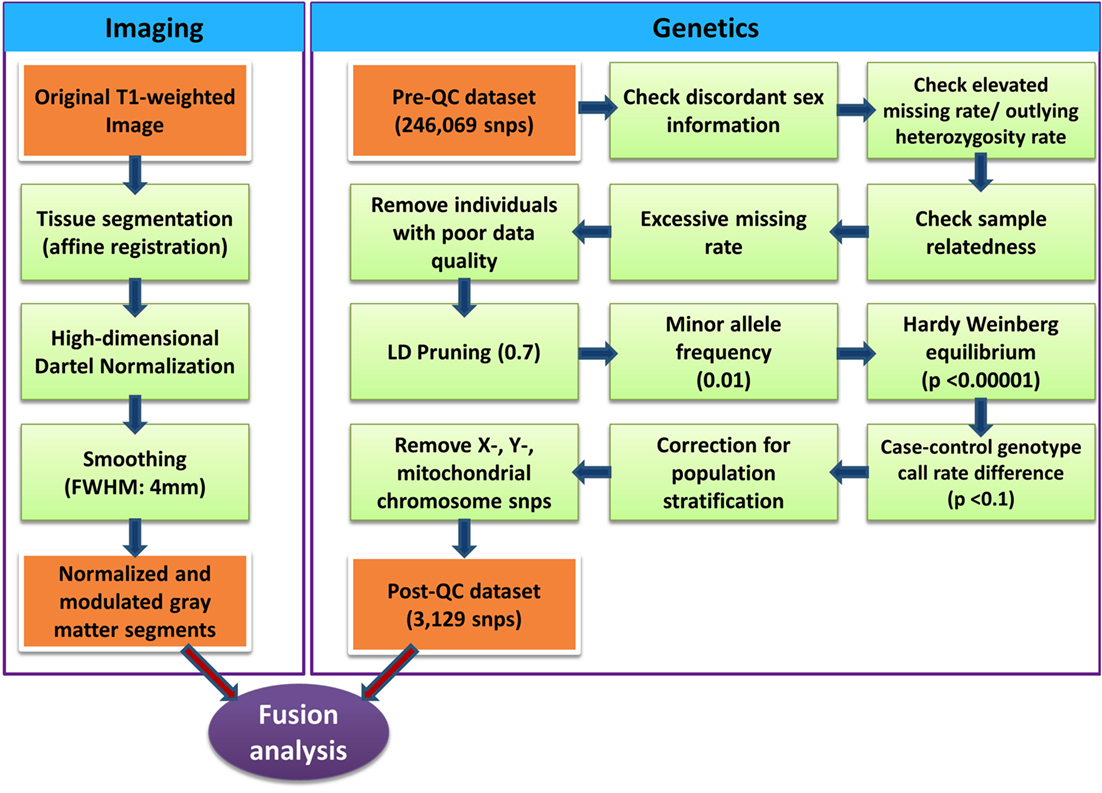
Figure 1. Illustration of quality control processing for SNP data and structural MR imaging data.
Parallel Independent Component Analysis
Parallel independent component analysis between SNPs data and modulated GM volume used the Fusion ICA Toolbox2 within Matlab 7.7. Practical implementation of Para-ICA for gene and MRI data is explained in detail in a recent review paper (18), and an overview is shown in Figure S1 in Supplementary Material. Because our study goals using Para-ICA technique have numerous, important differences from a GWAS analysis approach that has been highly influential in psychiatric genetics, it is useful to briefly review the methods involved to highlight the different expectations involved. Para-ICA is a data-driven approach that estimates maximally ICs within gene and brain phenotype data separately and also maximizes the association between modalities using an entropy term based on information theory (16–18). The goal of Para-ICA is not to identify single gene association. Instead, ICA is run separately, in parallel, on both modalities to identify collections of interrelated SNPs and to isolate specific features within the brain structure maps that systematically covary across participants. Not only do the components identified by Para-ICA represent meaningful aggregates but also the number of subsequent statistical tests gets reduced substantially. Thus, Para-ICA allows us to confidently assess the relationship between modalities (e.g., genetic and MRI data) as well as group difference (e.g., patient versus controls) for each component of each modality in moderate-sized samples. As such, it is ideal to identify relationships between modalities within a specific disorder that otherwise would require tens of thousands of participants using GWAS techniques. Although techniques like Para-ICA can help to rapidly advance our understanding of complex gene–brain disorder relationships, in many applications, it should be considered exploratory, with its results needing replication.
For the current analysis, the ratio of sample size to number of SNPs (198/3139) in our study is consistent with validation work showing that Para-ICA will provide accurate results (35). The number of ICs estimated using minimum description length criteria (18, 36) was 14 for genetic data and 9 for MRI data. Importantly, because full replication was not possible given the data available, the consistency and stability of the components was examined using leave-N-subjects-out (5% of total subjects) cross-validation technique (18, 37), run iteratively across randomly chosen sub-samples. This reliability validation method revealed that the stability of genetic and brain phenotype components were acceptable – 70 and 90%, respectively. The LCs for each component × modality × subject were extracted, and partial correlation [controlling for age, sex, top two eigenvectors representing self-reported ethnicity, and group association vector (ADHD versus HC)] between LCs of both modalities was computed in SPSS v19.0 (IBM, Inc.). Component pairs that survived Bonferroni correction for multiple comparison [p < 0.05/(9 × 14)] were examined for post hoc pairwise group differences. To correct for gene size bias and select dominant genes in a component, gene-based association values were calculated using VEGAS software (38). To define dominant regions of component maps, an arbitrary threshold of |z| > 1.5 and cluster size k > 50 voxels was selected. To enrich possible interpretation of the ICs identified by Para-ICA, we also assessed linear associations between clinical measures (e.g., symptom sums or cognitive test scores) and Para-ICA-derived genetic and phenotype components, controlling for age and sex. Because these were exploratory post hoc analyses, significant correlations (p < 0.05, uncorrected) are reported.
Genetic Pathway Analysis
To identify underlying biological pathways of the gene sets, we used the ConsensusPath database.3 Only genes that showed gene-based trait association of p-value < 0.05 were selected for pathway enrichment analysis. The lists of significant genes of component G2 (after gene size correction) are listed in Table S3 in Supplementary Material. The p-value for each pathway is calculated using a hypergeometric approach based on number of genes in both user-specified gene set and genes associated with each pathway. The significance values were FDR-adjusted to correct for multiple comparison (39).
Results
Genotype–Phenotype Associations
Partial correlation analysis of component coefficients revealed significant associations among five phenotype–genotype component pairs. Three brain phenotype ICs (designated as S1, S2, and S3) showed significant correlation with three genetic ICs (designated as G1, G2, and G3). Pearson’s correlation coefficients (along with their associated p-value) of genetic ICs and brain phenotype ICs are listed in Table 1. Of these, the S1–G2 and S2–G2 pairs showed a study group difference in LCs for both the genetic and brain phenotype components (Figure 2), making these components of primary interest to our study aims. Levene’s test for equality of variances confirmed the variance between groups were similar.
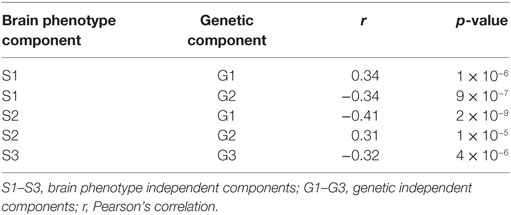
Table 1. Significant brain phenotype–genetic component association.
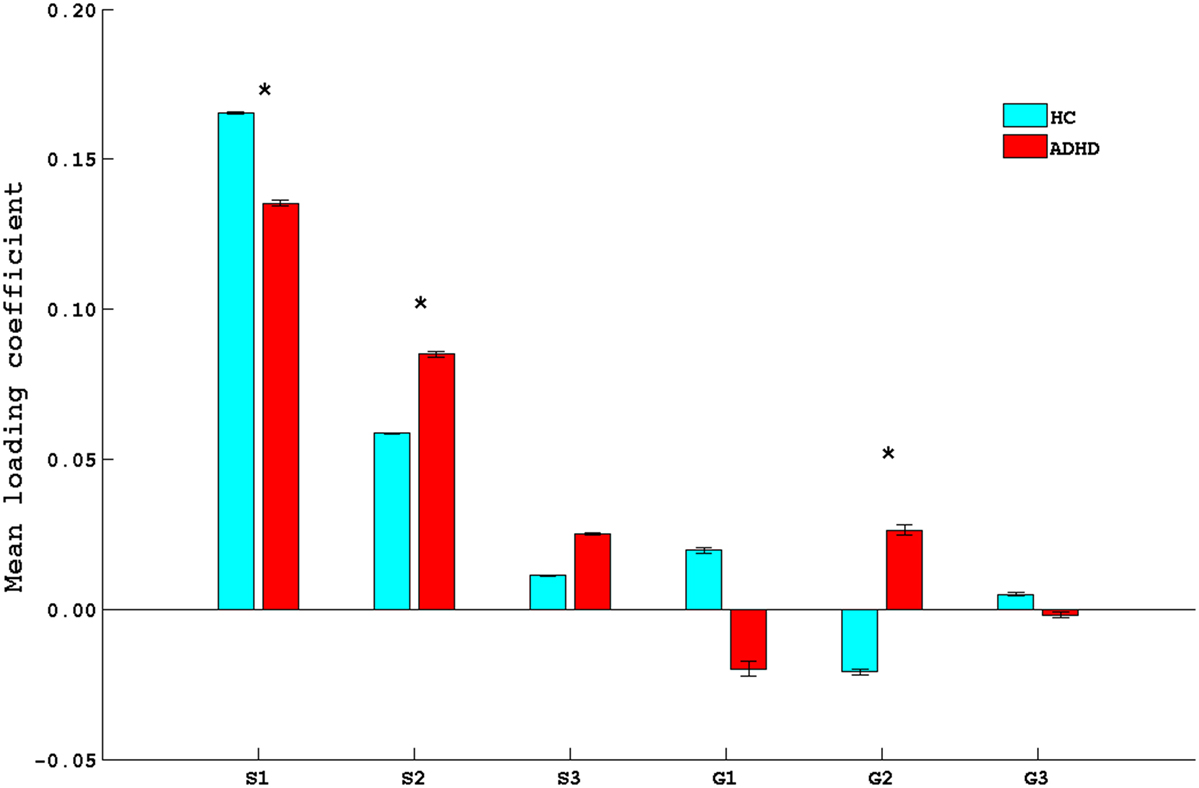
Figure 2. Bar plot of mean loading coefficients of brain phenotype component and genetic component. * indicates group differences among ADHD and HC with p < 0.05. HC, healthy controls; ADHD, attention deficit hyperactive disorder.
Figures 3 and 4 depict these S1–G2 and S2–G2 component pairs. For both, ADHD participants showed a stronger genotype–phenotype relationship than non-ADHD. The significant brain regions in brain phenotype components S1 and S2 are listed in Tables S4 and S5 in Supplementary Material respectively, and are shown in Figures 3B and 4B respectively. The most prominent regions within brain phenotype component S1 were anterior/mid-cingulate gyrus and bilateral anterior insula. Bilateral basal ganglia (caudate and both dorsal and ventral putamen), mid-cingulate, and thalamus were the most strongly implicated regions in S2. Both components included other brain regions, although with lower evidence for their association with the component. S1 also contained bilateral cerebellum, posterior cingulate, thalamus, fusiform, and parahippocampus gyrus. S2 also included cerebellum, mid- and posterior cingulate, fusiform, rostral cingulate/orbitofrontal cortex, and thalamus. Many of these other regions also have been found to be structurally abnormal in ADHD. Overlap between the brain phenotype components was seen only in regions of anterior and posterior cingulate, differing in how strongly they loaded on each component (e.g., anterior cingulate loading strongest for S1; posterior cingulate for S2).
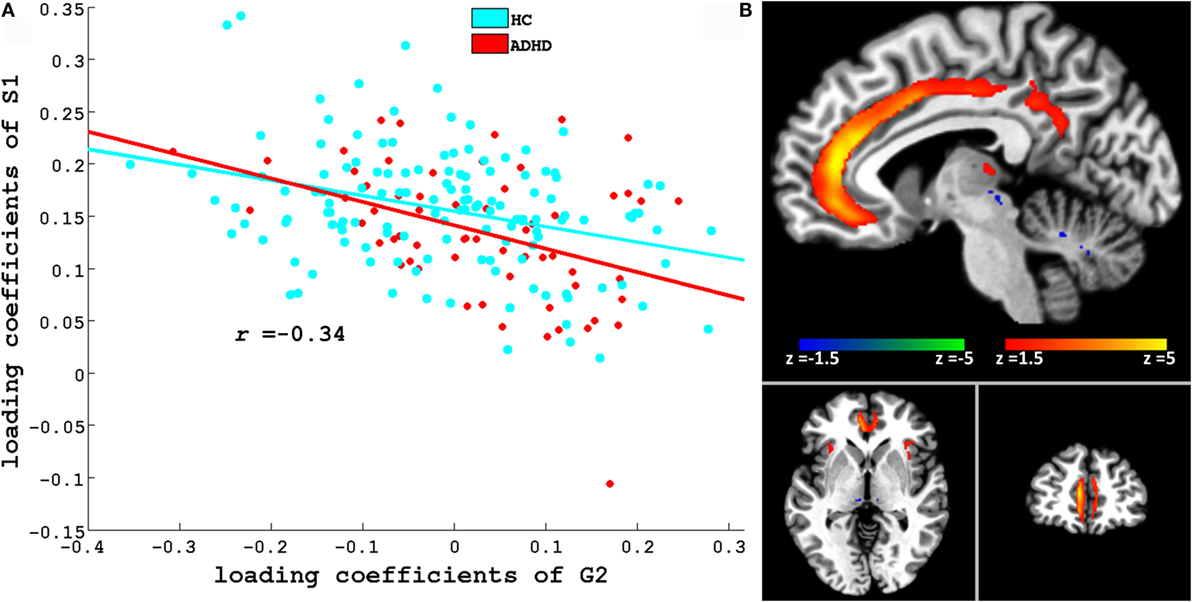
Figure 3. (A) Scatter plots of loading coefficient of brain phenotype component S1 and genetic component G2. Scatter plot and line in red and cyan color indicates ADHD and HC group, respectively. (B) Significant regions in S1. Brain slices shown in the above figure are x = −6, y = 46, and z = −3 in Montreal Neurological Institute (MNI) space.
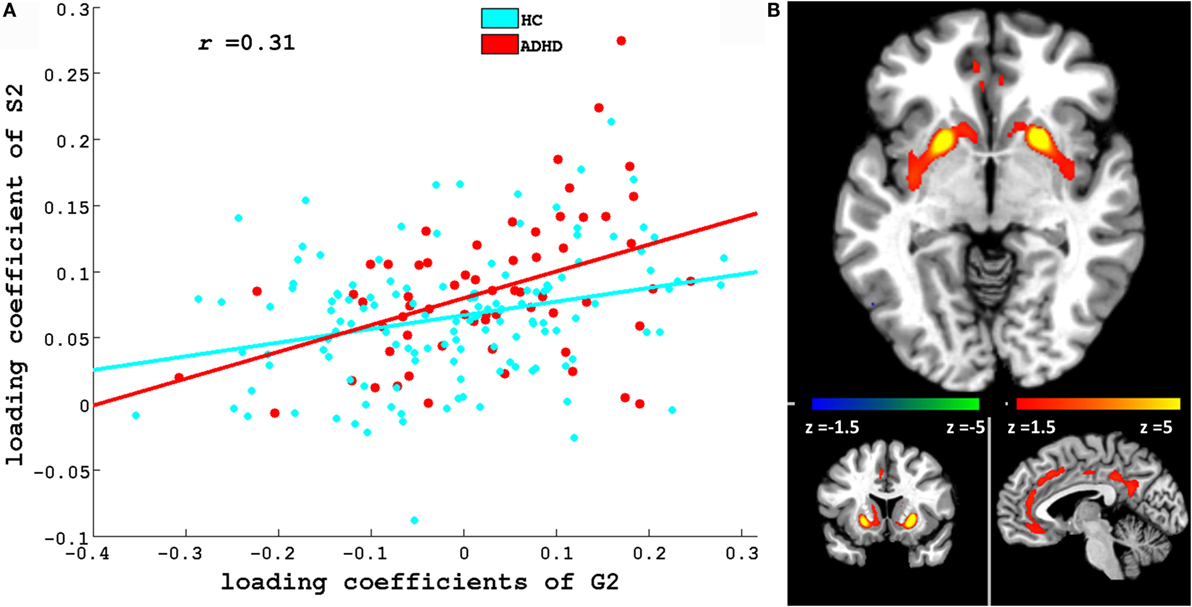
Figure 4. (A) Scatter plots of loading coefficient of brain phenotype component S2 and genetic component G2. Scatter plot and line in red and cyan color indicates ADHD and HC group, respectively. (B) Significant regions in S2. Brain slices shown in the above figure are x = −4, y = 13, and z = −6 in Montreal Neurological Institute (MNI) space.
Post hoc testing revealed correlations between S2’s LCs and scores on the Brown ADD scale’s attention [r = 0.32, p(uncorrected) = 0.03], effort [r = 0.37, p(uncorrected) = 0.01], affect [r = 0.34, p(uncorrected) = 0.02], and working memory [r = 0.38, p(uncorrected) = 0.01] scores. The Brown ADD scale effort score also showed correlation between S1’s LCs [r = −0.30, p(uncorrected) = 0.04]. Also, the S2 LCs were correlated with the CPT-II omission [r = 0.45, p(uncorrected) = 0.002] and variability [r = 0.32, p(uncorrected) = 0.03] standardized scores. The LCs of the G1 correlated with CPT-II Omission [r = 0.33, p(uncorrected) = 0.02]. Although none of the correlations survived multiple comparison correction when tested as a complete set, these exploratory results reinforce the relevance of these brain phenotype components to clinically relevant ADHD dysfunction. ADHD symptom severity (i.e., K-SADS-PL symptom count) was uncorrelated with either genotype or phenotype LCs.
The S3–G3 pair was less informative for our primary objective. Although knowing what SNPs are associated with this collection of brain regions is valuable, neither its phenotype nor genotype component coefficients differed between groups. Brain regions comprising the S3 component are listed in Table S6 in Supplementary Material and depicted in Figure S2 in Supplementary Material. Figure S2 in Supplementary Material also depicts scatterplots of the other significantly linked brain phenotype and genotype component pairs that are not further considered.
Pathway Enrichment Analysis
Significant KEGG pathways associated with G2-identified genoptypes along with uncorrected p and corrected q values are listed in Table 2. These included pathways involved in neurotransmission (glutamatergic synapse, DA synapse, retrogade endocannabinoid signaling, GABAergic synapse, and cholinergic synapse), neurodevelopment (Rap1 signaling, neuroactive ligand–receptor interaction), and other functions, such as circadian entrainment, insulin secretion, hypertropic cardiomyopathy, dilated cardiomyopathy, the estrogen signaling pathway, and endocytosis. As discussed below, these pathways represent a diverse mix of biological systems – some are already known to be implicated in ADHD, while others represent relatively novel findings for the disorder.
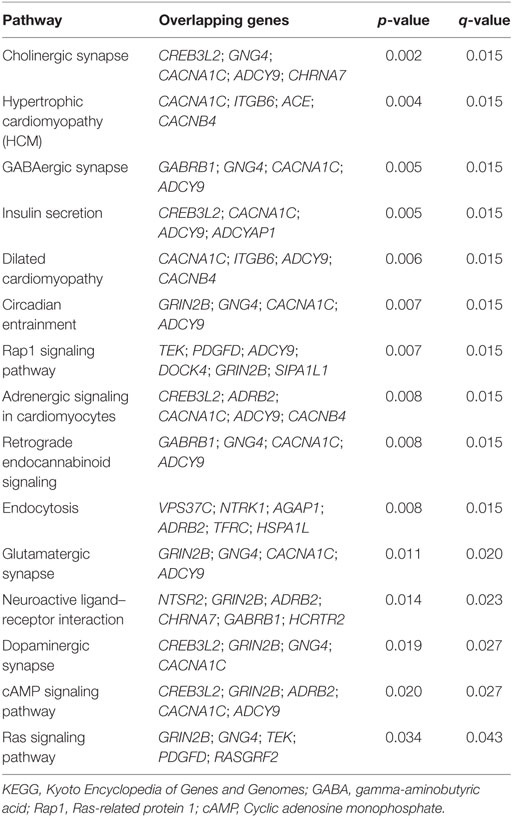
Table 2. Significant KEGG pathways for G2.
Discussion
By using multivariate Para-ICA to link specific GM volume measurements often found to be abnormal in ADHD with several genetic pathways, we showed that specific ADHD-relevant GM volume deficits can be linked to constellations of genes implicated in different physiological pathways. The importance of this should not be overlooked, as most prior studies have been able to link single or very small numbers of specific genotypes to the broad ADHD diagnostic phenotype, not comparatively large genotype, aggregates to specific neurobiological features known to be abnormal in the disorder.
We discuss two of the three phenotype components (S1 and S2; see Figures 3B and 4B) that showed ADHD versus non-ADHD differences (Figure 2) and whose correlation with cognitive performance or parent-reported clinical impairments showed that genetic factors explain a noteworthy portion of specific GM volume phenotypic variability relevant to ADHD. The most prominent brain regions in S1 and S2 phenotype components were cingulate and basal ganglia, respectively. These were the only regions to emerge as consistently abnormal in the most recent ADHD VBM meta-analysis (40). Along with insular cortex (the other most prominent regions within S1), the anterior cingulate forms a functionally integrated neural circuit (41, 42) reliably linked to attention, conflict resolution, performance monitoring, and switching among cognitive states (14, 43, 44) and whose reduced GM volume has been linked to abnormal attention modulation and inhibitory capacity in ADHD (15). Putamen relevance to ADHD is shown by frequent reports of volume abnormality (13, 45), ADHD-like behavior following lesions (46), and correlation between ADHD symptoms and functional abnormalities (47). S1 and S2 also contained parietal and cerebellar regions, which also are implicated in ADHD (13, 14, 40, 43, 45, 48). Taken collectively, Para-ICA identified the specific ADHD GM volume abnormalities in ADHD that would be predicted by proposals for multi-systemic neural impairment in ADHD in fronto-striatal (49, 50) and fronto-cerebellar (11, 49) neural circuits (51).
We show for the first time that these specific brain phenotypes had genetic correlates – the aggregate of genes in the G2 IC. Although the single genes we found should be noted for future ADHD genetic experiments, interpretation of single genes would be premature pending GWAS replication. However, pathway analysis suggests several possible biological/molecular influences on brain volume that could potentially mediate disease risk in ADHD – some familiar, others more novel. We hypothesized that neurodevelopmental biological pathways logically would predict some aspects of ADHD brain structure abnormality. We found the brain phenotype components were related to differences in expression of a neuroactive ligand–receptor interaction pathway, which has been linked to neurodevelopment and is associated with various psychiatric disorders (52, 53), and also to a specific signal transduction pathway, i.e., Rap1 (ras-related protein 1), whose pathway involves cell adhesion and regulation of mitogen-activated protein kinase that are important for neural development (54, 55) in the form of neocortical neuronal migration and lamination (56). Rap1 is a key mediator of calcium regulation of CREB-dependent transcription and dendritic development that are responsible for neural development (57, 58). Rap1 signaling pathways are plausibly implicated in cortical and subcortical neurodevelopment that may be relevant to ADHD. Future studies might test if these pathways are related to brain development delays, where frontal, temporal, and basal ganglia brain regions lag behind non-ADHD peers by an average of 3 years (59).
Another study prediction was that we would identify specific DA- and norepinephrine (NE)-related genotypes that would be associated with the ADHD brain structure abnormalities. The genes in the G1 component implicate a pathway involved with DA-related synaptic structure and function (see Table 2), some of which directly involve DA neurotransmission DRD2 (D2 receptor) (60) and DDC – a general non-specific precursor of DA and 5HT synthesis (61). There are long-standing theories of dysfunctional catecholaminergic function in ADHD mesocortical and mesolimbic DA systems (62, 63). ADHD findings include abnormally increased DA receptor density in those specific fronto-striatal regions that can be adequately assessed using available positron emission tomography ligands (64), and evidence that psychostimulant medications work in large part because of their ability to increase synaptic DA levels by blocking the DA transporter (65). Although the precise mechanisms underlying DA dysfunction in ADHD are incompletely understood, much recent inquiry has involved the ways in which DA and its NE exert neuromodulatory effects on widespread brain regions important in ADHD and other developmental psychiatric disorders (66, 67).
Many of the same genes identified by Para-ICA related to DA synapses also have been linked to KEGG pathways for glutamate, GABA, and cholinergic synapses, as well as retrograde endocannabinoid signaling. Previous research has implicated all these neurotransmitter systems in ADHD (68), and the current results should serve to bolster interest in exploring the role of these other systems in the pathophysiology of ADHD. In particular, the glutamatergic system is implicated by several lines of evidence (69). Not only has previous genome-wide analysis identified possible association with genes involved in synaptic adhesion, glutamate receptors, and intracellular signaling pathways in ADHD but also there are magnetic resonance spectroscopy (MRS)-detected fronto-striatal glutamate metabolite abnormalities in ADHD (70, 71). Several mouse models (72, 73) highlight the interactive impact of glutamatergic genotypes on dopamine-related brain function and ADHD behaviors like hyperactivity (74). Glutamate/GABA interactions have long been the focus of inquiry with respect to regional cellular excitation/inhibition balance, and recent fMRI study also has linked them to task-induced activity, intrinsic activity within the brain’s “default mode,” and functional integration of widely distributed neural networks (75). Such interactions at the synaptic level could be related to ADHD pathophysiology. Less prevalent in ADHD prior research is the endocannabinoid system. CB1 and CB2 receptors are expressed most strongly in the basal ganglia that formed parts of the S2 brain phenotype component (76). This system is involved in medial prefrontal cortical (mPFC) dopamine release through changes in GABA inhibitory synapse (77), and there are numerous instances of interaction between these two neurotransmitter systems (78, 79), including those in rodents ADHD models (80). Finally, the retrograde endocannabinoid signaling pathway has been implicated in impulsivity (20). The GABAergic system contributes to impulsivity-related brain function and behavior (81), e.g., rodent studies suggest that impaired synaptic integration of DA and glutamatergic afferents targeting GABAergic medium-spiny neurons are associated with impulsivity (82). A recent MRS study revealed reduced GABA concentration in ADHD patients (83). A previous rodent study also has implicated GABA in ADHD by showing that the loss of GABAergic interneurons in cortex was associated with motor hyperactivity (84). In addition, the perturbation of synaptic connectivity of GABAergic interneurons was found to produce abnormal behaviors relevant to various neuropsychiatric disorders (85). Support for a role of acetylcholine systems is found in studies that found choline-containing compounds are altered across various brain regions in ADHD patients (68). Moreover, acetylcholine and dopamine interactions within the striatum modulate dopamine-related neuronal activity that signals motivational salience (86). Finally, Tourette syndrome – which is a common comorbid condition with ADHD (87) – has been linked to reduced basal ganglia volume (88) and deficits of cholinergic interneuron in dorsolateral striatum (89).
The implications of the pathways related to circadian entrainment and cAMP signaling are less obviously interpreted. A substantial literature has examined the relationship between sleep disturbance and ADHD, e.g., delayed circadian rhythmicity in ADHD (90, 91), links between impulsivity and circadian entrainment (20), or the role of DA signaling (92). However, specific mechanisms have not been identified that have etiological relevance to ADHD. This pathway might be added to proposed research agenda aimed at understanding the overlap between sleep-related brain physiology and known ADHD deficits [e.g., neurotransmitters involved in both sleep and attention regulation, or phenotypic similarities between the deleterious effects of sleep deprivation and ADHD (93)]. cAMP impairment has been suggested by a rat model of ADHD (94) and findings of cAMP accumulation and reduced cAMP sensitivity during adolescence that might be a mechanism underlying ADHD symptom expression changes throughout adolescence (95). Additionally, a study has reported cAMP-related protein kinase to be responsible for dopamine transporter cell-surface redistribution that is involved in ADHD (96). A cogent neurobiological model of cAMP involvement in ADHD is needed to guide future research.
The multivariate nature of the Para-ICA results is not easily reducible to univariate interpretations about specific gene function, or about single gene contributions directly to ADHD. In other words, individual gene mapped to specific pathways does not prove that each gene has a direct casual role in ADHD risk. Therefore, we focused our discussion on pathways instead of individual genes. In a similar vein, the results should not be viewed as definitive until replication, despite the rigor of prior Para-ICA method validation and the statistical methods we used to assess reliability/consistency. Instead, they are intended to accelerate thinking about both familiar and novel pathways and their etiological role in ADHD. Overall, our pathway results have some similarities with those from previous pathway enrichment analyses in ADHD that were conducted to identify possible biological mechanisms when GWAS-level statistical evidence was not obtained. Both our studies and others have found evidence for both synaptic function and plasticity (23, 24, 97), particularly in the glutamate system, or processes involved in neural development (5, 22, 98, 99). Both we and Alemany et al. (24) found evidence specifically for the KEGG neuroactive ligand–receptor interaction pathway, raising the possibility that this pathway might be related to both cognitive performance based associations found in that study might be related to the brain structure correlates found in this one (i.e., our brain phenotype S2 component was linked to CPT-II performance indices in post hoc analyses). However, our results join other pathways implicated in ADHD – included directed neurite growth (23, 98), rRNA processing, CNS development (99), nucleocytoplasmic transport, mitochrondrial function (100), protein ubiquitination (5), apoptosis, oxidation reduction, and immune response (101). A reason we did not find these others might simply be because our results are specific to the structural GM volume abnormalities found in ADHD – an association that might be closer to etiological factors than behavior or clinical impairment. The unexpected findings of pathways related to transmission and signaling in heart muscle [dilated and hypertrophic cardiomyopathy (HCM) and adrenergic signaling in cardiomyocytes], insulin secretion, estrogen signaling, and endocytosis likely occurred because many of the genes in those systems overlapped with those discussed above, including CACNA1C, CACNB4, ITGB6, ACE, ADCY9, ADRB2, AGAP1, ARRB1, CREB3L2, FKBP5, HSPA1L, TFRC, and VPS37C. Numerous studies have shown these genes are expressed in brain, responsible for neurogenesis (102–105), or associated with neuropsychiatric disorders (106–109).
Limitations
Study limitations include factors like early infant history, nutrition, medication exposure (40, 59), or similar ADHD-relevant experiences that might affect neurodevelopment, synaptic pruning, etc., were not measured or controlled as is often done in genetic inquiry. Such factors will become more important in any replication study, or in studies that examine specific pathophysiological mechanisms suggested by this study. Also our pathway analysis was limited by the extent of current knowledge on gene products and function (110), which will no doubt improve rapidly. Further, using an exome array, we were able to include genome-wide exomic information; however, this was not a genome-tagging array and could not examine non-exomic variation directly at all. Finally, as mentioned consistently above, our study goal was not to identify single gene associations with the ADHD behavioral phenotype, as in GWAS. Instead, our goal was to look within a collection of ADHD-relevant genes to determine if any relationships could be found with specific aspects of GM volume already known to be abnormal in ADHD. While we hope the gene–brain structure relationships we found will prompt future study of both the gene pathways and the individual genes in ADHD, this study is not intended to be a comprehensive inquiry of all possible ADHD-related genes. Rather, the point is to accelerate identification of novel intermediate endophenotypes to be explored in future research. The SNPs identified in current study should be further studied to determine whether any of the specific genes show a conventional genetic association with either the ADHD diagnostic phenotype, specific to the potential brain structure intermediate phenotype we described, or if the gene–brain relationships hold only the implicated biological pathways.
Author Contributions
Mr. SK was involved in data preprocessing, data analysis, and preparation of manuscript. Drs. GP, VC, and JG was involved in design of study and preparation of manuscript. Dr. JL was involved in data analysis and preparation of manuscript. Miss. KB was involved in data collection. Dr. MS was involved in design of study, data analysis, and preparation of manuscript.
Conflict of Interest Statement
The authors declare that the research was conducted in the absence of any commercial or financial relationships that could be construed as a potential conflict of interest.
Funding
This study was funded by NIH grants R01MH080956 and R01MH081969 to MS and in part by NIH grants 2R01EB005846 and P20GM103472 to VC.
Supplementary Material
The Supplementary Material for this article can be found online at http://journal.frontiersin.org/article/10.3389/fpsyt.2016.00128
Footnotes
References
1. Polanczyk G, de Lima MS, Horta BL, Biederman J, Rohde LA. The worldwide prevalence of ADHD: a systematic review and metaregression analysis. Am J Psychiatry (2007) 164(6):942–8. doi:10.1176/ajp.2007.164.6.942
2. Gomez R, Corr PJ. ADHD and personality: a meta-analytic review. Clin Psychol Rev (2014) 34(5):376–88. doi:10.1016/j.cpr.2014.05.002
3. Li Z, Chang SH, Zhang LY, Gao L, Wang J. Molecular genetic studies of ADHD and its candidate genes: a review. Psychiatry Res (2014) 219(1):10–24. doi:10.1016/j.psychres.2014.05.005
4. Shastry BS. Molecular genetics of attention-deficit hyperactivity disorder (ADHD): an update. Neurochem Int (2004) 44(7):469–74. doi:10.1016/j.neuint.2003.08.011
5. Sánchez-Mora C, Ramos-Quiroga JA, Bosch R, Corrales M, Garcia-Martínez I, Nogueira M, et al. Case-control genome-wide association study of persistent attention-deficit hyperactivity disorder identifies FBXO33 as a novel susceptibility gene for the disorder. Neuropsychopharmacology (2015) 40(4):915–26. doi:10.1038/npp.2014.267
6. Dorval KM, Wigg KG, Crosbie J, Tannock R, Kennedy JL, Ickowicz A, et al. Association of the glutamate receptor subunit gene GRIN2B with attention-deficit/hyperactivity disorder. Genes Brain Behav (2007) 6(5):444–52. doi:10.1111/j.1601-183X.2006.00273.x
7. Endele S, Rosenberger G, Geider K, Popp B, Tamer C, Stefanova I, et al. Mutations in GRIN2A and GRIN2B encoding regulatory subunits of NMDA receptors cause variable neurodevelopmental phenotypes. Nat Genet (2010) 42(11):1021–6. doi:10.1038/ng.677
8. Franke B, Faraone SV, Asherson P, Buitelaar J, Bau CH, Ramos-Quiroga JA, et al. The genetics of attention deficit/hyperactivity disorder in adults, a review. Mol Psychiatry (2012) 17(10):960–87. doi:10.1038/mp.2011.138
9. Nigg JT, Craver L. Commentary: ADHD and social disadvantage: an inconvenient truth? – a reflection on Russell et al. (2014) and Larsson et al. (2014). J Child Psychol Psychiatry (2014) 55(5):446–7. doi:10.1111/jcpp.12237
10. Purper-Ouakil D, Ramoz N, Lepagnol-Bestel AM, Gorwood P, Simonneau M. Neurobiology of attention deficit/hyperactivity disorder. Pediatr Res (2011) 69(5 Pt 2):69R–76R. doi:10.1203/PDR.0b013e318212b40f
11. Krain AL, Castellanos FX. Brain development and ADHD. Clin Psychol Rev (2006) 26(4):433–44. doi:10.1016/j.cpr.2006.01.005
12. Valera EM, Faraone SV, Murray KE, Seidman LJ. Meta-analysis of structural imaging findings in attention-deficit/hyperactivity disorder. Biol Psychiatry (2007) 61(12):1361–9. doi:10.1016/j.biopsych.2006.06.011
13. Ellison-Wright I, Ellison-Wright Z, Bullmore E. Structural brain change in attention deficit hyperactivity disorder identified by meta-analysis. BMC Psychiatry (2008) 8:51. doi:10.1186/1471-244X-8-51
14. Makris N, Biederman J, Valera EM, Bush G, Kaiser J, Kennedy DN, et al. Cortical thinning of the attention and executive function networks in adults with attention-deficit/hyperactivity disorder. Cereb Cortex (2007) 17(6):1364–75. doi:10.1093/cercor/bhl047
15. Lopez-Larson MP, King JB, Terry J, McGlade EC, Yurgelun-Todd D. Reduced insular volume in attention deficit hyperactivity disorder. Psychiatry Res (2012) 204(1):32–9. doi:10.1016/j.pscychresns.2012.09.009
16. Liu J, Calhoun VD. A review of multivariate analyses in imaging genetics. Front Neuroinformatics (2014) 8:29. doi:10.3389/fninf.2014.00029
17. Liu J, Pearlson G, Windemuth A, Ruano G, Perrone-Bizzozero NI, Calhoun V. Combining fMRI and SNP data to investigate connections between brain function and genetics using parallel ICA. Hum Brain Mapp (2009) 30(1):241–55. doi:10.1002/hbm.20508
18. Pearlson GD, Liu J, Calhoun VD. An introductory review of parallel independent component analysis (p-ICA) and a guide to applying p-ICA to genetic data and imaging phenotypes to identify disease-associated biological pathways and systems in common complex disorders. Front Genet (2015) 6:276. doi:10.3389/fgene.2015.00276
19. Meda SA, Ruaño G, Windemuth A, O’Neil K, Berwise C, Dunn SM, et al. Multivariate analysis reveals genetic associations of the resting default mode network in psychotic bipolar disorder and schizophrenia. Proc Natl Acad Sci U S A (2014) 111(19):E2066–75. doi:10.1073/pnas.1313093111
20. Khadka S, Narayanan B, Meda SA, Gelernter J, Han S, Sawyer B, et al. Genetic association of impulsivity in young adults: a multivariate study. Transl Psychiatry (2014) 4:e451. doi:10.1038/tp.2014.95
21. Kanehisa M, Goto S, Sato Y, Kawashima M, Furumichi M, Tanabe M. Data, information, knowledge and principle: back to metabolism in KEGG. Nucleic Acids Res (2014) 42(Database issue):D199–205. doi:10.1093/nar/gkt1076
22. Stergiakouli E, Hamshere M, Holmans P, Langley K, Zaharieva I; deCODE Genetics, et al. Investigating the contribution of common genetic variants to the risk and pathogenesis of ADHD. Am J Psychiatry (2012) 169(2):186–94. doi:10.1176/appi.ajp.2011.11040551
23. Bralten J, Franke B, Waldman I, Rommelse N, Hartman C, Asherson P, et al. Candidate genetic pathways for attention-deficit/hyperactivity disorder (ADHD) show association to hyperactive/impulsive symptoms in children with ADHD. J Am Acad Child Adolesc Psychiatry (2013) 52(11):1204–1212e1201. doi:10.1016/j.jaac.2013.08.020
24. Alemany S, Ribasés M, Vilor-Tejedor N, Bustamante M, Sánchez-Mora C, Bosch R, et al. New suggestive genetic loci and biological pathways for attention function in adult attention-deficit/hyperactivity disorder. Am J Med Genet B Neuropsychiatr Genet (2015) 168:459–70. doi:10.1002/ajmg.b.32341
25. Ashburner J, Friston KJ. Voxel-based morphometry – the methods. Neuroimage (2000) 11(6 Pt 1):805–21. doi:10.1006/nimg.2000.0582
26. Kaufman J, Birmaher B, Brent D, Rao U, Flynn C, Moreci P, et al. Schedule for affective disorders and schizophrenia for school-age children-present and lifetime version (K-SADS-PL): initial reliability and validity data. J Am Acad Child Adolesc Psychiatry (1997) 36(7):980–8. doi:10.1097/00004583-199707000-00021
27. Brown TE. Brown Attention-Deficit Hyperactivity Disorder Scales for Adolescent and Adults. San Antonio, TX: Harcourt Assessment (2001).
28. Conners CK. Conner’s Continuous Performance Test II. Psychological Assessment Resources, Inc (2005).
29. Kurth F, Gaser C, Luders E. A 12-step user guide for analyzing voxel-wise gray matter asymmetries in statistical parametric mapping (SPM). Nat Protoc (2015) 10(2):293–304. doi:10.1038/nprot.2015.014
30. Nunes AP, Oliveira IO, Santos BR, Millech C, Silva LP, Gonzalez DA, et al. Quality of DNA extracted from saliva samples collected with the Oragene DNA self-collection kit. BMC Med Res Methodol (2012) 12:65. doi:10.1186/1471-2288-12-65
31. Purcell S, Neale B, Todd-Brown K, Thomas L, Ferreira MA, Bender D, et al. PLINK: a tool set for whole-genome association and population-based linkage analyses. Am J Hum Genet (2007) 81(3):559–75. doi:10.1086/519795
32. Anderson CA, Pettersson FH, Clarke GM, Cardon LR, Morris AP, Zondervan KT. Data quality control in genetic case-control association studies. Nat Protoc (2010) 5(9):1564–73. doi:10.1038/nprot.2010.116
33. Price AL, Patterson NJ, Plenge RM, Weinblatt ME, Shadick NA, Reich D. Principal components analysis corrects for stratification in genome-wide association studies. Nat Genet (2006) 38(8):904–9. doi:10.1038/ng1847
34. Wang K, Li M, Hakonarson H. ANNOVAR: functional annotation of genetic variants from high-throughput sequencing data. Nucleic Acids Res (2010) 38(16):e164. doi:10.1093/nar/gkq603
35. Liu J, Bixler JN, Calhoun VD. A multimodality ICA study – integrating genomic single nucleotide polymorphisms with functional neuroimaging data. IEEE International Conference on Bioinformatics and Biomedicine Workshops. Philadelphia, PA: IEEE (2008). p. 151–7.
36. Calhoun VD, Adali T, Pearlson GD, Pekar JJ. A method for making group inferences from functional MRI data using independent component analysis. Hum Brain Mapp (2001) 14(3):140–51. doi:10.1002/hbm.1048
37. Chen J, Calhoun VD, Liu J. ICA order selection based on consistency: application to genotype data. Conf Proc IEEE Eng Med Biol Soc (2012) 2012:360–3. doi:10.1109/EMBC.2012.6345943
38. Liu JZ, McRae AF, Nyholt DR, Medland SE, Wray NR, Brown KM, et al. A versatile gene-based test for genome-wide association studies. Am J Hum Genet (2010) 87(1):139–45. doi:10.1016/j.ajhg.2010.06.009
39. Reiner-Benaim A. FDR control by the BH procedure for two-sided correlated tests with implications to gene expression data analysis. Biom J (2007) 49(1):107–26. doi:10.1002/bimj.200510313
40. Frodl T, Skokauskas N. Meta-analysis of structural MRI studies in children and adults with attention deficit hyperactivity disorder indicates treatment effects. Acta Psychiatr Scand (2012) 125(2):114–26. doi:10.1111/j.1600-0447.2011.01786.x
41. Dosenbach NU, Fair DA, Cohen AL, Schlaggar BL, Petersen SE. A dual-networks architecture of top-down control. Trends Cogn Sci (2008) 12(3):99–105. doi:10.1016/j.tics.2008.01.001
42. Vaidya CJ, Gordon EM. Phenotypic variability in resting-state functional connectivity: current status. Brain Connect (2013) 3(2):99–120. doi:10.1089/brain.2012.0110
43. Narr KL, Woods RP, Lin J, Kim J, Phillips OR, Del’Homme M, et al. Widespread cortical thinning is a robust anatomical marker for attention-deficit/hyperactivity disorder. J Am Acad Child Adolesc Psychiatry (2009) 48(10):1014–22. doi:10.1097/CHI.0b013e3181b395c0
44. Tang YY, Rothbart MK, Posner MI. Neural correlates of establishing, maintaining, and switching brain states. Trends Cogn Sci (2012) 16(6):330–7. doi:10.1016/j.tics.2012.05.001
45. Seidman LJ, Biederman J, Liang L, Valera EM, Monuteaux MC, Brown A, et al. Gray matter alterations in adults with attention-deficit/hyperactivity disorder identified by voxel based morphometry. Biol Psychiatry (2011) 69(9):857–66. doi:10.1016/j.biopsych.2010.09.053
46. Max JE, Fox PT, Lancaster JL, Kochunov P, Mathews K, Manes FF, et al. Putamen lesions and the development of attention-deficit/hyperactivity symptomatology. J Am Acad Child Adolesc Psychiatry (2002) 41(5):563–71. doi:10.1097/00004583-200205000-00014
47. Leisman G, Melillo R. The basal ganglia: motor and cognitive relationships in a clinical neurobehavioral context. Rev Neurosci (2013) 24(1):9–25. doi:10.1515/revneuro-2012-0067
48. Emond V, Joyal C, Poissant H. Structural and functional neuroanatomy of attention-deficit hyperactivity disorder (ADHD). Encephale (2009) 35(2):107–14. doi:10.1016/j.encep.2008.01.005
49. Durston S, van Belle J, de Zeeuw P. Differentiating frontostriatal and fronto-cerebellar circuits in attention-deficit/hyperactivity disorder. Biol Psychiatry (2011) 69(12):1178–84. doi:10.1016/j.biopsych.2010.07.037
50. Soliva-Vila JC, Vilarroya-Oliver O. [Structural magnetic resonance imaging findings as an aid to explain the neurobiology of attention deficit hyperactivity disorder: towards the identification of a neuroanatomical phenotype]. Rev Neurol (2009) 48(11):592–8.
51. Rubia K, Alegria AA, Brinson H. Brain abnormalities in attention-deficit hyperactivity disorder: a review. Rev Neurol (2014) 58(S01):S3–18.
52. Biernacka JM, Geske J, Jenkins GD, Colby C, Rider DN, Karpyak VM, et al. Genome-wide gene-set analysis for identification of pathways associated with alcohol dependence. Int J Neuropsychopharmacol (2013) 16(2):271–8. doi:10.1017/S1461145712000375
53. Putnam DK, Sun J, Zhao Z. Exploring schizophrenia drug-gene interactions through molecular network and pathway modeling. AMIA Annu Symp Proc (2011) 2011:1127–33.
54. Fercakova A. Cell adhesion molecules in the neural development and plasticity. Bratisl Lek Listy (2001) 102(12):552–5.
55. Samuels IS, Karlo JC, Faruzzi AN, Pickering K, Herrup K, Sweatt JD, et al. Deletion of ERK2 mitogen-activated protein kinase identifies its key roles in cortical neurogenesis and cognitive function. J Neurosci (2008) 28(27):6983–95. doi:10.1523/JNEUROSCI.0679-08.2008
56. Franco SJ, Martinez-Garay I, Gil-Sanz C, Harkins-Perry SR, Muller U. Reelin regulates cadherin function via Dab1/Rap1 to control neuronal migration and lamination in the neocortex. Neuron (2011) 69(3):482–97. doi:10.1016/j.neuron.2011.01.003
57. Bading H. Nuclear calcium signalling in the regulation of brain function. Nat Rev Neurosci (2013) 14(9):593–608. doi:10.1038/nrn3531
58. Chen Y, Wang PY, Ghosh A. Regulation of cortical dendrite development by Rap1 signaling. Mol Cell Neurosci (2005) 28(2):215–28. doi:10.1016/j.mcn.2004.08.012
59. Shaw P, Eckstrand K, Sharp W, Blumenthal J, Lerch JP, Greenstein D, et al. Attention-deficit/hyperactivity disorder is characterized by a delay in cortical maturation. Proc Natl Acad Sci U S A (2007) 104(49):19649–54. doi:10.1073/pnas.0707741104
60. Tan HY, Chen AG, Kolachana B, Apud JA, Mattay VS, Callicott JH, et al. Effective connectivity of AKT1-mediated dopaminergic working memory networks and pharmacogenetics of anti-dopaminergic treatment. Brain (2012) 135(Pt 5):1436–45. doi:10.1093/brain/aws068
61. Hodgetts RB, O’Keefe SL. Dopa decarboxylase: a model gene-enzyme system for studying development, behavior, and systematics. Annu Rev Entomol (2006) 51:259–84. doi:10.1146/annurev.ento.51.110104.151143
62. Corominas-Roso M, Roncero C, Bruguera E, Casas M. [The dopaminergic system and addictions]. Rev Neurol (2007) 44(1):23–31.
63. Maharajan P, Maharajan V, Ravagnan G, Paino G. The weaver mutant mouse: a model to study the ontogeny of dopamine transmission systems and their role in drug addiction. Prog Neurobiol (2001) 64(3):269–76. doi:10.1016/S0301-0082(00)00061-7
64. Del Campo N, Chamberlain SR, Sahakian BJ, Robbins TW. The roles of dopamine and noradrenaline in the pathophysiology and treatment of attention-deficit/hyperactivity disorder. Biol Psychiatry (2011) 69(12):e145–57. doi:10.1016/j.biopsych.2011.02.036
65. Schmitt KC, Reith ME. Regulation of the dopamine transporter: aspects relevant to psychostimulant drugs of abuse. Ann N Y Acad Sci (2010) 1187:316–40. doi:10.1111/j.1749-6632.2009.05148.x
66. Arnsten AF. Catecholamine influences on dorsolateral prefrontal cortical networks. Biol Psychiatry (2011) 69(12):e89–99. doi:10.1016/j.biopsych.2011.01.027
67. Arnsten AF, Rubia K. Neurobiological circuits regulating attention, cognitive control, motivation, and emotion: disruptions in neurodevelopmental psychiatric disorders. J Am Acad Child Adolesc Psychiatry (2012) 51(4):356–67. doi:10.1016/j.jaac.2012.01.008
68. Cortese S. The neurobiology and genetics of attention-deficit/hyperactivity disorder (ADHD): what every clinician should know. Eur J Paediatr Neurol (2012) 16(5):422–33. doi:10.1016/j.ejpn.2012.01.009
69. Chang JP, Lane HY, Tsai GE. Attention deficit hyperactivity disorder and N-methyl-D-aspartate (NMDA) dysregulation. Curr Pharm Des (2014) 20(32):5180–5. doi:10.2174/1381612819666140110115227
70. Maltezos S, Horder J, Coghlan S, Skirrow C, O’Gorman R, Lavender TJ, et al. Glutamate/glutamine and neuronal integrity in adults with ADHD: a proton MRS study. Transl Psychiatry (2014) 4:e373. doi:10.1038/tp.2014.11
71. Perlov E, Philipsen A, Hesslinger B, Buechert M, Ahrendts J, Feige B, et al. Reduced cingulate glutamate/glutamine-to-creatine ratios in adult patients with attention deficit/hyperactivity disorder – a magnet resonance spectroscopy study. J Psychiatr Res (2007) 41(11):934–41. doi:10.1016/j.jpsychires.2006.12.007
72. Miller EM, Pomerleau F, Huettl P, Gerhardt GA, Glaser PE. Aberrant glutamate signaling in the prefrontal cortex and striatum of the spontaneously hypertensive rat model of attention-deficit/hyperactivity disorder. Psychopharmacology (2014) 231(15):3019–29. doi:10.1007/s00213-014-3479-4
73. Ruocco LA, Treno C, Gironi Carnevale UA, Arra C, Mattern C, Huston JP, et al. Prepuberal intranasal dopamine treatment in an animal model of ADHD ameliorates deficient spatial attention, working memory, amino acid transmitters and synaptic markers in prefrontal cortex, ventral and dorsal striatum. Amino Acids (2014) 46(9):2105–22. doi:10.1007/s00726-014-1753-8
74. Lesch KP, Merker S, Reif A, Novak M. Dances with black widow spiders: dysregulation of glutamate signalling enters centre stage in ADHD. Eur Neuropsychopharmacol (2013) 23(6):479–91. doi:10.1016/j.euroneuro.2012.07.013
75. Duncan NW, Wiebking C, Northoff G. Associations of regional GABA and glutamate with intrinsic and extrinsic neural activity in humans-a review of multimodal imaging studies. Neurosci Biobehav Rev (2014) 47C:36–52. doi:10.1016/j.neubiorev.2014.07.016
76. Sierra S, Luquin N, Rico AJ, Gómez-Bautista V, Roda E, Dopeso-Reyes IG, et al. Detection of cannabinoid receptors CB1 and CB2 within basal ganglia output neurons in macaques: changes following experimental parkinsonism. Brain Struct Funct (2015) 220(5):2721–38. doi:10.1007/s00429-014-0823-8
77. McLaughlin RJ, Hill MN, Gorzalka BB. A critical role for prefrontocortical endocannabinoid signaling in the regulation of stress and emotional behavior. Neurosci Biobehav Rev (2014) 42:116–31. doi:10.1016/j.neubiorev.2014.02.006
78. Castelli M, Federici M, Rossi S, De Chiara V, Napolitano F, Studer V, et al. Loss of striatal cannabinoid CB1 receptor function in attention-deficit/hyperactivity disorder mice with point-mutation of the dopamine transporter. Eur J Neurosci (2011) 34(9):1369–77. doi:10.1111/j.1460-9568.2011.07876.x
79. Kleijn J, Wiskerke J, Cremers TI, Schoffelmeer AN, Westerink BH, Pattij T. Effects of amphetamine on dopamine release in the rat nucleus accumbens shell region depend on cannabinoid CB1 receptor activation. Neurochem Int (2012) 60(8):791–8. doi:10.1016/j.neuint.2012.03.002
80. Bracci E. The endocannabinoid system misfires in ADHD mice (commentary on Castelli et al.). Eur J Neurosci (2011) 34(9):1368. doi:10.1111/j.1460-9568.2011.07917.x
81. Hayes DJ, Jupp B, Sawiak SJ, Merlo E, Caprioli D, Dalley JW. Brain gamma-aminobutyric acid: a neglected role in impulsivity. Eur J Neurosci (2014) 39(11):1921–32. doi:10.1111/ejn.12485
82. Caprioli D, Sawiak SJ, Merlo E, Theobald DE, Spoelder M, Jupp B, et al. Gamma aminobutyric acidergic and neuronal structural markers in the nucleus accumbens core underlie trait-like impulsive behavior. Biol Psychiatry (2014) 75(2):115–23. doi:10.1016/j.biopsych.2013.07.013
83. Edden RA, Crocetti D, Zhu H, Gilbert DL, Mostofsky SH. Reduced GABA concentration in attention-deficit/hyperactivity disorder. Arch Gen Psychiatry (2012) 69(7):750–3. doi:10.1001/archgenpsychiatry.2011.2280
84. Müller Smith K, Fagel DM, Stevens HE, Rabenstein RL, Maragnoli ME, Ohkubo Y, et al. Deficiency in inhibitory cortical interneurons associates with hyperactivity in fibroblast growth factor receptor 1 mutant mice. Biol Psychiatry (2008) 63(10):953–62. doi:10.1016/j.biopsych.2007.09.020
85. Pillai-Nair N, Panicker AK, Rodriguiz RM, Gilmore KL, Demyanenko GP, Huang JZ, et al. Neural cell adhesion molecule-secreting transgenic mice display abnormalities in GABAergic interneurons and alterations in behavior. J Neurosci (2005) 25(18):4659–71. doi:10.1523/JNEUROSCI.0565-05.2005
86. Threlfell S, Cragg SJ. Dopamine signaling in dorsal versus ventral striatum: the dynamic role of cholinergic interneurons. Front Syst Neurosci (2011) 5:11. doi:10.3389/fnsys.2011.00011
87. El Malhany N, Gulisano M, Rizzo R, Curatolo P. Tourette syndrome and comorbid ADHD: causes and consequences. Eur J Pediatr (2015) 174(3):279–88. doi:10.1007/s00431-014-2417-0
88. Peterson BS, Thomas P, Kane MJ, Scahill L, Zhang H, Bronen R, et al. Basal Ganglia volumes in patients with Gilles de la Tourette syndrome. Arch Gen Psychiatry (2003) 60(4):415–24. doi:10.1001/archpsyc.60.4.415
89. Xu M, Kobets A, Du JC, Lennington J, Li L, Banasr M, et al. Targeted ablation of cholinergic interneurons in the dorsolateral striatum produces behavioral manifestations of Tourette syndrome. Proc Natl Acad Sci U S A (2015) 112(3):893–8. doi:10.1073/pnas.1419533112
90. Van Veen MM, Kooij JJ, Boonstra AM, Gordijn MC, Van Someren EJ. Delayed circadian rhythm in adults with attention-deficit/hyperactivity disorder and chronic sleep-onset insomnia. Biol Psychiatry (2010) 67(11):1091–6. doi:10.1016/j.biopsych.2009.12.032
91. Kooij JJ, Bijlenga D. The circadian rhythm in adult attention-deficit/hyperactivity disorder: current state of affairs. Expert Rev Neurother (2013) 13(10):1107–16. doi:10.1586/14737175.2013.836301
92. Mohawk JA, Pezuk P, Menaker M. Methamphetamine and dopamine receptor D1 regulate entrainment of murine circadian oscillators. PLoS One (2013) 8(4):e62463. doi:10.1371/journal.pone.0062463
93. Owens J, Gruber R, Brown T, Corkum P, Cortese S, O’Brien L, et al. Future research directions in sleep and ADHD: report of a consensus working group. J Atten Disord (2013) 17(7):550–64. doi:10.1177/1087054712457992
94. Russell VA. Dopamine hypofunction possibly results from a defect in glutamate-stimulated release of dopamine in the nucleus accumbens shell of a rat model for attention deficit hyperactivity disorder – the spontaneously hypertensive rat. Neurosci Biobehav Rev (2003) 27(7):671–82. doi:10.1016/j.neubiorev.2003.08.010
95. Anderson SL. Changes in the second messenger cyclic AMP during development may underlie motoric symptoms in attention deficit/hyperactivity disorder (ADHD). Behav Brain Res (2002) 130(1–2):197–201. doi:10.1016/S0166-4328(01)00417-X
96. Kitagishi Y, Minami A, Nakanishi A, Ogura Y, Matsuda S. Neuron membrane trafficking and protein kinases involved in autism and ADHD. Int J Mol Sci (2015) 16(2):3095–115. doi:10.3390/ijms16023095
97. Yang L, Neale BM, Liu L, Lee SH, Wray NR, Ji N, et al. Polygenic transmission and complex neuro developmental network for attention deficit hyperactivity disorder: genome-wide association study of both common and rare variants. Am J Med Genet B Neuropsychiatr Genet (2013) 162B(5):419–30. doi:10.1002/ajmg.b.32169
98. Poelmans G, Pauls DL, Buitelaar JK, Franke B. Integrated genome-wide association study findings: identification of a neurodevelopmental network for attention deficit hyperactivity disorder. Am J Psychiatry (2011) 168(4):365–77. doi:10.1176/appi.ajp.2010.10070948
99. Zayats T, Athanasiu L, Sonderby I, Djurovic S, Westlye LT, Tamnes CK, et al. Genome-wide analysis of attention deficit hyperactivity disorder in Norway. PLoS One (2015) 10(4):e0122501. doi:10.1371/journal.pone.0122501
100. Lee YH, Song GG. Genome-wide pathway analysis in attention-deficit/hyperactivity disorder. Neurol Sci (2014) 35(8):1189–96. doi:10.1007/s10072-014-1671-2
101. Valbonesi S, Magri C, Traversa M, Faraone SV, Cattaneo A, Milanesi E, et al. Copy number variants in attention-deficit hyperactive disorder: identification of the 15q13 deletion and its functional role. Psychiatr Genet (2015) 25(2):59–70. doi:10.1097/YPG.0000000000000056
102. Bendor J, Lizardi-Ortiz JE, Westphalen RI, Brandstetter M, Hemmings HC Jr, Sulzer D, et al. AGAP1/AP-3-dependent endocytic recycling of M5 muscarinic receptors promotes dopamine release. EMBO J (2010) 29(16):2813–26. doi:10.1038/emboj.2010.154
103. Masuda T, Nakagawa S, Boku S, Nishikawa H, Takamura N, Kato A, et al. Noradrenaline increases neural precursor cells derived from adult rat dentate gyrus through beta2 receptor. Prog Neuropsychopharmacol Biol Psychiatry (2012) 36(1):44–51. doi:10.1016/j.pnpbp.2011.08.019
104. Porcheri C, Suter U, Jessberger S. Dissecting integrin-dependent regulation of neural stem cell proliferation in the adult brain. J Neurosci (2014) 34(15):5222–32. doi:10.1523/JNEUROSCI.4928-13.2014
105. Rakshit H, Rathi N, Roy D. Construction and analysis of the protein-protein interaction networks based on gene expression profiles of Parkinson’s disease. PLoS One (2014) 9(8):e103047. doi:10.1371/journal.pone.0103047
106. Chang HS, Won ES, Lee HY, Ham BJ, Kim YG, Lee MS. Association of ARRB1 polymorphisms with the risk of major depressive disorder and with treatment response to mirtazapine. J Psychopharmacol (2015) 29(5):615–22. doi:10.1177/0269881114554273
107. Gatt JM, Burton KL, Williams LM, Schofield PR. Specific and common genes implicated across major mental disorders: a review of meta-analysis studies. J Psychiatr Res (2015) 60C:1–13. doi:10.1016/j.jpsychires.2014.09.014
108. Lotan A, Fenckova M, Bralten J, Alttoa A, Dixson L, Williams RW, et al. Neuroinformatic analyses of common and distinct genetic components associated with major neuropsychiatric disorders. Front Neurosci (2014) 8:331. doi:10.3389/fnins.2014.00331
109. Yoshimizu T, Pan JQ, Mungenast AE, Madison JM, Su S, Ketterman J, et al. Functional implications of a psychiatric risk variant within CACNA1C in induced human neurons. Mol Psychiatry (2015) 20(2):162–9.
Keywords: genetics, ADHD, sMRI, parallel ICA, neurodevelopmental disorder
Citation: Khadka S, Pearlson GD, Calhoun VD, Liu J, Gelernter J, Bessette KL and Stevens MC (2016) Multivariate Imaging Genetics Study of MRI Gray Matter Volume and SNPs Reveals Biological Pathways Correlated with Brain Structural Differences in Attention Deficit Hyperactivity Disorder. Front. Psychiatry 7:128. doi: 10.3389/fpsyt.2016.00128
Received: 25 January 2016; Accepted: 06 July 2016;
Published: 25 July 2016
Edited by:
Ashok Mysore, St. John’s Medical College Hospital, IndiaReviewed by:
Karen M. Smith, University of Louisiana at Lafayette, USANishant Goyal, Central Institute of Psychiatry, India
Copyright: © 2016 Khadka, Pearlson, Calhoun, Liu, Gelernter, Bessette and Stevens. This is an open-access article distributed under the terms of the Creative Commons Attribution License (CC BY). The use, distribution or reproduction in other forums is permitted, provided the original author(s) or licensor are credited and that the original publication in this journal is cited, in accordance with accepted academic practice. No use, distribution or reproduction is permitted which does not comply with these terms.
*Correspondence: Michael C. Stevens, michael.stevens@hhchealth.org