 Cota Navin Gupta1,2*
 Eduardo Castro1,3
 Srinivas Rachkonda1
 Theo G. M. van Erp4
 Steven Potkin4
 Judith M. Ford5
 Daniel Mathalon5
 Hyo Jong Lee6
 Bryon A. Mueller7
 Douglas N. Greve8
 Ole A. Andreassen9,10
 Ingrid Agartz9,11,12
 Andrew R. Mayer1
 Julia Stephen1
 Rex E. Jung13
 Juan Bustillo14
 Vince D. Calhoun1,15†
 Jessica A. Turner1,16†
- 1The Mind Research Network, Albuquerque, NM, United States
- 2Department of Biosciences and Bioengineering, Indian Institute of Technology, Guwahati, India
- 3Computational Biology Center, IBM Thomas J. Watson Research, Yorktown Heights, NY, United States
- 4Department of Psychiatry and Human Behavior, School of Medicine, University of California, Irvine, Irvine, CA, United States
- 5Department of Psychiatry, School of Medicine, University of California, San Francisco, San Francisco, CA, United States
- 6Divisions of Electronics and Information Engineering, Chonbuk National University, Jeonju, South Korea
- 7Department of Psychiatry, University of Minnesota, Minneapolis, MN, United States
- 8MGH/MIT/HMS Athinoula A. Martinos Center for Biomedical Imaging, Charlestown, MA, United States
- 9NORMENT, KG Jebsen Center for Psychosis Research, Institute of Clinical Medicine, University of Oslo, Oslo, Norway
- 10Division of Mental Health and Addiction, Oslo University Hospital, Oslo, Norway
- 11Department of Clinical Neuroscience, Karolinska Institute, Stockholm, Sweden
- 12Department of Research, Diakonhjemmet Hospital, Oslo, Norway
- 13Department of Neurosurgery, University of New Mexico Health Sciences Center, Albuquerque, NM, United States
- 14Department of Psychiatry, University of New Mexico, Albuquerque, NM, United States
- 15Department of Electrical and Computer Engineering, University of New Mexico, Albuquerque, NM, United States
- 16Department of Psychology, Neuroscience Institute, Georgia State University, Atlanta, GA, United States
Clinical and cognitive symptoms domain-based subtyping in schizophrenia (Sz) has been critiqued due to the lack of neurobiological correlates and heterogeneity in symptom scores. We, therefore, present a novel data-driven framework using biclustered independent component analysis to detect subtypes from the reliable and stable gray matter concentration (GMC) of patients with Sz. The developed methodology consists of the following steps: source-based morphometry (SBM) decomposition, selection and sorting of two component loadings, subtype component reconstruction using group information-guided ICA (GIG-ICA). This framework was applied to the top two group discriminative components namely the insula/superior temporal gyrus/inferior frontal gyrus (I-STG-IFG component) and the superior frontal gyrus/middle frontal gyrus/medial frontal gyrus (SFG-MiFG-MFG component) from our previous SBM study, which showed diagnostic group difference and had the highest effect sizes. The aggregated multisite dataset consisted of 382 patients with Sz regressed of age, gender, and site voxelwise. We observed two subtypes (i.e., two different subsets of subjects) each heavily weighted on these two components, respectively. These subsets of subjects were characterized by significant differences in positive and negative syndrome scale (PANSS) positive clinical symptoms (p = 0.005). We also observed an overlapping subtype weighing heavily on both of these components. The PANSS general clinical symptom of this subtype was trend level correlated with the loading coefficients of the SFG-MiFG-MFG component (r = 0.25; p = 0.07). The reconstructed subtype-specific component using GIG-ICA showed variations in voxel regions, when compared to the group component. We observed deviations from mean GMC along with conjunction of features from two components characterizing each deciphered subtype. These inherent variations in GMC among patients with Sz could possibly indicate the need for personalized treatment and targeted drug development.
Introduction
Subtype staging using clinical features (1, 2), cognitive factors (3–5), and brain morphometry measures (6) have been attempted to characterize the heterogeneity in patients with schizophrenia (Sz) with mixed views in the research community. Univariate voxel-based morphometry (VBM) (7–10) and multivariate source-based morphometry (SBM) (11–13) are two widely used techniques to analyze structural magnetic resonance images (sMRI) differences between healthy controls (Ct) and Sz. Studies in Sz using both these techniques have reported largest (in terms of effect size) gray matter concentration (GMC) deficits for regions of left insular cortex, left inferior frontal gyrus, superior temporal gyrus, and precentral gyrus. VBM does not utilize any information about the relationships among voxels, while the SBM framework which uses an independent component analysis (ICA) module (14) provides a way to pool information across different voxels, thereby identifying common components of variation (13).
Voxel-based morphometry studies (15, 16) have used factor analysis on clinical features to divide their Sz samples into three subtypes with predominantly negative, disorganization, and paranoid symptom profiles. These studies then go on to illustrate, the considerable heterogeneity of spatial distribution and extent of structural deficits across the three Sz subtypes. This three-factor subtyping based on clinical features was also reported in chronic and old-age populations (17). From a different viewpoint, factor analysis of psychopathology ratings were found to be related to different patterns of cerebral blood flow (18). However, usage of clinical symptoms in these studies has been criticized for temporal instability and lack of neurobiological correlates (4, 19, 20). Cognitive measures in contrast may be more stable (4, 21–24) but are not the determining characteristics of the disorder. Most of the above studies first perform factor analysis on clinical or cognitive symptoms to decipher subtypes and then do VBM analysis on sMRI data having obtained the subtype grouping. Our work takes a different approach and obtains subtype grouping from the stable and reliable sMRI data and then moves to clinical symptom domain to confirm these observed subtype differences.
Few neuroimaging studies in Sz have ignored these variations in clinical and cognitive symptoms among Sz cohort, looking only at the differences in average effects between Ct and Sz (9–13, 25). Numerous review studies have pointed to varying regions of aberrations or inconsistencies in terms of gray matter, whole brain volume, and white matter differences (12, 26–28). Recent studies seem to suggest that this underlying clinical heterogeneity in Sz could be deciphered from the more reliable and stable genetic (29) and neuroimaging data (30) rather than clinical and cognitive features. These studies suggested that regional hidden local components, linked to specific clinical symptoms could exist in a subject by voxel matrix (i.e., voxel representing either GMC, fractional anisotropy (FA), or gray matter volume) or in a subject by single nucleotide polymorphism matrix depending on the spectrum of Sz participants recruited in a given study. The idea of finding complex biomarkers (lower or higher GMC in multiple regions) for subtypes of subjects in neuroimaging and the inability of univariate methods to find the underlying differences was clearly illustrated in a review article (31). It, therefore, becomes imperative to develop data-driven frameworks that can reliably decipher these complex hidden local components corresponding to various subtypes. Non-negative matrix-based biclustering methods (32, 33) have been applied to obtain multiple local components in a dataset having healthy controls (Ct) and Sz, leading to the speculation that Sz may represent a set of eight distinct clinical disorders. The same methods were applied for the first time to imaging FA data to decipher subtypes in Sz (30).
Source-based morphometry is now an established multivariate technique which combines information across different voxels for imaging modalities to give spatial components (i.e., spatially connected regions) that differ between two groups rather than region of voxels (13). It is known sMRI varies to a lesser degree over time than clinical/cognitive symptoms. Hence, through this work, we propose a new methodology for subtyping patients with Sz from the reliable/stable GMC rather than doing a factor analysis on symptom scores as in most previous studies. To the best of our knowledge, this is the very first work which does not use healthy controls sMRI data during clinical subtyping. Recently, reliable replication of GMC components showing (Ct/Sz) diagnostic differences were assessed in the largest aggregated structural imaging dataset to date for Sz (11). We reported nine reliable components that showed diagnostic differences; seven had greater GMC and two had lower GMC in Sz than Ct (11). These components did not show relationship with clinical symptoms, when considered individually. We, therefore, decided to evaluate the relationship between symptoms and SBM loadings in subsets of subjects. These subsets were obtained by considering loadings from two components comprising regions of insula/superior temporal gyrus/inferior frontal gyrus (I-STG-IFG component) and superior/medial/middle frontal gyrus (SFG-MiFG-MFG component) which had high effect size and showed diagnostic differences from our previous work (11). Our method is outlined in Figure 1: following ICA/SBM, we hypothesized there exist subsets of Sz participants linked to specific symptoms with different neuroanatomical alterations on these components. Joint distribution of loadings from two components was exploited to obtain subsets which were then tested for association with clinical symptoms (steps 2 and 3 of Figure 1). This method can also be applied to other neuroimaging modalities and this accurate subtyping could provide reliable endophenotype (34, 35) for personalized drug development in Sz (36).
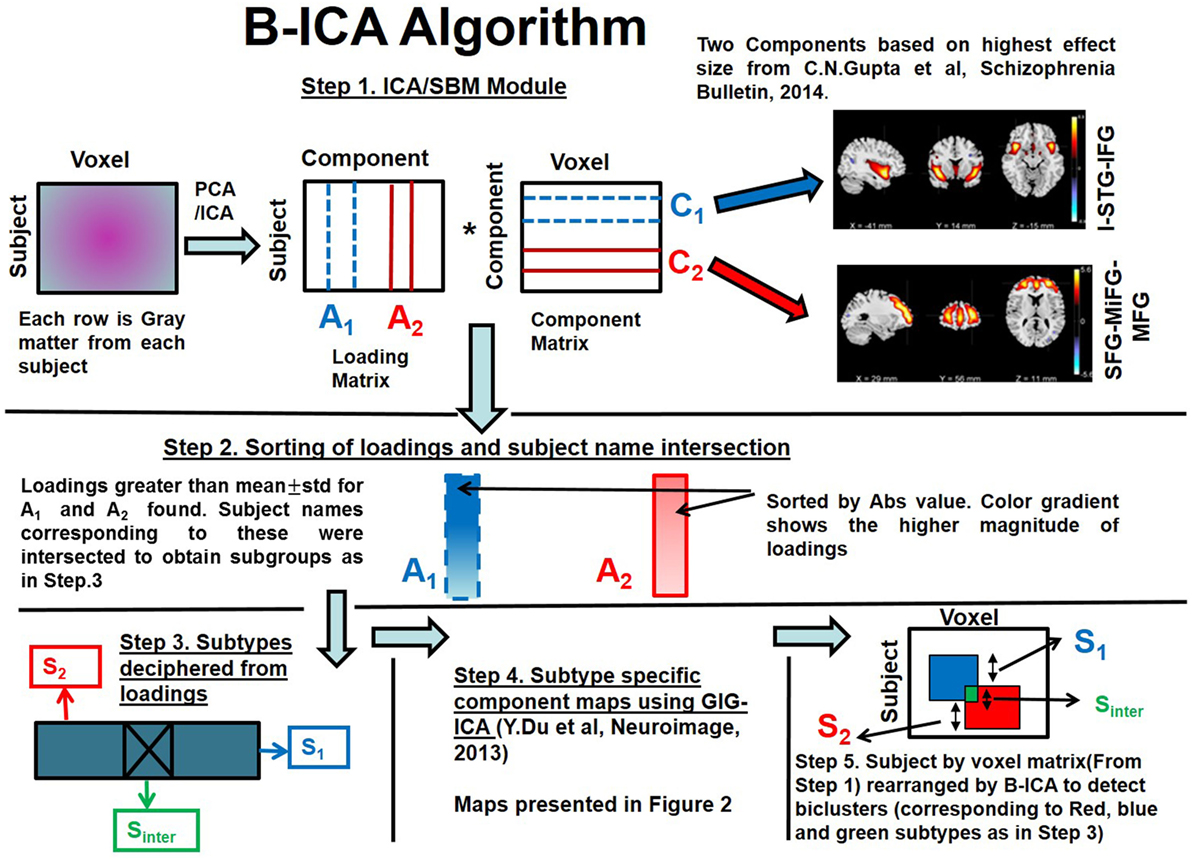
Figure 1. Biclustered Independent Component Analysis (B-ICA) framework illustrating the various steps to decipher subtypes.
Methods
Participant Demographics and Clinical Measures
This work involved aggregating multisite datasets. Each dataset including diagnosis, age at time of scan, gender, symptom scores, duration of illness, and chlorpromazine equivalents (Cpz eqvt) medications when available, were shared by each participating group according to the sites protocol. Study-wise demographic info is presented in Table 1 and clinical information in Table 2. The majority of Sz were on antipsychotic medications, either typical, atypical, or a combination. All Sz were clinically stable at the time of scanning. The positive and negative syndrome scale (PANSS) is a clinical symptom scale used for measuring symptom severity of patients with Sz (37). It provides balanced representation of positive and negative symptoms and gauges their relationship to one another and to global psychopathology (37). A total of 382 Sz (mean age = 36.4, SD = 11.65, range: 18–64, 274 males/108 females) having PANSS information from three independent studies (one being multisite) formed the aggregated dataset, which totaled to nine scanning sites. As these are legacy data, the studies were collected separately in space and time, therefore inter-rater reliability across studies is also not available. However, the inter-rater reliability within multisite study was maintained [i.e., for FBIRN3 data: collection, training, and annual certification of the raters on standard patient interviews was done (38)]. More details regarding the datasets and their publications are available in the supplemental material (appendix 1) of our previous publication (11).

Table 1. Demographic information by study.
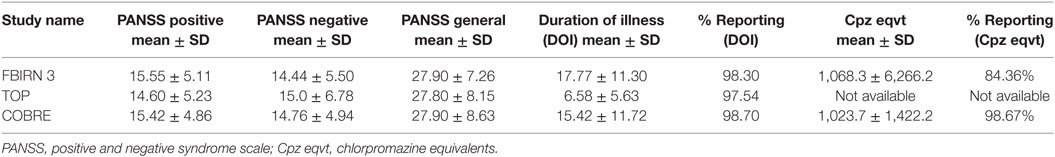
Table 2. Clinical information by study.
All studies were collected under local IRB oversight and participants provided informed consent. The structured clinical interview for diagnosis for DSM-IV or DSM-IV-TR was used to confirm a diagnosis of Sz or schizoaffective disorder (SzAff) in few datasets. We do not consider inclusion of SzAff to be a significant source of variation since recent work has identified that structural differences between Sz and Szaff are similar (39). We regressed out site on PANSS general scores as it showed an effect, with other scores not exhibiting a site effect.
Image Preprocessing
The scanning sites included 1.5 and 3 T scanners from various makes/models, collecting T1-weighted images using sagittal orientation and MPRAGE sequences as in Table 3. Using the methods presented in Ref. (11–13) images were normalized using a 12-parameter affine model to the 152 average T1 Montreal Neurological Institute template, resliced to 2 mm × 2 mm × 2 mm, and segmented into gray, white, and CSF images using the unified segmentation algorithm (7) of SPM5 (http://www.fil.ion.ucl.ac.uk/spm/software/spm5/). We used the same standard preprocessing pipeline from our previous studies (11–13). Outlier GMC images were identified based on correlations to both a study-specific template and an averaged GMC map. They were then visually checked, corrected, and re-segmented where possible, and removed in cases where correction was not possible. The sample sizes presented in Table 1 are those images which passed the quality assurance methods. Age, gender, and site were regressed out on the images voxelwise as these variables were not of interest (11). A full width half maximum Gaussian kernel of 10 mm was used to smooth the images prior to the VBM and SBM analyses as suggested in Ref. (10, 40).
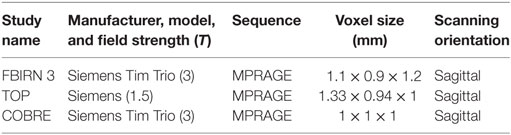
Table 3. Scanner information by study.
Biclustered Independent Component Analysis (B-ICA) Framework for Subtype Detection
We present the B-ICA framework pictorially and explain the method with reference to Figure 1. This framework is tuned for sMRI, but it can be applied to other neuroimaging modalities as well. It consists of:
(1) SBM decomposition on GMC matrix from patients with Sz only as in Eq. 1 (13)
where X stands for observed source matrix. C1, C2, …, CN are the underlying original sources or natural groupings and A1, A2, … AN are the corresponding loadings. We selected two components (C1 and C2) corresponding to I-STG-IFG and SFG-MiFG-MFG components (step 1 of Figure 1) from our previous work (11), which had the highest effect sizes.
(2) Loadings for the two selected components (A1 and A2) were sorted by absolute value as indicated by the gradient color change in (step 2 of Figure 1). Loadings greater than a statistical threshold (mean ± SD) for both components were found. Subject names passing this threshold from both components were then intersected to obtain subtype Sinter.
(3) Subtypes were found as below (step 3 of Figure 1).
Sinter—subjects who are highly weighted on both C1 and C2;
S1—subjects who are exclusively highly weighted on C1;
S2—subjects who are exclusively highly weighted on C2;
(4) Subtype-specific components (step 4 of Figure 1) were then reconstructed with the subtype loadings using group information-guided ICA (GIG-ICA) algorithm, as it preserves independence of the components at subtype level (41).
(5) Subtypes along the subject dimension in the subject by voxel sMRI matrix after application of B-ICA is illustrated (step 5 of Figure 1).
This algorithm first finds subtypes using two component loadings (along the subject dimension). Then using the deciphered subtype loadings, a GIG-ICA step is performed to find subtype-specific components (along the voxel dimension). Since we achieve clustering in both subject and voxel dimensions, this is considered as biclustering. The algorithm effectively rearranges voxels inside a huge subject by voxel matrix (step 1 of Figure 1) to decipher overlapping biclusters (illustrated as red and blue squares in step 5 of Figure 1).
Non-Parametric Testing of Clinical Symptoms between Deciphered Subtypes
The PANSS was considered and the positive (PP), negative (PN), and general (PG) clinical scores were summed. Being multisite data, we regressed out site effects on the summed scores, where present. For the identified subtypes S1. S2, we performed a Mann–Whitney test (U) (42) between their corresponding PP, PN, and PG scores as the distributions were not normal and due to their small sample sizes. Correlations between the ICA loadings of each subtype and the PP, PN, and PG scores were also calculated.
Structural Network Connectivity (SNC)
To further elucidate the subtyping we also performed SNC analysis (43) for the identified groups. SNC is measured via the correlations obtained between the loadings of the two components in the inferred subtypes.
Results
Independent of clinical subtyping, we first tested the association of loadings from both components with PANSS positive, negative, and general scores observing no significant association as presented in Table 4.
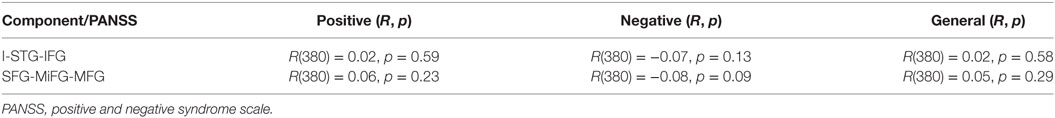
Table 4. Correlations between component loadings across all participants.
After applying the B-ICA algorithm as in Figure 1 on the GMC matrix of 382 Sz, we obtained two exclusive subtypes S1 (65 subjects highly weighted on only I-STG-IFG component), S2 (62 subjects highly weighted on only the SFG-MiFG-MFG component), and one intersecting group Sinter (53 subjects highly weighted on both components). The group and subtype-specific reconstructed components obtained using GIG-ICA are shown in Figure 2. We observed variations in reconstructed components for different subtypes, when compared to the group component (considering all 382 Sz subjects). The reconstructed subtype-specific components showed subtle variations in several regions, when compared with the group components as in Figure 3. For the I-STG-IFG component (column 1 of Figure 2) the subtypes (S2 and Sinter) components showed additional regions of precentral gyrus, anterior cingulate and medial frontal gyrus, while for the SFG-MiFG-MFG component (column 2 of Figure 2), s(inter) showed regions of cingulate gyrus, middle temporal gyrus and inferior frontal gyrus.
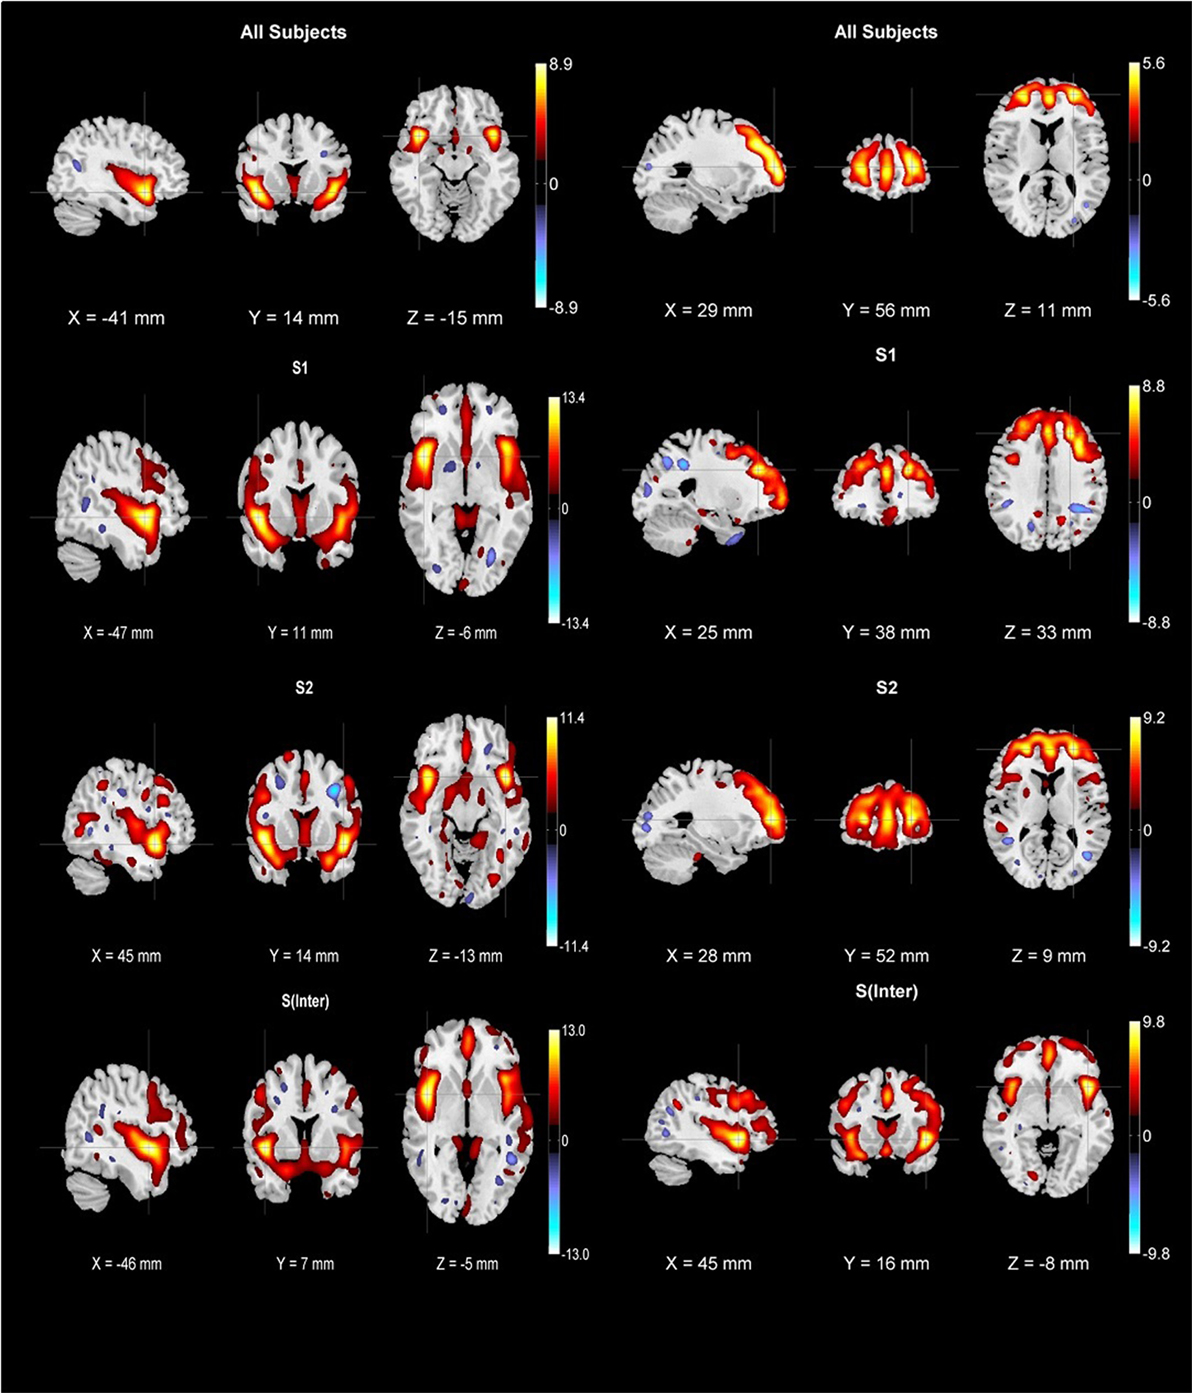
Figure 2. First row: group components for 382 schizophrenia subjects (column one is insula/superior temporal gyrus/inferior frontal gyrus component while column two is superior frontal gyrus/middle frontal gyrus/medial frontal gyrus component). Subtype-specific components were reconstructed using biclustered independent component analysis and group information-guided ICA. Second row: S1 subtype components (65 subjects), third row: S2 subtype components (62 subjects), fourth row: Sinter subtype components (53 subjects). All components were thresholded at |z| > 2.5 and cross hairs indicate the maximum voxel.
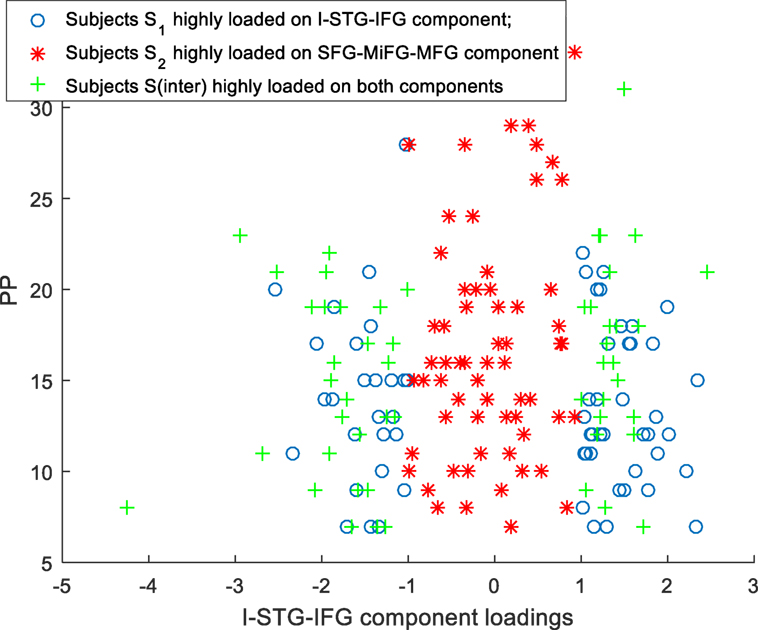
Figure 3. Scatter plots for subtypes S1, S2, Sinter I-STG-IFG component loadings Vs PP.
Association of Subtypes S1, S2, and Sinter with PP, PN, and PG
Scatter plots of subtype loadings S1, S2, Sinter in components A1, A2 Vs PP is depicted in Figures 3 and 4, respectively. PP scores in subtypes S1 (mean = 13.68) and S2 (mean = 16.74) showed a significant difference with a Wilcoxon rank sum test = 3,954 (n1 = 65, n2 = 62, p = 0.006). We observed few subjects in subtype S2 capturing the high PP (circled in Figure 4). No significant differences in PN and PG scores were observed between these subtypes S1 and S2. Subtype demography/clinical information is included in Table 5.
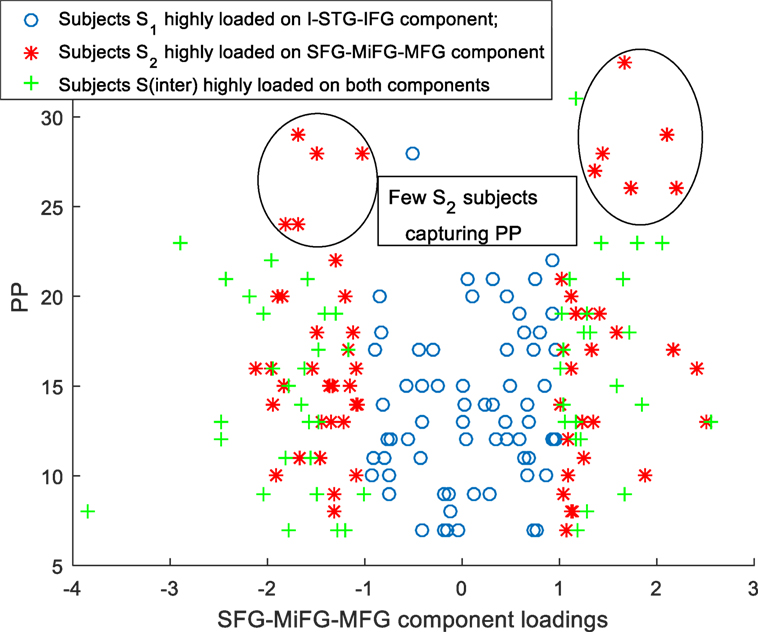
Figure 4. Scatter plot for subtypes S1, S2, Sinter SFG-MiFG-MFG component loadings Vs PP.
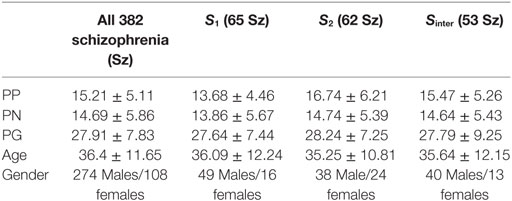
Table 5. Demography/clinical information across all subjects and subtypes.
We also examined the associations of Sinter loadings in both A1, A2 with PP, PN, and PG. We observed a trend level correlation of R(51) = 0.25, p = 0.07 for the loadings of Sinter in A2 with PG symptoms.
Structural Network Connectivity
The SNC between I-STG-IFG and SFG-MiFG-MFG component loadings for the three subtypes showed varying strengths of connectivity as follows: S1 subtype [R(63) = 0.51, p = 1.36e-5], S2 subtype [R(60) = 0.67, p = 1.67e-9], and Sintergroup [R(51) = 0.93, p < 0.00001].
Discussion
This work presents a novel data-driven framework called B-ICA to unearth subtypes having complex biomarkers from neuroimaging data, by considering patients with Sz only. B-ICA applied here on a GMC helps to map the hidden latent relationship between the subset regions of GMC for a subset number of subjects and the clinical scores. This work tries to tackle the challenging task of subtyping patients with Sz without considering Ct. Our viewpoint is similar to the recent theory-driven systematic study, which identified two subtypes in patients with Sz using neuropsychological battery, assessment of clinical symptoms, neurological soft signs, morphogenetic anomalies, smell identification, and measurement of event-related potentials (44). The hypothesis that neuropsychiatric disorders are a result of combination of alterations with varying directionalities in different parts of the brain, is gaining acceptance (31). In support of this, numerous studies in Sz have reported GMC/GMV deficits throughout the brain with the areas of I-STG-IFG component (11, 35) being most severely and consistently affected in Sz. Larger basal ganglia volume (45), striatal gray matter density (35), GMC in cerebellum/brainstem and putamen (46) have also been reported in Sz, compared to Ct group. Most of these studies look at global differences between Ct and Sz, without considering the differences in clinical symptoms within the Sz cohort. With such an analytic viewpoint, low discriminative components between patients with Sz are often missed in a high dimensional neuroimaging dataset, which we managed to decipher in this work. The ICA components analyzed in this work also showed maximum group difference between Ct and Sz in our previous work (11).
A bird’s eye view of the associations between various subtypes and the clinical symptoms obtained using B-ICA is shown in Figure 5. We observed a complex biomarker (i.e., in terms of deviations from mean GMC on two components) for subtypes S1 and S2. The Sinter group had higher GMC on both the components. S2 included few Sz subjects with high positive symptom severity (Figure 4), driving the difference in PP between S1 and S2; this difference include both positive and negative loadings on the SFG-MiFG-MFG component. It is not simply “more” or “less” of that GMC component that predicts the increased positive symptoms; but it is the deviation from the mean values, as shown in Figure 4. Taken together, this could effectively mean that distinct subtypes of Sz are characterized by varying trends of GMC abnormalities in different regions of the brain. Recently subgroups of Sz differing in PANSS symptoms was also reported in a resting state cerebral blood flow work (47).
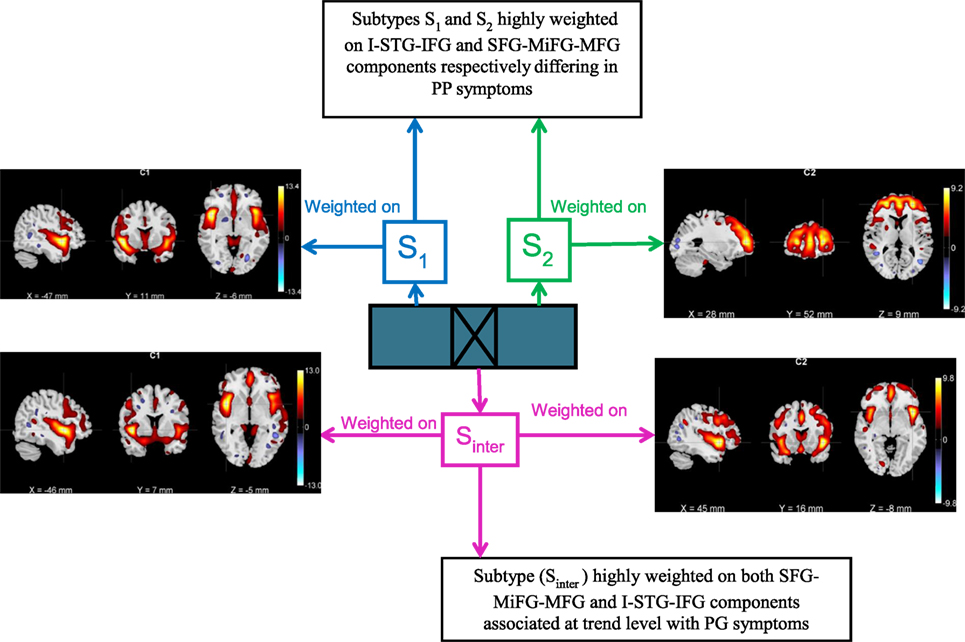
Figure 5. Bird’s eye view of the subtype associations with positive and negative syndrome scale clinical symptoms obtained using biclustered independent component analysis.
These results also suggest that the group of subjects with more extreme weightings on SFG-MiFG-MFG component who also show a weaker weighting in the I-STG-IFG component, is likely to include subjects with greater positive symptoms. While structural interactions between these two GMC components are highly speculative, these are also areas that have been related volumetrically to psychotic symptoms in the prior literature, particularly reduced superior frontal volume with positive symptoms across the psychosis spectrum (48) and in non-clinical samples (49). The insular cortex is both functionally and structurally affected in Sz, and as part of the salience network may be playing a fundamental role in the development of psychosis (50, 51). The particular component we find of not just decreased GMC in one area, but a deviation from the norm in the SFG-MiFG-MFG component, while having an average GMC expression in the I-STG-IFG component, makes these participants a promising group for future more clinically oriented study.
Our approach does not require any a priori knowledge or assumption on the number of biclusters in the subject by voxel matrix, except for the simple statistical threshold to search for subtypes. In contrast to clustering techniques like k-means (52) and hierarchical clustering (53) that find global components based on clinical or cognitive symptoms which are characterized by heterogeneity, B-ICA’s unique data-driven approach enables detection of reliable hidden subtyping from the reliable neuroimaging data. It untangles both overlapping and non-overlapping biclusters based on the inherent properties of GMC data, which in turn is dependent on the spectrum of Sz recruited. These biclusters (i.e., subset of subjects and voxels) linked to specific clinical symptoms could serve as a possible endophenotype for Sz (on replication in future studies) to indicate regions which are affected by common factors like genetics or disease progression (34). We agree, that these sMRI components are not marked endphenotypes in themselves at this point. A much more detailed study of their relationships across diagnostic boundaries, within families, and changes over the development of the illness would be required before their potential as an endophenotype could be determined. The point of this analysis is to introduce the idea of complex combinations of these measures being related to symptoms and patient subgrouping, that would need to be examined with regards to prognosis.
There are a few limitations in this work. First, all the Sz were on antipsychotic medications, and in many datasets, the amounts/history of dosage are not recorded. The availability of standardized Cpz eqvt on all Sz would have made the analysis stronger. Cognitive symptom tests were not considered due to its non-availability across datasets; however, conceptual opportunities in future do exist for the use of RDoc (Research Domain criteria). We also did not have access to electrophysiological data, though that would have been a strength. It is also true that other components (i.e., brain regions) might be relevant to psychotic symptoms and this would require clustering of multiple components, which we plan to investigate in future. We did control for site effects on PANSS scores; however, there could exist heterogeneity due to differences in clinicians rating. The use of biclustering for neuroimaging analyses is relatively new, so it is envisaged this work will stimulate further research. Additionally, future work should be done to replicate these results.
Ethics Statement
This study was performed on legacy datasets that were shared by and with the coauthors for the purpose of this secondary analysis. All data were de-identified and no subjects were recruited for the purpose of this paper. Thus this secondary analysis does not constitute a study which requires IRB oversight.
Author Contributions
CG, EC, SR, VC, and JT developed the B-ICA algorithmic framework and contributed to numerous discussions. CG performed the data analysis. CG, VC, and JT interpreted the results and wrote the paper. All other authors contributed datasets to this work.
Conflict of Interest Statement
The authors declare that the research was conducted in the absence of any commercial or financial relationships that could be construed as a potential conflict of interest.
Funding
Primary funding for this project was provided by R01MH094524 (NIMH, Calhoun and Turner); Datasets used in this work were supported by the following awards: FBIRN 3: U24RR021992 (NIH); COBRE:1P20RR021938 (NIH), The Neuroscience of Creativity Grant—#12456. The authors also wish to thank the National Institutes of Health (R01GM109068, R01MH104680, R01EB005846, R01MH107354, 1R01EB006841, P20GM103472) and National Science Foundation (#1539067) for their partial support. The first author acknowledges support from Indian Institute of Technology Guwahati Startup grant for this work.
References
1. Leonhard K, Beckmann H. Classification of Endogenous Psychoses and Their Differentiated Etiology. New York: Springer Science+Business Media (1999).
2. Andreasen N, Flaum M, Schultz S, Duzyurek S, Miller D. Diagnosis, methodology and subtypes of schizophrenia. Neuropsychobiology (1997) 35(2):61–3. doi:10.1159/000119390
3. Fryer SL, Roach BJ, Ford JM, Turner JA, van Erp TG, Voyvodic J, et al. Relating intrinsic low frequency bold cortical oscillations to cognition in schizophrenia. Neuropsychopharmacology (2015) 40(12):2705–14. doi:10.1038/npp.2015.119
4. Geisler D, Walton E, Naylor M, Roessner V, Lim KO, Charles Schulz S, et al. Brain structure and function correlates of cognitive subtypes in schizophrenia. Psychiatry Res (2015) 234(1):74–83. doi:10.1016/j.pscychresns.2015.08.008
5. Green MF. What are the functional consequences of neurocognitive deficits in schizophrenia? Am J Psychiatry (1996) 153(3):321. doi:10.1176/ajp.153.3.321
6. Nenadic I, Gaser C, Sauer H. Heterogeneity of brain structural variation and the structural imaging endophenotypes in schizophrenia. Neuropsychobiology (2012) 66(1):44–9. doi:10.1159/000338547
7. Ashburner J, Friston KJ. Voxel-based morphometry – the methods. Neuroimage (2000) 11(6):805–21. doi:10.1006/nimg.2000.0582
8. Fornito A, Yücel M, Patti J, Wood S, Pantelis C. Mapping grey matter reductions in schizophrenia: an anatomical likelihood estimation analysis of voxel-based morphometry studies. Schizophr Res (2009) 108(1):104–13. doi:10.1016/j.schres.2008.12.011
9. Meda SA, Giuliani NR, Calhoun VD, Jagannathan K, Schretlen DJ, Pulver A, et al. A large scale (N=400) investigation of gray matter differences in schizophrenia using optimized voxel-based morphometry. Schizophr Res (2008) 101(1):95–105. doi:10.1016/j.schres.2008.02.007
10. Segall JM, Turner JA, van Erp TG, White T, Bockholt HJ, Gollub RL, et al. Voxel-based morphometric multisite collaborative study on schizophrenia. Schizophr Bull (2009) 35(1):82–95. doi:10.1093/schbul/sbn150
11. Gupta CN, Calhoun VD, Rachakonda S, Chen J, Patel V, Liu J, et al. Patterns of gray matter abnormalities in schizophrenia based on an international mega-analysis. Schizophr Bull (2014) 41(5):1133–42. doi:10.1093/schbul/sbu177
12. Turner JA, Calhoun VD, Michael A, van Erp TG, Ehrlich S, Segall JM, et al. Heritability of multivariate gray matter measures in schizophrenia. Twin Res Hum Genet (2012) 15(03):324–35. doi:10.1017/thg.2012.1
13. Xu L, Groth KM, Pearlson G, Schretlen DJ, Calhoun VD. Source-based morphometry: the use of independent component analysis to identify gray matter differences with application to schizophrenia. Hum Brain Mapp (2009) 30(3):711–24. doi:10.1002/hbm.20540
14. Bell AJ, Sejnowski TJ. An information-maximization approach to blind separation and blind deconvolution. Neural Comput (1995) 7(6):1129–59. doi:10.1162/neco.1995.7.6.1129
15. Koutsouleris N, Gaser C, Jäger M, Bottlender R, Frodl T, Holzinger S, et al. Structural correlates of psychopathological symptom dimensions in schizophrenia: a voxel-based morphometric study. Neuroimage (2008) 39(4):1600–12. doi:10.1016/j.neuroimage.2007.10.029
16. Nenadic I, Sauer H, Gaser C. Distinct pattern of brain structural deficits in subsyndromes of schizophrenia delineated by psychopathology. Neuroimage (2010) 49(2):1153–60. doi:10.1016/j.neuroimage.2009.10.014
17. Sauer H, Hornstein C, Richter P, Mortimer A, Hirsch S. Symptom dimensions in old-age schizophrenics: relationship to neuropsychological and motor abnormalities. Schizophr Res (1999) 39(1):31–8. doi:10.1016/S0920-9964(99)00017-1
18. Liddle P, Friston K, Frith C, Hirsch S, Jones T, Frackowiak R. Patterns of cerebral blood flow in schizophrenia. Br J Psychiatry (1992) 160(2):179–86. doi:10.1192/bjp.160.2.179
19. Peralta V, Cuesta M, De Leon J. Positive and negative symptoms/syndromes in schizophrenia: reliability and validity of different diagnostic systems. Psychol Med (1995) 25(01):43–50. doi:10.1017/S0033291700028075
20. Tandon R, Greden JF. Negative symptoms of schizophrenia: the need for conceptual clarity. Biol Psychiatry (1991) 30(4):321–5. doi:10.1016/0006-3223(91)90287-V
21. Heaton RK, Gladsjo JA, Palmer BW, Kuck J, Marcotte TD, Jeste DV. Stability and course of neuropsychological deficits in schizophrenia. Arch Gen Psychiatry (2001) 58(1):24–32. doi:10.1001/archpsyc.58.1.24
22. Lencz T, Smith CW, McLaughlin D, Auther A, Nakayama E, Hovey L, et al. Generalized and specific neurocognitive deficits in prodromal schizophrenia. Biol Psychiatry (2006) 59(9):863–71. doi:10.1016/j.biopsych.2005.09.005
23. Haatveit B, Vaskinn A, Sundet KS, Jensen J, Andreassen OA, Melle I, et al. Stability of executive functions in first episode psychosis: one year follow up study. Psychiatry Res (2015) 228(3):475–81. doi:10.1016/j.psychres.2015.05.060
24. Sánchez-Torres AM, Basterra V, Moreno-Izco L, Rosa A, Fañanás L, Zarzuela A, et al. Executive functioning in schizophrenia spectrum disorder patients and their unaffected siblings: a ten-year follow-up study. Schizophr Res (2013) 143(2):291–6. doi:10.1016/j.schres.2012.11.026
25. Caprihan A, Abbott C, Yamamoto J, Pearlson G, Perrone-Bizzozero N, Sui J, et al. Source-based morphometry analysis of group differences in fractional anisotropy in schizophrenia. Brain Connect (2011) 1(2):133–45. doi:10.1089/brain.2011.0015
26. McCarley RW, Wible CG, Frumin M, Hirayasu Y, Levitt JJ, Fischer IA, et al. MRI anatomy of schizophrenia. Biol Psychiatry (1999) 45(9):1099–119. doi:10.1016/S0006-3223(99)00018-9
27. Honea R, Crow TJ, Passingham D, Mackay CE. Regional deficits in brain volume in schizophrenia: a meta-analysis of voxel-based morphometry studies. Am J Psychiatry (2014) 162(12):2233–45. doi:10.1176/appi.ajp.162.12.2233
28. Kubicki M, Shenton ME. Diffusion tensor imaging findings and their implications in schizophrenia. Curr Opin Psychiatry (2014) 27(3):179–84. doi:10.1097/YCO.0000000000000053
29. Arnedo J, Svrakic DM, Del Val C, Romero-Zaliz R, Hernández-Cuervo H; Molecular Genetics of Schizophrenia Consortium, et al. Uncovering the hidden risk architecture of the schizophrenias: confirmation in three independent genome-wide association studies. Am J Psychiatry (2015) 172(2):139–53. doi:10.1176/appi.ajp.2014.14040435
30. Arnedo J, Mamah D, Baranger DA, Harms MP, Barch DM, Svrakic DM, et al. Decomposition of brain diffusion imaging data uncovers latent schizophrenias with distinct patterns of white matter anisotropy. Neuroimage (2015) 120:43–54. doi:10.1016/j.neuroimage.2015.06.083
31. Atluri G, Padmanabhan K, Fang G, Steinbach M, Petrella JR, Lim K, et al. Complex biomarker discovery in neuroimaging data: finding a needle in a haystack. Neuroimage Clin (2013) 3:123–31. doi:10.1016/j.nicl.2013.07.004
32. Mejía-Roa E, Carmona-Saez P, Nogales R, Vicente C, Vázquez M, Yang XY, et al. bioNMF: a web-based tool for nonnegative matrix factorization in biology. Nucleic Acids Res (2008) 36(Suppl 2):W523–8. doi:10.1093/nar/gkn335
33. Zwir I, Shin D, Kato A, Nishino K, Latifi T, Solomon F, et al. Dissecting the PhoP regulatory network of Escherichia coli and Salmonella enterica. Proc Natl Acad Sci U S A (2005) 102(8):2862–7. doi:10.1073/pnas.0408238102
34. Gottesman II, Gould TD. The endophenotype concept in psychiatry: etymology and strategic intentions. Am J Psychiatry (2003) 160(4):636–45. doi:10.1176/appi.ajp.160.4.636
35. Glahn DC, Thompson PM, Blangero J. Neuroimaging endophenotypes: strategies for finding genes influencing brain structure and function. Hum Brain Mapp (2007) 28(6):488–501. doi:10.1002/hbm.20416
36. Pillai A, Buckley PF. Reliable biomarkers and predictors of schizophrenia and its treatment. Psychiatr Clin North Am (2012) 35(3):645–59. doi:10.1016/j.psc.2012.06.006
37. Kay SR, Flszbein A, Opfer LA. The positive and negative syndrome scale (PANSS) for schizophrenia. Schizophr Bull (1987) 13(2):261. doi:10.1093/schbul/13.2.261
38. van Erp TG, Preda A, Nguyen D, Faziola L, Turner J, Bustillo J, et al. Converting positive and negative symptom scores between PANSS and SAPS/SANS. Schizophr Res (2014) 152(1):289–94. doi:10.1016/j.schres.2013.11.013
39. Amann B, Canales-Rodríguez E, Madre M, Radua J, Monte G, Alonso-Lana S, et al. Brain structural changes in schizoaffective disorder compared to schizophrenia and bipolar disorder. Acta Psychiatr Scand (2016) 133(1):23–33. doi:10.1111/acps.12440
40. Salmond C, Ashburner J, Vargha-Khadem F, Connelly A, Gadian D, Friston K. Distributional assumptions in voxel-based morphometry. Neuroimage (2002) 17(2):1027–30. doi:10.1006/nimg.2002.1153
41. Du Y, Fan Y. Group information guided ICA for fMRI data analysis. Neuroimage (2013) 69:157–97. doi:10.1016/j.neuroimage.2012.11.008
42. Delorme A. Statistical methods. Encycl Med Device Instrum Wiley Intersci (2006) 6:240–64. doi:10.1002/0471732877.emd318
43. Segall JM, Allen EA, Jung RE, Erhardt EB, Arja SK, Kiehl K, et al. Correspondence between structure and function in the human brain at rest. Front Neuroinformatics (2012) 6:10. doi:10.3389/fninf.2012.00010
44. Szendi I, Racsmány M, Cimmer C, Csifcsák G, Kovács ZA, Szekeres G, et al. Two subgroups of schizophrenia identified by systematic cognitive neuropsychiatric mapping. Eur Arch Psychiatry Clin Neurosci (2010) 260(3):257–66. doi:10.1007/s00406-009-0073-6
45. Chakos MH, Lieberman JA, Bilder RM, Borenstein M, Lerner G, Bogerts B, et al. Increase in caudate nuclei volumes of first-episode schizophrenic patients taking antipsychotic drugs. Am J Psychiatry (1994) 151(10):1430–6. doi:10.1176/ajp.151.10.1430
46. Kawasaki Y, Suzuki M, Kherif F, Takahashi T, Zhou SY, Nakamura K, et al. Multivariate voxel-based morphometry successfully differentiates schizophrenia patients from healthy controls. Neuroimage (2007) 34(1):235–42. doi:10.1016/j.neuroimage.2006.08.018
47. Stegmayer K, Strik W, Federspiel A, Wiest R, Bohlhalter S, Walther S. Specific cerebral perfusion patterns in three schizophrenia symptom dimensions. Schizophr Res (2017). doi:10.1016/j.schres.2017.03.018
48. Padmanabhan JL, Tandon N, Haller CS, Mathew IT, Eack SM, Clementz BA, et al. Correlations between brain structure and symptom dimensions of psychosis in schizophrenia, schizoaffective, and psychotic bipolar I disorders. Schizophr Bull (2014) 41(1):154–62. doi:10.1093/schbul/sbu075
49. Nenadic I, Lorenz C, Langbein K, Dietzek M, Smesny S, Schönfeld N, et al. Brain structural correlates of schizotypy and psychosis proneness in a non-clinical healthy volunteer sample. Schizophr Res (2015) 168(1):37–43. doi:10.1016/j.schres.2015.06.017
50. Manoliu A, Riedl V, Zherdin A, Mühlau M, Schwerthöffer D, Scherr M, et al. Aberrant dependence of default mode/central executive network interactions on anterior insular salience network activity in schizophrenia. Schizophr Bull (2013) 40(2):428–37. doi:10.1093/schbul/sbt037
51. Menon V. Large-scale brain networks and psychopathology: a unifying triple network model. Trends Cogn Sci (2011) 15(10):483–506. doi:10.1016/j.tics.2011.08.003
52. Lee H, Malaspina D, Ahn H, Perrin M, Opler MG, Kleinhaus K, et al. Paternal age related schizophrenia (PARS): latent subgroups detected by k-means clustering analysis. Schizophr Res (2011) 128(1):143–9. doi:10.1016/j.schres.2011.02.006
Keywords: gray matter concentration, biclustering, independent component analysis, subtypes, positive and negative syndrome scale symptoms, group information-guided independent component analysis
Citation: Gupta CN, Castro E, Rachkonda S, van Erp TGM, Potkin S, Ford JM, Mathalon D, Lee HJ, Mueller BA, Greve DN, Andreassen OA, Agartz I, Mayer AR, Stephen J, Jung RE, Bustillo J, Calhoun VD and Turner JA (2017) Biclustered Independent Component Analysis for Complex Biomarker and Subtype Identification from Structural Magnetic Resonance Images in Schizophrenia. Front. Psychiatry 8:179. doi: 10.3389/fpsyt.2017.00179
Received: 11 July 2017; Accepted: 07 September 2017;
Published: 26 September 2017
Edited by:
Thomas W. Weickert, University of New South Wales, AustraliaReviewed by:
Jochen Kindler, University of Bern, SwitzerlandIstván Szendi, University of Szeged, Hungary
Sebastian Walther, University Hospital of Psychiatry, Switzerland
Copyright: © 2017 Gupta, Castro, Rachkonda, van Erp, Potkin, Ford, Mathalon, Lee, Mueller, Greve, Andreassen, Agartz, Mayer, Stephen, Jung, Bustillo, Calhoun and Turner. This is an open-access article distributed under the terms of the Creative Commons Attribution License (CC BY). The use, distribution or reproduction in other forums is permitted, provided the original author(s) or licensor are credited and that the original publication in this journal is cited, in accordance with accepted academic practice. No use, distribution or reproduction is permitted which does not comply with these terms.
*Correspondence: Cota Navin Gupta, cngupta@iitg.ernet.in, ncota@mrn.org
†Both senior authors spent equal time on this work.