
94% of researchers rate our articles as excellent or good
Learn more about the work of our research integrity team to safeguard the quality of each article we publish.
Find out more
ORIGINAL RESEARCH article
Front. Public Health , 11 November 2014
Sec. Epidemiology
Volume 2 - 2014 | https://doi.org/10.3389/fpubh.2014.00239
This article is part of the Research Topic Cancer Epidemiology View all 9 articles
 Emma Veach1Ismael Xique2Jada Johnson3Jessica Lyle4Israel Almodovar5Kimberly F. Sellers6Calandra T. Moore7Monica C. Jackson8*
Colorectal cancer (CRC) is the third leading cause of mortality due to cancer (with over 50,000 deaths annually), representing 9% of all cancer deaths in the United States (1). In particular, the African-American CRC mortality rate is among the highest reported for any race/ethnic group. Meanwhile, the CRC mortality rate for Hispanics is 15–19% lower than that for non-Hispanic Caucasians (2). While factors such as obesity, age, and socio-economic status are known to associate with CRC mortality, do these and other potential factors correlate with CRC death in the same way across races? This research linked CRC mortality data obtained from the National Cancer Institute with data from the United States Census Bureau, the Centers for Disease Control and Prevention, and the National Solar Radiation Database to examine geographic and racial/ethnic differences, and develop a spatial regression model that adjusted for several factors that may attribute to health disparities among ethnic/racial groups. This analysis showed that sunlight, obesity, and socio-economic status were significant predictors of CRC mortality. The study is significant because it not only verifies known factors associated with the risk of CRC death but, more importantly, demonstrates how these factors vary within different racial groups. Accordingly, education on reducing risk factors for CRC should be directed at specific racial groups above and beyond creating a generalized education plan.
Colorectal cancer (CRC) is ranked as the third leading cause of death among all cancers (1). In fact, research has shown that racial disparities exist that associate with CRC death. African Americans have the highest CRC mortality rate, while CRC mortality for Hispanics is 15–19% lower than that for non-Hispanic Caucasians (2, 3). Several other variables are either known or believed to associate with the risk of CRC mortality, including geographic and environmental factors, socio-economic status (e.g., education, income level), age, and health status (4). The question remains, however, how these factors contribute to CRC mortality among different racial/ethnic groups.
Regional differences caused by one’s residence locale are a potential factor contributing to racial disparities (5). In the United States, the distribution of persons from different racial/ethnic groups varies throughout the nation, and this contributes not only to geographic differences but also to environmental differences. Previous research has indicated that there are environmental factors that add to the risk (or lack thereof) of developing CRC. One of the main protectors against CRC is vitamin D. Americans lack a diet that is plentiful in vitamin D, so studies are looking at the sun as a source for vitamin D (6). Research has shown that the amount of sunlight exposure negatively correlates with the risk of mortality from CRC (7). The area in which a person lives can affect the amount of vitamin D that the body is receiving from sunlight. Previous studies have shown that persons living in large metropolitan areas receive less sunlight due to the shadowing of buildings, whereas places that are more rural receive more direct sunlight. This direct sunlight possibly explains why people in rural areas appear to have lower risks and occurrences of CRC (6).
Some of the variation that exists between African Americans and Caucasians can be accounted for by socio-economic status (8, 9). One key contributor is education. A Tennessee study showed that people with at least a high-school education are 2.47 times more likely to get screened for colon cancer than those without it (10). Meanwhile, annual screenings are shown to reduce CRC mortality by 33%, and biennial screenings reduce mortality by 21% (11). Thus, the fact that lack of education reduces the likelihood of screening infers that it could also increase the chances of mortality.
Various health factors also associate with the risk of CRC mortality. For one, deaths due to CRC increase with age. In fact, 94% of deaths occur among individuals at least 50 years old (1). Meanwhile, obesity has also been shown to increase the risk of CRC mortality for all adults (12, 13), with the relationship being stronger for men than for women (12). CRC is also influenced by the concentration of insulin in the body. Several studies have found that individuals with Type 2 diabetes have a higher risk of developing CRC [e.g., Coughlin et al. (14)]. While this could further explain the racial disparities associated with CRC mortality (the risk of Type 2 diabetes is greater for non-Caucasians), other research attributes this result to certain racial/ethnic populations being overweight and having high blood pressure (15, 16).
Given the difference in CRC mortality rates across race/ethnicity, this study seeks to learn which risk factors (previously studied and currently hypothesized) impact CRC death for each racial group. This work examines geographic and racial/ethnic differences that potentially correlate with CRC, and develops a spatial regression model that adjusts for several factors that may attribute to health disparities among ethnic/racial groups in an effort to detect statistically significant predictors of CRC. This study is significant because it not only identifies factors associated with the risk of CRC mortality but also, more importantly, demonstrates how these factors vary within different racial groups. Identifying risk factors associated with different racial/ethnic groups could help lower mortality rates. Accordingly, education on reducing risk factors for CRC should be directed at specific racial groups above and beyond creating a generalized education plan. This paper is organized as follows. The section “Materials and Methods” describes the data collection and variables considered for analysis, along with the statistical methods used for this research. The section “Results” describes the data distribution and correlation structure among the variables in the dataset. Further, this section outlines the various statistically significant associations between certain risk factors and CRC mortality for the different racial groups. We conclude with discussion.
Data for this study were collected to study CRC mortality rates across counties in the 48 contiguous states in the United States. The data were obtained from three sources: the United States Census Bureau, the Centers for Disease Control and Prevention (CDC), and the National Solar Radiation Database; Table 1 lists the variable names of interest and their descriptions. Broomfield County, CO, USA (which is composed of parts of neighboring counties) and Clifton Forge City, VA, USA (which is no longer recognized as a county) are omitted from the analysis. Further, the natural-log transformation of the mortality rates for each of the races considered was applied across groups to allow for a more symmetric distribution and to approximate a normal response variable.
Table 1. List of variable names and descriptions for the study.
The Census Bureau provided information for the year 2000 regarding education level, population, socio-economic status, income, population type (i.e., rural versus urban population), and poverty level by county. These data were used because the estimated 5-year survival rate for CRC in the United States is 62% (17), thus we wish to more accurately represent the living conditions of people who died in 2005.
Data on education level are provided regarding individuals at least 45 years of age. Education level, initially defined by three classifications (high-school degree, bachelor’s degree, and graduate or professional degree), was condensed into one category (at least a high-school degree or otherwise) to improve the efficiency of our model. The following CDC data from 2005 to 2007 were collected and averaged for each of the study years considered: percentage of the population with diabetes; percentage of the population considered obese based on county-level estimates; and the mortality rates of the Caucasian (non-Hispanic/Latino), Black or African-American, and Hispanic or Latino populations of CRC by county.
The National Solar Radiation Database (NSRDB) supplied the extraterrestrial radiation horizontal (ETRH) averages by state for 1991–2005. ETRH denotes the sunlight collected from a plate that is horizontal to the earth’s surface (3Tier). These data were used for the study because humans are more likely to identify with the horizontal measurement since they absorb the sun’s rays based on the angle of the sun and the time of day. Since we are considering detection and mortality rates from 2005 to 2007, we chose to analyze the most relevant (i.e., 2005) data. The NSRDB collected data from Class I, Class II, and Class III airports. Class I airport data were used since it had the most extensive coverage of solar radiation. There were 221 Class I airports including Hawaii and Alaska. The airports in Hawaii and Alaska were omitted because these states are not being used in the analysis. Oklahoma does not have Class I airports, thus two Class II airports were chosen and averaged to calculate the temperature data for the state of Oklahoma.
The solar radiation data were composed of specific daily measurements (from 7:00 a.m. to 4:00 p.m.), which were averaged for the entire month. The average of every month for each Class I (note: class II for Oklahoma) airport was calculated, along with the yearly average for each airport. The yearly averages for the individual airports were used to calculate state radiation averages. Every Class I airport in a specific state was included in the calculation for a state average. County data for solar radiation could not be calculated because not every county had an airport, so the state average was alternatively used.
The CDC provided data on the county-level mortality rates for all 3,143 counties in the 50 states and the District of Columbia. Gender and race were associated with mortality rates due to CRC from 2005 to 2007. The mortality file provided the national, state, and county-level population estimates based on the Census however, to protect individual privacy, only aggregate information (precision to two significant digits) is provided below; see the section “Results.”
A modified version of Moran’s I (18) was used to test for geographic clustering for the three dependent variables. Modified Moran’s I is defined as:
where γi and γj are the colorectal death rates at geographic locations i and j, respectively; is the expected colorectal death rate using all the data; and N is the total number of geographic units. The weight function used is known as the population density adjusted exponential weight function (19) and defined as
where dij is the Euclidian distance between the geographical points γi and γi, and k can be set to small or large values and correspondingly “increases the sensitivity of the test to large or small clusters” (19). We let k = 1 km to allow for possible detection of any sized clusters. The test statistic IW and corresponding p-value provide inference regarding the hypothesis test for statistically significant spatial correlation. This test was performed via the R statistical analysis software (20) for each of the sample populations (Hispanic/Latino, Caucasian, and African American).
Using spatial regression, we fit a simultaneous autoregressive model (SAR) that uses a regression on the values from all locations to account for the spatial dependence to estimate the geographical, weather, and socio-economic variables presented in Table 1 that were predictors for CRC mortality rates in each county. The weight function defined in (Eq. 2) was included in the SAR model. The SAR model was only used when the response variable indicated spatial autocorrelation via (Eq. 1). Linear regression was alternatively performed, where applicable, to analyze the non-spatially correlated response data. Separate regression models were built to model the relationship between CRC mortality rates and the variables described in Table 1 for Hispanic, African-American, and Caucasian groups, respectively.
The dataset is a compilation of variables on 3108 counties across the 48 contiguous United States. Below, we provide the resulting descriptive statistics and regressions associated with these data.
This study examined the relationship between CRC mortality rates and several variables regarding atmosphere, geographic location, and socio-economic status. Descriptive statistics reveal that the approximate respective median and mean death rates across all counties are 0 and 7.5% for the African Americans, 0 and 1.17% for Hispanics, and 1.5 and 1.61% for Caucasians. This implies that at least half of the counties studied have African American and Hispanic CRC mortality rates that are <1 out of 200, respectively. Figure 1 shows the distribution of (natural-log-transformed) CRC mortality rates across the 48 contiguous United States for each of the three racial/ethnic groups. As noted in the section “Materials and Methods,” we conduct this transformation to account for the severe right-skewness in the data distribution on the original scale. The largest mortality rates for each of the respective races occurs in Santa Cruz County, AZ, USA (for African Americans); Douglas County, SD, USA (for Hispanics); and Grayson County, KY, USA (for Caucasians).
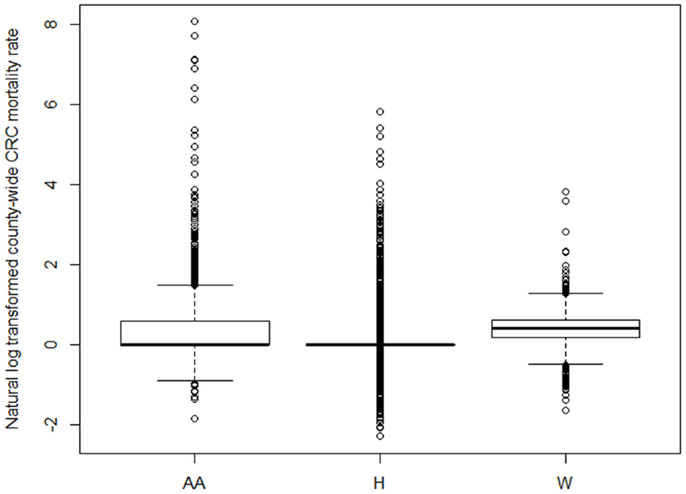
Figure 1. Comparative boxplots of the distribution of (natural-log transformed) CRC mortality rates across 3108 counties in the contiguous United States for each race/ethnicity (AA = African- American/Black, H = Hispanic/Latino, W = Caucasian/White).
Table 2 presents the Pearson’s correlation coefficients for all pairs of explanatory variables considered in the analysis. Explanatory variables with inter-correlations of at least 0.70 were subject to variable selection. We selected this inter-correlation threshold in order to avoid including explanatory variables that were themselves highly correlated, thus reducing the statistical power associated of the model. The strong correlation between some of the variables was expected (e.g., male and female genders; and obesity and diabetes). Due to the high correlation between the respective percentages of the population that are either male or female and over 50 across counties (r = 0.901), we chose to focus our attention on males since colon cancer is more of a risk to men. Given the high correlation between average obesity and average diabetes rates (r = 0.754), we only considered obesity in our model, since obesity is a curable factor and can possibly be altered in those affected. The R statistical software package (20) was used for all analyses.
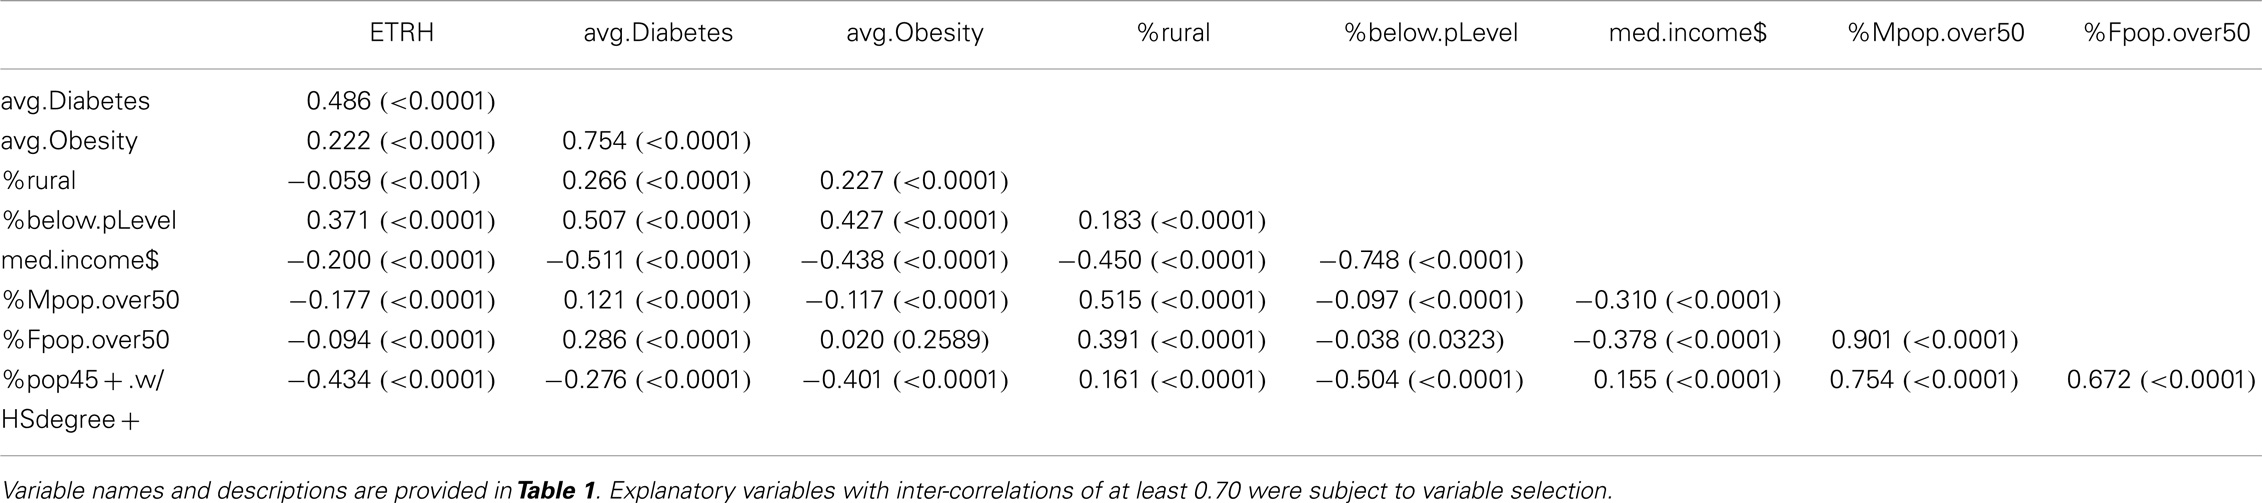
Table 2. Pearson correlation matrix, showing the correlation coefficients (rounded to three significant digits) for all pairs of explanatory variables considered in the study; corresponding p-values provided in parentheses.
In an effort to examine geographic and racial/ethnic differences that potentially correlate with CRC, we considered a spatial regression model that adjusted for several factors that were thought to attribute to health disparities among ethnic/racial groups. By utilizing Modified Moran’s I, we were able to determine that the spatial autocorrelation is an inherent property of the response variable itself. Therefore, a SAR was deemed most appropriate for those cases (regression models for African-American and Caucasian subgroups); see below for details. In addition, we alternatively considered an ordinary least squares (OLS) regression to model these respective relationships (not shown). Examination of the residuals, however, indicated a strong violation of the necessary regression assumptions, which again led us to the SAR model, where appropriate.
All assumptions associated with the presented regressions have been reasonably met. Homoscedasticity was reasonably verified in association with all regression models in that there were no obvious residual patterns (figures not shown). Initially, OLS regression was considered for all three models presented in the paper. However, the respective models with African American and Caucasian CRC mortality rates as the response variable indicated a strong pattern in the residuals (figures not shown), thus a spatial regression model was utilized. Meanwhile, the OLS regression to model Hispanic CRC mortality did not show any patterns in the residuals.
Modified Moran’s I was used to examine the spatial relationship between neighboring regions. Using the adjacent neighbor matrix defined in (Eq. 1), we obtained values IW = 0.008 (p-value = 0.001) for African Americans, IW = 0.002 (p-value = 0.434) for Hispanics, and IW = 0.021 (p-value <0.001) for Caucasians. These results imply that African Americans and Caucasians showed statistically significant spatial relationships, while such a relationship was not statistically significant among Hispanics.
Independent spatial regression analyses were done for the respective CRC mortality rates among African Americans and Caucasians, accordingly. After a careful analysis of the explanatory variables in the correlation table (Table 2), we chose to consider average sunlight, average obesity rate, percentage of the county that is rural, percentage below poverty, and percentage of the male population over 50 years of age in the analyses. These variables were chosen in light of the strong correlations evident in the correlation table for some of the variables; see Table 2.
The average obesity and average diabetes rates were strongly correlated, as well as the percentage of males over 50 years with the percentage of the total population age 45 years or older with at least a high-school degree. Thus, we considered a simultaneous auto-regression spatial model to associate the various explanatory variables [average extraterrestrial horizontal radiation (Weber per square meter) by state, percentage of the county deemed rural, obesity rates in the population, percentage of population with at least a high-school degree, percentage below poverty level, and percentage of the population that is male and over 50 years old] and spatial relationships with the CRC mortality rate within each respective race. We used an adjacent neighbor weight matrix to represent the relationship between each location.
The data for African Americans showed significant spatial associations. A spatial regression model was then calculated using data that connected neighboring counties to each other. The model was statistically significant (test statistic equals 0.199; p-value <0.001), implying that the spatial model is informative. In particular, four traits (average extraterrestrial horizontal radiation by state, percentage of the county deemed rural, obesity rates in the population, and percentage of population with at least a high-school degree) were found to be statistically significant in the model concerning the African-American CRC mortality rate; see Table 3. The CRC mortality rate among African Americans was found to be positively correlated with average extraterrestrial horizontal radiation by state (p-value <0.001) and average percentage of the population that is obese (p-value = 0.002), and negatively associated with the percentage of the county that is classified as rural (p-value <0.001) and percentage of population with a high-school degree (p-value = 0.019).
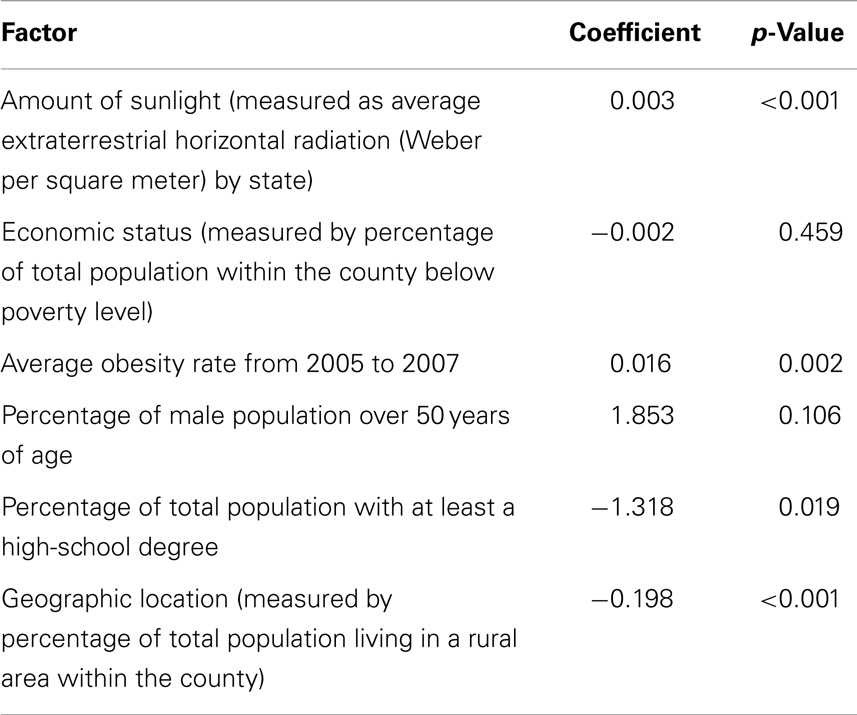
Table 3. Spatial regression coefficient table for African Americans shows that the amount of sunlight, average obesity rate, percentage of total population with at least a high-school degree, and geographic location all statistically significantly associate with the CRC mortality rate.
No statistically significant spatial associations were detected within the Hispanic population. Statistically significant spatial connections were, however, detected among Caucasians; see Table 4. The model was statistically significant (test statistic equals 0.165; p-value < 0.001), inferring that the spatial model is informative. In particular, five of the six traits considered (i.e., the percentage of the population falling below the poverty level, average solar radiation, average obesity rate, percentage of the county that is rural, and the percentage of the population that is male) are statistically significant. The CRC mortality rate among Caucasians shows a positive association with the percentage of the population that fell below poverty level (p-value = 0.044), average obesity (p-value < 0.001), and the percentage of the population that was male (p-value < 0.001). Meanwhile, the CRC mortality rate is negatively associated with average solar radiation (p-value = 0.001) and the percentage of the county that is rural (p-value < 0.001).
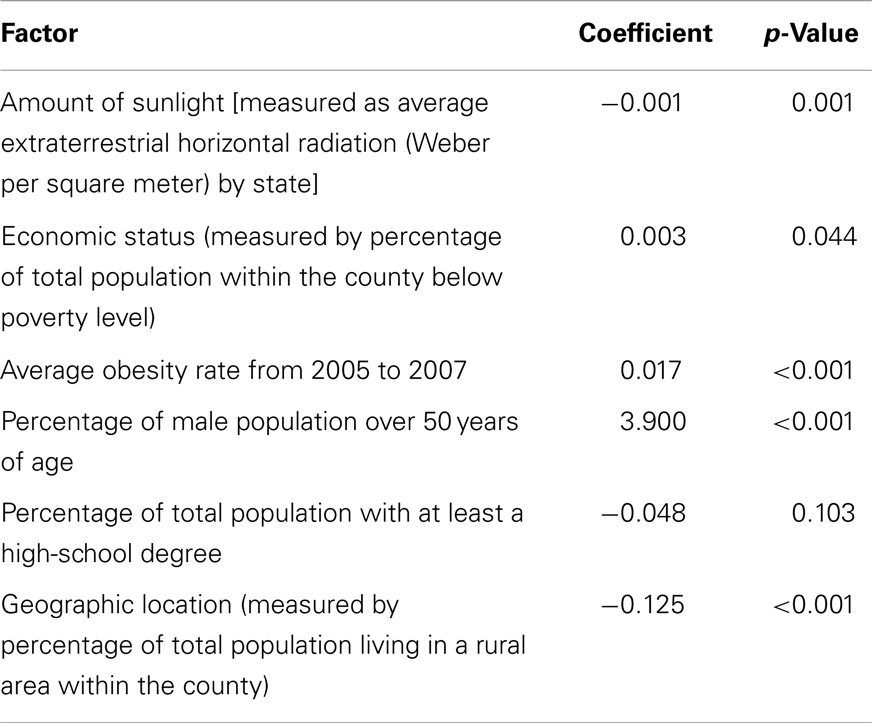
Table 4. Spatial regression coefficient table for Caucasians shows that the amount of sunlight, economic status, average obesity rate, percentage of the male population over 50 years old, and geographic location all statistically significantly associate with the CRC mortality rate.
The Modified Moran’s I did not indicate the existence of spatial clustering of CRC mortality rates among Hispanics, therefore, we consider a multiple regression model that associates the CRC mortality rate among Hispanics to the amount of sunlight (as measured by the average extraterrestrial horizontal radiation by state), the percentage of the county that is rural, the average county obesity level, the percentage of the population with at least a high-school degree, the percentage below poverty level, and the percentage of the population that is male and over 50 years of age. We used the backward elimination method, which resulted in four of the six traits analyzed in the model (namely, the percentage of men over 50; the percentage of the county classified as rural; average obesity level; and average extraterrestrial horizontal radiation by state as a measure of the average amount of sunlight) being statistically significant; see Table 5. More precisely, the CRC mortality rate among Hispanics was positively correlated with percentage of men over 50 (p-value = 0.001), average obesity level (p-value = 0.010), the average amount of sunlight (p-value = 0.033), and the percentage of the county classified as rural (p-value = 0.008). The corresponding residual analysis showed some slight discrepancies, but primarily showed relatively normal residuals, reasonably satisfying model assumptions (figures not shown).
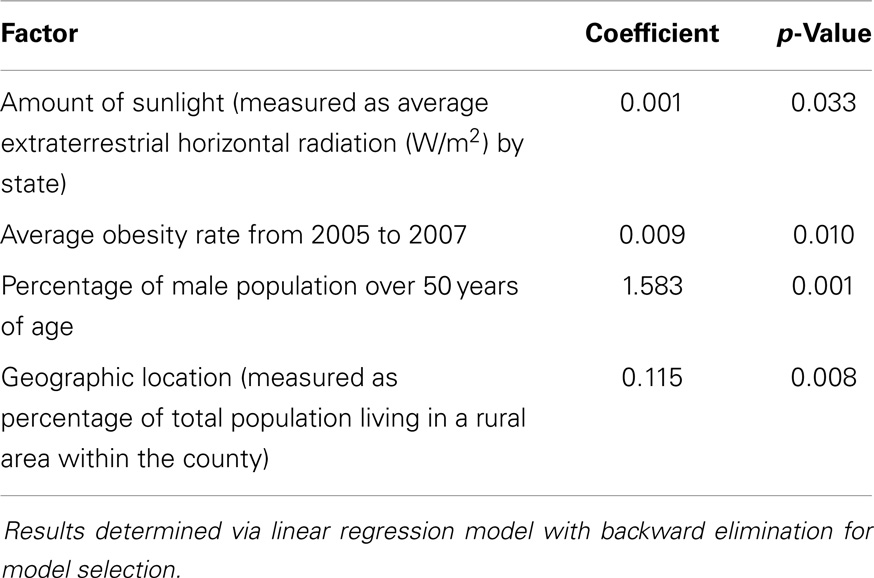
Table 5. Coefficient table for Hispanics shows that the amount of sunlight, average obesity rate, percentage of the male population over 50 years old, and geographic location all statistically significantly associate with the CRC mortality rate.
This research examined geographic and racial/ethnic differences that potentially correlate with CRC. This study is significant because it not only identifies factors associated with the risk of CRC mortality but also, more importantly, demonstrates how these factors vary within different racial groups. Accordingly, education on reducing risk factors for CRC should be directed at specific racial groups above and beyond creating a generalized education plan.
Obesity is consistently recognized as having a statistically significant positive association with CRC mortality rates across all racial groups. While there is already a demonstrated need to address the increase of obesity in the United States, the suggestive link between obesity and CRC provides yet another significant reason to promote better health in the United States. Though obesity was a significant factor across all racial groups, the direction in association with CRC mortality varied by race. Among African Americans and Caucasians, the association was negative, while there was a positive association with the CRC mortality rate in the Hispanic population. The percentage of respective counties considered rural is another significant factor across all races.
Sunlight also played an interesting role in this study. We found sunlight to be statistically significantly associated with CRC mortality – increasing the CRC mortality rate among Hispanics and African Americans, but decreasing the rate among Caucasians. One possible explanation for this difference is that individuals with darker skin tones absorb more sunlight; this can be harmful and cause other health issues rather than provide the beneficial effect of vitamin D absorption. It is also known that a higher percentage of African Americans live in the southern areas of the United States. Since sunlight is significant in the spatial model, it is possible that (by living in the south) African Americans receive sunlight amounts that surpass vitamin D requirements. Caucasians living in the south, however, may require more sunlight exposure in order to absorb the appropriate amount of vitamin D. Another potential explanation for the difference across races is their diets. Hispanics and African Americans may have higher levels of vitamin D in their diets, so the beneficial effects of sun absorption may not be applicable in decreasing the CRC mortality rate. Meanwhile, Caucasians may have diets lower in vitamin D, so the sunlight is needed to make up for the dietary discrepancy in vitamin D and help to act against CRC.
Some of the results obtained contradict previous results. One study states that sunlight decreases the risk of CRC mortality, however, this study finds a positive association between sunlight and CRC mortality risk in minority populations [which, as stated earlier, could be due to diet or skin color; (7)]. Baicker et al. (21) found that living in a rural area decreases the amount of access one has to health care and thus increases mortality rates. Our two spatial studies, however, detect a negative association between living in a rural area and CRC mortality rates. This could be because of the different living habits of those residing in rural areas. Urban areas are often faster paced and have different diets and behavioral patterns, which could negatively affect the individuals living there. Furthermore, cities have more shade coverage (particularly from tall buildings) and people living in cities are thought to be outside less often than those living in rural places. Living in rural areas decreases the risk of mortality from CRC in both Caucasian and African-American populations, and increases the mortality rates among Hispanics.
This work meanwhile established results that were consistent with previous research. Results associating obesity to CRC mortality were substantiated here. Further, education was a statistically significant factor only among African Americans; similar conclusions were obtained in Patel et al. (10). According to the American Cancer Society, males are at an increased risk of both CRC incidence and mortality; this study confirmed these results among Hispanics and Caucasians. The percentage of individuals below the poverty line caused an increase in CRC mortality rate, but only among Caucasians. This supports the previous research [e.g., Patel et al. (10)] on the relationship between socio-economic status and mortality rate. Possible explanations for this relationship include patient willingness to seek medical attention, and medical facilities required to provide medical attention to emergency patients, whether or not the patient is insured. This, however, does not explain why poverty is only a significant factor among Caucasians.
There are other potential regional, socio-economic, and health factors that have been shown to correlate with CRC mortality. In the United States, the distribution of persons from different racial/ethnic groups varies throughout the nation, and this contributes to geographic differences. Aubry-Blanchard et al. (under review) detected statistically significant global spatial clusters in both the African American and non-Hispanic Caucasian populations, while also detecting the existence of small primary cluster in the Hispanic and African-American populations. Caucasians disproportionally reside in the West and Northeast, while African-Americans disproportionally live in the Southeast. It has been shown that residents in the South are less likely to obtain effective healthcare (21), which can be another contributor toward the CRC mortality rates found in this work. One’s occupation has also been shown to associate with CRC mortality risk; this connection is based on whether the type of work is primarily conducted indoors or outdoors, which influences the environmental factor discussed in the section “Introduction” (e.g., the amount of sunlight received); see Freedman et al. (6). Similar results were established regarding night-shift workers, showing that women who worked at least three nights per week for 15 or more years had a greater risk of CRC (22). Smoking and alcohol have also been shown to associate with CRC incidence and mortality (23, 24).
One study limitation concerned finding accurate sunlight data for each county. Sunlight data that were found was associated with specific airports; however, not every county has an airport. Only Class I airports were used in this analysis because of their data reliability; smaller class airports have less reliable data collection instruments. Class II airport sunlight information was only used for one state (Oklahoma), because Oklahoma contained no Class I airports. Thus, we averaged the sunlight data from two Class II airports to compensate for the lack of the Class I airport. As a result of not having airports in every county, each county within a specific state was assigned the same solar radiation value. Such assignments can result in large discrepancies in states with a large range of latitudes (e.g., California). It could be anticipated that counties in northern California would have less radiation coverage than counties in southern California. Further, a solar plate could not be equally compared to the human body and how fast humans absorb solar radiation.
Another possible limitation is the fact that the education data is calculated for individuals at least 45 years old, instead of at least 50 years old. The incidence of higher education has increased with time, so the population of 45- to 49-year-olds could potentially skew the education data and thus create a limitation within our analysis.
Colorectal cancer is ranked as the third leading cause of death among all cancers; however the death rate has continuously decreased over the last 20 years for both men and women (1). This could be caused by more accurate and accessible screening, which results in earlier cancer detection and thus a higher rate of patient survival. Further, CRC treatments have greatly improved over the years and, from these combined improvements, there are now over one million colon cancer survivors (1, 2). By incorporating knowledge of statistically significant associations between various factors and CRC mortality for different races, we can develop focused educational plans directed toward specific racial groups in an effort to close the racial health disparity gap.
The authors declare that the research was conducted in the absence of any commercial or financial relationships that could be construed as a potential conflict of interest.
1. American Cancer Society, Colorectal Cancer. (2014). Available from: http://www.cancer.org/cancer/colonandrectumcancer/index
2. Horner MJ, Ries LAG, Krapcho M, Neyman N, Aminou R, Howlader N, editors. SEER Cancer Statistics Review, 1975-2006. Bethesda, MD: National Cancer Institute (2009). Available from: http://seer.cancer.gov/csr/1975_2006/
3. Shavers VL, Jackson MC, Sheppard VB. Racial/Ethnic patterns of uptake of colorectal screening, National Health Interview Survey 2000-2008. J Natl Med Assoc (2010) 102(7):621–35.
4. American Cancer Society. What are the Risk Factors for Colorectal Cancer? (2014). Available from: http://www.cancer.org/cancer/colonandrectumcancer/detailedguide/colorectal-cancer-risk-factors
5. Ricketts TC. Geography and health disparity. Health Status Disparities in the United States Conference Proceedings. Woodrow Wilson International Center for Scholars (2007). Available from: http://www.wilsoncenter.org/topics/docs/Ricketts.pdf
6. Freedman DM, Dosemeci M, McGlynn K. Sunlight and mortality from breast, ovarian, colon, prostate, and non-melanoma skin cancer: a composite death certificate based case-control study. Occup Environ Med (2002) 59(4):257–62. doi: 10.1136/oem.59.4.257
Pubmed Abstract | Pubmed Full Text | CrossRef Full Text | Google Scholar
7. Garland CF, Garland FC. Do sunlight and vitamin D reduce the likelihood of colon cancer? Int J Epidemiol (2006) 35(2):217–20. doi:10.1093/ije/dyi229
8. Marcella S, Miller JE. Racial differences in colorectal cancer mortality: the importance of stage and socioeconomic status. J Clin Epidemiol (2001) 54(4):359–66. doi:10.1016/S0895-4356(00)00316-4
Pubmed Abstract | Pubmed Full Text | CrossRef Full Text | Google Scholar
9. Le H, Ziogas A, Lipkin SM, Zell JA. Effects of socioeconomic status and treatment disparities in colorectal cancer survival. Cancer Epidemiol Biomarkers Prev (2008) 17(8):1950–62. doi:10.1158/1055-9965.EPI-07-2774
Pubmed Abstract | Pubmed Full Text | CrossRef Full Text | Google Scholar
10. Patel K, Hargreaves M, Liu J, Kenerson D, Neal R, Takizala Z, et al. Factors influencing colorectal cancer screening in low-income African Americans in Tennessee. J Community Health (2012) 37(3):673–9. doi:10.1007/s10900-011-9498-8
Pubmed Abstract | Pubmed Full Text | CrossRef Full Text | Google Scholar
11. Mandel JS, Church TR, Ederer F, Bond JH. Colorectal cancer mortality: effectiveness of biennial screening for fecal occult blood. J Natl Cancer Inst (1999) 91(5):434–7. doi:10.1093/jnci/91.5.434
Pubmed Abstract | Pubmed Full Text | CrossRef Full Text | Google Scholar
12. Murphy TK, Calle EE, Rodriguez C, Kahn HS, Thun MJ. Body mass index and colon cancer mortality in a large prospective study. Am J Epidemiol (2000) 152(9):847–54. doi:10.1093/aje/152.9.847
Pubmed Abstract | Pubmed Full Text | CrossRef Full Text | Google Scholar
13. Frezza EE, Wachtel MS, Chiriva-Internati M. Influence of obesity on the risk of developing colon cancer. Gut (2006) 55(2):285–91. doi:10.1136/gut.2005.073163
Pubmed Abstract | Pubmed Full Text | CrossRef Full Text | Google Scholar
14. Coughlin SS, Calle EE, Teras LR, Petrelli J, Thun MJ. Diabetes mellitus as a predictor of cancer mortality in a large cohort of US adults. Am J Epidemiol (2004) 159(12):1160–7. doi:10.1093/aje/kwh161
Pubmed Abstract | Pubmed Full Text | CrossRef Full Text | Google Scholar
15. O’Keefe SJD, Chung D, Mahmoud N, Sepulveda AR, Manafe M, Arch J, et al. Why do African Americans get more colon cancer than native Africans? J Nutr (2007) 137(1):1755–825.
16. Ryan-Harshman M, Aldoori W. Diet and colorectal cancer: review of the evidence. Can Fam Physician (2007) 53(11):1913–20.
17. Gatta G, Ciccolallo L, Capocaccia R, Coleman MP, Hakulinen T, Møller H, et al. Differences in colorectal cancer survival between European and US populations: the importance of sub-site and morphology. Eur J Cancer (2003) 39(15):2214–22. doi:10.1016/S0959-8049(03)00549-5
Pubmed Abstract | Pubmed Full Text | CrossRef Full Text | Google Scholar
18. Jackson MC, Huang L, Xie Q, Tiwari R. A modified version of Moran’s I. Int J Health Geogr (2010) 9:33. doi:10.1186/1476-072X-9-33
Pubmed Abstract | Pubmed Full Text | CrossRef Full Text | Google Scholar
19. Thompson W, McGinnis S, McDaniel D, Sexton J, Pettit R, Anderson S, et al. A geographical and statistical analysis of childhood leukemia deaths relating to the locations of nuclear power plants. Adv Appl Stat Sci (2011) 6(5): 313–28.
20. Core Team R. R: A Language and Environment for Statistical Computing. Vienna: R Foundation for Statistical Computing (2014).
21. Baicker K, Chandra A, Skinner JS. Geographic variation in health care and the problem of measuring racial disparities. Perspect Biol Med (2005) 48(1):S42–53. doi:10.1353/pbm.2005.0034
Pubmed Abstract | Pubmed Full Text | CrossRef Full Text | Google Scholar
22. Schernhammer ES, Laden F, Speizer FE, Willett WC, Hunter DJ, Kawachi I, et al. Night-shift work and risk of colorectal cancer in the nurses’ health study. J Natl Cancer Inst (2003) 95(11):825–8. doi:10.1093/jnci/95.11.825
Pubmed Abstract | Pubmed Full Text | CrossRef Full Text | Google Scholar
23. Botteri E, Iodice S, Bagnardi V, Raimondi S, Lowenfels AB, Maisonneuve P. Smoking and colorectal cancer: a meta-analysis. J Am Med Assoc (2008) 300(23):2765–78. doi:10.1001/jama.2008.839
Pubmed Abstract | Pubmed Full Text | CrossRef Full Text | Google Scholar
Keywords: cancer, spatial regression, health disparities
Citation: Veach E, Xique I, Johnson J, Lyle J, Almodovar I, Sellers KF, Moore CT and Jackson MC (2014) Race matters: analyzing the relationship between colorectal cancer mortality rates and various factors within respective racial groups. Front. Public Health 2:239. doi: 10.3389/fpubh.2014.00239
Received: 08 July 2014; Accepted: 30 October 2014;
Published online: 11 November 2014.
Edited by:
Jimmy Thomas Efird, Brody School of Medicine, USAReviewed by:
Angel Lanas, University of Zaragoza, SpainCopyright: © 2014 Veach, Xique, Johnson, Lyle, Almodovar, Sellers, Moore and Jackson. This is an open-access article distributed under the terms of the Creative Commons Attribution License (CC BY). The use, distribution or reproduction in other forums is permitted, provided the original author(s) or licensor are credited and that the original publication in this journal is cited, in accordance with accepted academic practice. No use, distribution or reproduction is permitted which does not comply with these terms.
*Correspondence: Monica C. Jackson, American University, 4400 Massachusetts Avenue, NW, Washington, DC 20016–8050, USA e-mail:monica@american.edu
Disclaimer: All claims expressed in this article are solely those of the authors and do not necessarily represent those of their affiliated organizations, or those of the publisher, the editors and the reviewers. Any product that may be evaluated in this article or claim that may be made by its manufacturer is not guaranteed or endorsed by the publisher.
Research integrity at Frontiers
Learn more about the work of our research integrity team to safeguard the quality of each article we publish.