 Steven A. Cohen
 Lauren Kelley
 Allison E. Bell
- 1Department of Family Medicine and Population Health, Virginia Commonwealth University, Richmond, VA, USA
- 2Department of Internal Medicine, Virginia Commonwealth University, Richmond, VA, USA
Introduction: Rural populations face numerous barriers to health, including poorer health care infrastructure, access to care, and other sociodemographic factors largely associated with rurality. Multiple measures of rurality used in the biomedical and public health literature can help assess rural–urban health disparities and may impact the observed associations between rurality and health. Furthermore, understanding what makes a place truly “rural” versus “urban” may vary from region to region in the US.
Purpose: The objectives of this study are to compare and contrast five common measures of rurality and determine how well-correlated these measures are at the national, regional, and divisional level, as well as to assess patterns in the correlations between the prevalence of obesity in the population aged 60+ and each of the five measures of rurality at the regional and divisional level.
Methods: Five measures of rurality were abstracted from the US Census and US Department of Agriculture (USDA) to characterize US counties. Obesity data in the population aged 60+ were abstracted from the Behavioral Risk Factor Surveillance System (BRFSS). Spearman’s rank correlations were used to quantify the associations among the five rurality measurements at the national, regional, and divisional level, as defined by the US Census Bureau. Geographic information systems were used to visually illustrate temporal, spatial, and regional variability.
Results: Overall, Spearman’s rank correlations among the five measures ranged from 0.521 (percent urban–urban influence code) to 0.917 (rural–urban continuum code–urban influence code). Notable discrepancies existed in these associations by Census region and by division. The associations between measures of rurality and obesity in the 60+ population varied by rurality measure used and by region.
Conclusion: This study is among the first to systematically assess the spatial, temporal, and regional differences and similarities among five commonly used measures of rurality in the US. There are important, quantifiable distinctions in defining what it means to be a rural county depending on both the geographic region and the measurement used. These findings highlight the importance of developing and selecting an appropriate rurality metric in health research.
Introduction
Rural–urban health disparities in all aspects of health and health care have been realized for several decades, yet the causes, scope, and magnitude of these disparities continue to pose challenges for researchers and policymakers. The environmental, socio-political, cultural, economic, and demographic characteristics of rural America are, in many ways, vastly different from those of urban and suburban areas and present a unique set of circumstances that have implications far beyond research and policy. Understanding the full scope of rural–urban disparities and designing policies, programs, and interventions meant to address them are matters of national priority to ensure health and health care equity for the entire population.
Rural–Urban Health Disparities
Numerous examples highlight rural–urban health inequalities, including disparities in chronic conditions, health behaviors, and health outcomes. Obesity is a primary contributor to numerous health consequences, but the distribution of obesity is not uniform throughout the US (1). Rural residents are more likely to be obese than their urban counterparts and are also more likely to have chronic diseases related to obesity, such as hypertension and diabetes (2, 3). Compared to their urban counterparts, they are also less likely to engage in protective health behaviors such as increased physical activity and fruit and vegetable consumption (4, 5). This increased prevalence of chronic diseases and decreased likelihood of healthy behaviors are compounded by the fact that rural residents are also less likely to use preventive health services (6).
Rural–urban health disparities are particularly problematic in older adults. Rural older adults, similar to the general rural population, are less likely to visit general practitioners, specialists, and dentists compared to urban residents (6, 7). Furthermore, rural older adults have a higher prevalence of certain chronic disorders when compared to their urban counterparts, even after controlling for other sociodemographic characteristics (8). This, along with a decreased likelihood to visit a physician particularly among older adults, likely leads to the overall poorer health status observed among older rural residents. When compared to their urban counterparts, rural older adults have poorer health status as measured by physical, role, and social functioning, mental health, and health perception (9). Subsequent studies have also found rural–urban differences in the health of cancer survivors (10–12) and overall quality of life in veterans (13, 14) among many others.
Distinct rural–urban patterns were also observed in other aspects of health services utilization in older adults, including use and cost of chiropractic care (15) and medical care for treatment of lower back problems (16). Rural–urban gradients have been observed for preventive health behaviors as well. A recent study showed that as rurality increased, the rate of mammography and colorectal cancer decreased monotonically (17, 18). A related example is the receipt of informal family caregiving to allow older adults to successfully remain in their homes and prevent costly institutionalization that is often harmful to older adults’ well-being and quality of life. Rural informal caregivers to older adults reported worse health and reduced preventive health behaviors than their urban counterparts (19).
Challenges in Measuring “Rurality”
There is increasing interest among health researchers and policymakers in the community characteristics, such as rurality, that potentially influence health (7, 10–19). Despite the vast use of rurality as an important contextual predictor of differential health outcomes and health services utilization, a common thread in all of these studies is the lack of a universal measure of rurality itself. A wide array of measures exists, each with its own strengths and drawbacks. These include population density, US Census-designated rural and urban status, metropolitan areas, urban influence codes (UICs), rural–urban continuum codes (RUCCs), and Rural-Urban Commuting Area Codes (20). Many of these measures are defined primarily by one or two such community characteristics, like commuting time or influence of nearby urban areas. Some of these measures are continuous measures, while others are dichotomous or ordinal. All have been used in studies of health and medicine to some degree, but there is no consensus on an ideal measure. Furthermore, recent social science research suggests that what defines “rural” or “urban” is context specific (21).
This lack of a universal measure of rurality is manifested in two distinct, but interrelated, ways: finding the optimal geographic unit on which to assess rurality and finding the specific set of characteristics that define rurality. When researchers select an appropriate geographic unit on which to measure rurality, several choices exist, including state, county, zip code, census tract, etc. Each of these, however, has its own benefits and drawbacks (22–24). The central focus of this paper, however, addresses the second challenge: how to measure “rurality” itself and what effect using different measures of rurality will have on assessing health disparities in older adults. While rural–urban gradients in resources and health indicators are well-documented, comparatively little inquiry has been done into how rurality is actually defined and measured, (25, 26) particularly in assessing population characteristics that distinguish rural areas from urban areas (27).
Objectives
To address this challenge, in this study, we systematically assess the spatial, temporal, and regional differences and similarities among five commonly used measures of rurality in studies of population health in the US. The objectives of this study are: (1) to spatiotemporally describe, compare, and contrast five common measures of rurality among US counties; (2) to assess the internal agreement among the measures for US counties at the regional, divisional, and metropolitan area levels; and (3) to investigate how the prevalence of obesity in the population aged 60+ correlates with rurality for each of the five measures of rurality at the regional and divisional level. We will highlight several key findings of this analysis and its applications for future health research in the development and use of rurality measures.
Materials and Methods
Data
To conduct the analysis, data from several sources were first merged to form one large database of county characteristics. Rurality measurements were obtained from the 2010 US Decennial Census and the 1993 and 2003 US Department of Agriculture’s (USDA’s) Economic Research Service. County-level measurements of body mass index (BMI) were abstracted using the 2010 Behavioral Risk Factor Surveillance System (BRFSS) in the population aged 60 years and above. Respondents were classified as “obese” if their BMI were 30 kg/m2 or above.
Measures
Details of the rurality measures are found in Table 1. Four of the most common measurements of rurality were used in this analysis, based on prior literature. Two measures commonly addressed in health research on rurality from the USDA were used: the RUCC (28–31) and the UIC (30–35). For both of these measures, counties are first designated as metropolitan or non-metropolitan, as defined by the federal Office of Management and Budget. “Metropolitan” is often equated with urban areas, while “non-metropolitan” usually refers to more-rural areas. In 2013, there were 1,167 metropolitan and 1,976 non-metropolitan counties in the US. After that designation, the RUCC gives counties a code based on their metropolitan or non-metropolitan status, as well as on population size and adjacency to a metropolitan area, resulting in a nine-part classification (36). Similarly, the UIC forms a classification scheme that also distinguishes metropolitan counties by population size of their metro area, and non-metropolitan counties’ proximity to metro and micropolitan areas and population size of an encompassed city/town, resulting in a 12-part classification (37).According to the USDA, both measures allow researchers to break county data into finer residential groups, beyond metro and non-metro, particularly for the analysis of trends related to population density and metro influence (36, 37). Two of the other most commonly used measures of rurality in the medial literature were abstracted from the 2010 US Census: population density (38) and percent urban population (39). The US Census Bureau identifies and defines two types of urban areas. First, “urbanized areas” are those that contain a population of 50,000 or more. “Urban clusters” have between 2,500 and 50,000 people. In the US, there are 486 urbanized areas and 3,087 urban clusters (27).
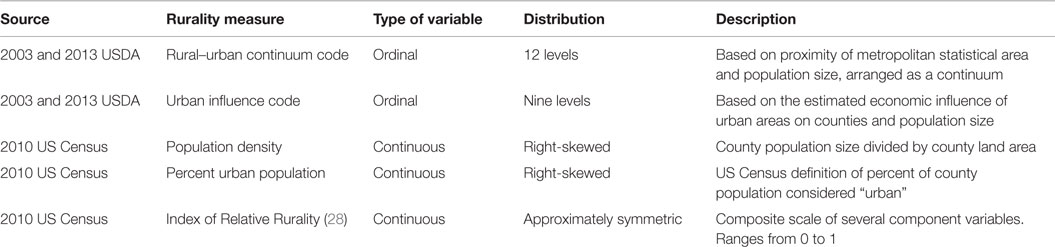
Table 1. Five measures of rurality used in the analysis, sources, and number of levels.
An additional rurality variable was used in this analysis. Unlike the UIC and RUCC, the index of relative rurality (IRR) (40) does not take into account metro boundaries, but instead uses a set of established dimensions of rural–urban characteristics: population, population density, extent of urbanized area, and distance to the nearest metro area. Individually, these measures have been incorporated into many other measures of rurality. The IRR is scaled from 0 to 1, with 0 representing the most urban place and 1 representing the most rural area. However, for the sake of consistency among measures in this analysis, coding was reversed, with 1 indicating the most urban and 0 indicating the most rural.
Statistical Analysis
The univariate distributions and frequencies were obtained separately for each of the five rurality measures. For the first objective – spatiotemporally describe, compare, and contrast five common measures of rurality among US counties – a bivariate analysis was conducted using Spearman’s rank correlation coefficients between each pair of measurements. Spearman’s rank correlation coefficients were used because all of the five measures incorporated are either continuous or ordinal ranked data with at least nine possible values. This analytical tool can handle assessing potential monotonic associations between pairs of variables that are skewed, ranked, and continuous variables that have a high percentage of the same value (ties) (e.g., percent urban). Descriptive geographic information systems mapping was also used to visually assess the overall spatial and temporal patterns of rurality using each of the five measures.
For the second objective – assess the internal agreement among different rurality measures based on the geographic level of analysis – again, a bivariate analysis was conducted using Spearman’s rank correlation coefficients by Census-designated regions and divisions of the US. Furthermore, an identical correlational analysis was conducted on the Richmond, VA, area to examine the internal consistency among the five measures on a metropolitan area, defined as all counties in which at least 25% of the county land area lies within 40 miles of Richmond city centroid. Surrounding counties were included for analysis if at least 25% of their area were contained within a 50-mile radius of the city.
For the third and final objective – investigate how the prevalence of obesity in the 60+ population correlates with rurality for each of the five measures of rurality at the regional and divisional level – Spearman correlations were examined between percent obese (BMI ≥ 30) in the older population and each of the five rurality measurements. The analysis was conducted nationally and for each Census-designated region and division described in the previous objective. SAS version 9.3 (Cary, NC) was used for all modeling, and ArcMap version 10.1 (Redlands, CA, USA) was used for mapping.
Results
Spatiotemporal Consistency of Rurality Measurement
The five measures of rurality also varied by statistical and geographic distributions (Figures 1A–E). Population density had an approximately log-normal distribution, and the IRR had a fairly symmetric distribution. The UIC was somewhat uniformly distributed, except at the urban end of the distribution, where higher frequencies were observed. The RUCC also had a nearly uniform distribution. Percent urban had a mixed distribution in which 701 (22.3%) of all US counties had a value of 0 for percent urban, with a generally uniform distribution otherwise. Geographically, the distributions of each of the rurality measures were somewhat similar to each other, with several exceptions. Urban clusters identified by UIC and RUCC tended to be larger than those identified by other measures. Also, urban clusters identified by those two measures appeared as “plateaus” on the maps, indicating that urban areas tended to be broader and more uniformly urban than those urban areas identified by population density, percent urban, and the IRR.
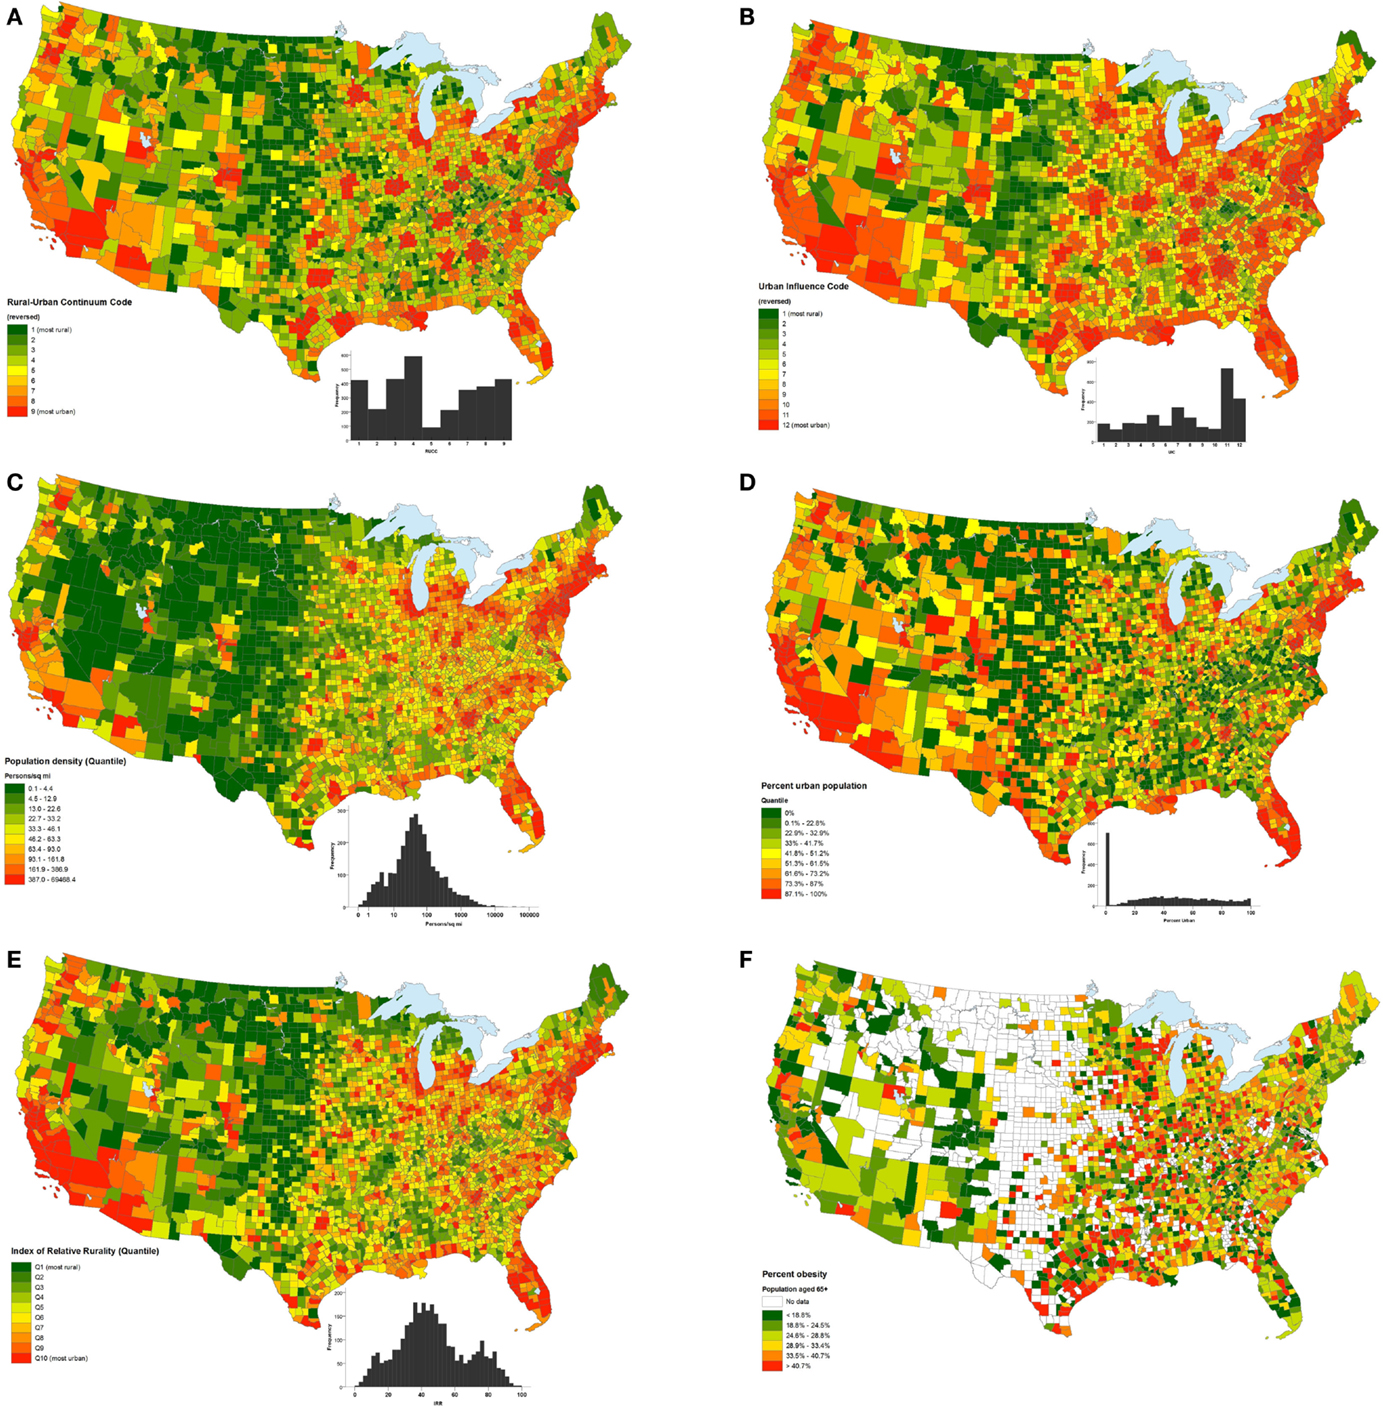
Figure 1. Geographic distributions by county of rural–urban continuum code (A), urban influence code (B), population density (C), percent urban population (D), Index of Relative Rurality (E), and percent of the 60+ population that is obese (F).
Over time, the spatial distribution of the RUCC remained fairly stable. From 2003 to 2013, 2.653 (85.3%) counties had no change in status based on this variable, 323 (10.4%) became more urban, and 133 counties (4.3%) became more rural, according to the RUCC (Figure 2A). For the UIC, most counties (2,545) did not incur a change in rural–urban designation between 2003 and 2013. Similar to the RUCC, 177 (5.7%) became more rural in that time period, according to the UIC, while 387 (12.4%) became more urban (Figure 2B).
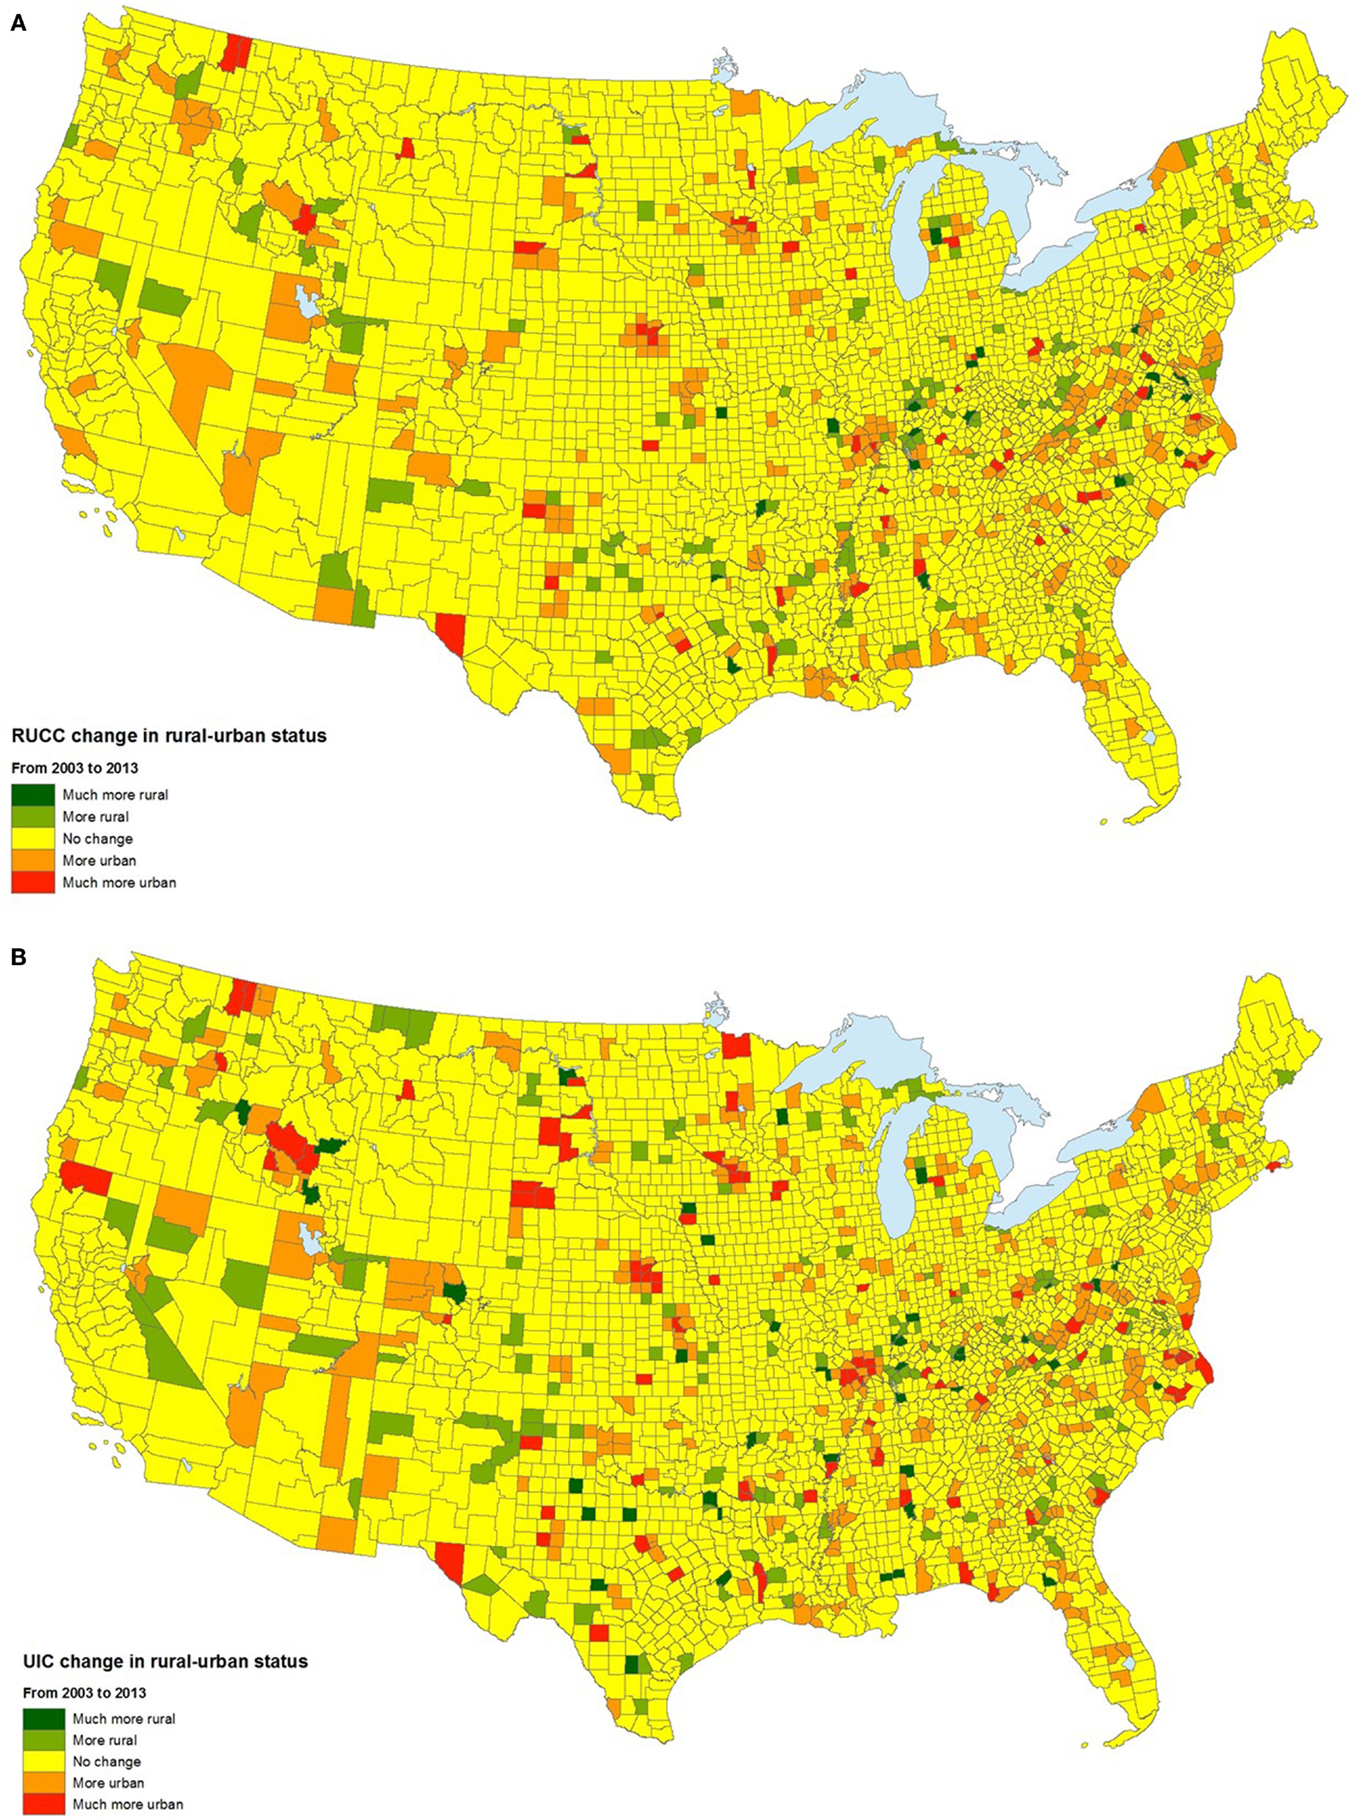
Figure 2. Temporal changes in the rural–urban continuum code (A) and urban influence code (B), 2003–2013.
Percent urban population was least geographically consistent with the other four measures (Figure 3). Generally, counties with higher-percent urban populations were more densely populated, but there were notable exceptions. For instance, in some counties with one or two small cities, percent urban variable was unexpectedly large given a low population density. An example of this includes Reagan County, TX, (noted on figure) with an urban population or 87.1% (90th percentile) and a population density of only 2.9 people per square mile (7th percentile). Other counties have relatively high population densities despite having low urban populations. For example, Mathews County, VA, has an urban population of 0% and a population density of 104.5 people per square mile (73rd percentile).
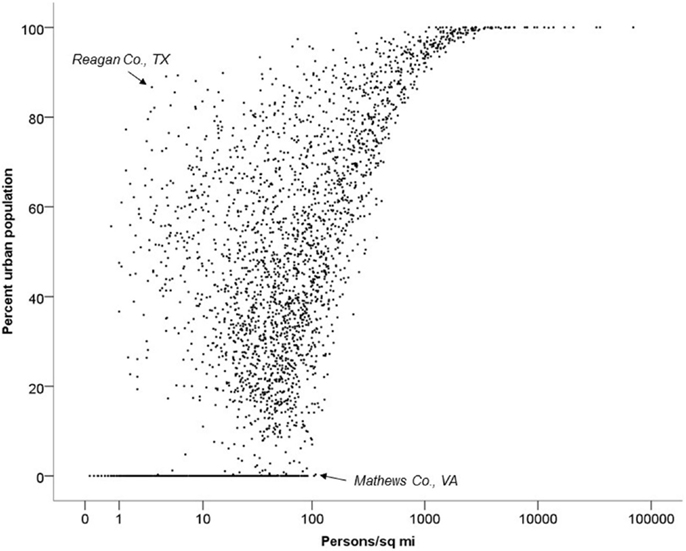
Figure 3. Association between percent urban population and population density in 2010.
Rurality at the Regional, Divisional, and Metropolitan Levels
The correlations among each of the rurality measures differed from the correlations observed at the national level (Table 2) and varied by region (Table 3) and division (Table 4). On the national level, correlations between pairs of rurality measurements were moderate to strong. The correlation between the RUCC and UIC was 0.917, while the correlation between the UIC and percent urban was just 0.521. Similar variability in the level of correlation among the five measures of rurality occurred on the regional level. The correlations between population density and percent urban varied by region. For the entire US, the correlation between these two measures was 0.659, but this correlation for the Northeast, Midwest, South, and West Regions was 0.939, 0.739, 0.658, and 0.788, respectively. At the division level, larger differences in correlation between some measures occurred. For example, the correlation between the UIC and percent urban ranged from only 0.384 in the West South Central Division to 0.802 in the Pacific Division. However, correlations between other measures remained relatively consistent between divisions. For instance, the correlation between IRR and population density remained relatively strong, ranging from 0.811 in the West South Central Division to 0.966 in the Middle Atlantic Division.
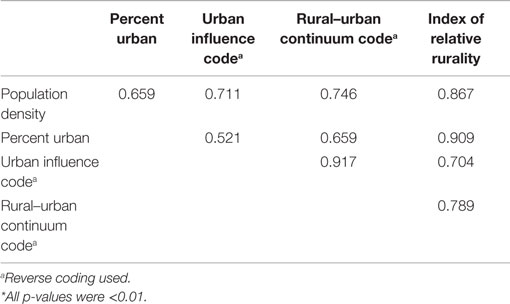
Table 2. Spearman’s rank correlation coefficients for five measures of rurality*.
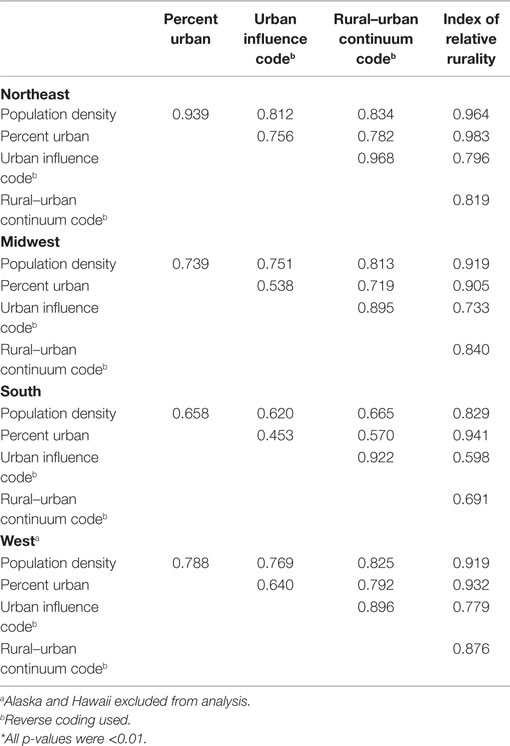
Table 3. Spearman’s rank correlation coefficients for five measures of rurality at the Regional level*.
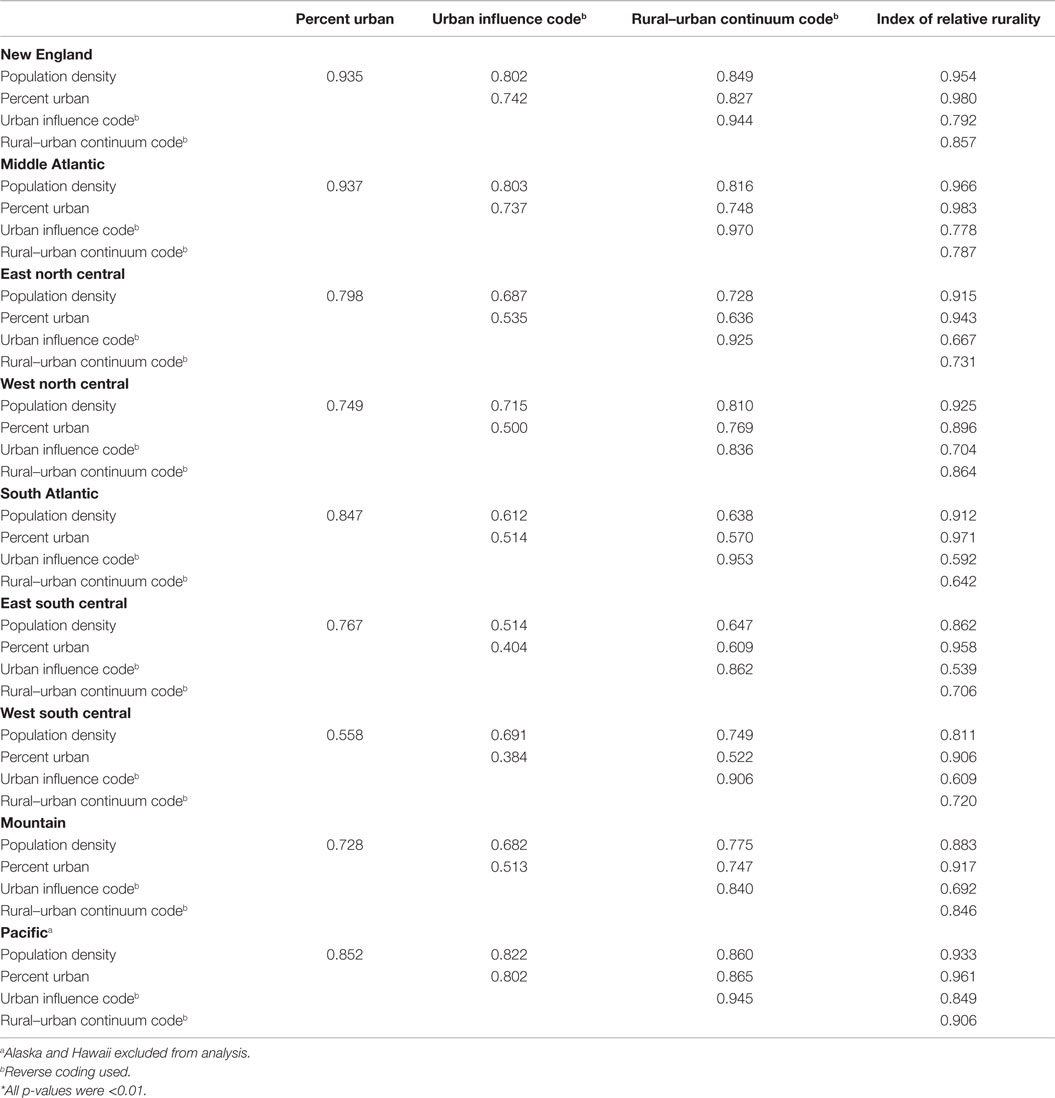
Table 4. Spearman’s rank correlation coefficients for five measures of rurality at the Divisional level*.
In the Richmond, VA, USA, metropolitan area, 74% of the 49 counties within 50 miles of Richmond were considered metropolitan (“in metro areas of 1 million or more residents”) in both the UIC and the RUCC (Figure 4). Within this region, there were notable discrepancies among the five measures of rurality. For instance, 4 of the 13 Richmond-area counties with a 0% urban population were considered the most urban, according to the UIC. Nearly half (15) of the 31 counties classified as “most rural,” according to the UIC, had urban populations of at least 60%. Spearman correlations between pairs of measures were similar to those of the Census divisions. The highest correlation occurred between the RUCC and UIC (0.989), while the weakest correlation was observed between percent urban and UIC (0.544).
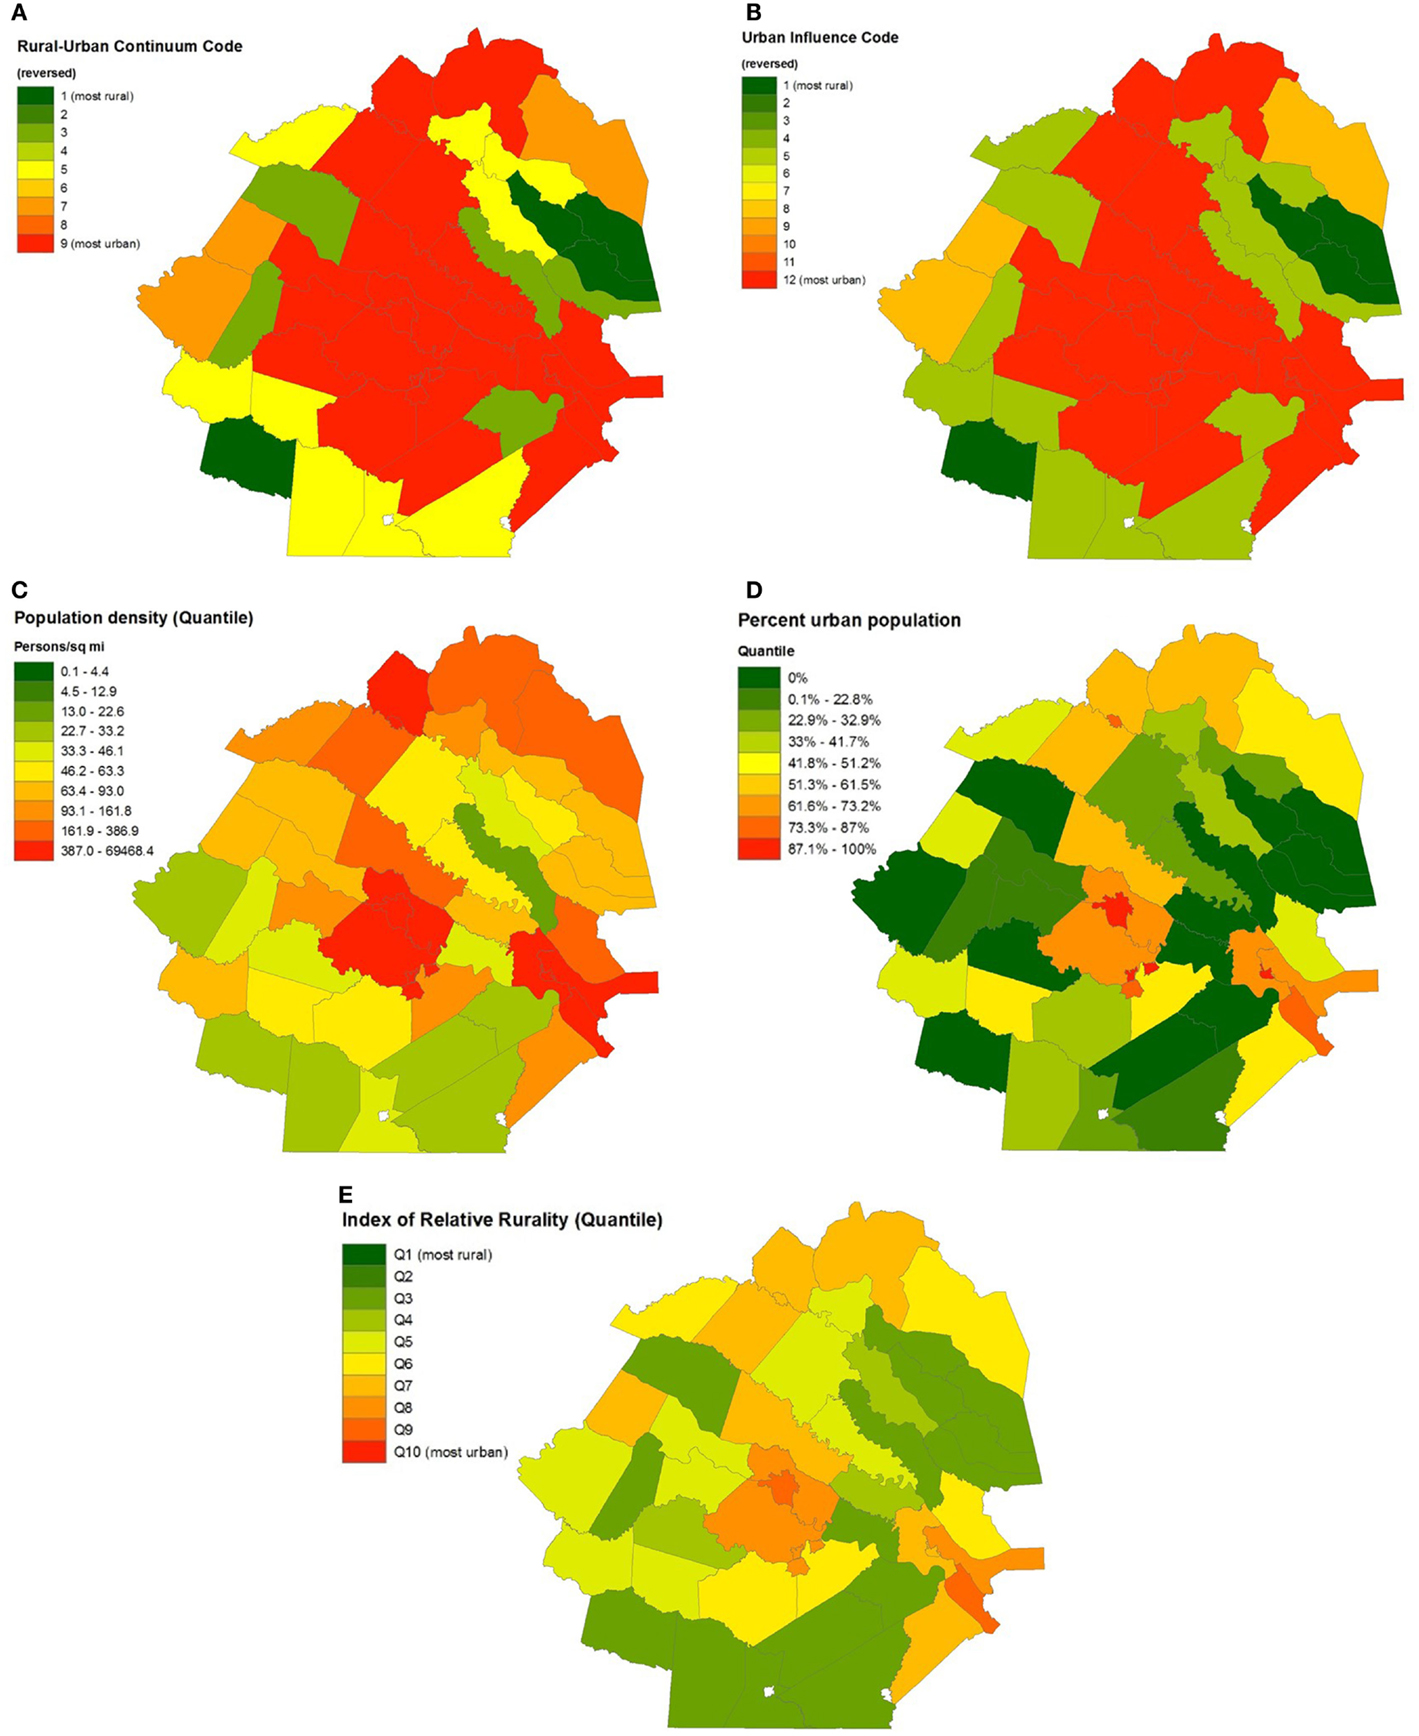
Figure 4. Geographic distributions of urban influence code (A), rural–urban continuum code (B), percent urban population (C), population density (D), and Index of Relative Rurality (E) in Richmond, VA, USA.
Application: Five Rurality Measures and Obesity
The spatial distribution of obesity in the population aged 60 and above by county is found in Figure 1F. Spearman correlations between percent obese and rurality (Table 5) are generally weak, but vary by geographic level and individual measure of rurality. For the entire US, percent obesity prevalence was associated with percent urban population (rho = −0.044, p = 0.034), but was not significantly associated with any of the other four rurality measures. On the regional level, obesity was negatively and significantly associated with four of the five measures (all but UIC) of rurality in the Northeast, while obesity was positively and significantly associated with four of the five rurality measures (all but population density) in the West. Notable variability in the obesity–rurality association occurred among divisions in the same region. For instance, obesity was significantly and negatively associated with all five measures of rurality in the Middle Atlantic Division states, but not significantly associated with any rurality measure in the New England Division. In the South Region, none of the rurality measures were significantly associated with obesity prevalence if you look at the region as a whole. However, in the South Atlantic Division within the South Region, obesity prevalence was significantly and positively associated with population density (rho = −0.122, p < 0.01), but not any of the other four rurality measures. In the West South Central Division, only IRR was associated with obesity prevalence, and the association was positive (rho = 0.160, p < 0.001).
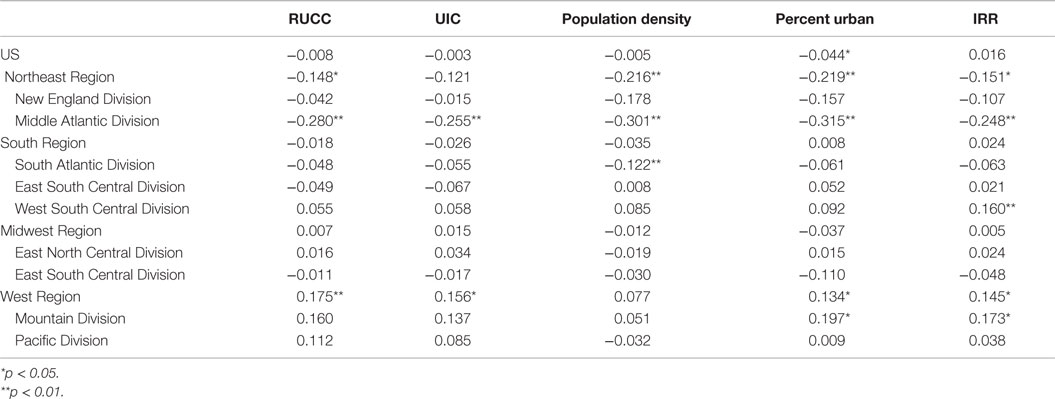
Table 5. Spearman’s rank correlation coefficients for obesity five measures of rurality for the entire US, and by Census Region and Division.
Discussion
The internal agreement between rurality measures varied widely based on geographic location. For instance, population density and percent urban were strongly correlated in the Northeast Region (r = 0.939) and less correlated in the South Region (r = 0.658). Likewise, at the divisional level, the East South Central and South Atlantic Divisions consistently showed some of the lowest internal agreements among all measures, while the New England and Middle Atlantic regions consistently showed some of the highest internal agreements among measures.
The picture of varying strength of internal agreement among measures based on geographic location becomes clearer as a “snapshot” is taken at the city level. For instance, when comparing the counties surrounding the city of Richmond (South Region, South Atlantic Division) with those surrounding Providence (Northeast Region, New England Division) in terms of the UIC and RUCC, it would appear that these cities are similar. In both cities, more than 89% of counties have both a UIC value and a RUCC value, indicating that they are metropolitan in nature. However, upon comparing percentage urban and population density, it becomes apparent that these two cities are quite different. The counties surrounding Providence consistently tended to display characteristics indicative of an urban setting in addition to the UIC and RUCC, with median values for population density, percent urban, and IRR all above the 90th percentile for the entire US. For example, the median population density of the Providence area was 985 people per square mile (95th percentile), and the median percent urban was 90.0% (92nd percentile). However, in Richmond, the additional measures tell a different story from that of the UIC and RUCC, one with a greater degree of rurality. The median population density and percent urban was only 58.2 people per square mile (57th percentile) and 17% (27th percentile), respectively, showing that the surrounding counties are likely more rural than the UIC and RUCC codes would indicate.
Of all the measures, the one that consistently appeared to demonstrate a truer picture of rurality across cities was the IRR. Richmond had IRR values close to the median value for the entire country. These results are more consistent with what one would anticipate when treating rurality as multi-dimensional, as does the IRR. These varying degrees of consistency across measures dependent on geographic location highlight the importance of not only considering which measure to use based on the specific research question, but also on the geographic location in which the analysis is taking place. While all five measures seem to have relatively strong and consistent internal agreement in New England and the Northeast, the comparatively weak internal agreement seen particularly in the Southern portion of the US highlights the need to think more closely about which measure to use in the event analysis is concentrated in one region of the US. These observations are illustrative of non-stationarity across space, which is tied to “local” spatial analysis in other studies of rural–urban health inequities.
The above-mentioned pitfalls are important to consider and are further exemplified by the observed agreement between each of the measures and a health outcome that has been shown to have a well-established link to an individual’s rural–urban living status. It has been well-documented that rural residence is associated with an increased prevalence of obesity, yet there has been a lack of consistency between studies when measuring rurality. Our findings, in particular, exhibit how the associations between rurality and health outcomes in older adults with an established rural–urban disparity and can vary based on the measure used to assess rurality and the geographic location and level at which analysis is performed.
As observed with the agreement between rurality measures, the observed relationship between obesity and rurality varies depending not only on the rurality measure used, but also on the geographic location. Furthermore, as observed, the decision to use one rurality measure over another could have a substantial impact on observed relationships. The fact that the obesity–rurality relationship varied by both the rurality measurement used and the geographic location suggests that the concepts of “rural” and “urban” are both multi-dimensional, and their impact on health varies by location. These concepts are described further in the sociological literature.
Several important limitations of this analysis need to be considered. First, the analysis was conducted on the county level, largely due to the availability of data at that geographic level. Therefore, it was not possible to compare the five measures within counties, despite the potential for counties, especially ones encompassing a large geographic area, to be heterogeneous with respect to rurality. In addition, counties are not consistent in terms of both size and function from state to state. Enormous heterogeneity exists in the size of counties across the US, with west of the Mississippi on average far larger, and the range of size variation can be as high as 10,000-fold. Consider the example used in this study of the Richmond, VA, metropolitan area. In Virginia, major cities of varying population size are themselves considered equivalent to counties and are independent of nearby counties. Richmond, for example, is an independent city and is not incorporated into any other county in the state. The same holds true for even smaller cities in Virginia. However, in many other states, such as the northeastern ones, cities are located within counties that often contain other cities and towns. Therefore, in a state such as Virginia, small independent cities that contain relatively small populations are considered statistically “equivalent” to comparatively much more heavily populated and geographically larger counties in other areas of the country that include many cities and towns of varying population sizes.
The analysis is subject to two statistical limitations as well. First, no geospatial analysis was performed; each county was treated as an independent unit of observation in this analysis. Counties in closer proximity are more likely to share sociodemographic and cultural characteristics than counties that are further apart. Spatial dependence may account for some of the observed associations (41) and can be addressed in future studies. Compounding this issue is that many of the rurality measures themselves are dependent upon nearby characteristics, such as proximity to nearest metropolitan or urbanized area (e.g., RUCC, UIC, and IRR). The impact of rurality on health may, therefore, be much greater in highly rural areas near an urbanized area, compared to similar rural areas that are hundreds of miles from the nearest urbanized area. This disparity in distance from urbanized areas may explain some of the regional and divisional inconsistencies among the five measures. Second, only monotonic associations could be observed using the Spearman correlations in this study. In other words, non-monotonic associations, such as a J-shaped or a U-shaped association between rurality and obesity, might result in a weak or null association when simply examining the rank correlation as was done in this study. Lastly, another important limitation to consider is that only one health outcome – obesity – was assessed. Future research could examine how each of these measurements distinctly and perhaps uniquely influences different aspects of population health metrics and could examine potential non-linear associations between health and rurality.
Despite these limitations, this study is among the first such analysis to systematically assess the spatial, temporal, and regional differences and similarities among five commonly used measures of rurality in studies of population health in the US. There are important, quantifiable distinctions in defining what it means to be a rural county depending on both the geographic region and the measurement used. The findings of this analysis underscore the importance of developing and selecting an appropriate rurality metric in health research and represent an important first step in understanding the similarities and differences among rurality measurements available to health researchers.
Author Contributions
SC conceived the project, wrote the initial draft of the manuscript, and conducted part of the data analysis. LK created maps, provided editorial comments, and assisted with data visualization. AB wrote subsequent versions of this manuscript and assisted with the regional analysis.
Conflict of Interest Statement
The authors declare that the research was conducted in the absence of any commercial or financial relationships that could be construed as a potential conflict of interest.
Funding
This work was supported by the Department of Family Medicine and Population Health at the Virginia Commonwealth University School of Medicine for financial support to conduct this analysis. This research received no specific grant from any funding agency in the public, commercial, or not-for-profit sectors.
References
1. Li C, Balluz LS, Okoro CA, Strine TW, Lin JM, Town M, et al. Centers for disease control and prevention (CDC). Surveillance of certain health behaviors and conditions among states and selected local areas – behavioral risk factor surveillance system, United States, 2009. MMWR Surveill Summ (2011) 60(9):1–250.
2. Patterson PD, Moore CG, Probst JC, Shinogle JA. Obesity and physical inactivity in rural America. J Rural Health (2004) 20(2):151–9. doi:10.1111/j.1748-0361.2004.tb00022.x
3. Krishna S, Gillespie KN, Mcbride TM. Diabetes burden and access to preventive care in the rural United States. J Rural Health (2010) 26(1):3–11. doi:10.1111/j.1748-0361.2009.00259.x
4. Parks SE, Housemann RA, Brownson RC. Differential correlates of physical activity in urban and rural adults of various socioeconomic backgrounds in the United States. J Epidemiol Community Health (2003) 57(1):29–35. doi:10.1136/jech.57.1.29
5. Michimi A, Wimberly MC. Associations of supermarket accessibility with obesity and fruit and vegetable consumption in the conterminous United States. Int J Health Geogr (2010) 9:49. doi:10.1186/1476-072X-9-49
6. Casey MM, Thiede call K, Klingner JM. Are rural residents less likely to obtain recommended preventive healthcare services? Am J Prev Med (2001) 21(3):182–8. doi:10.1016/S0749-3797(01)00349-X
7. Zhang P, Tao G, Irwin KL. Utilization of preventive medical services in the United States: a comparison between rural and urban populations. J Rural Health (2000) 16(4):349–56. doi:10.1111/j.1748-0361.2000.tb00485.x
8. Kumar V, Acanfora M, Hennessy CH, Kalache A. Health status of the rural elderly. J Rural Health (2001) 17(4):328–31. doi:10.1111/j.1748-0361.2001.tb00282.x
9. Yen IH, Michael YL, Perdue L. Neighborhood environment in studies of health of older adults: a systematic review. Am J Prev Med (2009) 37(5):455–63. doi:10.1016/j.amepre.2009.06.022
10. Weaver KE, Geiger AM, Lu L, Case LD. Rural-urban disparities in health status among US cancer survivors. Cancer (2013) 19:1050–7. doi:10.1002/cncr.27840
11. Weaver KE, Palmer N, Lu L, Case LD, Geiger AM. Rural-urban differences in health behaviors and implications for health status among US cancer survivors. Cancer Causes Control (2013) 24:1491–1490. doi:10.1007/s10552-013-0225-x
12. Singh GK. Rural-urban trends and patterns in cervical cancer mortality, incidence, stage, and survival in the United States, 1950-2008. J Community Health (2012) 37:217–23. doi:10.1007/s10900-011-9439-6
13. Wallace AE, Lee R, Mackenzie TA, West AN, Wright S, Booth BM, et al. A longitudinal analysis of rural and urban Veterans’ health-related quality of life. J Rural Health (2010) 26:156–63. doi:10.1111/j.1748-0361.2010.00277.x
14. Weeks WB, Wallace AE, Wang S, Lee A, Kazis LE. Rural-urban disparities in health-related quality of life within disease categories of Veterans. J Rural Health (2006) 22:204–11. doi:10.1111/j.1748-0361.2006.00033.x
15. Stevans JM, Zodet MW. Clinical, demographic, and geographic determinants of variation in chiropractic episodes of care for adults using the 2005-2008 medical expenditure panel survey. J Manipulative Physiol Ther (2012) 35:589–99. doi:10.1016/j.jmpt.2012.09.009
16. Goode AP, Freburger JK, Carey TS. The influence of rural versus urban residence on utilization and receipt of care for chronic low back pain. J Rural Health (2013) 29:205–14. doi:10.1111/j.1748-0361.2012.00436.x
17. Fan L, Mohile S, Zhang N, Fiscella K, Noyes K. Self-reported cancer screening among elderly medicare beneficiaries: a rural-urban comparison. J Rural Health (2012) 28:312–9. doi:10.1111/j.1748-0361.2012.00405.x
18. Butler DC, Petterson S, Phillips RL, Bazemore AW. Measures of social deprivation that predict health care access and need within a rational area of primary care service delivery. Health Serv Res (2013) 48:539–59. doi:10.1111/j.1475-6773.2012.01449.x
19. Do EK, Cohen SA, Brown MJ. Socioeconomic and demographic factors modify the association between informal caregiving and health in the sandwich generation. BMC Public Health (2014) 14:362. doi:10.1186/1471-2458-14-362
20. Hart LG, Larson EH, Lishner DM. Rural definitions for health policy and research. Am J Public Health (2005) 95:1149–55. doi:10.2105/AJPH.2004.042432
21. Matthews AM. Variations in the conceptualization and measurement of rurality-conflicting findings on the elderly widowed. J Rural Stud (1988) 4:141–50. doi:10.1016/0743-0167(88)90032-0
22. Krieger N, Chen JT, Waterman PD, Soobader MJ, Subramanian SV, Carson R. Geocoding and monitoring of US socioeconomic inequalities in mortality and cancer incidence: does the choice of area-based measure and geographic level matter?: the public health disparities geocoding project. Am J Epidemiol (2002) 156(5):471–82. doi:10.1093/aje/kwf068
23. Soobader M, LeClere FB, Hadden W, Maury B. Using aggregate geographic data to proxy individual socioeconomic status: does size matter? Am J Public Health (2001) 91(4):632–6. doi:10.2105/AJPH.91.4.632
24. Ingram DD, Franco SJ. NCHS urban-rural classification scheme for counties. Vital Health Stat (2012) 2:1–65.
25. Isserman AM. In the national interest: defining rural and urban correctly in research and public policy. Int Reg Sci Rev (2005) 4:465–99. doi:10.1177/0160017605279000
26. Ricketts TC, Johnson-Webb KD. What is “rural” and how to measure “rurality”: a focus on health care delivery and health policy. Technical Issues Paper Prepared for the Federal Office of Rural Health Policy, Chapel Hill, NC: North Carolina Rural Health Research and Piolicy Analysis Center, Cecil G. Sheps Center for Health Services Research (1996).
27. United States Census Bureau. Growth in Urban Population Outpaces Rest of Nation, Census Bureau Reports. (2012). Available from: http://www.census.gov/newsroom/releases/archives/2010_census/cb12-50.html. Accessed August 17, 2015
28. Jenkins WD, Rabins C, Bhattacharya D. Importance of physicians in chlamydia trachomatis control. Prev Med (2011) 53(4–5):335–7. doi:10.1016/j.ypmed.2011.08.022
29. Nance ML, Carr BG, Kallan MJ, Branas CC, Wiebe DJ. Variation in pediatric and adolescent firearm mortality rates in rural and urban US counties. Pediatrics (2010) 125(6):1112–8. doi:10.1542/peds.2009-3219
30. Langlois PH, Jandle L, Scheuerle A, Horel SA, Carozza SE. Occurrence of conotruncal heart birth defects in Texas: a comparison of urban/rural classifications. J Rural Health (2010) 26(2):164–74. doi:10.1111/j.1748-0361.2010.00278.x
31. Hawley ST, Chang S, Risser D, Zhang Q. Colorectal cancer incidence and mortality in Texas 1990-1992: a comparison of rural classifications. J Rural Health (2002) 18(4):536–46. doi:10.1111/j.1748-0361.2002.tb00920.x
32. Bjurlin MA, Zhao LC, Goble SM, Hollowell CM. Race and insurance status are risk factors for orchiectomy due to testicular trauma. J Urol (2012) 187(3):931–5. doi:10.1016/j.juro.2011.10.152
33. Chevarley FM, Owens PL, Zodet MW, Simpson LA, Mccormick MC, Dougherty D. Health care for children and youth in the United States: annual report on patterns of coverage, utilization, quality, and expenditures by a county level of urban influence. Ambul Pediatr (2006) 6(5):241–64. doi:10.1016/j.ambp.2006.06.004
34. Thorpe JM, Van houtven CH, Sleath BL, Thorpe CT. Rural-urban differences in preventable hospitalizations among community-dwelling veterans with dementia. J Rural Health (2010) 26(2):146–55. doi:10.1111/j.1748-0361.2010.00276.x
35. Langlois PH, Scheuerle A, Horel SA, Carozza SE. Urban versus rural residence and occurrence of septal heart defects in Texas. Birth Defects Res Part A Clin Mol Teratol (2009) 85(9):764–72. doi:10.1002/bdra.20586
36. United States Department of Agriculture. Rural-Urban Continuum Codes. (2013). Available from: http://www.ers.usda.gov/data-products/rural-urban-continuum-codes.aspx#.UqH3heIsyNd. Accessed July 22, 2015
37. United States Department of Agriculture. Urban Influence Codes. (2013). Available from: http://www.ers.usda.gov/data-products/urban-influence-codes.aspx#.UqH4juIsyNc. Accessed July 24, 2015
38. Naumova EN, Parisi SM, Castronovo D, Pandita M, Wenger J, Minihan P. Pneumonia and influenza hospitalizations in elderly people with dementia. J Am Geriatr Soc (2009) 57(12):2192–9. doi:10.1111/j.1532-5415.2009.02565.x
39. Goins RT, Mitchell J. Health-related quality of life: does rurality matter? J Rural Health (1999) 15(2):147–56. doi:10.1111/j.1748-0361.1999.tb00734.x
40. Waldorf B. Measuring Rurality. (2007). Available from: http://www.incontext.indiana.edu/2007/january/articles/2_rurality.pdf. Accessed May 29, 2015
Keywords: rural health, obesity, methods development, elderly population, comparison of methods
Citation: Cohen SA, Kelley L and Bell AE (2015) Spatiotemporal Discordance in Five Common Measures of Rurality for US Counties and Applications for Health Disparities Research in Older Adults. Front. Public Health 3:267. doi: 10.3389/fpubh.2015.00267
Received: 02 October 2015; Accepted: 10 November 2015;
Published: 25 November 2015
Edited by:
Martine Hackett, Hofstra University, USAReviewed by:
Kate E. Beatty, East Tennessee State University, USAPeter D. Baade, Cancer Council Queensland, Australia
Copyright: © 2015 Cohen, Kelley and Bell. This is an open-access article distributed under the terms of the Creative Commons Attribution License (CC BY). The use, distribution or reproduction in other forums is permitted, provided the original author(s) or licensor are credited and that the original publication in this journal is cited, in accordance with accepted academic practice. No use, distribution or reproduction is permitted which does not comply with these terms.
*Correspondence: Steven A. Cohen, steven.cohen@vcuhealth.org