 Kyriakos Souliotis
 Manto Papageorgiou
 Anastasia Politi
 Athanasios Athanasiadis
- 1Department of Social and Education Policy, University of Peloponnese, Corinth, Greece
- 2Centre for Health Services Research, Medical School, University of Athens, Athens, Greece
- 3Department of Statistics, Athens University of Economics and Business, Athens, Greece
- 4Foundation for Economic and Industrial Research, Athens, Greece
Background: Affordable, accessible, and innovation-promoting pharmaceutical care is essential to the operation of a sustainable health system. External reference pricing (ERP), a common pharmaceutical policy in Europe, suffers today from indigenous weaknesses that may cause market distortions and barriers to care, burdening mostly the weak economies, and hence, raising ethical and political worrying.
Objectives and methods: A non-randomized experiment was conducted, in order to examine the influence of flexible and adaptable to health systems’ affordability ERP structures. Outcomes were assessed by measuring deviations from Greek prices’ level ex ante, as well as effects on pharmaceutical markets affiliated to the European ERP system.
Results and conclusion: Pharmaceutical pricing models that fit prices to income and affordability are better in all aspects, as they produce fairer results, while resulting in low external costs for the European ERP network as a whole. Small sets of reference countries are preferred to large baskets, as they produce similar results, while presenting better qualities by increasing the flexibility of the reimbursement system and the transparency of the market.
Introduction
The provision of affordable, accessible, and innovation-promoting pharmaceutical care services is an essential element of a sustainable health policy (1). In most European countries, the main purchaser of pharmaceuticals is the public sector (2), and in these quasi-monopsony conditions, national health services’ negotiating power is enhanced as to the determination of pharmaceutical prices. To this respect, the vast majority of European countries employ external reference pricing (ERP), a price-regulation method whereby a government considers the price of a medicine in a specified basket of countries in order to set its price (3). The application of ERP differs among countries, with regard to, e.g., basket size, basket composition, and re-referencing rates. Yet, a country’s ability to adjust medicinal prices to its income and affordability is limited due the method’s endogenous structural and functional characteristics.
External reference pricing is a univariate algebraic process that incorporates information solely on prices, not accounting for other key socioeconomic factors, e.g., health-care resources, health-care structure, and demographic patterns (4), in the equation. In addition, the use of extensive ERP baskets results in the increase of unmatched observations on currencies and medicinal properties (brand names, packaging, etc.), encumbering the computational process, as ad hoc studies illustrate (5–10). As a consequence, ERP’s sub-optimal design has a profound impact on health policies’ efficiency: it produces outcomes that present low adaptability to economies’ national income, increase market risks (e.g., arbitrage, medicine launch delays, slashed patent holders’ profitability and competitiveness, etc.), raising barriers to existing therapies and to innovation as well (2). Nevertheless, the use of large baskets of countries remains a common European practice, given that 12 European Union (EU-28) countries refer to a minimum of 15 countries (11)1.
Greece is a dynamic player of the European ERP system. The implementation of ERP pertains to all on-patent medicines sold in the country, directly affecting reimbursement. According to legislation, the prices of on-patent medicines are set as the average of the three lowest ex-factory prices in the EU-28. Any available price (e.g., ex-factory, wholesale, retail, hospital, insurance) is collected from official, published sources, and the necessary conversion of retail or wholesale to ex-factory price is made according to methodology and rates determined by the National Organization for Medicines (EOF) (12). Using ERP, pharmaceutical prices are reviewed (re-pricing) twice per year. Following each re-pricing, the Positive Reimbursement List is also reviewed, in order to update reimbursed prices accordingly. At the same time, Greece is included in the ERP basket of half of the EU-28 countries [14 out of 28 (3)] and is among the countries with the highest frequency of re-referencing (biannual) (2).
Since the beginning of the economic crisis in 2010, pharmaceutical expenditure has been placed in the center of fiscal consolidation and has become inextricably linked to the level of the continuously decreasing Greek gross domestic product (GDP) (13). In particular, according to the target set by the Memorandum, public pharmaceutical expenditure must not exceed 1% of GDP. For this reason, a number of cost-containment measures targeting the prices of pharmaceuticals, such as flat price reductions, the implementation of multiple rebates/discounts and ERP have been applied to obtain quick reductions in public pharmaceutical spending and thus achieve the fiscal targets. In this context, fitting flexible and unerring pharmaceutical pricing models that take into account national income and financial indicators is a matter of national necessity. The present study investigates new methodological pathways in the field of pharmaceutical pricing and reimbursement with aim to communicate additional evidence and inform health policy decision-making.
Methodological Design
Outline and Objectives
We examine a flexible and adaptable to the payer’s affordability ERP structure, applying a non-randomized experiment, with Greek pharmaceutical prices forming the basis of the performed comparisons. The study is based on the working hypothesis that the smaller the differential effects of interventions on Greek prices, the lower the pharmaceutical market risks, both internally and externally due to ERP’s spillover chain effects (6).
The analysis is conducted in two stages. The first stage examines the influence of small ERP baskets on the level of domestic pharmaceutical prices. The concept here is to remove procedural limitations, such as currency and price data incompatibility [as ex-factory, retail, and hospital prices can currently enter the system (14)], by using a concise, and thus, flexible ERP design. The second stage proposes the establishment of a simple model/procedure that adapts prices to the country’s affordability level. This approach is a counterproposal to the current, extraordinary, and flat pharmaceutical policy measures that are being implemented in an effort to reduce excessive spending, but disturb the normal functioning of the pharmaceutical market and health care after all (15).
Data Selection and Arrangement
The analysis is based on a non-random experimental design, where data selection focuses on major pharmaceutical demand areas and meets certain product homogeneity requirements. The Greek Positive Reimbursement List formed the sampling frame of the selected medicines. Medicines were sorted according to their annual market share and a sample of 24% of the List’s 50 top-selling medicines in 20122 (i.e., 12 out of 50) was taken. In addition, medicines were included in the analysis based on the following criteria: (1) identical properties (name, pharmaceutical form, content, packaging, and price type) among countries and (2) homogeneity of their prices’ measurement unit (ex-factory).
The selected experimental unit comprised a concise set of eight euro-zone members that practice ERP: Austria, France, Ireland, Italy, Portugal, Slovak Republic, Slovenia, and Spain. The group’s composition was assessed according to the specific financial, demographic, epidemiologic, and infrastructure criteria. Table 1 provides this information for Greece. Statistical properties for the ex-factory price variable (i.e., descriptive measures of central tendency and variation) are presented in Table 2, by group of interest (Greece and the baskets).
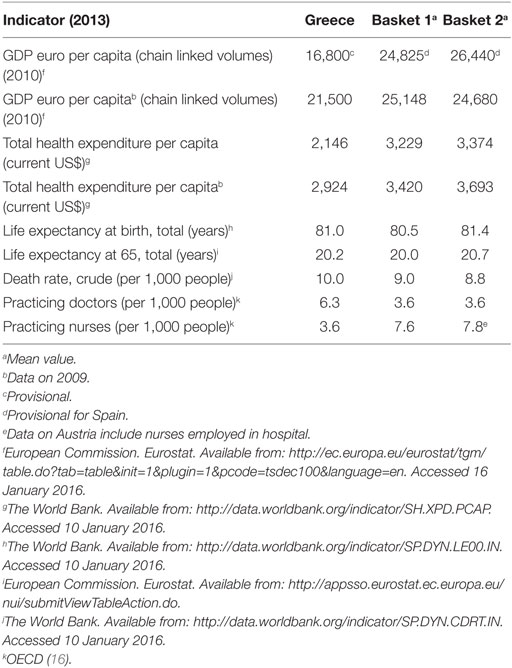
Table 1. Socioeconomic indicators of reference countries and Greece.
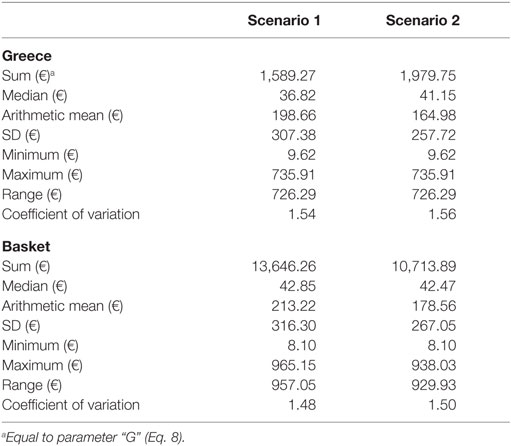
Table 2. Basic descriptive statistics of the performance characteristic (ex-factory price).
Total observations (i.e., 72) are arranged by country and medicine, according to the [PN × m] block matrix cited in formula (Eq. 5). To achieve experiment repeatability, two data arrangement scenarios were conducted, forming two experimental units, respectively. Each scenario thus pertained to one experimental unit and Greece, which was set as the comparison base. The experimental unit of Scenario 1 included the original basket of eight referenced countries. Scenario 2 reduced the basket to a subset of five countries (France, Ireland, Italy, Portugal, and Spain). Both scenarios involved equal number of observations, as presented in formula (Eq. 4).
Between-countries comparisons of price distributions are performed using the statistical test of paired samples t-test of the SPSS software. The hypotheses of equality of mean ex-factory price between countries, as well as between a country and the basket mean are tested. The level of statistical significance is set at 0.05.
where n: the number of reference countries included in the basket; N: total number of countries, including Greece; m: the number of medicines; gi: the Greek price of the ith medicine (i = 1, 2, …, m); ri,j: referenced price: the price of the ith medicine in the jth reference country (i = 1, 2, …, m; j = 1, 2, …, n); [PN × m]: the general block matrix formula of Greek and referenced prices; : the block matrix of Greek and referenced prices in Scenario 1; and : the block matrix of Greek and referenced prices in Scenario 2.
The Concise Basket Proposition
Differential effects of using concise baskets of reference countries on Greece’s prices are measured with the performance indicator CBI (Eq. 6). CBI yields the difference in percentage points, between two quantities: the Greek sum of prices “G” and the expected sum of prices by basket, “E,” which is defined as the basket’s sum of pharmaceutical prices divided by the number of countries included in the basket (Eqs 7 and 8).
where G: Greek sum of prices; E: expected sum of prices of a country included in the basket of Greece; and CBI: indicator of concise-basket effects.
Application of Insurance Price in Pharmaceutical Reimbursement
We define as insurance price (“IP”) of a medicine the pharmaceutical reimbursement price that is adjustable to the country’s affordability level. Thus, IP is calculated as a function of two variables: the first variable is the expected sum of prices of a reference country included in the basket of Greece, i.e., the parameter “E,” as previously presented (Eq. 7) and the second is a weight that reflects Greece’s financial status. The financial status weight, denoted as “a,” relies on the concept of “affordability index” presented in the literature, which correlates countries’ mean GDP per capita to the corresponding European average (2). In particular, “a” is equal to Greece’s GDP per capita (GDPG) divided by the basket’s mean GDP per capita (Eqs 10–12), with “a < 1” indicating that Greek income is lower compared to the average income of the basket. IP equals the product of “a” and “E,” as shown in Eq. 9.
During the decade 2004–2013, Greece lost a fifth of its income (−19.6%, in per capita terms) (17). Non-stationarity of GDP per capita, however, renders the variable “a” time-dependent. In addition, official and final data on GDPG are published with considerable delay, as according to Eurostat, the most recent finalized data on GDPG are traced back in 2010 (17).3 To overcome these weaknesses which can bias both the process and the results, 2009 data have been used in the analysis, as these data are final and also refer to a period before the economic crisis (17),4 enabling the drawing of more objective conclusions.
All involved GDP per capita indicators in the construction of variable “a” refer to 2009. The indicator of insurance price effects (IPI) yields the difference between the value of the insurance price “IP” and the Greek sum of prices “G,” in percentage points (Eq. 13).
where IP: insurance price; a: affordability weight; IPI: indicator of insurance price effects; GDPG: Greece’s GDP per capita; and : arithmetic mean of the GDP per capita of the basket.
Estimation of External Costs
External reference pricing models in essence constitute functions that calculate arithmetic means. Almost half of EU-28 (13/28) use the average price of their entire ERP basket, while others calculate the average price of a selected part of the basket (e.g., of a small subset of the lower prices, or the lowest value itself, etc.). Eight out of the 11 countries that refer to Greece in their ERP basket apply the first method (3). The impact (external costs) from Greece’s ERP process transformation (i.e., basket shrinking and “IP” application) on the affiliated European pharmaceutical markets was estimated by applying the average price of the whole basket (most common ERP method). Indicative values were produced using the pharmaceutical prices of this experiment. Three indices are presented in Eqs 14–16: “ERPC,” “EC1,” and “EC2.” ERPC measures the outcome of a typical ERP process for a randomly selected European country “C” that includes Greece in its basket; EC1 is an index that measures external costs resulting from the shrinking of Greece’s basket, and EC2 is an index that measures respective costs resulting from the application of Greece’s IP procedure. Detailed results are provided in Table 4.
where ERPC: the outcome of a typical ERP process exercised by a random country “C,” which includes Greece in a basket of size “b”; pi: the medicinal price in the i referenced country included in C’s basket, i = 1, 2, …, b; b: the number of countries included in C’s basket; pG: the pi value when the referenced country is Greece; P: the sum of all pi’s, in the basket of size “b,” i = 1, 2, …, b; EC1: the index that measures external costs (in C) due to Greece’s basket shrinking; and EC1: the index that measures external costs (in C) due to Greece’s IP application.
Results
The next paragraphs provide point estimates of the differential basket and reimbursement revision effects on Greece’s prices. Quantitative results for the potential impact of the proposed model on the country’s external environment are additionally presented. The microeconomic, macroeconomic, and demographic indicators that compose the research conditions under which the present experiment was conducted are also discussed.
The formed baskets represent countries with similar demographic trends, as indicated by the data on life expectancy and death rates presented in Table 1. However, homogeneity between Greece and its baskets is reduced when health resources are taken into account. In particular, medical staff density in the population varies significantly between Greece and the baskets. Yet, this variation is independent from the baskets’ composition, considering Greece’s ranking above the OECD average with regards to this particular health-care parameter (16). The picture is completely reversed when the geographical dispersion of the nursing personnel is examined, with the number of practicing nurses per 1,000 people less than half in Greece compared to the baskets (Table 1). Another difference between Greece and the baskets concerns total per capita health expenditure. Greece’s per capita health expenditure is below the corresponding average of the baskets. The latter is consistent with the rich theoretic background on the positive relation between GDP and public health expenditures per capita in OECD (18) and the fact that Greece’s income was lower in comparison with the baskets.
Income correlations constitute fundamental characteristics of this experiment where differential IP effects hinge on. The baskets represented countries of a higher income, on average, compared to Greece (Table 1). Basket 1 is placed below the European average (€25,500 and €28,300 in EU-28 and the Euro-area, respectively) (17), while basket 2 exceeds the EU-28 average. The application of IP reduces the level of current home prices by 6.49–7.47% (Scenarios 1 and 2, respectively) (Table 3), causing though no severe impact abroad, considering the small effects that vary per product and overall between −1.71% (medicine “M6,” Scenario 2) and −0.64% (medicine “M10,” Scenario 1), as Table 4 shows.
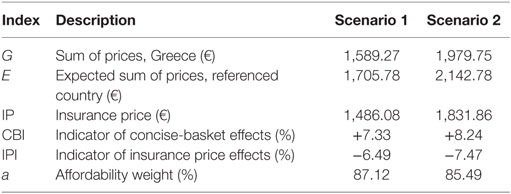
Table 3. Point-estimates of parameters and variables.
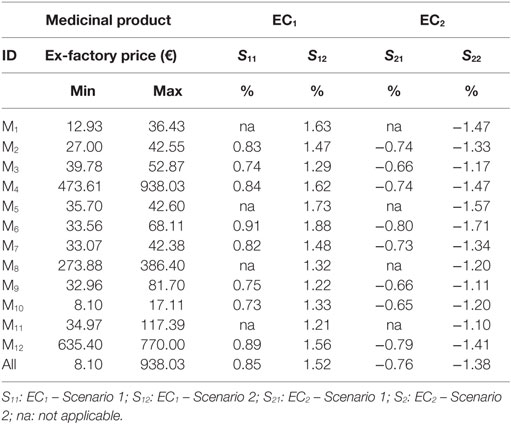
Table 4. Values of external-cost indices.
Regarding the performance characteristic, Greek prices were lower, compared to the mean price of the baskets, yet they presented higher variability, as indicated by the comparative central tendency and variation measures presented in Table 1. There were no statistical differences among the price distributions of the Scenario 1 (eight countries), except for the pair “France-Slovak Republic,” where French prices were lower (p-value = 0.05). In the smaller country set of the Scenario 2, Ireland appeared as an outlier, having statistically higher prices compared to France, Greece and Portugal (p-values 0.017, 0.022, and 0.024, respectively). This scenario yielded statistically lower Greek prices by 7.61% (p-value = 0.05) compared to the mean of the basket. CBI effects are in accordance with these statistical results, retaining however, their small range (<1%) across scenarios, considering that basket downsizing to five to eight countries caused Greek prices’ increase by 8.24% at the most (Table 3).
Discussion
External reference pricing, a common policy tool used worldwide to control prices of pharmaceuticals, is – in its present form – no longer considered sufficient in terms of operational efficiency and adaptability to payers’ available income, and has raised a lot of discussion and concerns among policy-makers, academia, and the industry. In this context, the present analysis produces new evidence regarding changes that could be incorporated in the ERP tool, to restore its efficacy.
A non-randomized experiment was conducted in order to examine the impact from the implementation of an ERP model that is flexible and adaptable to health systems’ affordability level. This experiment used Greek pharmaceutical prices as a key node of the European ERP network and tested the impact of ERP basket reconstruction and price-model fitting based on fiscal parameters. Results are examined with regard to the impact of differential price effects on both the Greek and other EU pharmaceutical markets, assessing the proposed model in terms of its theoretic value and contribution.
Regarding the insurance price proposition, the model yielded small price effects in the two examined scenarios, despite the identified statistical differences between the involved price populations. Small price reductions though not only are consistent with the budgetary targets of the country but also deter collateral financial damages of restrictive pharmaceutical policies, such as public revenue losses, which is currently a serious fiscal issue in Greece (15).
Moreover, with its small price decreases, the proposed IP model poses a disincentive for parallel exports of pharmaceuticals, which in the past has been an intense phenomenon (19), restricting thus the role of arbitragers and thereby reducing the risk of pharmaceutical market shortages and barriers to pharmaceutical care (20). Considering barriers to medical care a topical health-care issue in Europe (16), this model property is very important from a general health policy perspective, and utilizable in Greece, where unmet health needs currently affect 9% of the population on average, while specific patient populations encounter even higher rates (e.g., 13% for multiple sclerosis patients) of barriers to medication (21).
In this context, the application of a bivariate pricing model that takes into account not only prices but also countries’ affordability level adjusts prices in the best interest of the public sector and the beneficiaries. Beyond these encouraging results, the model’s moderate effects also restrict unwanted price effects and potential damage in other countries to low percentages, i.e., around 1% (in absolute terms).
In support of these findings, which are consistent with other published studies (2), the estimated values of external cost indices (EI1 and EI2) are in fact overestimations. The mean size of EU baskets that include Greece equals 21 (11),5 whereas this work examined considerably smaller basket sizes (≤8 countries), which decrease the denominator of the quantity , thus increasing the value of indices, “EC1” and “EC2” (Eqs 15 and 16).
In terms of the question of theoretic contribution, the presented model proposed the use of smaller baskets in ERP practicing. Taking into account the complex system of Greece with multiple sources of data, we conclude that structures that are more flexible bypass bureaucracy, enable computational transparency, and increase homogeneity of referenced countries. Furthermore, as the moderate increasing effects (<10%) of the basket-downsizing model on the Greek prices indicate, this improvement is achieved without causing serious price and market volatilities.
Conclusion
Technological progress, which shifts quality and prices of pharmaceutical products upwards (18, 22, 23), as well as the rapid change in the demographic and epidemiological profile of the population (24), create a dynamic grid of long-term challenges for health-care systems, which are facing major pressures on their budgets. In light of the above, health-care decision makers must not stay inert. Advancing the quantity and quality of information incorporated in pharmaceutical pricing methodology, as suggested by the present analysis, is a road that is worth being paved for all: the economy, the health-care system, and the health status of the population.
Author Contributions
All authors contributed equally to the conduct of the study and the development of this manuscript.
Conflict of Interest Statement
The authors declare that the research was conducted in the absence of any commercial or financial relationships that could be construed as a potential conflict of interest.
Footnotes
References
2. Europe Economics. External Reference Pricing. London (2013). Available from: http://www.europe-economics.com/publications/external_reference_pricing_-_final_report.pdf
3. Pharmaceutical Industries and Associations (EFPIA). Principles for Application of International Reference Pricing Systems. Brussels (2014). Available from: http://www.efpia.eu/uploads/Principles_for_application_of_international_reference_pricing_systems_June_2014_Position_Paper.pdf
4. Golna C, Contiades X, Souliotis K. Pharmaceutical Policy in Greece and Europe: Functioning of the Market and Regulatory Framework. Athens: Editions Papazisis (2005) (in Greek).
5. Bouvy J, Vogler S. Pricing and Reimbursement Policies: Impacts on Innovation. Background Paper 8.3. (2013). Available from: http://www.who.int/medicines/areas/priority_medicines/BP8_3_pricing.pdf
6. Kanavos P, Vandoros S. Competition in prescription drug markets: is parallel trade the answer? Manage Decis Econ (2010) 31(5):325–38. doi: 10.1002/mde.1486
7. Docteur E. Value for Money and Valued Innovation: A Trade-Off or Mutually Compatible Goals? OECD High-Level Symposium on Pharmaceutical Pricing Policy. (2008). Available from: http://www.oecd.org/els/health-systems/41593281.pdf
8. Espin J, Rovira J, De Labry AO. WHO/HAI Project on Medicine Prices and Availability – Working Paper 1: External Reference Pricing. (2011). Available from: http://www.haiweb.org/medicineprices/24072012/ERPfinalMay2011.pdf
9. Carone G, Schwierz C, Xavier A. Cost-Containment Policies in Public Pharmaceutical Spending in the EU. (2012). Available from: SSRN 2161803.
10. OECD Health Policy Studies. Pharmaceutical Pricing Policies in a Global Market. Paris: OECD Publications (2008).
11. European Commission. External Reference Pricing of Medicinal Products: Simulation-Based Considerations for Cross-Country Coordination. Final report (2014).
12. Ministerial Decision “Pharmaceutical Pricing Provisions”, Salmas M; Deputy Minister of Health. The Official Journal of the Hellenic Republic, issue B no 94/23.01.2013. National Printing House (2013) (in Greek).
13. Ministerial Decision “Pharmaceutical Pricing Provisions”, Salmas M; Deputy Minister of Health. The Official Journal of the Hellenic Republic, issue B no 2243/18.08.2014. National Printing House (2014) (in Greek).
14. Foundation for Economic and Industrial Research (IOBE). Rationalization of Pharmaceutical Pricing System in Greece. Athens: Foundation for Economic and Industrial Research (IOBE) (2013).
15. Souliotis K, Papageorgiou M, Politi A, Frangos N, Tountas Y. Estimating the fiscal effects of public pharmaceutical expenditure reduction in Greece. Front Public Health (2015) 3:203. doi:10.3389/fpubh.2015.00203
16. OECD. Health at a Glance 2015: OECD Indicators. Paris: OECD Publishing (2015). Available from: http://dx.doi.org/10.1787/health_glance-2015-en
17. European Commission. Eurostat. Real GDP Per Capita, Growth Rate and Totals. (2015). Available from: http://ec.europa.eu/eurostat/tgm/table.do?tab=table&init=1&plugin=1&pcode=tsdec100&language=en
18. De la Maisonneuve C, Martins JO. “A Projection Method for Public Health and Long-Term Care Expenditures”, OECD Economics Department Working Papers, No. 1048. OECD Publishing (2013). Available from: http://dx.doi.org/10.1787/5k44v53w5w47-en
19. Kanavos P, Costa-Font J, Merkur S, Gemmill M. The Economic Impact of Pharmaceutical Parallel Trade in European Union Member States: A Stakeholder Analysis. LSE Health and Social Care, London School of Economics and Political Science (2004).
20. Danzon PM, Wang YR, Wang L. The impact of price regulation on the launch delay of new drugs – evidence from twenty-five major markets in the 1990s. Health Econ (2005) 14(3):269–92. doi:10.1002/hec.931
21. Souliotis K, Alexopoulou E, Papageorgiou M, Politi A, Litsa P, Contiades X. Access to care for multiple sclerosis in times of economic crisis in Greece – the Hope II Study. Int J Health Policy Manag (2016) 5(2):83–9. doi:10.15171/ijhpm.2015.173
22. Pharmaceutical Industries and Associations (EFPIA). The Pharmaceutical Industry in Figures. Key Data. (2014). Available from: http://www.efpia.eu/uploads/Figures_2014_Final.pdf
23. Pharmaceutical Research and Manufacturers of America (PhRMA). Profile – Biopharmaceutical Research Industry. (2015). Available from: http://www.phrma.org/sites/default/files/pdf/2015_phrma_profile.pdf
Keywords: external reference pricing, reimbursement, affordability, GDP, insurance price, Greece
Citation: Souliotis K, Papageorgiou M, Politi A and Athanasiadis A (2016) Pharmaceutical Pricing Policy in Greece: Toward a Different Path. Front. Public Health 4:185. doi: 10.3389/fpubh.2016.00185
Received: 08 July 2016; Accepted: 17 August 2016;
Published: 31 August 2016
Edited by:
Mirjana Ratko Jovanovic, Clinical Center Kragujevac, SerbiaReviewed by:
Viktorija Dragojevic-Simic, Military Medical Academy, SerbiaMariela Deliverska, Medical University Sofia, Bulgaria
Athanassios Vozikis, University of Piraeus, Greece
Copyright: © 2016 Souliotis, Papageorgiou, Politi and Athanasiadis. This is an open-access article distributed under the terms of the Creative Commons Attribution License (CC BY). The use, distribution or reproduction in other forums is permitted, provided the original author(s) or licensor are credited and that the original publication in this journal is cited, in accordance with accepted academic practice. No use, distribution or reproduction is permitted which does not comply with these terms.
*Correspondence: Kyriakos Souliotis, soulioti@hol.gr