Multi-sensory urban search-and-rescue robotics: improving the operator’s omni-directional perception
 Paulo G. de Barros
 Robert W. Lindeman
- Human Interaction in Virtual Environments Laboratory, Department of Computer Science, Worcester Polytechnic Institute, Worcester, MA, USA
The area of human–robot interaction deals with problems not only related to robots interacting with human beings but also with problems related to human beings interacting and controlling robots. This article focuses on the latter and evaluates multi-sensory (vision, hearing, touch, and smell) feedback interfaces as a means to improve robot-operator cognition and performance. The paper summarizes three-previously reported empirical studies on multi-sensory feedback using simulated robots. It also reports the results of a new study that used a physical robot to validate the results of these previous abovementioned studies, and evaluate the merits and flaws of a multi-sensory interface as its sensorial complexity was gradually increased. The human senses were selected based on their response time to feedback and easiness of adaptability of their feedback mechanisms to different types of robot-sensed data. The results show that, if well-designed, multi-sensory feedback interfaces can indeed improve the robot-operator data perception and performance. They shed some light on the benefits and challenges multi-sensory feedback interfaces bring, specifically on teleoperated robotics and urban search-and-rescue. It adds to our current understanding of these kinds of interfaces and provides a few insights to assist the continuation of research in the area.
Introduction
Human beings perform tasks effectively in the real world using their highly advanced senses. Through evolution and repetition, they are able to effortlessly take in, filter, fuse, and make sense of huge amounts of high-fidelity visual, auditory, touch, smell, and taste stimuli. Furthermore, due to their versatile nature, human beings are able to adapt to input/output (I/O) mechanisms when using tools and machines, even if interfaces are sub-optimally designed.
While robotic systems are assuming an ever-increasing role in our lives, current human–robot interaction (HRI) interfaces for teleoperated robotic systems seldom take advantage of the high-bandwidth, multi-sensory capacity offered by human operators. Instead, they present all information to the eyes alone using visual displays. Although our visual sensory system is highly evolved, its capacity is not limitless, and its overuse may demand excessive mental effort from the robot operator and restrict his ability to efficiently and effectively perform the tasks he has been assigned.
The reasons for the predominance of visual-only HRI interfaces include (a) the ease with which information can be displayed on computer monitors, (b) a lack of understanding within the interface design community of the salient aspects of displays for other sensory modalities, (c) a lack of methods for evaluating multi-sensory interface effectiveness, and (d) interface cost.
As an attempt to add to the abovementioned knowledge gaps, this article presents and discusses the results of four user studies involving multi-sensory feedback interfaces in the performance of an urban search-and-rescue (USAR) robot teleoperation task (de Barros et al., 2011; de Barros and Lindeman, 2012, 2013; de Barros, 2014). In these studies, virtual and real robots were used and the vision, hearing, touch, and smell senses were exposed to feedback from the robot interface.
The results obtained confirm the effectiveness of multi-sensory interfaces in off-loading visual information to other senses and improving the user’s spatial perception and task performance. Although the task and visual interface used in the studies are USAR-specific, the benefits obtained by the use of multi-sensory interfaces could be extended to other types of robotic and computer systems in general. Additionally, the evaluation methodology that evolved along these studies brings together separate but related metrics from the virtual reality (VR), HRI, and human–computer interaction (HCI) communities and is proposed as a starting point for future evaluations of this kind of interface.
Related Work
Most urban search-and-rescue (USAR) robot interfaces nowadays display all data visually. Nevertheless, there has been an evolution in their design over the course of the past decades. Such evolution can be simplistically divided into three stages or eras:
(1) Mono-out pre-fusion era (up to 2004): data are spread across a single visual display in multiple windows that could potentially overlap (Yanco et al., 2004). Only a few attempts were made to fuse information into a single display (Johnson et al., 2003).
(2) Mono-out fusion era (2005–2009): data are presented on a single window with multiple overlapping panels (Yanco et al., 2007). The fusion makes the overlapping intuitive and non-obtrusive, and facilitates the perception to such data (Nielsen et al., 2007).
(3) Mono-in mono-out fusion era (2010 to present): not only output is fused in this era but also input, whose interactions are done within the visual display through touch. Because the input area is closer to the user’s visual point of focus, it can be handled or disambiguated more effectively and efficiently (Micire et al., 2011).
Although much as these interfaces have improved, little effort has been put into using more than one sense for both input and output. This is the motivation of this article: to push USAR robot interfaces to the next era of Multi-in Multi-out data fusion, where I/O is fused, uses multiple senses and leads to transparent and intuitive system interactions. The focus of our current research work is not on input, but rather on output. Future work looks at the input side.
Multi-Sensory Feedback Techniques
Visual-feedback techniques generally involve LCD or CRT monitors for displaying data to the operator. But what and how data are displayed varies for each application. Examples of display techniques are 3D mapping (Thrun et al., 2004), stereo and probabilistic vision (Zelek and Asmar, 2003), and point clouds (Suarez and Murphy, 2012).
Audio feedback can be used to display robot data in analog (e.g., direct sound stream) or symbolic (e.g., speech synthesis and sound icons) forms (Gröhn et al., 2005). It has been shown that its use can improve realism of virtual scenes (Blom and Beckhaus, 2010), user situation awareness (SA) (Kaber et al., 2006), search (Gröhn et al., 2005), and remote vehicle-control performance (Nehme and Cummings, 2006).
Touch feedback can be divided into kinesthetic and tactile feedback. The focus of this work is on the latter because this interface is often less cumbersome, easier to deploy in field applications, such as USAR, and more easily re-mapped to different robot-sensed data. Tactile cues have been used as display devices on various parts of the body such as the forehead, tongue, palms, wrist, elbows, chest, abdomen, back, thighs, knees, and foot sole (Lindeman, 2003; Zelek and Asmar, 2003). Vibro-tactile feedback has been associated with improved reaction (Van Erp and Van Veen, 2004) and completion time (Lindeman et al., 2005), task effectiveness, and useful for providing directional cues (Arrabito et al., 2009), alerts (Elliott et al., 2009), and 3D information (Bloomfield and Badler, 2007).
Olfactory (smell) feedback has been explored in VR and different technologies have been devised for providing it to users. The most common ones are projection-based devices using wind (Noguchi et al., 2009), air puffs (Yanagida et al., 2004), or close-to-nose tube-delivery devices (Narumi et al., 2011). Effects of smell on human cognition and performance have also been measured in the past (Moss et al., 2003; Herz, 2009). No research has been found that applies smell feedback as an aid to robot teleoperation tasks.
For palatal (taste) feedback, researchers have come up with different devices for displaying taste (Narumi et al., 2011) or the sensation of eating (Iwata et al., 2004) and drinking (Hashimoto et al., 2006). Although not explored in this work, the sense of taste could be associated with chemical or thermal temperature data collected from air or soil from a remote robot and aid in route planning or data resampling decisions.
Even though a large amount of research has been done on evaluating these types of feedback individually, few have evaluated the consonant use of more than two senses for feedback, especially in the area of robot teleoperation. The studies presented in this work evaluate the effect of multi-sensory feedback with virtual and real robots in a USAR task scenario.
User Studies
Four multi-sensory feedback studies are presented in this section. The first three studies use a simulated robot while the fourth one uses a physical one. The task subjects are asked to perform are the same in all studies, which is to search for red objects (circles or spheres) in a debris-filled environment. Subjects were asked to find as many object as possible, as fast as possible, while trying to avoid collisions with the robot as much as possible. Subjects were unaware of the total number of objects hidden. In the context of the AAAI Rescue Robotics Competition, the environments for both simulated and real robots are rated as the level yellow of the competition, where the robot traverses the entire world by moving around the same ground level with some debris spread across the floor (Jacoff et al., 2003).
Even though the amount of treatments subjects were exposed to varied according to the study design (between versus within-subjects), for each treatment, the experimental procedures were the same and can be summarized by the following seven steps:
1. A Institutional Review Board (IRB) approved consent form was read and filled-in.
2. Instructions were given about the robot, and the task to be completed.
3. The robot interface would be explained, followed by a short training session that was accompanied by Q&A.
4. The subject would take part in the task for a specific treatment interface.
5. A post-treatment questionnaire would be filled-in.
6. If the study had a within-subjects-design, steps 3 through 5 would be repeated for the subject for each remaining treatment.
7. A final post-study questionnaire would be filled-in.
In all studies, a post-treatment questionnaire asked subjects to report the number of spheres found and their location by sketching a map of the environment. They were provided with the pictures taken with the robot camera during their traversal of the environment to help them in sketching. The pictures were presented with a resolution of 800 × 640 pixels on a Web page during the sketching task.
The first study (de Barros et al., 2011) compared the display of robot collision-proximity data through visual and/or vibro-tactile displays. The second study (de Barros and Lindeman, 2012) explored the pros and cons of two vibro-tactile data display representations. The third study (de Barros and Lindeman, 2013) further enhanced the visual-tactile interface from study #2 with audio and redundant visual feedback, and measured the effects of such enhancements to the interface. The fourth and last study (de Barros, 2014) attempted not only to validate previous results obtained via simulation with a real robot but also evaluated the addition of smell feedback on top of the other three-previously evaluated types of sensory feedback.
Robot Interface
All studies had common features in terms of interface feedback. These common features are detailed in this section. The enhancements performed on this interface by each study are detailed in the section related to each study.
The visual interface design used as a starting point the interface proposed by Nielsen et al. (2007). The operator was presented with a third-person view of a 3D virtual representation of the robot, called its avatar. The virtual robot and its avatar had the approximate size of a standard search robot (0.51 m × 0.46 m × 0.25 m). Data collected by the robot sensors were visually presented, including a video feed from a pan-tilt camera mounted on the robot, and sensor data, such as location of object surfaces near the robot, collision locations around the robot, and carbon monoxide (CO) levels in the air. Depending on the experiment, such data could originate from a virtual or real remote environment. The visual interface was viewed through a standard LCD screen in a window with resolution of 1024 × 768.
The robot camera had a field-of-view of 60°. A panel located in front of the robot avatar presented data from this camera. The camera, and hence the panel, could be rotated about both the vertical and horizontal axes relative to the front of the robot. The camera-panel rotations occurred relative to the robot avatar and matched the remote robot camera rotations controlled by operator input.
For the first three studies, a map blueprint of the environment was gradually projected on the ground in the form of blue lines as the robot explored the environment. These blue lines represented the locations of object surfaces near the robot as detected by the robot sensors. In all experiments, a timer was presented in the top right hand corner of the screen. It was triggered once the training session finished and the study task was started.
The belt used for providing vibro-tactile feedback, the TactaBelt (Figure 1A, Lindeman, 2003) was also the same one in all studies. The TactaBelt consisted of eight pager motors, also called tactors, arranged in a ring around the robot-operator’s torso. The motors were spaced evenly and the forward direction was represented by the motor in the torso front. All subjects wore the TactaBelt, even if the interface was not active during the experiment for some of them.
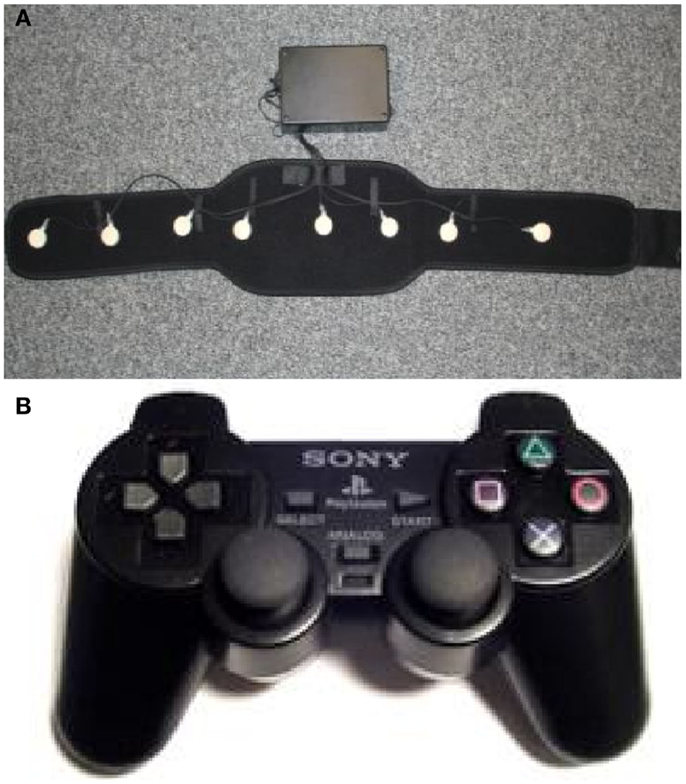
Figure 1. Hardware interface used in addition to a standard LCD monitor: (A) TactaBelt, and (B) PlayStation 2 dual-shock controller.
Additionally, the virtual and physical robots were controlled using a PlayStation 2 gamepad (Figure 1B). The virtual and physical robots rotation used differential drive, which meant the robot could rotate in place or while in movement. The gamepad could also be used to take pictures using the robot camera.
In all studies, subjects were asked to sketch a map of the environment when the search task was completed. The map had to indicate the location of the objects found. These maps were scored from 1 (poor) to 5 (excellent) using the evaluation criteria similar to Billinghurst and Weghorst (1995).
Data Variables and Analysis
The main dependent variables (DVs) used in these studies to determine the impact of interfaces in terms of performance and SA were the number of robot collisions (local SA impact), the time taken to perform the task (performance impact), an increase in the number of objects found (performance impact), and a better reporting of the location of the objects and understanding of the environment (global SA impact). SA (Endsley and Garland, 2000) is interpreted in this research work as the user’s awareness of a subset of the current state of the robotic system, and its surrounding local and remote environment, which is relevant to the task at hand. Other variables related to subjects health and workload were also gradually added as the methodology evolved along the studies. These will be described in the sections summarizing each study.
The demographics information was collected in questionnaire form. It initially asked about subject gender, age, how often they played video games and used, or worked with robots among other questions, but further information was collected as the studies progressed and the study methodology evolved. For experience-related questions, such as the last two mentioned above, a numerical scale of four values was used as follows: “daily” (1), “weekly” (2), “seldom” (3), or “never” (4).
Subjects also took a spatial aptitude test in studies #2, #3, and #4 to ensure results were not biased by subjects’ spatial abilities.
The results for all four studies were analyzed using a single-factor ANOVA with confidence level of α = 0.05 over the interface treatments presented in each study. Results close to significance had a confidence level of α = 0.1 and were described as trends. When a statistically significant difference (SSD) among more than two interface treatments was found, a Tukey test (HSD, 95% confidence level) was performed to reveal the groups that differed from each other. In some cases, single-factor ANOVAs were also applied to compare groups in a pair-wise fashion. For questionnaire ratings, Friedman tests compared all groups together, while Wilcoxon tests compared them pair-wise. If a dependent variable (DV) is not mentioned in the data analysis of a study, it means that it did not lead to SSDs among independent variable (IV) groups. Partial eta-squared (η2) results were also calculated using group or pair-wise ANOVAs.
If the study had a between-subjects design, independent-samples ANOVAs were used. If the study had a within-subjects design (studies #2 and #3), repeated-measures ANOVAs were used and data normalization across interface treatments was performed on a per-subject basis to reduce the amount of data variation due to different levels of subject experience. An example of such per-subject normalization is the following. If subject A, for a DV X, had the following results (Trial 1, Trial 2, Trial 3) = (10, 20, 30), these values would be converted into (10/60, 20/60, 30/60) ~ (0.166, 0.334, 0.5). In the within-subject studies, treatments and scenario order was partially balanced using Latin square.
More details on the data collection, data analysis, equipment, and materials preparation for each of the studies can be found in de Barros (2014).
Study 1: Evaluating Visual and Vibro-Tactile Feedback
This first study aimed at evaluating the impact on SA and performance when part of the data transmitted by the robot was displayed through a body-worn vibro-tactile display (TactaBelt) used to display imminent robot collisions. The use of the vibro-tactile feedback for robot collision proximity was compared with the use of no feedback, the use of visual feedback, and the use of both types of feedback in a search task (de Barros et al., 2011).
Robot interface
In order to compare visual and vibro-tactile feedback for collision-proximity feedback (CPF), the interface design (Figure 2) for study #1 had a ring surrounding the robot avatar. This ring indicated imminent collisions near the robot, similar to the Sensory EgoSphere proposed by Johnson et al. (2003). The brighter the red color in the ring, the closer to a collision point the robot was. The same type of feedback was also provided as vibration through the TactaBelt. The more intense a tactor in the TactaBelt vibrated, the closer the robot was to colliding in that direction, similar to the feedback technique proposed by Cassinelli et al. (2006). Both visual and vibro-tactile feedback interfaces were only activated when an object was within a distance d from the robot (d ≤ 1.25 m).
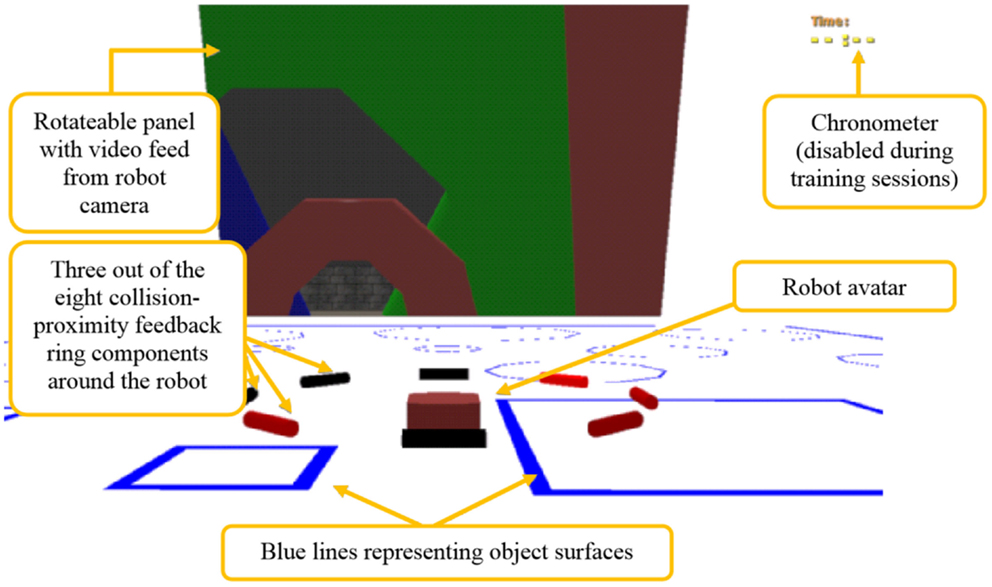
Figure 2. Study #1 visual interface components.
Hypotheses
Previous results obtained from other research groups have shown improvement in performance when using vibro-tactile displays (Bloomfield and Badler, 2007; Blom and Beckhaus, 2010) and enhanced interfaces (Johnson et al., 2003). Based on these results, study #1 claimed that
H1.1. Subjects using either the vibro-tactile or the graphical ring feedback interface should have an increase in navigational performance and SA.
H2.2. Subjects who are using both the vibro-tactile and the graphical ring feedback interfaces should have an even larger increase in navigational performance and SA.
Methodology
This user study had a between-subjects design. The IV was the type of CPF interface, which divided subjects into four groups or treatments: the first group (“None”) operated the robot without using any CPF interface. The second (“Ring”) received this feedback from the graphical ring. The third (“Vibro-tactile”) received this feedback from the TactaBelt. The fourth (“Both”) received the CPF feedback from both the graphical ring and TactaBelt. A virtual training room (15 m × 15 m) and the room where the real task took place (8 m × 10 m) are presented in Figures 3A and 3B, respectively. In the real task room, objects such as doorways, barrels, and tables where represented in their size in reality.
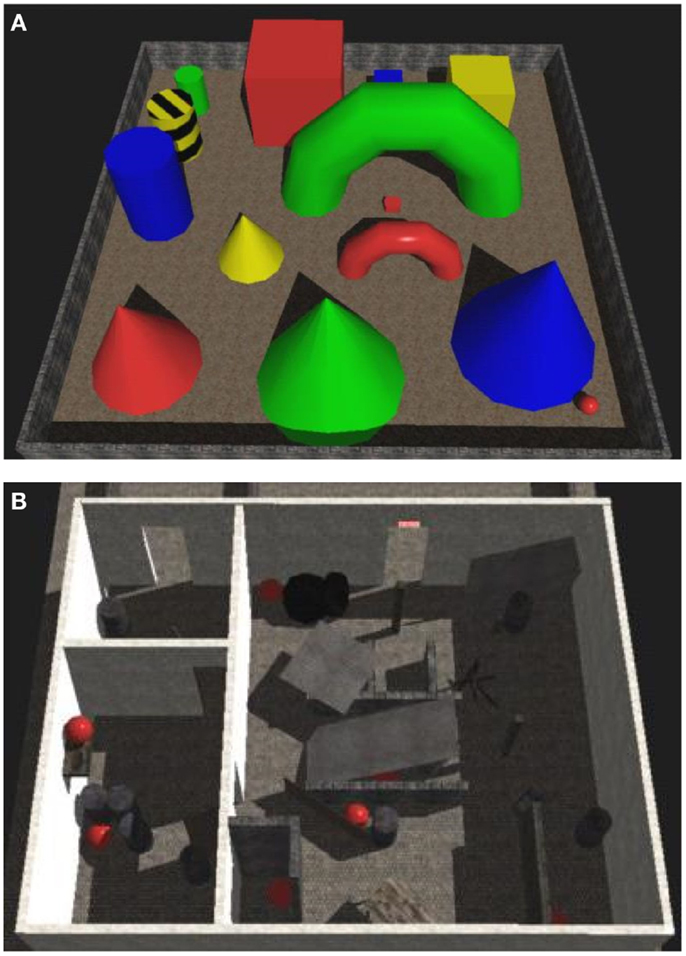
Figure 3. Environments used during the training session (A) and real experiment (B) for study #1.
Results
A total of 13 female and 14 male university students participated in the study (age: M = 20 years and 6 months, SD = 5 years and 3 months). The results with SSD are presented in Table 1. The black lines mark groups of interfaces with statistically equal results. If no line is shown, all results were statistically equal. Mean values with a “•” or “*”s detail the SSD magnitude among interface treatments.
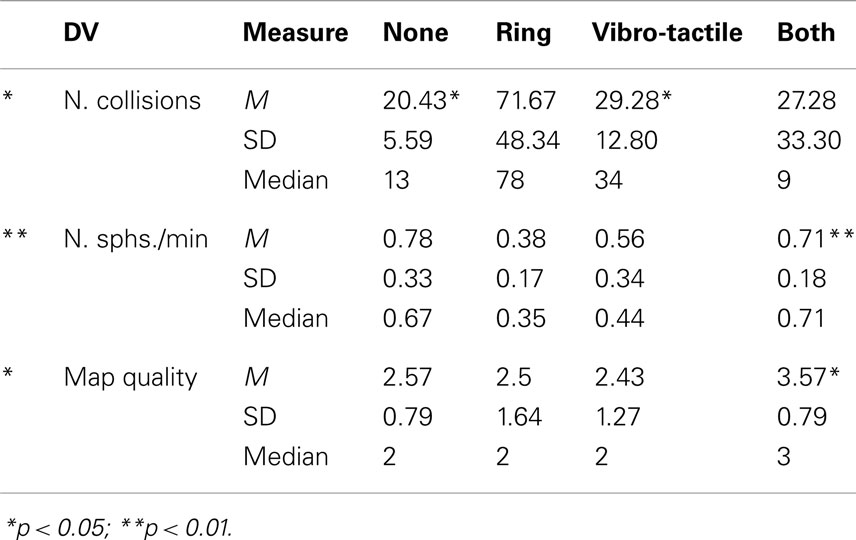
Table 1. DV results for different interface treatments in study #1.
A comparison of the number of collisions between groups showed SSDs between groups (“None,” “Ring”), F(1, 11) = 6.69, p = 0.02, η2 = 0.378, and (“Ring,” “Vibro-tactile”), F(1, 11) = 5.08, p = 0.04, η2 = 0.462. The “Ring” interface led to a higher number of collisions than the treatment interface. For the number of spheres found per minute, a SSD indicated a lower number of spheres found for group “Ring” compared to group “Both,” F(1, 11) = 11.17, p = 0.006, η2 = 0.504. These differences did not occur for neither of the two treatments including vibro-tactile feedback (“Both” and “Vibro-tactile”). When comparing map quality with the type of CPF interface used, a SSD was found between groups “None” and “Both,” F(1, 12) = 5.65, p = 0.03, η2 = 0.32. A trend toward significance was also found between groups “Vibro-tactile” and “Both,” F(1, 12) = 4.08, p = 0.07 η2 = 0.254. Although the results could not confirm neither of its hypothesis, they appear to show that when used together, the CPF interfaces may have helped improve the robot-operator global SA.
Conclusion
This study has shown that the use of redundant multi-sensory feedback, specifically visual and vibro-tactile feedback, can be beneficial to the robot operator when either type of feedback is insufficient to bring the operator to his optimal level of performance and SA. In other words, one type of feedback can help minimize the other’s deficiencies and bring about a better HRI feedback interface. Nevertheless, it is still unclear how the form with which data are displayed through a specific sense impacts subject performance and SA. Study #2 provides an initial investigation on this topic for the vibro-tactile type of feedback.
Study 2: Evaluating Vibro-Tactile Display Techniques
The first study compared visual and vibro-tactile data displays, both of which outperformed the control case, but only when they were presented together, not when presented separately. This second study attempts to reassess the result obtained by the vibro-tactile-only interface by exploring different vibro-tactile modes without the interference of the graphical ring (de Barros and Lindeman, 2012).
Robot interface
In this study interface (Figure 4), the graphical ring was not present. Additionally, the blue print of the map had its accuracy and realism enhanced by the use of ray-casting to plot dots on the ground. This approach better approximates the techniques used by physical robots to detect surrounding surfaces. The robot avatar was also updated to improve realism.
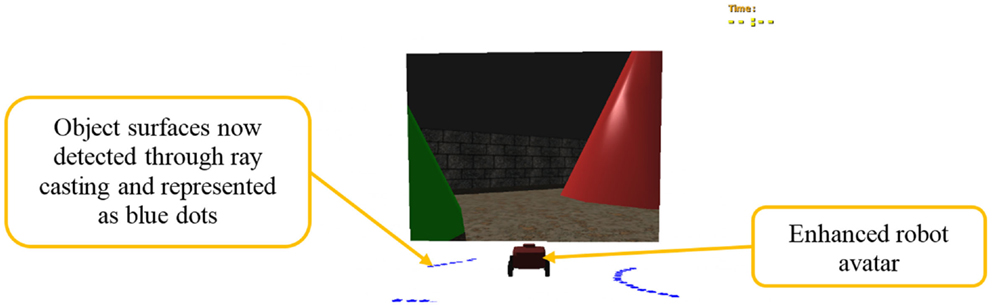
Figure 4. Study #2 visual interface improvements. The ring feedback was not used in this study.
Two vibro-tactile feedback modes were evaluated in this study (Figure 5). The first one (Intensity, or I), was the same as in study #1. For the second mode (Frequency, or F), the more frequently a tactor vibration pulsated, the closer the robot was to colliding in the direction the tactor pointed.
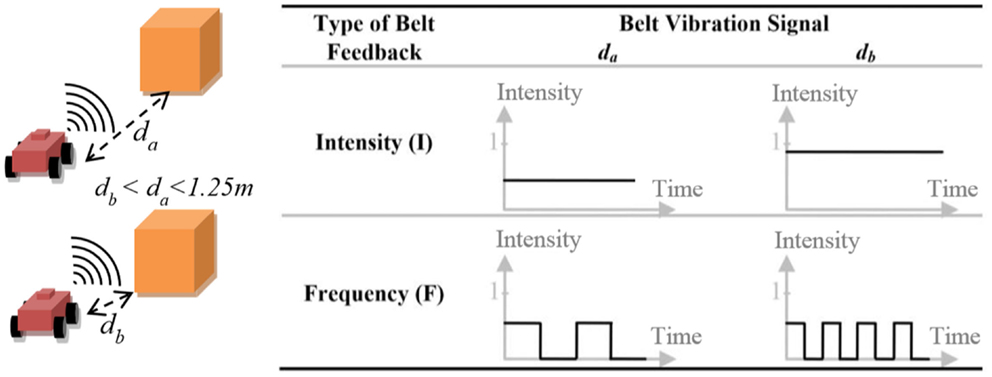
Figure 5. Vibro-tactile modes evaluated in study #2.
Hypotheses
Based on previous results (Johnson et al., 2003; Bloomfield and Badler, 2007; Blom and Beckhaus, 2010) and a pilot study, we hypothesized that
H2.1. Using either vibro-tactile feedback interface should lead to an improvement in performance in the search task compared to the control case;
H2.2. The intensity interface should lead to a higher performance than the frequency interface.
Methodology
This study had a within-subjects design. The IV was again the type of collision-proximity feedback (CPF) interface, which included the interfaces I and F and a control case without vibro-tactile feedback (“None” or “N”). This study has normalized the four original dependent variables (DVs) described in Section “Data Variables and Analysis” by time, path-length and subject. Questions about their levels of presence (Witmer and Singer, 1998) and comfort using the interfaces were also added. They were based on the SUS (Usoh et al., 2000) and SSQ questionnaires (Kennedy et al., 1993).
Results
A total of 14 female and 22 male university students participated in the study (age: M = 19 years and 7 months, SD: 1 year and 6 months). Two important results were found for the DVs and are presented in Table 2. First, there was a decrease in the number of collisions caused by both interfaces enhanced with vibro-tactile feedback, F(2, 105) = 4.373, p = 0.015, η2 = 0.016 (Table 2). These results confirm H2.1. The second important result was a trend pointing to a decrease in the sketchmap quality for the Frequency interface compared to the other interfaces, F(2, 105) = 2.397, p = 0.096, η2 = 0.044 (Table 2).
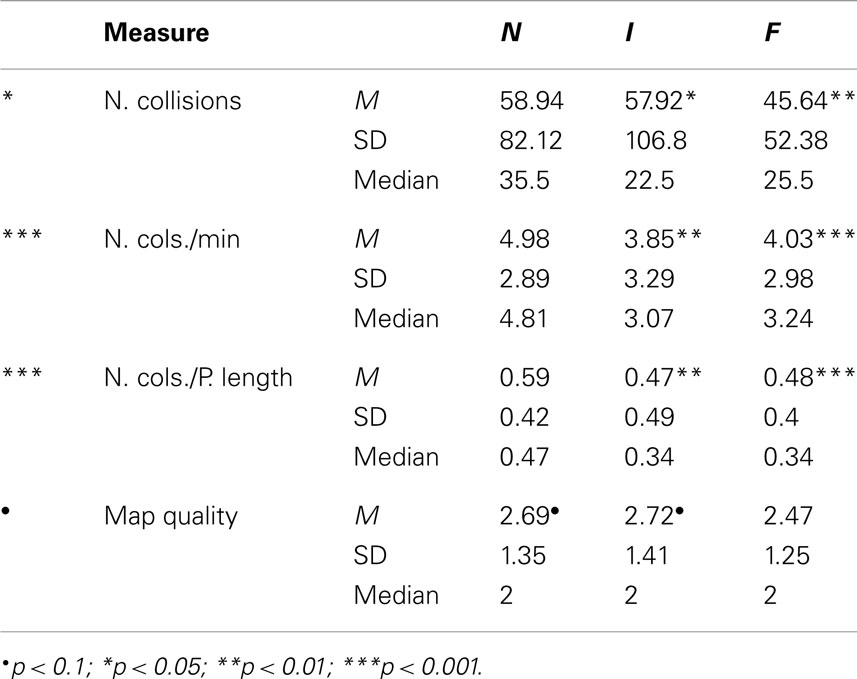
Table 2. Non-subject-normalized DV results for different interface treatments in study #2.
Both enhanced interfaces have also led to improvements in the “Being There” and “Visited” presence measures. The Frequency interface had a lower rating than the control interface for the “Nausea” and “Reality” measures. The final questionnaire also pointed to a lager increase in discomfort, distraction, and difficulty caused by the Frequency interface [see de Barros and Lindeman (2012) for details]. This may be a sign that a more advanced type of vibro-tactile feedback is negatively impacting subjects’ cognitive load. These results support H2.2.
Conclusion
This study has compared vibro-tactile feedback with different levels of complexity. In support to H2.1, it has shown that both vibro-tactile feedback modes contributed to improvements in subject’s performance compared to the control case. Although the more complex mode (Frequency, F) was felt as being more accurate by a few subjects, the less complex mode (Intensity, I), was preferred by most subjects for its ease of learning and use as expected and claimed in H2.2. Nonetheless, it would be interesting to investigate whether the addition of feedback to more senses in such a multi-sensory interface could bring further benefits in terms of performance and SA. Furthermore, the question of whether redundant multi-sensory feedback is always beneficial to the robot operator still requires further clarification. Study #3 attempts to elucidate these issues.
Study 3: Evaluating the Complexity of Multi-Sensory Displays
Although the use of vibro-tactile and enhanced interfaces has been shown to improve user performance in a simple virtual teleoperation task, there is no consensus among the previous and other studies (Yanco et al., 2004) on whether the use of redundant feedback brings any benefit to the robot operator. Results from previous studies suggest that vibro-tactile feedback leads to positive results when used either as a redundant (study #1) or complementary (study #2) type of feedback. This third study builds upon the previous study results, and evaluates the effect of adding extra audio feedback to the previous bi-sensory interface (vision and touch), and the effect of redundant data presentation in multi-sensory displays (de Barros and Lindeman, 2013).
Robot interface
Interface 1 for this study used study #2’s Intensity interface as a basis. Interface 2 built upon Interface 1 and added audio feedback: a stereoscopic bump sound when collisions with the virtual robot occurred, and an engine sound that increased its pitch as speed increased. Sound feedback was displayed through an Ion iHP03 headset. Interface 3 (Figure 6) built upon Interface 2 and added extra visual feedback to the interface. The same ring as in study #1 was used here, but it was now displayed on top of the robot avatar to avoid obstacle occlusion and used shades of yellow instead of shades of red. Another visual feature added was a speedometer positioned on the back of the robot as a redundant display for the engine sound. Table 3 summarizes the interface features that each interface contained.
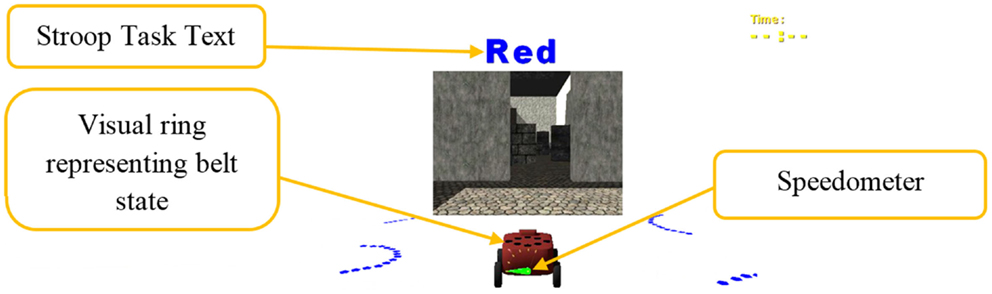
Figure 6. Study #3 visual components. The visual ring and speedometer are only part of Interface 3.
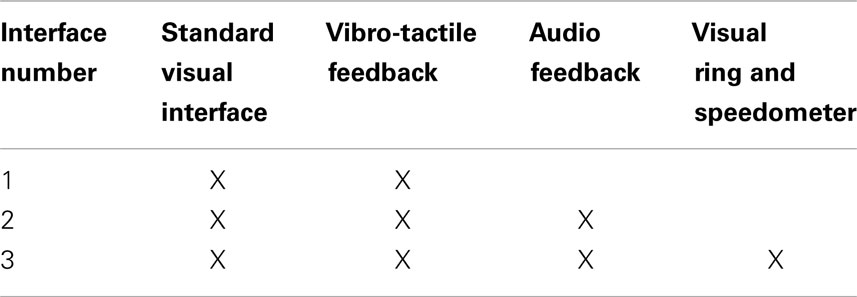
Table 3. Display features for interface treatments in study #3.
Hypotheses
Based on the insights collected from other research work, our previous studies and with the interface enhancements proposed, the following two results were hypothesized for this study:
H3.1. Adding redundant and complementary sound feedback to the control interface should improve performance and SA during the search task;
H3.2. Adding redundant visual feedback should lead to even further performance and SA improvements in the search task.
Methodology
The study had a within-subjects design, where the search task was performed by each subject for all interface types. The IV was the type of interface as presented in Table 3. The objective DVs were the same as in the previous study and were also normalized on a per-subject basis. However, in this study, while performing the main search task, each subject also performed a secondary task, a visual Stroop task (Gwizdka, 2010). In this task, subjects had to indicate whether a word and its color matched. For example, the word “red” could show up in blue (Figure 6), which would be a mismatch. The Stroop DVs were the percentage of incorrect responses, response time, and percentage of unanswered questions. Variations in these measures could indicate variations in subjects’ cognitive load. Additionally, subjective workload was measured using the NASA-TLX questionnaire (Hart and Staveland, 1988) for each interface treatment.
Results
A total of 18 male university students participated in the experiment (age: M = 25, SD = 3 years and 2 months). The results for the DVs with SSDs for this experiment are presented in Table 4. For the number of collisions per minute, trends indicated a reduction in collisions for interfaces 2 [F(1, 34) = 3.70, p = 0.06, η2 = 0.098], and 3 [F(1, 34) = 3.65, p = 0.06, η2 = 0.097] compared to interface 1. Similar improvements for interfaces 2 [F(1, 34) = 4.32, p = 0.04, η2 = 0.112] and 3 [F(1, 34) = 4.16, p = 0.05, η2 = 0.109] were found for the number of collisions per path length. These results support H3.1. Notice that adding audio (Interfaces 2 and 3) led to a decrease of about 30% in the median for the number of collisions.
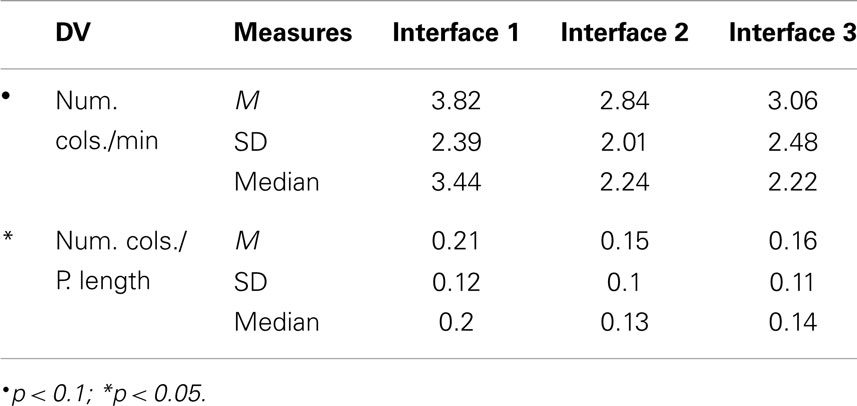
Table 4. Non-subject-normalized DV results for different interface treatments in study #3.
For the treatment questionnaires, Interface 2 has shown to improve the level of “Being There” [χ2(2, N = 18) = 6.28, p = 0.04; η2 = 0.058] and “Rush” (W = 37.0, Z = −1.87, p = 0.06, R = −0.31; η2 = 0.030) compared to control. Wilcoxon tests showed that using Interface 2 (W = 10.0, Z = −2.15, p = 0.04, R = −0.36; η2 = 0.072) and Interface 3 (W = 15.0, Z = −1.89, p = 0.07, R = −0.31; η2 = 0.093) made it more straightforward to understand data than using Interface 1. These results support H3.1 but not H3.2. On the other hand, Interface 3 made the users feel more like walking and less like driving compared to Interface 2 [χ2(2, N = 18) = 7.82, p = 0.02; η2 = 0.093]. For the NASA-TLX performance measure, a trend has indicated a lower rating for Interface 3 compared to Interface 1 (W = 103.0, Z = 1.80, p = 0.08, R = 0.30; η2 = 0.093). This measure indicates how successful subjects felt in accomplishing the task. In other words, Interface 3 made subjects feel as if they performed worse than with Interface 1. This result goes against what was claimed in H3.2. Subject comments have also confirmed the results obtained from subjective and objective measures supporting H3.1, but rejecting H3.2.
Conclusion
This study has led to two interesting results. First, it has shown that enhancing a bi-sensory (vision, touch) feedback interface with a properly designed feedback interface for a third sense (hearing) can still lead to further enhancements in performance with little to no effect in subject cognition. Second, the study has also shown that redundant feedback may not always be beneficial. In fact, it may even be detrimental if it does not contribute to further improving the operator’s understanding of the data being redundantly displayed. These results lead us to ask the following two questions: how much more multi-sensory can an interface become before its cognitive demand outweighs its performance benefits? Additionally, can the results of studies #1, #2, and #3, which used a simulated robot also be reproduced with a real robot in a physical environment? The fourth and last study attempts to provide and initial answer to both of these questions.
Study 4: Further Evaluating Complexity and Validating Simulation Results
The goal of this fourth was to validate the previous results obtained through robot simulation with a real robot, and evaluate whether expanding the multi-sensory complexity of the interface could still bring further benefits to the robot operator. The task was the same as in previous studies, except that now the operator had to look for red cardboard circles instead of virtual red spheres (de Barros, 2014).
Robot
The robot used was a custom-made four-wheel rover as shown in Figure 7A. The robot had four-wheel differential-drive all-terrain robot (ATR) chassis (top speed: ~5 mph). The motors were operated through a Sabertooth dual 25 A board connected to a neuron robotics (NR) DyIO board. The latter was in turn connected to a computer located on a ventilated black metallic box on top of the chassis. Tape and a garden hose were put around the chassis wheels to reduce friction with the floor carpet and make the robot more easily navigable. Details on the robot set-up can be found in de Barros (2014).
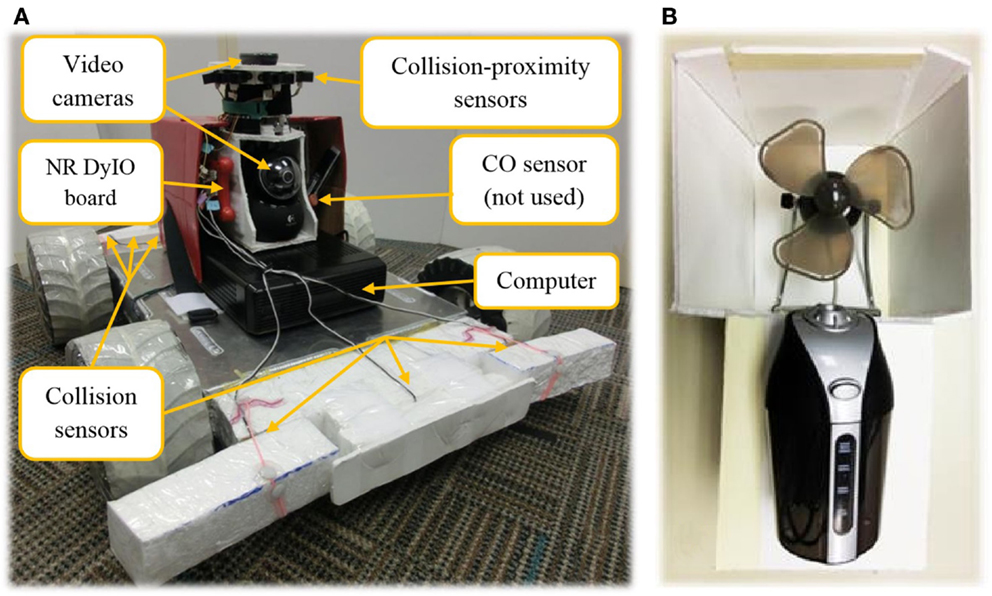
Figure 7. Hardware for study #4: (A) robotic rover and its subparts, and (B) smell diffusion device.
All the robot apparatus, including the cameras and wireless network card, were connected to the computer via USB 2.0. The same NR DyIO board used to control the wheels also connected to the robot sensors, which are presented in Table 5. The robot transmitted data using a dedicated dual band wireless connection to the operator computer. All the devices, but the smell display, were connected directly to the robot-operator computer. The smell display used a dedicated Fedora Linux server machine and transmitted data to the operator computer using a dedicated local wired network.
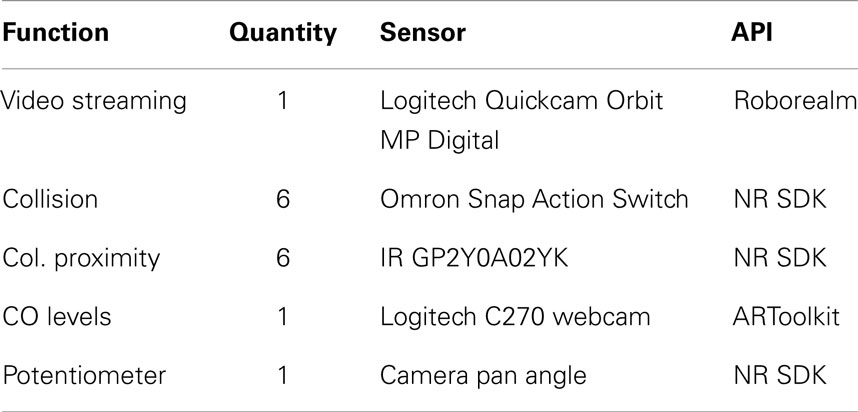
Table 5. Study #4 robot sensors, their quantity, function, and APIs.
The smell display (Figure 7B) was composed of a USB fan and a USB humidifier. The humidifier was filled with 100 ml of water and 5 ml of Rosemary essential oil. The humidifier was connected to a USB hub whose power was controlled on a per-port basis. The control of the amount of smell dispersed to the operator was done by controlling the continuous amount of time the humidifier was left on. The humidifier was placed inside the lower compartment of the white box (6″ × 12″ × 6″) supporting the fan, so that it was hidden from the subject’s view. Since the fan was kept on during the entire study, subjects could only detect the smell feedback activation by sensing the smell variation in the air. The device was placed about half meter away from the user to his front left, and horizontally pointed toward his head. The intensity of the Rosemary smell display remotely emulated the CO levels in the air where the robot was located. CO and CO2 sensors are used by USAR robot teams during a rescue mission in a catastrophic event (e.g., building collapse) to detect robot closeness to fire or victims.
Robot interface
The visual interface was similar to the ones in previous studies with two main differences. First, the yellow dots of the visual display became red if a collision occurred. For example, by looking at the ring in Figure 8, it is not only apparent that a large object is behind the robot but also that the robot is colliding with it on its rear right. Second, a carbon monoxide (CO) level bar was now presented in the bottom right corner of the screen.
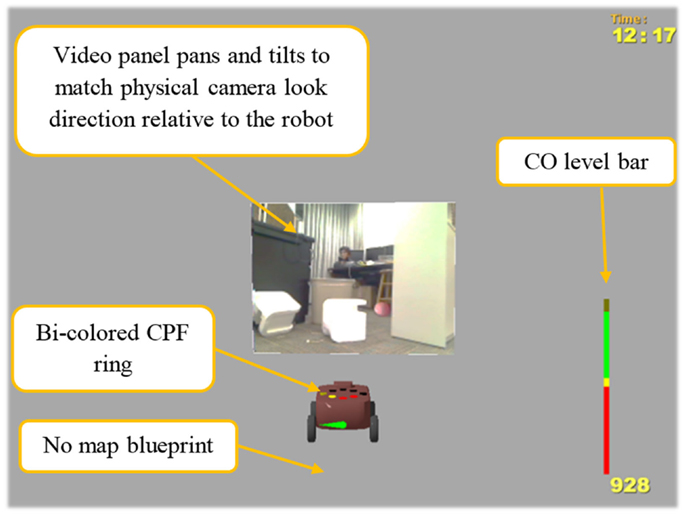
Figure 8. Visual interface for study #4.
Moreover, the interface did not present a map blueprint underneath the robot avatar. The previous studies have shown that improvements in multi-sensory interfaces are present even when such blueprint was present. Hence, not having it should not affect results. In fact, it should lead to even more evidenced improvements provided by the multi-sensory interface. And because a real robot is used, the video is now streamed from its camera in the real remote environment (Figure 8).
Since the study was run in a university lab, the levels of CO in the air could not be changed. The change in CO level was simulated using augmented reality markers placed on the ceiling above the location of each of the red circles. The robot camera pointing to the ceiling would detect proximity to the closest marker using the ARToolkit library and calculate the distance between the robot and the marker. The closer the robot was to a marker (<1 m), the higher the CO level reported. The smell feedback display then mimicked the behavior of the visual CO level bar. The higher the bar level, the more intense was the smell of Rosemary in the air. This smell was chosen based on results showing its positive effects on memory and alertness (Moss et al., 2003; Herz, 2009).
Notice that all the non-visual interfaces provided redundant display of data that was already presented by some component of the visual interface. Therefore, an important question this study attempted to answer was whether or not and how multi-sensory feedback reinforcement could actually affect subjects and their task performance.
Methodology
The study had a between-subjects design and the IVs were the type and level of multi-sensory feedback subjects were exposed to. The four possible types of multi-sensory interfaces are presented in Table 6. Interface 1 was a visual-only interface, presenting all the robot-sensed data on the computer screen. Interface 2 was built upon Interface 1 by adding audio feedback. Interface 3 was built upon Interface 2 by adding vibro-tactile feedback. Interface 4 was built upon Interface 3 by adding smell feedback. The vibro-tactile and audio feedback used were the same as in study #3.
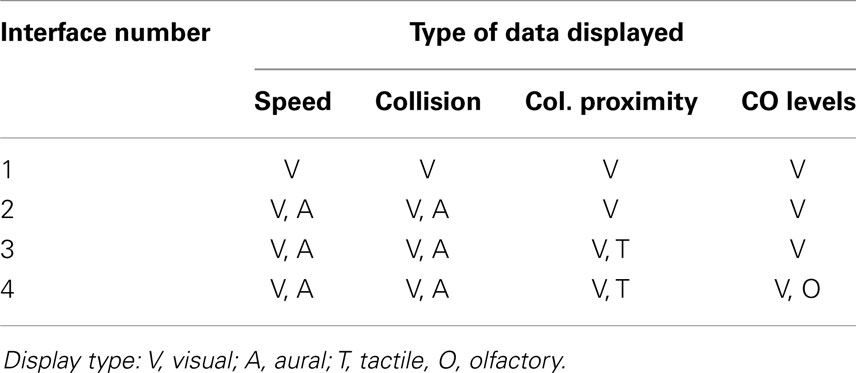
Table 6. The four interface treatments for study #4.
Because of the highly perceptual nature of the study, besides applying the other questionnaires used in study #3, subjects were asked questions about claustrophobia, color-blindness, hearing, or olfactory problems and allergy to any smells or Rosemary before participating in the study. If qualified for the study, a subject would come to the lab and participate in the study in a two-hour session between 8 a.m. and 8 p.m. Subjects were compensated with course credits, if registered as students to a specific Social Sciences course. They were also rewarded with snacks after the study was completed.
In order to balance the pool of subjects among treatments, they were distributed among treatments so that each treatment had a similar number of subjects with experience scores of different levels. Experience with robots and videogames were given double the weight when distributing to a group because of the very robotic nature of the study.
Hypotheses
Based on the results from previous studies (Johnson et al., 2003; Moss et al., 2003; Bloomfield and Badler, 2007; Blom and Beckhaus, 2010; de Barros et al., 2011; de Barros and Lindeman, 2012, 2013), the following hypotheses were formulated:
H4.1. The addition of redundant vibro-tactile and audio CPF to a visual-only interface should enhance the robot-operator navigation performance;
H4.2. The addition of smell feedback to the multi-sensory interface should enhance the operator search performance;
H4.3. The addition of redundant smell feedback should lead to improvement in operator memorization of the environment layout.
Results
A total of 18 females and 30 males participated in the study (age: M = 23, SD = 6 years and 10 months). Even though the pool per interface treatment was small (12 subjects), the data analysis of this study led to a few interesting results. The relevant results for the DVs are presented in Table 7.
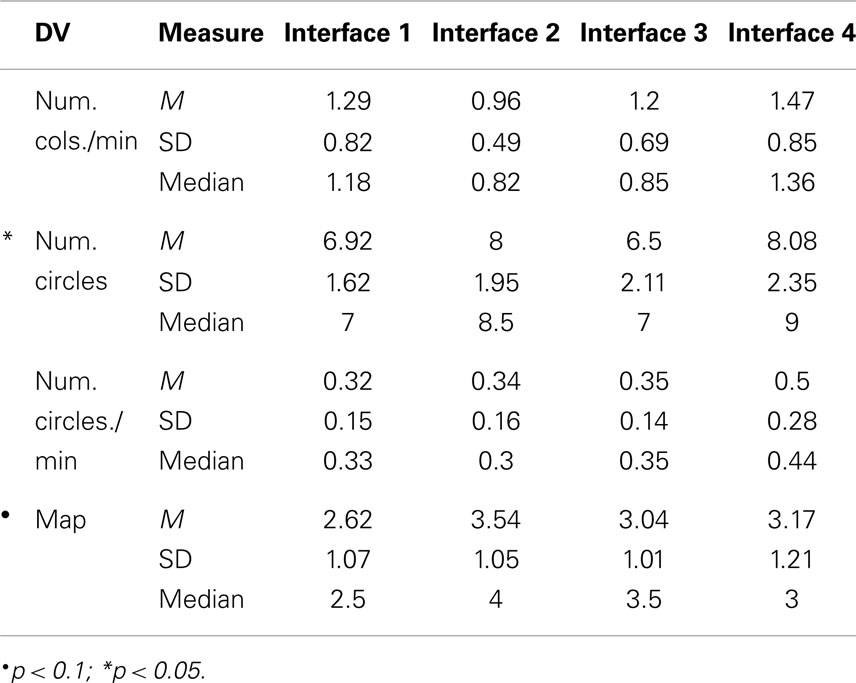
Table 7. DV results for different interface treatments in study #4.
For the number of circles found (Table 7), a SSD was detected for the number of circles found per minute between Interfaces 1 and 4 (W = 14.0, Z = −1.961, p = 0.052, R = −0.200; η2 = 0.145, Figure 9A). This supports H4.2 and is an indication that having the redundant feedback for CO did help subjects find more circles per minute.
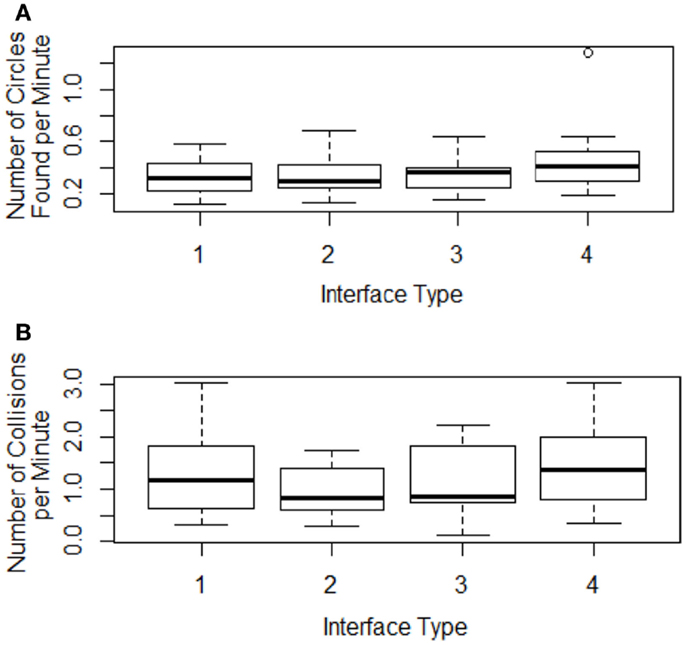
Figure 9. Variations in the (A) number of circles found per minute and (B) number of collisions per minute among interface treatments.
For the number of robot collisions, even though no SSD was found, a visible decrease in the number of collisions per minute was noticed for Interfaces 2 and 3 (Figure 9B). It follows the same pattern obtained in previous studies. The results did not show SSDs, however. A possible explanation for that would be the fact that the data could not be normalized on a per-subject basis.
Nevertheless, the same drop of 30% in the median for the number of collisions per minute obtained with SSD by study #3 with a simulated robot was also obtained in this study when audio feedback was added (Table 8). This leads us to believe that the results with a real robot are consistent with the results obtained with simulated robots. These results partially confirm H4.1 at least in terms of the audio-enhanced Interface 2, although no SSD was found [F(3, 44) = 1.048, p = 0.381, η2 = 0.061].
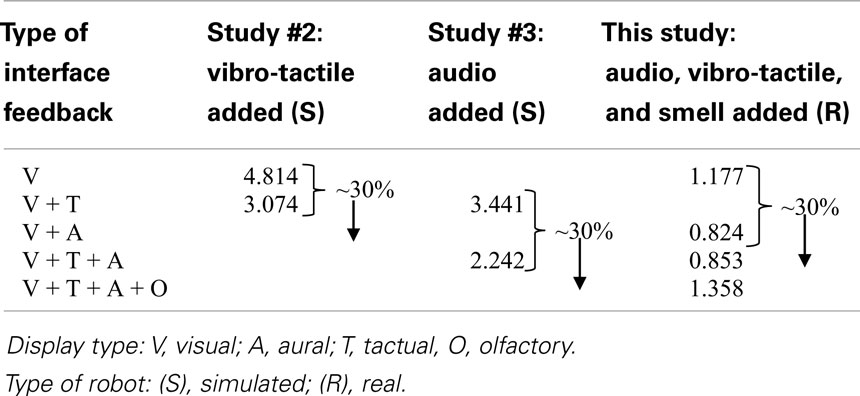
Table 8. The same drop in the median number of collisions that was detected in studies using simulated robots was also detected with the real robot.
In study #2, a decrease of 30% was also detected when the vibro-tactile belt was added to the visual interface. This variation, however, was not detected here. We believe the reason behind the lack of improvement was due to difficulty in controlling a physical robot. Subjects spent long periods of time in each section of the environment dealing with navigational control problems (e.g., turning sideways or moving back and forth). During that time, subjects would already be aware of the surroundings and would be simply readjusting their navigation direction. However, during that same period of time, they would be continuously receiving vibro-tactile feedback. This might have led subjects to ignore this feedback most of the time, even if the robot was really close to objects. Problems such as these were not frequent when using a simulated robot, however, and such difference in behavior would be a reasonable explanation for the difference in the results. Additionally, during the experiment, it was noticed after the fact that for a few subjects two of the belt tactors had their positions accidentally swapped in the belt. This might also have added bias or at least more noise to the results.
Interestingly, the group exposed to the smell feedback display (Interface 4) had the worst collision performance levels of all groups. This was unexpected, since the smell display did not provide any collision related information, but instead emphasized the response to robot closeness to the red circles. This increase in collisions could be an indication of subject cognitive overload. However, another possible explanation, and perhaps a more plausible one, is that smell feedback affected subjects’ behavior during the task, increasing their attention to circle finding. The smell feedback served as a supplement to the visual bar and led to less CO alert misses. Moreover, since the smell feedback or visual bar did not contain any directional information on where the circle could be relative to the robot, the extra effort put into navigating around and looking for circles during the increased number of CO alerts led to an increase in the number of collisions. On the other hand, as previously reported in Figure 9A, this increase in alerts also led to an increase in the number of circles found.
Subjective measures. For the Stroop task, specifically for the percent of incorrect responses, improvements with SSD where detected for Interface 4 when compared to Interface 1 (W = 53.0, Z = 2.638, p = 0.006, R = 0.269; η2 = 0.102) and Interface 2 (W = 44.0, Z = 1.772, p = 0.084, R = 0.181; η2 = 0.105). This is a good indication that the multi-sensory feedback is having a small but positive effect on subjects’ cognition. In terms of response time, a visible increase was detected for Interface 4 compared to Interface 3 [χ2(1, N = 12) = 3.853, p = 0.05; η2 = 0.107], which had the fastest median response time. It is believed that the reason for such an increase for Interface 4 was the fact that, out of curiosity, subjects were diverting their attention from the computer screen to the smell feedback device from time to time whenever they smelled Rosemary to see if they could see the device at work. In terms of the number of unanswered questions, when compared to the control Interface 1, 2, and 3 [χ2(1, N = 12) = 4.083, p = 0.043] led to a small reduction in the number of unanswered questions, but only the latter led to SSD (η2 = 0.052). This could also be an indication of lowering in subjects’ visual cognitive load. This supports H4.1. On the other hand, a trend indicated that Interface 4 led to an increase in that variable compared to Interface 3 [χ2(1, N = 12) = 2.613, p = 0.106; η2 = 0.109]. It is believed the same cause for the increase in response time for Interface 4 has also impacted the number of unanswered questions for this interface.
In the analysis of the sketchmap quality results (Figure 10A), trends indicated improvements caused by Interface 2 (W = 11.0, Z = −1.616, p = 0.111, R = −0.165; η2 = 0.169), and Interface 4 (W = 13.0, Z = −1.633, p = 0.109, R = −0.167; η2 = 0.057), which partially confirms H3.3. The results go in hand with results obtained previously (Moss et al., 2003; de Barros and Lindeman, 2013), and Wickens’ Multiple Resource Theory (Wickens, 2002).
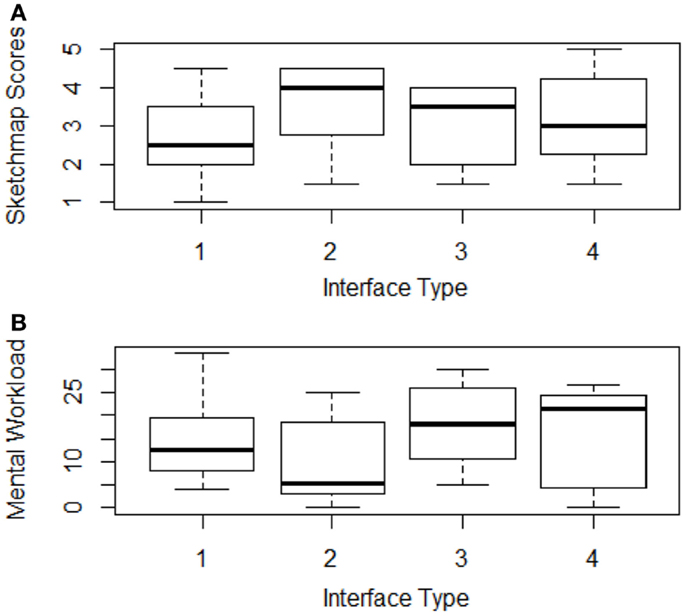
Figure 10. Effects on users’ cognition for different interfaces as measured by (A) map sketch quality and (B) mental workload.
In terms of mental workload, results showed that Interfaces 3 and 4 increased users’ mental workload (Figure 10B), while Interface 2 reduced it. A SSD was detected only between the results of Interfaces 2 and 3 (W = 2.0, Z = −2.643, p = 0.008, R = −0.270; η2 = 0.185). This shows that the Belt was the only interface that caused a significant impact on mental work load, but only when compared to the audio-enhanced interface. Physical, temporal, performance, effort, and frustration workloads were not affected much by the type of interface used and did not lead to any SSDs. Interestingly, when all workload factors were put together, a trend indicated that Interface 2 led to a higher workload level than Interface 3 (W = 62.0, Z = 1.804, p = 0.077, R = 0.184; η2 = 0.185). Moreover, Interface 3 led to less overall subject workload than Interface 2 despite its increase in multi-sensory complexity. Because the authors believe that the NASA-TLX is an extensive enough test to cover all the different types of workload, we did not expect this last result that the interface with feedback for three senses, not the one with feedback for one or four senses (extremes) would lead to the least amount of workload.
In terms of users’ health, most variations were related to discomfort, fatigue, headache, and eyestrain. For general discomfort, Interface 4 led to more discomfort than other interfaces with SSD [F(3, 44) = 2.588, p = 0.065, η2 = 0.15]. For fatigue, Interface 3 led to more fatigue compared to Interface 2 [χ2(1, N = 12) = 4.571, p = 0.032, η2 = 0.175]. This could be due to the use of the belt. However, the same result was not detected in Interface 4, where the belt vibro-tactile feedback was also present.
Subject comments. Subject comments reflect in part the analysis already presented in previous sections. They also help explain some of the results obtained. Overall, subjects enjoyed the enhancements to the interface and most of the time reported it to be easy to learn but hard to master. In terms of problems operating the robot, delay and movement friction were the main causes of frustration during the experiment.
The type of feedback with most positive comments was the sound feedback, followed by vibro-tactile, visual, and smell feedback. For the sound feedback, the engine sound had more negative comments than the collision sound. This could have been due to the delay between this sound (locally generated sound events) and the robot movement (remotely captured video stream).
For the vibro-tactile belt, even though subjects commented it was helpful in estimating distance to objects around robots, the interface became annoying when the subjects were already aware of the object being reported by the interface. In addition, after prolonged use, subjects commented on having the area of the skin where the belt vibrated become itchy.
For the smell feedback, most complaints related to subjects being unable to detect the smell, even when the CO bar was reporting high values of CO in the air. A cause for that could have been that the fans used for air ventilation were too effective and dissipated the smell too quickly. In addition, there was an expectation that smell would be sensed as soon as the CO bar went up. This could also have affected their judgment of the feedback.
Conclusion. This study has provided evidence of the viability of designing multi-sensory interfaces with feedback for up to four senses, each of which can bring further benefits to user task performance. In the case of this study, the multi-sensory enhancements brought benefits to both the navigation and the search tasks. Moreover, the study has also verified that the results of previous studies using a simulated robot in a virtual environment can be obtained with a real robot in a physical environment. This is an important result because it confirms the potential applicability of multi-sensory interfaces to improve performance in real USAR robot teleoperation tasks.
Discussion
This article summarized the findings of four studies on multi-sensory interfaces for USAR teleoperated robotics. Three studies involved a simulated robot and environment, and were followed by a study with a real robot and environment for validation of the results. A summary of the most important results obtained is shown in Table 9.
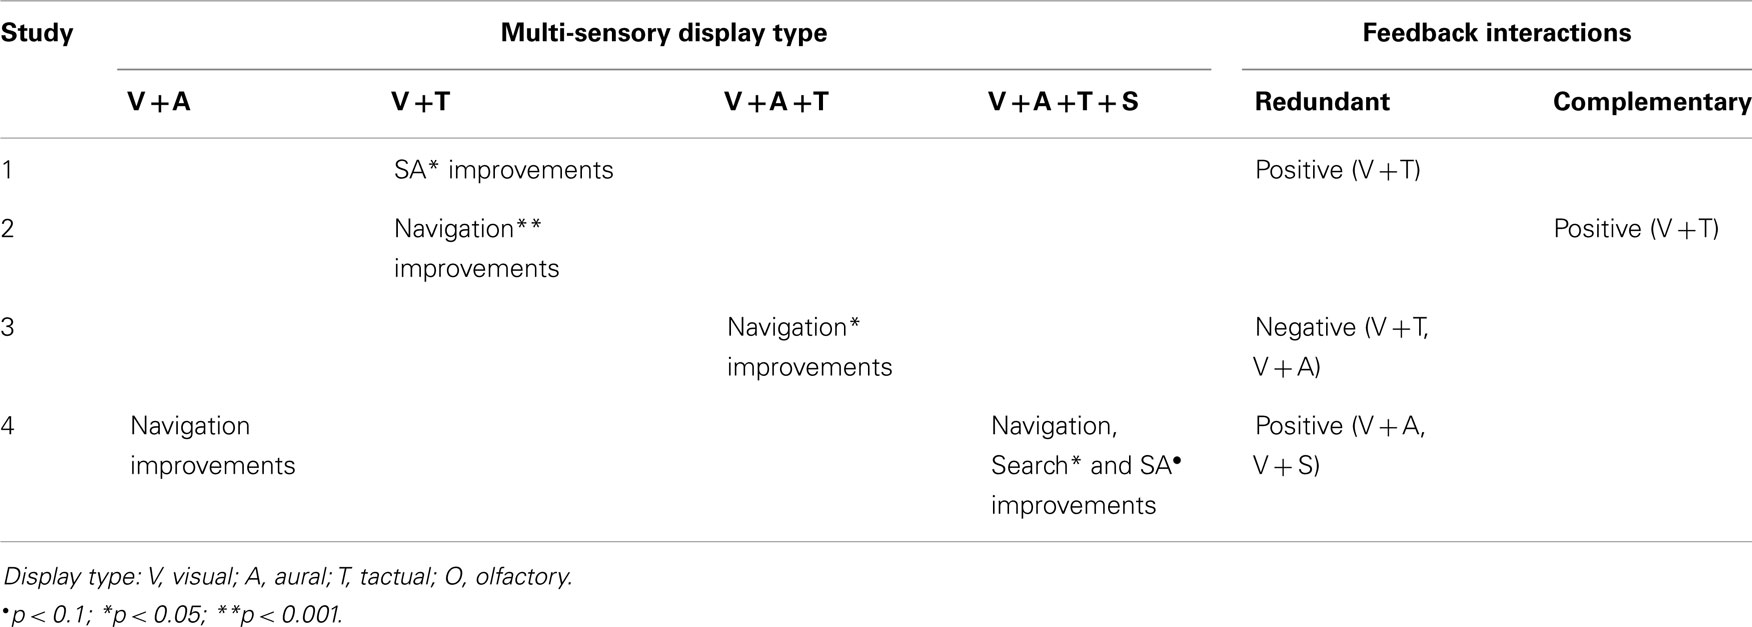
Table 9. Summary of results for the four studies in terms of navigation and search performance and interactions between types of feedback.
Study #1 results indicated that the combined use of both visual and vibro-tactile feedback improved the operator global SA. It has shown that a sub-optimally designed visual interface can leverage from other types of feedback with redundant data to enhance the robot-operator perception and task performance.
Study #2 results confirmed that performance can indeed be improved through the use of complementary vibro-tactile feedback even if the interface is not optimally designed. It also showed that care must be taken when selecting how information is displayed, so that novel interfaces do not increase the cognitive burden on the operator.
Study #3 results showed that adding audio feedback to a bi-sensory interface further enhanced operator performance in terms of number of collisions. It verified that it is possible to design multi-sensory interfaces for three senses and further improve operator performance as long as there is a balance of the data distribution among the senses. It also showed that redundant feedback is not always beneficial to the robot operator.
Study #4 used a real robot and added smell feedback to extend the multi-sensory interface used in study #3. The real robot helped validate the simulated results from previous experiments while the smell feedback further explored the idea of how complex multi-sensory feedback interfaces can become and still be usable and useful. Despite differences in the simulated versus real robot experimental scenarios, results still pointed to performance enhancements as multi-sensory interfaces were gradually added. In addition, it proved that the benefits of using multi-sensory feedback interfaces are not restricted to specific functionalities of the interface, such as providing CPF. In this study, improvements were detected for navigation and search tasks, as well as SA.
When put together, the results of these studies seem to verify how beneficial multi-sensory interfaces can be to the user, specifically to a robot operator. If well designed, even multi-sensory interfaces involving four of the human senses could be used to improve performance with minor effects on cognitive load. Overall, our empirical evidence shows that multi-sensory redundant interfaces are beneficial to the user if they allow the enhancement of the users’ omni-directional perception and understanding of task-relevant data. Last, by the end of study #4, we had developed a comprehensive methodology to evaluate multi-sensory interfaces that proposes a set of measures for presence, workload, cognitive load, health, SA, and performance, the latter two being task-specific.
The reader might argue that the results presented were a consequence of how the interfaces were designed. Had a well-designed visual-only interface been designed, perhaps the addition of multi-sensory feedback would have had no effect at all on the robot-operator performance and SA. In that regard, it might be true that there could exist a better visual interface design for a robot-teleoperated search-and-rescue task. However, as presented in Section “Robot Interface,” the visual interface used in the four studies was the result of an amalgamation of the qualities of the best interface designs that other expert research groups in the area have developed. Therefore, the studies have employed the state-of-the-art visual interface designs and guidelines present in the USAR robot teleoperation community. The same approach was taken in the design of the other types of feedback as well. Moreover, study #2 has shown that, at least for vibro-tactile feedback, a second type of feedback still helps supplement deficient or cognitively overwhelming visual feedback even if the interface this redundant feedback is sub-optimally designed. Last, even if the “perfect” visual-feedback interface were to be devised and used, as the amount of data increases, this interface would also be incapable to effectively provide all the information to the user. The reason for that would not be its improper design, but rather the fact that the user’s visual sense would be cognitively overloaded and unable to process all the visual data being displayed in parallel. The authors believe that, the more spatial data the user is required to simultaneously perceive in a system’s interface in order to attain an optimal level of SA, the more evident the need for using a multi-sensory interface will be for that interface. In fact, at some point, even multi-sensory interfaces will be unable to improve user’s perception of large data throughput interfaces.
Nonetheless, care must be taken when designing multi-sensory interfaces. It is known that some people are more kinesthetic while others are more sensitive to sound or visuals. Because of this fact, it would be useful to have user-specific multi-sensory interfaces, which would be designed by HCI experts to optimize user’s perceptual performance and reduce cognitive load. These interface configurations could also disable or re-channel the flow of specific data from one type of feedback interface to another, constantly adapting itself to the operator’s current needs or tasks’ demand. When doing so, nonetheless, it is important to evaluate how much the switch time between interface configurations impacts task performance. A toolkit could be devised where the user would have a set of sensor data channels. Filters and data modifiers could be pre-defined for each of these channels to map the interface that is most beneficial for a specific user, situation, and task. This concept of multi-sensory customizable channels could also be applied to system input. The user could then load the desired configuration when necessary.
A logical extension of this work is the further exploration of more complex multi-sensory interfaces in USAR robotics. This work could also be extended to other areas of mission robotics, such as space exploration and hazardous materials operations. It could also be applied to interfaces for other types of automated and controlled machines and systems such as military drones, jet pilots, and submarines. Furthermore, it could be extended to any type of interface that demands high cognitive load from a user and that could have its data easily mapped across senses. Many interfaces, however, are better off being mono-sensory (e.g., spreadsheet and text editors). Over-selling multi-sensory feedback would be a mistake.
Multi-sensory interfaces are still relatively unexplored. This work contributed by pointing in directions that might bear fruit. The authors hope that the HRI and HCI research communities will make good use of these initial directions to facilitate their search for more-effective human-machine interfaces.
Conflict of Interest Statement
The authors declare that the research was conducted in the absence of any commercial or financial relationships that could be construed as a potential conflict of interest.
Acknowledgments
We would like to thank the Computer Science Department of Worcester Polytechnic Institute for the funding of this research work and the members of the WPI Interaction Lab and the WPI community for their scientific collaboration.
References
Arrabito, G. R., Ho, G., Au, H., Keillor, J. M., Rutley, M., Lambert, A., et al. (2009). “Proposed techniques for extending ecological interface design to tactile displays: using tactile cues to enhance UAV interface design,” in Proceedings of the Human Factors and Ergonomics Society Annual Meeting (San Antonio, TX), 76–80. doi: 10.1177/154193120905300117
Billinghurst, M., and Weghorst, S. (1995). “The use of sketch maps to measure cognitive maps of virtual environments,” in Proceedings of Virtual Reality Annual International Symposium (Research Triangle Park, NC), 40–47.
Blom, K. J., and Beckhaus, S. (2010). “Virtual collision notification,” in Proceedings of IEEE Symposium on 3D User Interfaces (Waltham, MA), 35–38.
Bloomfield, A., and Badler, N. (2007). “Collision awareness using vibrotactile arrays,” in Proceedings of the IEEE Virtual Reality Conference (Charlotte, NC), 163–170.
Cassinelli, A., Reynolds, C., and Ishikawa, M. (2006). “Augmenting spatial awareness with haptic radar,” in International Symposium on Wearable Computers (ISWC) (Montreux), 61–64.
de Barros, P. G. (2014). Evaluation of Multi-Sensory Feedback in Virtual and Real Remote Environments in a USAR Robot Teleoperation Scenario. Worcester Polytechnic Institute Electronic Theses and Dissertations (WPI ETD). Worcester, MA, URN: etd-042614-101502.
de Barros, P. G., and Lindeman, R. W. (2012). “Comparing vibro-tactile feedback modes for collision proximity feedback in USAR virtual robot teleoperation,” in Proceedings of IEEE Symposium on 3D User Interfaces (Costa Mesa, CA), 137–138.
de Barros, P. G., and Lindeman, R. W. (2013). “Performance effects of multi-sensory displays in virtual teleoperation environments,” in Proceedings of the 1st Symposium on Spatial User Interaction (Los Angeles, CA), 41–48.
de Barros, P. G., Lindeman, R. W., and Ward, M. O. (2011). “Enhancing robot teleoperator situation awareness and performance using vibro-tactile and graphical feedback,” in Proceedings of IEEE Symposium on 3D User Interfaces (Singapore), 47–54.
Elliott, L. R., Coovert, M. D., and Redden, E. S. (2009). “Overview of meta-analyses investigating vibrotactile versus visual display options,” in Proceedings of the 13th International Conference on Human-Computer Interaction. Novel Interaction Methods and Techniques, ed. J. A. Jacko (San Diego, CA: Springer Berlin Heidelberg), 435–443. doi:10.1007/978-3-642-02577-8_47
Endsley, M. R., and Garland, D. J. (eds). (2000). “Theoretical underpinning of situation awareness: a critical review,” in Situation Awareness Analysis and Measurement (Mahwah, NJ: Lawrence Erlbaum Associates), 1–24.
Gröhn, M., Lokki, T., and Takala, T. (2005). Comparison of auditory, visual, and audiovisual navigation in a 3D space. ACM Trans. Appl. Percept. 2, 564–570. doi:10.1145/1101530.1101558
Gwizdka, J. (2010). “Using Stroop task to assess cognitive load,” in Proceedings of the 28th Annual European Conference on Cognitive Ergonomics (Delft), 219–222.
Hart, S. G., and Staveland, L. E. (1988). “Development of NASA-TLX (task load index): results of empirical and theoretical research,” in Human Mental Workload. eds P.A. Hancock and N. Meshkati (Amsterdam: North Holland Press).
Hashimoto, Y., Nagaya, N., and Kojima, M. (2006). “Straw-like user interface: virtual experience of the sensation of drinking using a straw,” in Proceedings of the ACM SIGCHI International Conference on Advances in Computer Entertainment Technology (Hollywood, CA), 50.
Herz, R. S. (2009). Aromatherapy facts and fictions: a scientific analysis of olfactory effects on mood, physiology and behavior. Int. J. Neurosci. 119, 263–290. doi:10.1080/00207450802333953
Pubmed Abstract | Pubmed Full Text | CrossRef Full Text | Google Scholar
Iwata, H., Yano, H., Uemura, T., and Moriya, T. (2004). “Food simulator: a haptic interface for biting,” in Proceedings of IEEE Virtual Reality (Chicago, IL), 51–57.
Jacoff, A., Messina, E., Weiss, B. A., Tadokoro, S., and Nakagawa, Y. (2003). “Test arenas and performance metrics for urban search and rescue,” in Proceedings of IEEE/RSJ International Conference on Intelligent Robots and Systems, Vol. 3 (Las Vegas), 3396–3403.
Johnson, C. A., Adams, J. A., and Kawamura, K. (2003). “Evaluation of an enhanced human-robot interface,” in Proceedings of the IEEE International Conference on Systems, Man, and Cybernetics (Taipei), 900–905.
Kaber, D. B., Wright, M. C., and Sheik-Nainar, M. A. (2006). Investigation of multi-modal interface features for adaptive automation of a human–robot system. Int. J. Hum. Comput. Stud. 64, 527–540. doi:10.1016/j.ijhcs.2005.11.003
Kennedy, R. S., Lane, N. E., Berbaum, K. S., and Lilienthal, M. G. (1993). Simulator sickness questionnaire: an enhanced method for quantifying simulator sickness. Int. J. Aviat. Psychol. 3, 203–220. doi:10.1207/s15327108ijap0303_3
Lindeman, R. W. (2003). “Virtual contact: the continuum from purely visual to purely physical,” in Proceedings of the Annual Meeting of the Human Factors and Ergonomics Society (Denver, Colorado), 2103–2107.
Lindeman, R. W., Sibert, J. L., Mendez-Mendez, E., Patil, S., and Phifer, D. (2005). “Effectiveness of directional vibrotactile cueing on a building-clearing task,” in Proceedings of SIGCHI Conference on Human Factors in Computer Systems (Portland), 271–280.
Micire, M., Desai, M., Drury, J. L., McCann, E., Norton, A., Tsui, K. M., et al. (2011). “Design and validation of two-handed multi-touch tabletop controllers for robot teleoperation,” in Proceedings of the International Conference on Intelligent User Interfaces (Haifa), 145–154.
Moss, M., Cook, J., Wesnes, K., and Duckett, P. (2003). Aromas of Rosemary and lavender essential oils differentially affect cognition and mood in healthy adults. Int. J. Neurosci. 113, 15–38. doi:10.1080/00207450390161903
Pubmed Abstract | Pubmed Full Text | CrossRef Full Text | Google Scholar
Narumi, T., Nishizaka, S., Kajinami, T., Tanikawa, T., and Hirose, M. (2011). “Augmented reality flavors: gustatory display based on edible marker and cross-modal interaction,” in Proceedings of the SIGCHI Conference on Human Factors in Computer Systems (Vancover), 93–102.
Nehme, C. E., and Cummings, M. L. (2006). Audio Decision Support for Supervisory Control of Unmanned Vehicles. Literature Review. Cambridge, MA: MIT.
Nielsen, C. W., Goodrich, M. A., and Ricks, B. (2007). Ecological interfaces for improving mobile robot teleoperation. IEEE Trans. Robot. 23, 927–941. doi:10.1109/TRO.2007.907479
Noguchi, D., Ohtsu, K., Bannai, Y., and Okada, K. (2009). “Scent presentation expressing two smells of different intensity simultaneously,” in Proceedings of the Joint Virtual Reality Eurographics Conference on Virtual Environments (Bellevue), 53–60.
Suarez, J., and Murphy, R. R. (2012). “Using the kinect for search and rescue robotics,” in IEEE International Symposium on Safety, Security, and Rescue Robotics (College Station, TX), 273–274.
Thrun, S., Thayer, S., Whittaker, W., Baker, C., Burgard, W., Ferguson, D., et al. (2004). Autonomous exploration and mapping of abandoned mines. IEEE Robot. Automat. Mag. 11, 79–91. doi:10.1109/MRA.2004.1371614
Usoh, M., Catena, E., Arman, S., and Slater, M. (2000). Using presence questionnaires in reality. Presence Teleop. Virtual Environ. 9, 497–503. doi:10.1162/105474600566989
Van Erp, J. B. F., and Van Veen, H. A. H. C. (2004). Vibrotactile in-vehicle navigation system. Transport. Res. 7, 247–256. doi:10.1016/j.trf.2004.09.003
Wickens, C. D. (2002). Multiple resources and performance prediction. Theor. Issues Ergon. Sci. 3, 159–177. doi:10.1080/14639220210123806
Witmer, B. G., and Singer, M. J. (1998). Measuring presence in virtual environments: a presence questionnaire. Presence Teleop. Virtual Environ. 7, 225–240. doi:10.1162/105474698565686
Yanagida, Y., Kawato, S., Noma, H., Tomono, A., and Tetsutani, N. (2004). “Projection-based olfactory display with nose tracking,” in Proceedings of IEEE Virtual Reality (Chicago, IL), 43–50.
Yanco, H. A., Drury, J. L., and Scholtz, J. (2004). Beyond usability evaluation: analysis of human-robot interaction at a major robotics competition. Hum. Comput. Interact. 19, 117–149. doi:10.1207/s15327051hci1901&2_6
Yanco, H. A., Keyes, B., Drury, J. L., Nielsen, C. W., Few, D. A., and Bruemmer, D. J. (2007). Evolving interface design for robot search tasks. J. Field Robot. 24, 779–799. doi:10.1002/rob.20215
Keywords: multi-sensory feedback, robot teleoperation, visual, audio, vibro-tactile and smell displays, urban search-and-rescue
Citation: de Barros PG and Lindeman RW (2014) Multi-sensory urban search-and-rescue robotics: improving the operator’s omni-directional perception. Front. Robot. AI 1:14. doi: 10.3389/frobt.2014.00014
Received: 18 June 2014; Accepted: 18 November 2014;
Published online: 02 December 2014.
Edited by:
Anatole Lécuyer, Institut National de Recherche en Informatique et en Automatique, FranceReviewed by:
Carlos Andújar, Universitat Politècnica de Catalunya, SpainGuillaume Moreau, Ecole Centrale de Nantes, France
Copyright: © 2014 de Barros and Lindeman. This is an open-access article distributed under the terms of the Creative Commons Attribution License (CC BY). The use, distribution or reproduction in other forums is permitted, provided the original author(s) or licensor are credited and that the original publication in this journal is cited, in accordance with accepted academic practice. No use, distribution or reproduction is permitted which does not comply with these terms.
*Correspondence: Robert W. Lindeman, Human Interaction in Virtual Environments Laboratory, Department of Computer Science, Worcester Polytechnic Institute, 100 Institute Road, Worcester, MA 01609, USA e-mail: gogo@wpi.edu