DDDAS-based information-aggregation for crowd dynamics modeling with UAVs and UGVs
 Yifei Yuan
 Zhenrui Wang
 Young-Jun Son
 Jian Liu
- Department of Systems and Industrial Engineering, University of Arizona, Tucson, AZ, USA
Unmanned aerial vehicles (UAVs) and unmanned ground vehicles (UGVs) collaboratively play important roles in crowd tracking for applications such as border patrol and crowd surveillance. Dynamic data-driven application systems (DDDAS) paradigm has been developed for these applications to take advantage of real-time monitoring data. In the DDDAS paradigm, one crucial step in crowd surveillance is crowd dynamics modeling, which is based on multi-resolution crowd observation data collected from both UAVs and UGVs. Data collected from UAVs capture global crowd motion but have low resolution while those from UGVs have high resolution information of local crowd motion. This paper proposes an information–aggregation approach for crowd dynamics modeling by incorporating multi-resolution data, where a grid-based method is developed to model crowd motion with UAVs’ low-resolution global perception, and an autoregressive model is employed to model individuals’ motion based on UGVs’ detailed perception. A simulation experiment is provided to illustrate and demonstrate the effectiveness of the proposed approach.
Introduction
Crowd surveillance and control is one of the most important tasks for border patrol activities. It involves multiple coordinating modules, such as sensory data collection and processing, target detection and classification, object movement tracking, and vehicle path planning and coordination (Khaleghi et al., 2013). To ensure the effectiveness of crowd surveillance, crowd dynamics models need to be developed as the basis for tracking crowd movement and devising various crowd control strategies. With advancement of robotics and sensing technology, traditional stationery surveillance equipments, such as ground sensor and light tower, are gradually upgraded into mobile surveillance equipments, such as unmanned aerial vehicles (UAVs) and unmanned ground vehicles (UGVs), for better mobility, flexibility, and larger searching/monitoring area. Such hardware advancements also make real-time dynamic data (e.g., sensory data of UAVs and UGVs) readily available and create great potentials to improve crowd dynamics modeling and subsequent model-based decision-making.
To take advantage of the real-time dynamic monitoring data available in modern crowd surveillance systems, dynamic data-driven application systems (DDDAS) paradigm has been developed recently to improve data acquisition, processing, and modeling. The essential concept of DDDAS paradigm is the ability to dynamically incorporate data into application systems and in reverse, the ability to dynamically steer measurement processes (Darema, 2004). DDDAS has been successfully applied to various application areas, such as supply chain management (Celik et al., 2010), wildfire prediction (Denham et al., 2012; Rodriguez-Aseretto et al., 2013), traffic management (Lin et al., 2012), fluid-thermal system modeling (Knight et al., 2006), electricity dispatch control (Celik et al., 2013), and robotics (McCune et al., 2013; Peng et al., 2014). In crowd surveillance and control, DDDAS has also demonstrated its great potential in improving system modeling and management (Khaleghi et al., 2013; Wang et al., 2013).
In DDDAS-based crowd surveillance and control via UAVs and UGVs, a key system performance enhancer is the multi-resolution data collected from UAVs and UGVs. Direct combination of such data is obviously problematic and integrating them in a coherent manner is an important yet challenging task. Specifically, to obtain a global view of the crowd, UAVs need to fly at a high altitude, capturing low-resolution data containing information such as shape and location of the whole crowd. At a high altitude, it is extremely difficult, if not possible, to detect individuals from aerial images, because the individuals are shown as vague pixels in the images. To capture the detailed information of individuals in a crowd, UGVs can be deployed close to the crowd. However, UGVs may not observe all the individuals in the crowd due to their limited detection range. For further illustration, an exemplary scenario from a top-down view is given in Figure 1A. In the figure, individuals (including people and two vehicles) are tracked by one UAV and three UGVs. The UAVs detection range is illustrated as a solid circle. UGVs are illustrated as solid squares, and their detection ranges are illustrated as sector-shaped areas. Note that these UGVs only detect a small portion of individuals. A low-resolution data collected by UAVs has a broad coverage of the crowd, but does not contain detailed information, as shown in Figure 1B. Such low-resolution images cannot be utilized alone to accurately model crowd dynamics. The high-resolution data collected by UGVs, as shown in Figure 1C, contain detailed information of individuals, but cannot be directly used for modeling the dynamics of the entire crowd due to UGVs’ limited coverage range of the crowd. As shown in Figure 1D, it will be desirable to collect high-resolution data from UGVs to compensate the limitation of using low-resolution data alone. To achieve this objective, a DDDAS-based information–aggregation approach is proposed to utilize multi-resolution data for the improvement of the crowd dynamics modeling.
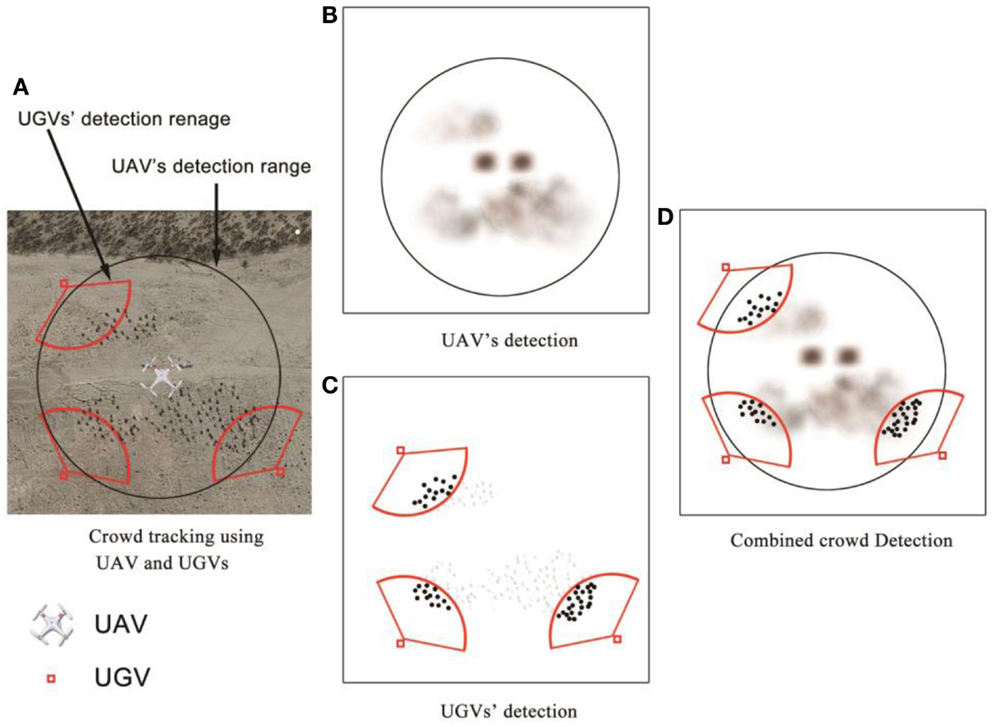
Figure 1. Crowd tracking using UAVs and UGVs. (A) White UAV symbol represents UAV’s position, black circle is UAV’s detection range. Red small squares represent UGVs and the red solid sectors represent their detection range. (B) Black cloud-like pixels represent the UAVs’ detection image. (C) Black dots represent the individuals detected by UGVs. (D) Dots and cloud-like pixels represent aggregated information from both UAV and UGVs.
Extensive methods have been developed for crowd dynamics modeling. Zhan et al. (2008) and Jacques et al. (2010) presented comprehensive reviews of methods developed for crowd analysis and dynamics modeling. These methods can be categorized into two groups. The first group focuses on modeling dynamics of individuals in the crowd and relies on effective detection of individuals from image data. Rittscher et al. (2005) studied the individual dynamics with autoregressive (AR) models and investigated the short time occlusion between individuals. Different filtering techniques have been also considered for modeling dynamics of individuals, such as Kalman filter (Wu and Nevatia, 2007), extended Kalman filter (Masoud and Papanikolopoulos, 2001), unscented Kalman filter (Wan and Van der Merwe, 2000), and particle filter (Thiran et al., 2004).
Despite these recent advances in tracking individuals in crowds, effective detection can still be extremely challenging in some scenarios. For example, individuals in high-density crowd often suffer from severe occlusions (Dridi, 2014). In addition, if there is large distance between the crowd and the camera, the obtained images may not have enough resolution to distinguish individuals. Both of these factors will increase the difficulty in detecting individuals and modeling the crowd dynamics. To consider this scenario, another method of modeling crowd dynamic is to treat the crowd as a single object and study its motion. Boghossian and Velastin (1999) studied the crowd tracking by adopting a non-parametric approach and assumed continuity in motion of the crowd as a whole. A procedure for estimating the paths and directions of the crowd motion was proposed. The procedure utilized a block matching algorithm to determine the motion, represented by optical flow method (Horn and Schunck, 1981), of each pixel between consecutive video frames. However, the matching algorithm based on pixel intensity value was very sensitive to image noise. To capture the interaction forces in the crowd and the effects of environment on crowd motion, social force model was considered by Mehran et al. (2009) to identify abnormal motions in the crowd. In this method, optical flow was calculated for the estimation of social force.
For crowd dynamics modeling with observations from UAVs and/or UGVs, existing approaches have the following limitations:
i. as the observations collected from UAVs are with low resolution, it will be difficult to detect individuals. Thus, it is unrealistic for the existing modeling methods to assume that the detected individual locations are available inputs,
ii. approaches in modeling the whole crowd motion require optical flow method as an initial step. Since optical flow method is sensitive to noise (Srinivasan and Chellappa, 1999), it will not be effective to work on the low resolution image,
iii. although there was a method (Moseley et al., 2009) that allowed cooperative tracking using UAVs and UGVs, the method was proposed for a different scenario where only one moving target was considered and all the UAVs and the UGVs could observe the target with enough resolution. It is not applicable to the crowd dynamics modeling considered in this paper, since UAVs and UGVs have monitoring observations with different resolutions.
To overcome these limitations, this paper proposes a DDDAS-based information–aggregation approach to modeling crowd dynamics with UAVs and UGVs observations. Specifically, the following contributions are made in this paper.
• A crowd dynamics modeling algorithm is proposed based on occupancy grid for low-resolution data obtained by UAVs. This approach aims to take advantage of UAVs’ global perception and model crowd motion.
• An information–aggregation framework is proposed to fuse information from both UAVs and UGVs and improve the performance of crowd dynamics modeling.
This paper is organized as follows: Section “Proposed Method” explains the proposed approach. Section “Grid-Based Coarse Crowd-Dynamics Modeling from UAVs’ Data” discusses the crowd dynamics modeling algorithm, which first discretizes the two dimensional space where crowd resides into equally sized grid cells, and then identifies the crowd dynamics through estimating the probability of cell state occupancy at next time stamp based on its previous state and corresponding neighboring cells. Section “Regression-Based Individuals-Dynamics Modeling from UGVs’ Data” presents the information–aggregation algorithm that improves modeling performance of UAVs based on aggregated UGVs’ prediction outcome. A numerical simulation experiment is discussed in Section “Numerical Simulation Study.” Section “Conclusion” draws the conclusion of the paper.
Proposed Method
As mentioned in Section “Introduction,” UAVs collect low-resolution data with a broad monitoring range and UGVs collect high-resolution data with a small monitoring range. To take advantages of both UAVs’ broad perception and UGVs’ detailed perception, two different crowd-dynamic modeling approaches are introduced. The information–aggregation method is then presented to aggregate UAVs’ and UGVs’ prediction.
Grid-Based Coarse Crowd-Dynamics Modeling from UAVs’ Data
The crowd dynamics model characterizes the movement of crowd and can be used for motion prediction. Based on observations of the crowd location up to the current time stamp, motion prediction can be made for the location and the speed of a crowd at a subsequent time stamp. To implement the motion prediction, the crowd dynamics needs to be identified first. One possible way to identify the crowd dynamics is to identify the dynamics of all the detected individuals. However, a crowd may be shown in a UAV image as a group of pixels with different shade, as shown in Figure 1B. It is difficult to distinguish individuals from such images. Furthermore, modeling a crowd based on all the individuals will result in significant computational load and may delay UAVs’ response in critical decision-making. Another possible method to identify the crowd dynamics is to model the dynamics of the crowd center. With the UAVs’ low-resolution data, it will be straightforward to model the dynamics of crowd centers to avoid demanding computations. By using this method, however, crowd merging or crowd splitting will not be detected due to information loss.
Considering the limitations of the above two methods, the grid-based crowd-dynamics modeling is proposed as a compromising method. Although UAVs cannot provide detailed information of individuals, a global perception of crowds, such as their shape and moving tendency, can be obtained. To utilize such information to improve dynamics modeling, a grid-based crowd representation method of crowd location information is firstly introduced. This research focuses on a two dimensional case and it can be easily extended into three dimension.
Grid-based crowd state representation
To represent the crowd location, an occupancy grid is created to divide the two-dimensional plane into equal-sized square cells, with each cell representing a region with an edge of length l. There are two and only two possible states for each cell, namely “occupied” state and “empty” state. A cell is considered “occupied” when the number of individuals in it exceeds a certain threshold λ. As a result, the cell will become a dense region in the UAV images such that the computer vision algorithm will conclude a high probability of cell occupancy. This computer-vision-based cell occupancy determination has been extensively studied (Gaszczak et al., 2011; Khaleghi et al., 2013), and will be assumed as given in this paper. Figure 2 illustrates a grid with an occupancy threshold λ = 5. Figure 2A shows the individual locations at time t − τ, t, and t + τ with a grid in the background. In this paper, the adopted time unit is τ, which can be set to different values to generically represent a variety of situations. Specifically, τ is restricted by hardware capability, camera frame time, and crowd speed. Because the value of τ does not affect the modeling, it denotes all the possible values of time unit in this paper. The arrows indicate the moving directions of small subgroups of individuals. From time t − τ to t + τ, individuals at the northeast corner move toward northeast and individuals at southeast corner merge to form a dense region. Only the dense regions in such UAV images can be detected and identified as “occupied” cells, as illustrated by dark cells in Figure 2B.
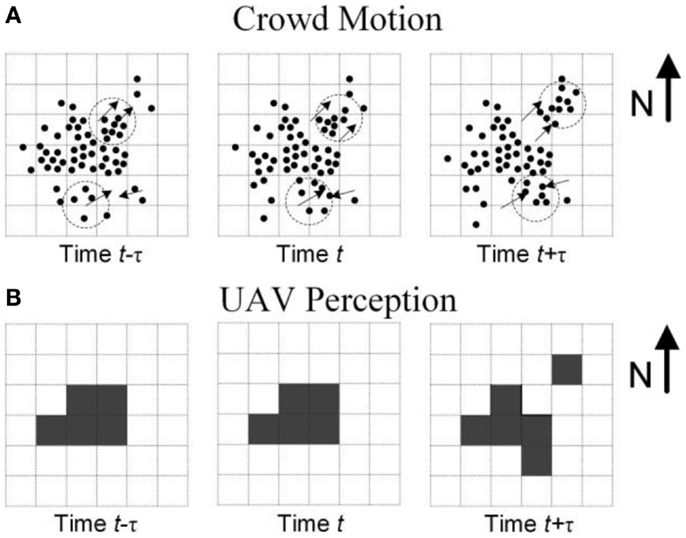
Figure 2. Illustration of crowd motion and UAV detection outcome. (A) Black dots: individuals in simulation case; dashed circle: small groups of individuals; arrow: motion trend of individuals; (B) filled square: occupied cells detected by UAVs.
Grid-based crowd state representation provides a flexible way to model the crowd dynamics. By changing the cells length l, the model can be adjusted adaptively according to the UAVs’ resolution, altitude, computation capability, and required response time. This representation can be used for modeling crowd dynamics. Specifically, the following notations are introduced and illustrated in Figure 3. Cl,m denotes a cell at the lth row and the mth column; Cl,m(t) denotes the state of cell Cl,m at time t; Cl,m(t) = 1 or 0, representing “occupied” or “empty,” respectively. A neighborhood of Cl,m is a block with three (3) rows and three (3) columns of cells. A neighborhood centered at Cl,m is denoted as Sl,m, where l = 2, … , L − 1, m = 2, … , M–1, L and M are the total number of rows and columns of the grid, respectively. The state of a neighborhood Sl,m at time t is determined by that of the cells in the neighborhood. It can be modeled with a random vector, Sl,m(t) = [Cl–1,m–1(t), Cl–1,m(t), Cl–1,m+1(t), Cl,m–1(t), Cl,m(t), Cl,m+1(t), Cl+1,m–1(t), Cl+1,m(t), Cl+1,m+1(t)]T. According to the definition of Sl,m(t), it is a vector with nine elements, and each element can be 0 or 1. For representation simplification, let Πi represent the value of Sl,m(t). There are totally 29 possible state vectors of Sl,m(t), which correspond to 29 different types of neighborhood patterns. Denote Πi as neighborhood pattern i, where i = 1, 2, …, 29. Note that Πi is the ith possible vector of Sl,m(t). Thus, Πi equals to the binary translation of i + 1. For example, in Figure 3, S3,4(t) = [0 1 1 0 0 0 0 0 0]T = Π193. Here, the binary translation of [0 1 1 0 0 0 0 0 0]T is 192; so, it is the 193th possible vector, which is denoted by Π193. By using neighborhood pattern, the value of neighborhood state Sl,m(t) can be easily represented.
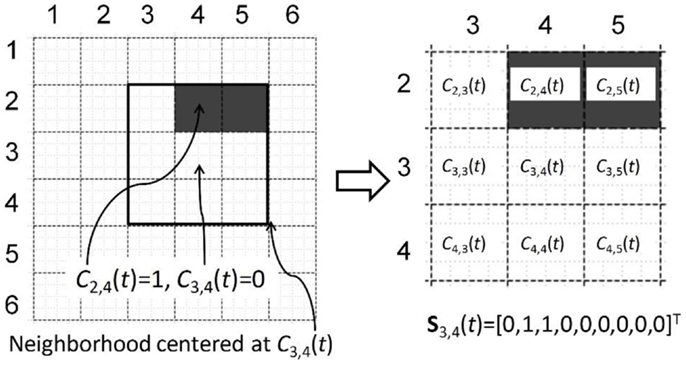
Figure 3. Example neighborhood and neighborhood vector. Solid squares: a neighborhood in a grid map. Filled squares: occupied cells detected by UAVs.
Grid-based crowd dynamic modeling
To predict the positions of an individual, the most common method is to model its trajectory. However, in the case of crowd tracking with grid-based representation, it is challenging to model the dynamics of the occupied cells by forming their trajectories. This is because the trajectories cannot be uniquely determined, as illustrated in Figure 4. Figure 4A shows the observations of two occupied cells at time t and t + τ. Figure 4A shows that C3,3(t) = 1, C3,4(t) = 1; Figure 4C shows that C3,3(t + τ) = 0 and C3,4(t + τ) = 0 at time t + τ, C4,3(t + τ) = 1, and C4,4(t + τ) = 1. With these observations, however, there still exists ambiguity on how the two cells move from time t to t + τ. Figures 4B,C shows two possible trajectories, named as “Case 1” and “Case 2”, respectively, where arrows indicate motion directions. It is therefore uncertain to determine which case corresponds to the true dynamics of the crowd. This uncertainty is also known as data association issue (Rasmussen and Hager, 2001).
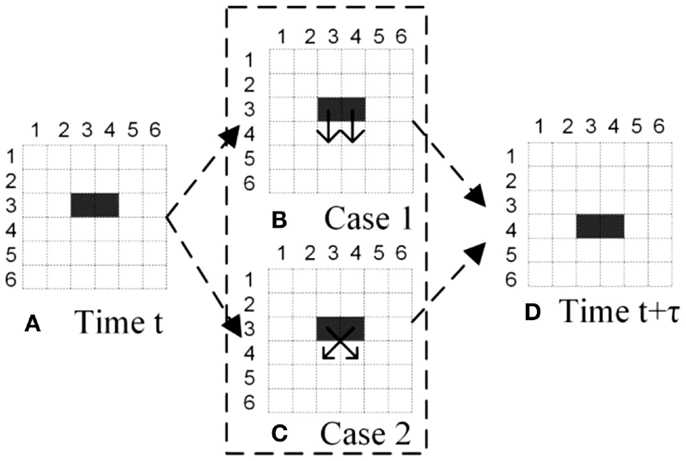
Figure 4. Uncertainty of cells’ trajectories. (A) Occupancy state at time t. Filled squares represent occupied cells detected by UAVs. (B) and (C) are two different possible movements. (D) Occupancy state at time t + 1.
To address the data association issue, this paper proposes to model the cells’ neighborhood state, instead of modeling the cells’ trajectories. When the crowd follows a certain pattern of movement, Cl,m(t) depends on the neighborhood state of previous time stamp, Sl,m(t − τ). As shown in Figure 5, the crowd is splitting, C3,3(t1 + τ) = C2,4(t1 + 2τ) = 1, and it is easy to find that the corresponding neighborhood at previous time stamp is the same: S3,3(t1) = S2,4(t1 + τ) = Π5 = [0, 0, 0, 0, 0, 0, 1, 0, 0]T. In other words, under this movement pattern in Figure 5, if Sl,m(t) = Π5, the corresponding cell has a higher probability to be occupied at next time stamp. The relationship between neighborhood pattern and a cell’s occupancy provides the basis for the proposed prediction method. In this example S1,5(t1 + 2τ) = Π5; According to the same neighborhood pattern in history data, C3,3(t1 + τ) = 1| S3,3(t1) = Π5; C2,4(t1 + 2τ) = 1|S2,4(t1 + τ) = Π5. The prediction can be made as C1,5(t1 + 3τ) = 1. With the same prediction process, C8,5(t1 + 2τ) can also be predicted as occupied.
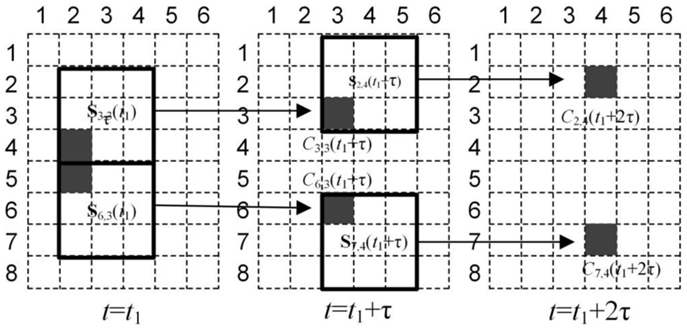
Figure 5. Illustration of neighborhood states and cell occupancy. Solid squares: neighborhoods at each time stamp. Filled squares: occupied cells detected by UAVs.
As discussed above, the determination of cell occupancy state depends on the neighborhood pattern at the previous time stamp. In general, it is assumed that cell occupancy state depends on the neighborhood pattern at previous time stamp. Then, the cell’s occupancy probability is:
where τ denotes the prediction interval. As illustrated by Figure 5, when the crowd follows a certain pattern of movement, the probability of cells’ occupancy only depends on the neighborhood pattern Πi and prediction interval τ, which is further illustrated by:
Eq. (2) shows that for any cell at any time stamp, if a given neighborhood and prediction interval τ are identical, the probability of a cell’s occupancy becomes equivalent. So the probability of cell’s occupancy can be simplified as:
where denotes the probability of a cell’s occupancy for prediction interval τ and a neighborhood pattern Πi. In history data, there are lots of neighborhoods having the same neighborhood pattern Πi. For such neighborhoods, the corresponding cells have the same probability of occupancy at τ times later. Considering each cell’s occupancy as a Bernoulli trial with the same success probability , the total number of occupied cells follows a binomial distribution.
The process of estimating can be considered as matching neighborhoods with historical data. As shown in Figure 6, given the neighborhood pattern Π30 = [0, 0, 0, 0, 1, 1, 1, 0, 1], this neighborhood pattern Π30 is matched among historical data. Every time the pattern Π30 appears, a Bernoulli trail is produced. The corresponding cell’s occupancy depends on the probability . Denote N(Πi) as the total number of appearances of Πi in the historical data. As shown in Figure 6, there are two Bernoulli trails appeared before t3, i.e., N(Π30) = 2. Denote Z(τ |Πi) the total number of successful trails in the historical data. Noticed that a successful trail refers to the corresponding cell to be occupied at τ times later. As shown in Figure 6, there is only one successful trail at t2, so Z(τ |Πi) = 1. Z(τ |Πi) follows a binomial distribution with n = N(Πi), and , i.e., ~ Binomial . Thus, can be estimated as:
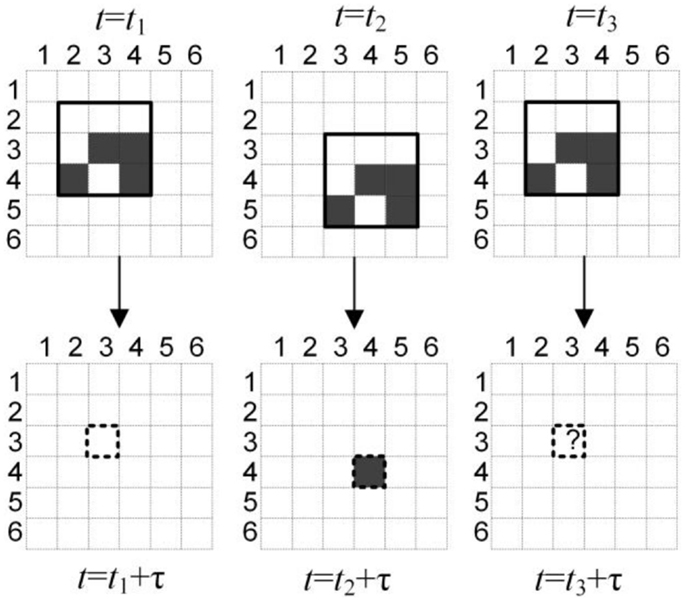
Figure 6. Illustration of Bernoulli trials of neighborhood matching. Solid squares: neighborhoods with the same neighborhood pattern. Filled squares: occupied cells detected by UAVs. Empty squares: unoccupied cells detected by UAVs. Dashed squares: corresponding cells associated with the neighborhoods. Squares with a question mark: unknown cells which need prediction.
When the data is limited and pattern Πi never appears, i.e., N(Πi) = 0, no history knowledge is available for the corresponding neighborhood pattern. Under this situation, the corresponding cell’s occupancy probability is considered as 0.5. Based on this estimation, the prediction of cell’s occupancy can be derived as:
where the superscript “A” in denotes the prediction based on UAVs’ data and grid-based model. It needs to be distinguished from , which will be introduced in the next section.
Regression-Based Individuals-Dynamics Modeling from UGVs’ Data
As aforementioned, UGVs can detect individuals in a crowd and model their dynamics, due to their proximity to the crowd. In this paper, AR model (Zaidi and Mark, 2011) is adopted for the modeling purpose. Compared to other modeling approaches, AR model is suitable for the scenarios where individuals’ locations are directly observed with ignorable errors. Under this condition, the model assumes a linear relationship between the individual’s locations at two consecutive time stamps. Denoting the state of the ith individual detected by UGVs at time t as a vector Xi(t) = [xi(t) yi (t) vi,x(t) vi,y(t)]T, where xi(t) and yi(t) represent the 2D location of the individual and vi,x(t) and vi,y(t) are the speed in x- and y- directions, respectively, a lag-1 AR is specified as:
where φi(t − 1) is the time-dependent AR parameter representing individual’s changing dynamics (e.g., acceleration/deceleration and making turns). Vectors fi(t) and ui(t) represent the exogenous inputs from environment and UGV/UAVs, respectively. Matrix Bf(t) and Bu(t) correspond to the time-dependent effect of these inputs on the individual’s dynamics. These matrices quantify the individual’s reaction to obstacles or UAV/UGVs. Vector εi(t) represents the noise on the state at time t and it is assumed εi(t) ~ N(0, σ2).
As discussed above, the time unit is set as τ. Then the AR model is rewritten as:
The AR model can be estimated through maximum likelihood estimation. Based on the estimated coefficients and , the one-step state prediction of individual i can be calculated as:
The prediction outcome provides detailed locations of individuals in a crowd. This detailed information may compensate the limitation of using low-resolution information from UAV images, based on the proposed information aggregation algorithm.
Information Aggregation
The individual dynamics identified from the estimated AR model based on UGVs’ observations may generate prediction outcome of cell occupancy. The general idea of the transformation is to calculate the number of individuals in a given cell Cl,m predicted by UGVs. The prediction outcome is calculated as:
where the vector represents the predicted locations of the jth individual among all NG individuals tracked by UGVs. Il,m([x, y]T) is an indicator function defined as:
where Rl,m represents the range of the cell Cl,m. It indicates whether an individual at point [x,y]T is within the range of cell Cl,m; counts the number of individuals with predicted location inside the cell Cl,m. When this value exceeds a threshold value λ, the cell is predicted as “occupied.”
To combine the information collected from both UAVs and UGVs, the predicted occupancy state from UGVs is interpreted as a probability quantity and denoted as . Thus the combined probability of cell Cl,m being occupied is expressed as:
where Wl,m is a weighing coefficient to balance the UGVs’ and UAVs’ prediction on the final prediction. A large value will be assigned to Wl,m if UAVs’ prediction is assumed to have high accuracy. Otherwise, Wl,m will be set as a small value to reduce effect of UAVs’ prediction on the final prediction. Cell occupancy can thus be determined as: , and , otherwise.
Numerical Simulation Study
A numerical simulation study is conducted to illustrate and demonstrate the effectiveness of the proposed approach. In the simulation study, a crowd of 50 individuals with changing dynamics is generated. The motion of the 50 individuals lasts for 15 time units. The time unit τ is set to 1 in this simulation. To represent complex crowd motions observed in reality, the individuals are simulated with several different motion patterns. These patterns are illustrated in Figure 7, where all 50 individuals (denoted as black dots) move toward the east from time stamps 1–4. There are two UGVs in the scene and their curves in these panels represent the detection range of two UGVs. In the numeric study, the UGVs’ trajectory is determined by a motion planning module based on A* algorithm (Khaleghi et al., 2013). Between time stamps 5 and 6, two subgroups of individuals leave the majority of the crowd. One subgroup moves toward the northeast direction and the other subgroup moves toward the southeast direction. From time stamp 7 to time stamp 15, the subgroup in the northeast corner of the crowd continues moving toward the east. The subgroup in the southeast corner of the crowd merges and forms a dense region. Before merging, this subgroup has low density and UAVs fail to detect it.
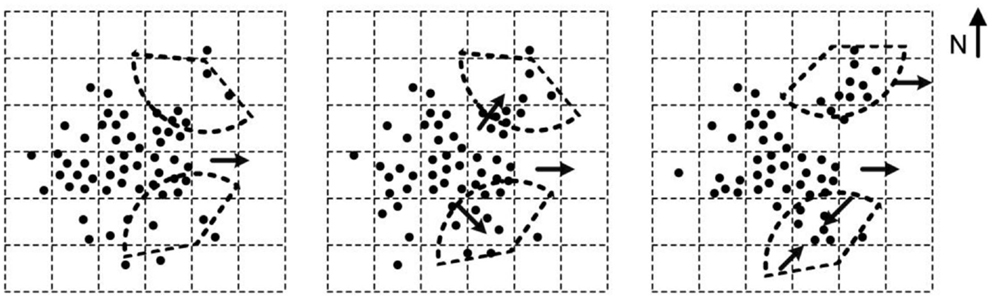
Figure 7. Simulated motion patterns. Dots: individuals in simulation case study. Arrows: crowd moving directions. Dashed sectors: UGVs’ detection ranges.
To generate these motion patterns, a state space model is used for all the individuals in the crowd. The state space model is specified as:
where is a stack of the state vectors of 50 individuals. The time unit and prediction interval τ are set to one. Matrix A(t) is the state transition matrix and W(t ) represents the state noise at time t. Matrix C is the measurement matrix that transforms the state vector to the actual observations of individual positions. In the simulation, it is assumed that there is no measurement error associated with the observation Y(t). Matrix A(t) links the state at time t with that at time t. Therefore, it represents the individual’s own dynamics and also the potential interactions with other individuals. For example, when A(t) is a diagonal matrix, no interaction exists among individuals. This will lead to a gradual scattering of individuals and eventually a disappearance of the crowd shape. To prevent this, a non-zero off-diagonal element is added to matrix A(t). One example is:
where matrix 1 N × N is an N by N matrix with every element equal to 1. N is the number of simulated individuals and it equals to 50 in this case. The symbol ⊗ represents Kronecker product. Matrix I4 N × 4 N is a diagonal matrix with dimension 4N × 4N. The matrix A0 adjusts the individual’s speed by assigning the average speed of all individuals to each one of them. For illustration, consider an example with N = 2, the product A(t)X(t) in Eq. (12) becomes:
It shows that the speed in x- and y- directions of each individual in the crowd shares the same component, i.e., average speed of all individuals, apart from noise terms in W(t). The same matrix A(t) has been adopted in Gning et al. (2011) to model crowd dynamics. Eq. (13) corresponds to the time stamps 1–4. Between time stamps 5 and 15, since subgroups of individuals leave the whole crowd, separate matrices Asub(t) of size Nsub in Eq. (13) is used. In this case study, both subgroups have the same Nsub = 10. The change of speed of these subgroups is achieved by altering the x- and y-direction speed component of state vectors of individuals. Assuming that the observed values are simply the 2D locations of each individual, the matrix C is given by:
C matrix represents that the x- and y-locations are observed for individuals detected by UGVs.
In the simulation, one UAV and two UGVs collaboratively monitor the crowd motion. The UAV is assumed to observe all 50 individuals in the crowd and each UGV observes a small subgroup of individuals. Observations from the UAV have low resolution and only dense regions are captured. The captured dense regions form the shaded area, as shown in Figure 8. The location of each individual within the detection range of UGVs is observed and represents high-resolution information.
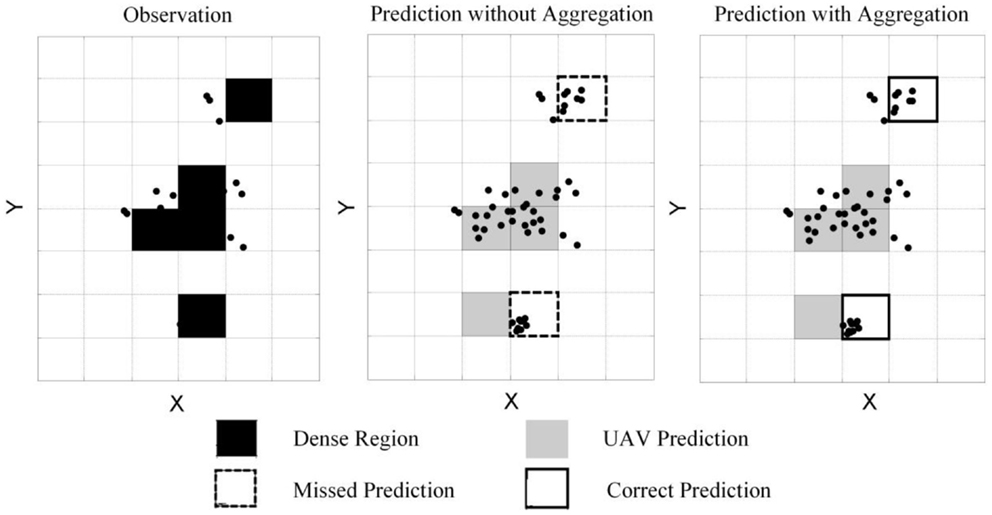
Figure 8. Illustration of simulation outcome at time t = 8. Black filled square: dense region in reality. Gray filled square: predicted region based on UAV’s data. Dashed square: missed prediction based on UAV’s data. Solid square: corrected prediction with aggregated data from UGVs.
Based on collected observations, the crowd motion prediction is achieved with the proposed grid-based prediction and information aggregation algorithm. In the experiment, the cell length l is set to 10, and the occupancy threshold λ is set to 5.
In this paper, to balance the computational load and prediction accuracy, the most recent 10 observations are utilized for UGVs’ prediction. Same settings are considered in the simulation study. To predict individual’s motion based on UGVs’ simulated observation, the following AR1 model is fitted recursively by using the most recent 10 observations.
The one-step predicted locations are combined with UAVs motion prediction outcomes.
The performance of the dynamics modeling approach is quantified with coverage percentage ρ(t), defined as:
where N is the total number of individuals (i.e., 50 in the study), xi(t) and yi(t) are the 2D location of the ith individual at time t. Here Ip is defined previously in Eq. (10). Indicator function IP([x(t), y(t)]T) outputs 1 if the individual lies within the predicted region Rp(t). To demonstrate the advantage of integrating both high- and low-resolution information, the proposed method is compared with prediction outcome based solely on UAVs. The coverage percentages from these two methods are denoted as and , respectively.
Figure 8 illustrates the simulated crowd location, predicted location with and without aggregation at time t = 8. Individuals are represented as black dots and dense regions are shown as shaped cells, according to the legend. The predicted outcome from UAVs has two missed predictions, which have dashed cell boundaries. The predicted outcome from UAVs has two missed predictions, which have dashed cell boundaries. Such missed prediction is due to the restriction of the history data and motion changes are not predicted correctly. With detailed data collected by UGVs, these two dense regions are correctly predicted when aggregation is considered. These two dense regions are correctly predicted when aggregation is considered. These results are , and , showing a much higher coverage value.
The coverage percentage throughout the simulation experiment is recorded in Figure 9, where the proposed approach (“with aggregation”) achieves the same high coverage from time stamps 1 to 4 as the prediction using UAVs alone (“without aggregation”). This corresponds to the period where all individuals move to the east. Starting from time 5, the crowd changes the motion pattern, and such change is not predicted correctly due to restriction of history-data-based training. The proposed approach corrects the prediction with UGVs’ data and improves the performance. As more complex motion patterns appear, i.e., with two subgroups leaving the main crowd and one subgroup merging to a dense region, the proposed approach achieves a significantly higher coverage (i.e., between time stamps 6–13 and 15). Under DDDAS framework, the aggregation based on weight Wl,m improves the prediction result. Such improved prediction guides the UGVs to capture a better detection over the crowd, thus further improves the aggregation coverage. Overall, the average coverage percentages with and without aggregation are equal to 0.75 and 0.62, respectively.
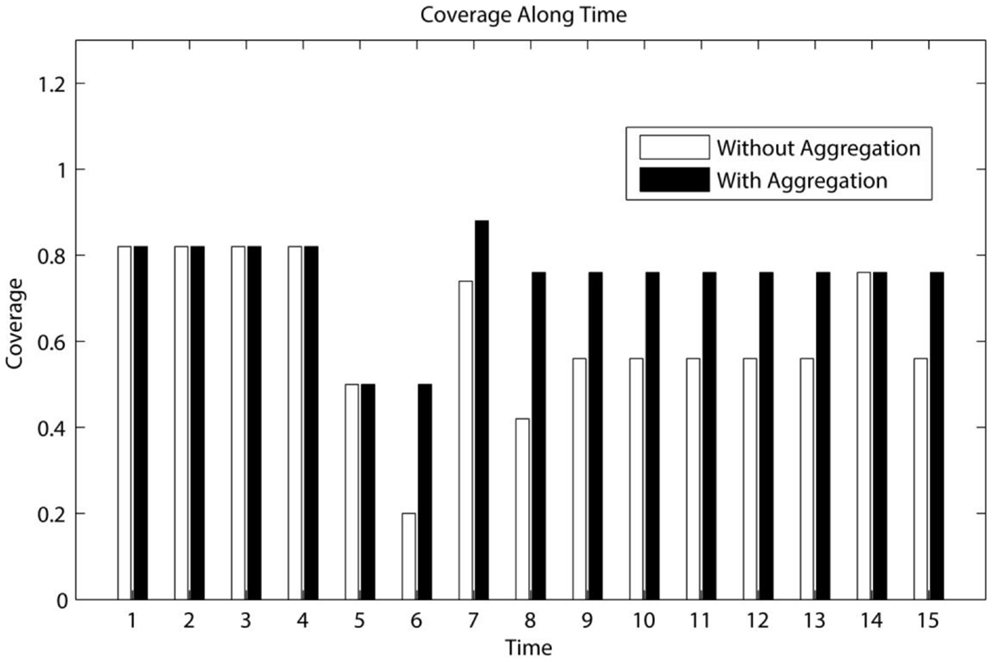
Figure 9. Demonstration of coverage percentage. Black bars: coverage of aggregated prediction. White bars: coverage of prediction with only UAVs’ data.
Conclusion
Utilizing UAVs and UGVs in crowd control and surveillance has received increasing attentions. To take advantage of the real-time dynamic monitoring data available in crowd surveillance systems, DDDAS paradigm has been used in an effort to improve data acquisition, modeling, and execution. In these applications, the modeling of crowd dynamics plays a key role that allows predicting the crowd motion for control purpose. Existing crowd modeling techniques for prediction purpose are either microscopic or macroscopic; their application is limited when dealing multi-resolution data collected from both UAVs and UGVs. To address the challenge of such multi-resolution data fusion problem, a new crowd modeling technique is proposed in this paper.
This paper proposes a grid-based modeling approach that maps 2D space into occupancy grid and represents the crowd motion by the changing state (i.e., occupied and unoccupied) of cells in the grid. Since existing crowd detection approaches can only effectively detect dense regions with a large number of individuals, the cell state “occupied” represents the occurrence of a dense region. A grid-based model is used to get the cells’ occupancy probabilities, given its neighborhood state vector in the previous time stamp. For regions where high-resolution observations are collected, the modeling could be improved by utilizing both low- and high-resolution information. To achieve this, an AR model is adopted in this paper to model dynamics of individuals detected by UGVs. Based on estimated model coefficients, individuals’ location at a future time stamp could be predicted. The predicted location is converted into a predicted probability of cell occupancy. The predicted probability from both UAVs’ and UGVs’ observations is incorporated through an information aggregation step, which linearly combines the probabilities by assigning weights to them. The combined probability value determines the outcome of the crowd motion. Through the simulation study, the proposed approach, which includes grid-based modeling and information aggregation, is demonstrated to be effective in modeling crowd dynamics. This grid-based model is not only applicable to UAVs’ and UGVs’ multi-resolution data, but is also applicable to other data types, such as satellites’ data and road test data; and population survey and individual survey.
Conflict of Interest Statement
The authors declare that the research was conducted in the absence of any commercial or financial relationships that could be construed as a potential conflict of interest.
Acknowledgments
This material is based on research sponsored by the Air Force Office of Scientific Research under FA9550-12-1-0238 [A part of Dynamic Data Driven Application Systems (DDDAS) projects]. The US Government is authorized to reproduce and distribute reprints for governmental purposes notwithstanding any copyright notation thereon. The views and conclusions contained herein are those of the authors and should not be interpreted as necessarily representing the official policies or endorsements, either expressed or implied, of the Air Force Office of Scientific Research or the US Government.
References
Boghossian, B. A., and Velastin, S. A. (1999). “Motion-based machine vision techniques for the management of large crowds,” in Proceedings of the 6th IEEE International Conference on Electronics, Circuits and Systems, 1999 (ICECS ’99), Vol. 2 (Pafos: IEEE), 961–964.
Celik, N., Lee, S., Vasudevan, K., and Son, Y.-J. (2010). DDDAS-based multi-fidelity simulation framework for supply chain systems. IIE Trans. 42, 325–341. doi: 10.1080/07408170903394306
Celik, N., Thanos, A. E., and Saenz, J. P. (2013). DDDAMS-based dispatch control in power networks. Procedia Comput. Sci. 18, 1899–1908. doi:10.1016/j.procs.2013.05.359
Darema, F. (2004). “Dynamic data driven applications systems: a new paradigm for application simulations and measurements,” in Computational Science-ICCS 2004, (Springer), 662–669. Available at: http://link.springer.com/chapter/10.1007/978-3-540-24688-6_86
Denham, M., Wendt, K., Bianchini, G., Cortés, A., and Margalef, T. (2012). Dynamic data-driven genetic algorithm for forest fire spread prediction. J. Comput. Sci. 3, 398–404. doi:10.1016/j.jocs.2012.06.002
Dridi, M. H. (2014). Tracking Individual Targets in High Density Crowd Scenes Analysis of a Video Recording in Hajj 2009. Available at: http://arxiv.org/abs/1407.2044. arXiv Preprint arXiv:1407.2044
Gaszczak, A., Breckon, T. P., and Han, J. (2011). Real-time people and vehicle detection from UAV imagery,” in IS&T/SPIE Electronic Imaging, Vol. 7878 (San Francisco, CA: International Society for Optics and Photonics), 78780B–78781B.
Gning, A., Mihaylova, L., Maskell, S., Pang, S. K., and Godsill, S. (2011). Group object structure and state estimation with evolving networks and monte carlo methods. IEEE Trans. Signal Process. 59, 1383–1396. doi:10.1109/TSP.2010.2103062
Horn, B. K. P., and Schunck, B. G. (1981). Determining optical flow. Artif. Intell. 17, 185–203. doi:10.1016/0004-3702(81)90024-2
Jacques, J. C. S. Jr., Raupp Musse, S., and Jung, C. R. (2010). Crowd analysis using computer vision techniques. IEEE Signal Process. Mag. 27, 66–77. doi:10.1109/MSP.2010.937394
Khaleghi, A. M., Xu, D., Wang, Z., Li, M., Lobos, A., Liu, J., et al. (2013). A DDDAMS-based planning and control framework for surveillance and crowd control via UAVs and UGVs. Expert Syst. Appl. 40, 7168–7183. doi:10.1016/j.eswa.2013.07.039
Knight, D., Rossman, T., and Jaluria, Y. (2006). “Evaluation of fluid-thermal systems by dynamic data driven application systems,” in Computational Science–ICCS 2006, (Springer), 473–480. Available at: http://link.springer.com/chapter/10.1007/11758532_63
Lin, S.-Y., Chao, K.-M., and Lo, C.-C. (2012). Service-oriented dynamic data driven application systems to urban traffic management in resource-bounded environment. ACM SIGAPP Appl. Comput. Rev. 12, 35–49. doi:10.1145/2188379.2188383
Masoud, O., and Papanikolopoulos, N. P. (2001). A novel method for tracking and counting pedestrians in real-time using a single camera. IEEE Trans. Veh. Technol. 50, 1267–1278. doi:10.1109/25.950328
McCune, R., Purta, R., Dobski, M., Jaworski, A., Madey, G., Wei, Y., et al. (2013). Investigations of Dddas for Command and Control of Uav Swarms with Agent-based Modeling. IEEE Press, 1467–1478. Available at: http://dl.acm.org/citation.cfm?id=2676167
Mehran, R., Oyama, A., and Shah, M. (2009). “Abnormal crowd behavior detection using social force model,” in IEEE Conference on Computer Vision and Pattern Recognition, 2009 (CVPR 2009) (Miami, FL: IEEE), 935–942.
Moseley, M. B., Grocholsky, B. P., Cheung, C., and Singh, S. (2009). “Integrated long-range UAV/UGV collaborative target tracking,” in SPIE Defense, Security, and Sensing (Orlando, FL: International Society for Optics and Photonics), 733204–733204. doi:10.1117/12.820289
Peng, L., Lipinski, D., and Mohseni, K. (2014). Dynamic data driven application system for plume estimation using Uavs. J. Intell. Robotic Syst. 74, 421–436. doi:10.1007/s10846-013-9964-x
Rasmussen, C., and Hager, G. D. (2001). Probabilistic data association methods for tracking complex visual objects. IEEE Transactions on Pattern Analysis and Machine Intelligence 23, 560–576.
Rittscher, J., Tu, P. H., and Krahnstoever, N. (2005). “Simultaneous estimation of segmentation and shape,” in IEEE Computer Society Conference on Computer Vision and Pattern Recognition, 2005 (CVPR 2005), Vol. 2 (San Diego, CA: IEEE), 486–493.
Rodriguez-Aseretto, D., de Rigo, D., Di Leo, M., Cortés, A., and Ayanz, J. S. M. (2013). A Data-driven model for large wildfire behaviour prediction in Europe. Procedia Comput. Sci. 18, 1861–1870. doi:10.1016/j.procs.2013.05.355
Srinivasan, S., and Chellappa, R. (1999). Noise-resilient estimation of optical flow by use of overlapped basis functions. J. Opt. Soc. Am. A. Opt. Image Sci. Vis. 16, 493–507. doi:10.1364/JOSAA.16.000493
Pubmed Abstract | Pubmed Full Text | CrossRef Full Text | Google Scholar
Thiran, J., Knebel, J., and Venegas, S. (2004). Multi-Object Tracking Using the Particle Filter Algorithm on the Top-View Plan. Available at: http://infoscience.epfl.ch/record/87041
Wan, E. A., and Van Der Merwe, R. (2000). “The unscented kalman filter for nonlinear estimation,” in The IEEE 2000 Adaptive Systems for Signal Processing, Communications, and Control Symposium 2000 (AS-SPCC) (Lake Louise: IEEE), 153–158.
Wang, Z., Li, M., Khaleghi, A. M., Xu, D., Lobos, A., Vo, C., et al. (2013). DDDAMS-based crowd control via UAVs and UGVs. Procedia Comput. Sci. 18, 2028–2035. doi:10.1016/j.procs.2013.05.372
Wu, B., and Nevatia, R. (2007). Detection and tracking of multiple, partially occluded humans by Bayesian combination of edgelet based part detectors. Int. J. Comput. Vis. 75, 247–266. doi:10.1007/s11263-006-0027-7
Zaidi, Z. R., and Mark, B. L. (2011). Mobility tracking based on autoregressive models. IEEE Trans. Mobile Comput. 10, 32–43. doi:10.1109/TMC.2010.130
Keywords: multi-resolution data, crowd tracking, DDDAS, grid-based, UAVs and UGVs, surveillance
Citation: Yuan Y, Wang Z, Li M, Son Y-J and Liu J (2015) DDDAS-based information-aggregation for crowd dynamics modeling with UAVs and UGVs. Front. Robot. AI 2:8. doi: 10.3389/frobt.2015.00008
Received: 18 November 2014; Accepted: 19 March 2015;
Published online: 08 April 2015.
Edited by:
Kushal Mukherjee, United Technologies Research Center, IrelandReviewed by:
Soheil Bahrampour, Pennsylvania State University, USASoumalya Sarkar, Pennsylvania State University, USA
Copyright: © 2015 Yuan, Wang, Li, Son and Liu. This is an open-access article distributed under the terms of the Creative Commons Attribution License (CC BY). The use, distribution or reproduction in other forums is permitted, provided the original author(s) or licensor are credited and that the original publication in this journal is cited, in accordance with accepted academic practice. No use, distribution or reproduction is permitted which does not comply with these terms.
*Correspondence: Jian Liu, Department of Systems and Industrial Engineering, University of Arizona, 1127 E. James E. Rogers Way Room 221, Tucson, AZ 85721, USA e-mail: jianliu@email.arizona.edu