Immersive data comprehension: visualizing uncertainty in measurable models
 Pere Brunet
 Carlos Andújar
- Moving Research Group, Research Center for Visualization, Virtual Reality and Graphics Interaction (ViRVIG), Computer Science Department, Universitat Politècnica de Catalunya, Barcelona, Spain
Recent advances in 3D scanning technologies have opened new possibilities in a broad range of applications including cultural heritage, medicine, civil engineering, and urban planning. Virtual Reality systems can provide new tools to professionals that want to understand acquired 3D models. In this review paper, we analyze the concept of data comprehension with an emphasis on visualization and inspection tools on immersive setups. We claim that in most application fields, data comprehension requires model measurements, which in turn should be based on the explicit visualization of uncertainty. As 3D digital representations are not faithful, information on their fidelity at local level should be included in the model itself as uncertainty bounds. We propose the concept of Measurable 3D Models as digital models that explicitly encode such local uncertainty bounds. We claim that professionals and experts can strongly benefit from immersive interaction through new specific, fidelity-aware measurement tools, which can facilitate 3D data comprehension. Since noise and processing errors are ubiquitous in acquired datasets, we discuss the estimation, representation, and visualization of data uncertainty. We show that, based on typical user requirements in Cultural Heritage and other domains, application-oriented measuring tools in 3D models must consider uncertainty and local error bounds. We also discuss the requirements of immersive interaction tools for the comprehension of huge 3D and nD datasets acquired from real objects.
1. Introduction
In many Virtual Reality applications, the main objective is to offer a high level of presence. Measuring the level of presence is crucial in order to evaluate VR techniques and devices and to obtain the degree of usability required in some practical applications. Nowadays, with current acquisition systems that generate huge amounts of 3D data, VR systems are also able to provide new tools to professionals who wish to understand acquired 3D models. However, the use of VR systems for data comprehension requires specific and application-oriented tools that have not deserved much attention in the literature.
In this paper, our goal is to discuss potential VR-based tools for understanding acquired 3D models. Under the premise that immersive tools can provide extra insight elements, we investigate the use of immersive interaction in VR systems to provide novel comprehension mechanisms to experts. This comprehension is a key in most applications dealing with 3D models of real objects. We focus on cultural heritage applications and on geometric measures, although most of our conclusions are also valid in other domains like medicine, civil engineering, and urban planning.
The goal of many present systems is merely to reproduce pleasant models amenable to the users and experts, thus compromising or ignoring the issues concerning the fidelity of the digital records. Methodologies for encoding metadata along with 3D or other visual models have been proposed, but largely failed to become a common practice in the analysis of acquired data. When considered, all these phases are now human-driven and quite tedious.
We claim that understanding huge amounts of acquired data requires a joint representation and visualization of data and data uncertainty. Data in virtual environments is usually presented as realistic and plausible 3D (or nD) information that can be interactively inspected by users and experts. However, acquired data is noisy for multiple reasons, including measurement and processing-based errors, and this uncertainty is largely ignored by present applications. The consequence is that most immersive (and non-immersive) visualizations nowadays are fundamentally biased and can be even unreliable. As an example, let us consider the digitization of a monument based on, e.g., a time-of-flight scanner. Most regions will have a dense sampling of data points, resulting in quite small errors in the final reconstructed shape. However, some other regions will probably suffer from lack of data, poor sampling, and inaccurate reconstruction. Final errors will affect both the geometric shape and its appearance attributes in a local way. Within most small regions of the inspected model, precise data will coexist with inaccurate geometric and attribute information. As hiding data errors can extremely hinder data comprehension in many cases, 3D models in applications requiring data comprehension should include geometric data and attributes plus local fidelity information.
We derive our proposal from well-known requirements from experts in cultural heritage and other domains: they need VR and related inspection tools to facilitate data comprehension. However, it can be observed that
• Data comprehension requires explicit or implicit model measurements (see Section 4 for more details).
• Reliable model measurements require an explicit local representation of data uncertainty, which in turn provides local information on the fidelity of digital data.
Surprisingly, most digital models are usually considered as faithful, which is obviously a wrong assumption. To cope with the lack of precision, models should be expanded by including fidelity information. We, therefore, propose the following contributions:
• We introduce the concept of Measurable 3D Models in Section 3, as digital models that represent geometric data plus attributes plus local fidelity information (see Figure 1). We propose a non-exhaustive list of potential uncertainty encodings for geometric data.
• We review some immersive interaction tools in Section 4 while discussing if they are able to support geometric measurements with explicit measure uncertainties, based on a previous encoding of model uncertainties. In Section 5, we briefly show the interest of the present proposal in several application fields, with a main focus on cultural heritage.
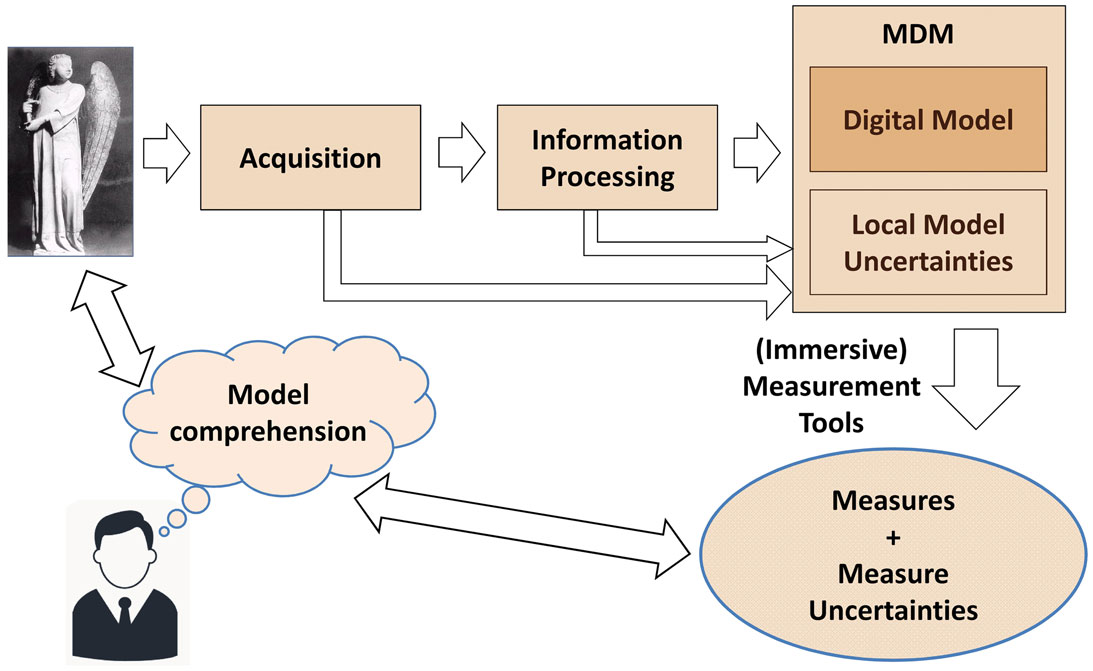
Figure 1. Measurable 3D models including local model uncertainties allow measurement tools to provide measure uncertainties, which enhance data comprehension.
We claim that a methodology and associated tools for measuring and visualizing the fidelity of the 3D models that will be stored alongside the data itself must be defined. Fidelity (with respect to data sources used in the reconstruction process) is useful to control and inform data inspection. It should be preserved together with the digital models, fostering data exchange and reusability.
2. Previous Work
Visualization and inspection tools have been used proficiently to show 3D data and models either through the web or in exhibits, see for instance Callieri et al. (2008) and Gobbetti et al. (2008).
Different approaches to tackle automatic reconstruction have been proposed with moderate success. In the Cultural Heritage domain, a manual approach to reconstruct a Greek town destroyed by an earthquake was made by Pavlidis et al. (2009). They also identify problems arising from sparse and deteriorated data. The goal of the work in Gruen and Hanusch (2008) was the reconstruction of a 3D model of a destroyed Buddha statue in Afghanistan. As input, they used two old images, a contour drawing from a statue as well as newly taken photographs from the surrounding. A large amount of manual work was needed in their approach, concluding that using more old images would improve the reconstruction. However, the final 3D models do not contain error bounds on the reconstructed data. Moreover, and being a data pre-processing step, 3D reconstructions should operate as automatically as possible. Reconstruction models typically rely on geometric prior assumptions, formulated independently of the input data. The most common assumption for reconstruction is spatial smoothness (Amenta and Kil, 2004; Kazhdan et al., 2006). These types of approaches are now very well understood, and modern algorithms can for example fit minimal surfaces to noisy data in a globally optimal fashion (Kolev et al., 2010), leading to very strong results. However, simple smoothness assumptions limit the ability to handle larger holes in the data, as missing data is usually replaced by too smooth membranes. Recker et al. (2012) have proposed a novel interactive tool, which allows for the analysis of scene structure uncertainty and its sensitivity to different multi-view scene reconstruction parameters. The tool creates a scalar field at a user-specified resolution that provides insight into structural uncertainty, providing the error at any given 3D grid position.
The digital reconstruction of the entrance of the Ripoll Monastery in Spain is a case example of tolerance-aware 3D reconstruction (Callieri et al., 2011). In this case, initial discussions concluded that a Time-of-Flight (TOF) scanning would not meet the precision requirements. The need for a double scanning of the complete Portalada based on a TOF scanning for overall alignment plus a number of precise, triangulation-based scans that could acquire all details were concluded. The idea was to use TOF scan results as a background low-resolution mesh, on which the different high-resolution triangulation-based laser scan patches would be placed. The acquired data set was organized in a total of 2,212 range maps and more than half a billion acquired 3D points, with a final polygonal mesh of 173 million triangles.
Computing precise local fidelity bounds in huge reconstructed 3D models is still an open problem with interesting research challenges. While several works and methodologies have been proposed for the evaluation of the accuracy of active 3D scanning systems (see Guidi (2013) and related bibliography), the evaluation of the final 3D model fidelity is still a neglected topic.
A key document for understanding the importance of representing the uncertainty of measurements is JCGM (2008). It includes precise definitions of measurement uncertainty, the measure and specification, standard and expanded uncertainties, measurement procedures, and other related concepts that will be used in the rest of this paper.
Three-dimensional reconstructions can contain huge amounts of data, and specific algorithms must be devised for their visualization and interactive inspection (Gobbetti et al., 2008). Techniques for geometry simplification and multi-resolution encoding schemes (Cignoni et al., 2004, 2005) can be employed to guarantee interactive rendering rates at a controlled and bounded visual degradation. Most of those techniques are based on standard simplification techniques (Garland and Heckbert, 1997; Luebke et al., 2002). This is a current topic of research with a good number of recent results; see for instance Andujar et al. (2010) and Argudo et al. (under review). View-dependent visualization schemes rely on hierarchical data structures representing a multi-resolution model. Proposed data structures include scene-based subdivision trees (Andujar et al., 2010), standard Kd-trees (Argudo et al. under review), hierarchical space subdivisions that avoid T-joints (Cignoni et al., 2004), hybrid structures using Kd-trees and voxels (Gobbetti and Marton, 2004), or cache-coherent data management (Yoon et al., 2008). Again, most of these techniques do not compute local error bounds and fidelity measures for the simplified shapes.
Visualization of uncertainty has been clearly recognized in the research community for many years. It has been acknowledged that we need a (possibly common or even standardized) methodology to encode in our visual representations the degree of uncertainty that a given image/model holds. This issue has been debated in many papers and conferences and different approaches have been proposed, mostly based on the use of linearly varying transparency to map a scalar indicator of uncertainty (Zuk et al., 2005), or on the use of specific Non-Photorealistic Rendering (NPR) approaches (Boer et al., 2009) to present visually those portions of a model that are uncertain. In other papers, hypothetical parts are displayed by visual coding (colors, transparency, line styles, etc.) as the goal is to distinguish the certainty levels (Kensek et al., 2004; Theron et al., 2007). However, uncertainty interpretation is limited to the global 3D scene: parts are shown with different transparency levels but data cannot be fully manipulated and local information cannot be fully extracted (Pang et al., 1997). Unfortunately, a consensus and a common approach have not yet been reached.
Immersive interaction usually requires a certain degree of presence. Presence (Slater et al., 1995) in virtual environments can be measured to quantify the quality of the user experience. Slater and Steed (2000) describe a new measure for presence in immersive virtual environments (VEs) that is based on data that can be unobtrusively obtained during the course of the VE experience. At different times during an experience, the participant will occasionally switch between interpreting the totality of sensory inputs as forming the VE or the real world. Based on the number of transitions from virtual to real, a probabilistic Markov chain model is used to estimate the equilibrium probability of being present in the VE.
Several recent approaches try to jointly optimize immersion and presence, ergonomic interaction, and easy maintenance. On the other hand, CAVE systems are a powerful tool for collaborative inspection of virtual environments due to better use of peripheral vision, less sensitivity to tracking errors, and higher communication possibilities among users. Multi-projector CAVEs based on commodity hardware and gestural interaction are a promising choice, see for instance Andujar et al. (under review).
VR applications controlled through natural gestures are gaining increasing popularity these days due to recent developments in low-cost tracking systems and gesture recognition technologies. Although interaction techniques through natural gestures have demonstrated their benefits in navigation and avatar-control tasks, efficient selection, and manipulation in complex scenes remains an open problem (Argelaguet and Andujar, 2013). Data uncertainty further hinders user tasks: most selection, manipulation and navigation techniques need a close coupling with the rendering pipeline, introducing new elements to be drawn, and potentially modifying the object layout and the way the scene is rendered (Argelaguet and Andujar, 2013). Conversely, user performance is affected by rendering issues, such as latency, visual feedback, depth perception, and occlusion management. The visualization of data uncertainty does impact all the elements above, thus potentially interfering with user tasks.
3. Measurable 3D Digital Models
Producing estimates of the spatial fidelity and defining up to what extent a defined shape model is a correct representation of the original, real-world object, is essential for data comprehension. Unfortunately, in current VR inspection systems, there is a lack of such tools. In these systems, subjective evaluations are quite common. They are important on a qualitative basis (scholarly evaluation will remain a basic evaluation criterion), but should also be paired with instruments that provide and evaluate a mapping between the reconstructed model and the single basic data used to produce it.
Understanding huge amounts of acquired data requires a joint representation and visualization of data and data uncertainty. Models in 3D applications requiring data comprehension must, therefore, include geometric data plus attributes plus local fidelity information. This is clear by a reductio at absurdum argument: having no information on data uncertainty will lead to wrong interpretations, wrong model measurements and, in most cases, lack of data comprehension. Let us first imagine a cultural heritage application to inspect the state of conservation of an ancient monument, with periodic acquisitions of its shape. Unless special care is taken during the overall acquisition and processing phases, it may occur that errors in surface data 3D positions are of the same order of magnitude than the erosion changes in the surface shape, making useless any immersive inspection of the reconstructed models. As a second example, let us consider a 3D liver model of a patient with an ongoing cancer treatment. Unknown data errors may hide small texture changes that could indicate the presence of growing nodules (in some real undetected cases, a later and careful analysis of the data has shown the previously invisible nodules). In short, we claim that data can only be fully understood when information on data accuracy is available at any 3D point of the model.
The main problem in the existing measuring tools in VR inspection systems is that essential information on the measurands has been lost. According to JCGM (2008), the objective of a measurement is to determine the value of the measurand, that is, the value of the particular quantity to be measured. Then, the measurement begins with an appropriate specification of the measurand, the method of measurement, and the measurement procedure. Inspection tools in immersive systems help data comprehension through a two-step measuring cascade: users work by implicitly or explicitly (as defined in the next section) measuring rendered data, but this digital data has been acquired (in other words, measured) from objects in the real world. If acquired data does not preserve some kind of standard or expanded uncertainty information (JCGM, 2008), rendered digital models will not be able to support measurements.
Measuring tools for digital models must be fidelity aware. In what follows, we will use the term fidelity of a digital model as the (local) degree of approximation to the original object. It can be either geometric or related to any attribute in nD models. Lack of fidelity can be a consequence of acquisition artifacts and dark regions, noise in the acquisition measurements, or approximating hypothesis during the subsequent geometry processing (model repair or simplification, for example). The fidelity of the final digital model is the aggregation of all individual error and noise sources. Moreover, we will use the term uncertainty to note some specific fidelity bound representation. Uncertainty is a measurable bound of the degree of approximation between the digital model and the physical object at any surface (or model) point.
In this context, we define Measurable 3D Models (MDMs in what follows) as digital models that explicitly encode local uncertainty bounds on their quality and fidelity.
Measurable 3D models encode geometric data plus attributes plus local uncertainty information. By encoding this model uncertainty information in a local way, MDMs include a measurable bound of the approximation between the digital model and the physical object at any surface point. By representing uncertainty, MDMs are fidelity aware. By encoding local model uncertainties, MDMs become able to compute uncertainty-based measurements (or measure uncertainties) as defined in JCGM (2008): measure uncertainty is a parameter, associated with the result of any measurement, that characterizes the dispersion of the values that could reasonably be attributed to the measurand.
Local data uncertainty can be encoded in many different ways. Acquired models, however, are usually obtained from single acquisition sessions and they lack the series of observations that would be required to perform reliable statistical analysis. The consequence is that classical uncertainty measures like the standard uncertainty (JCGM, 2008) cannot be considered in these acquired digital models. Our proposal is to use bounding intervals, in a way similar to expanded uncertainties in type B evaluations (JCGM, 2008). In this context, the following non-exhaustive list of possible encodings could be considered:
• α-Ellipsoids: in this case, each relevant point P of the model stores a fidelity ellipsoid. Relevant points depend on the particular application. In most cases, relevant points will match the surface points, but in medical applications involving volume models, for instance, volume points should be considered. The ellipsoid at any point P is a fidelity bound for P, in the sense that the MDM model guarantees that, in the α-percent of the cases, the point PO corresponding to P in the initial acquired object will be inside the P ellipsoid. For general scalar attributes associated to model points P, α-Ellipsoids boil down to non-oriented α-Intervals.
• α-Intervals: each relevant point P of the model might store a fidelity interval. This is less precise than α-Ellipsoids, but avoids representing ellipsoids in general orientations. The α-Interval at any point P is a fidelity bound for P, in the sense that the MDM model guarantees that, in the α-percent of the cases, a point PO of the initial acquired object will stab the P α-Interval. As most acquisition systems are directional, α-Intervals can be compactly encoded by the extent of the bounding interval and an index to the location of the scanning device CP, the interval direction being given by P − CP. For general scalar attributes associated to model points P, non-oriented α-Intervals can be considered.
• α-Boxes: each relevant point P of the model stores a fidelity box. This is again less precise than α-Intervals. The α-Box at any point P is an index to a dictionary of (possibly oriented) Boxes. In this case, the MDM model guarantees that, in the α-percent of the cases, the point PO corresponding to P in the initial acquired object will be inside the indexed P Box. Instead of having a continuous variety of ellipsoids or intervals, in this case, we have a finite number of bounding boxes (or bounding intervals in the case of scalar attributes).
• Q-Clusters: each relevant point P of the model stores a cluster index. This is again less precise than all previous quantitative options, Q-Clusters being qualitative fidelity statements. Again, the Q-Cluster of any point P is an index to a dictionary of uncertainty clusters, each cluster grouping regions acquired in a more or less precise way.
Of course, other options are possible and mixed encodings can be also interesting in some applications. Mixed encodings, can for instance, have an α-Interval in certain regions of the model and a coarser encoding like Q-Clusters in other zones.
Uncertainty/fidelity must also be properly visualized. The choice of visualization algorithms is critical as it will influence the user interaction and the final understanding, see next Section.
The process of generating measurable 3D models must ensure that fidelity to the physical object/scene is preserved along the different steps of the acquisition and reconstruction process. Local fidelity information must be captured at the acquisition phase and properly transformed during geometry and attribute processing of the 3D models into uncertainty bounds. Algorithms based on Interval Arithmetic are especially well suited for this purpose, while statistical approaches like the one proposed by Pauly et al. (2004) can be useful in data coming from laser scans. Pauly et al. (2004) capture uncertainty by introducing a statistical representation that quantifies for each point in space the likelihood that a surface fitting the noisy point data passes through that sample point. In any case, the key rule is to avoid discarding information at any processing step.
Model uncertainty information as stored in MDMs should not be confused with the final measure uncertainties during expert measurements. Geometric local uncertainty bounds in the model will be required by the specific computation algorithms during model measurements to produce measures with uncertainty information in the sense of JCGM (2008).
4. Immersive Interaction Tools for Data Comprehension
Data comprehension in VR setups can come as the result of implicit or explicit measurements. By observing, inspecting, and navigating virtual environments, users progressively build mental models of the 3D shapes while using implicit measurements. Implicit measurements include silhouettes, occlusions, and relative observed depth of the objects along lines of sight. Explicit measurements, on the other hand, should be able to measure dimensions, locations, distances, and angles by object and point selection. By rendering data with no uncertainty measures, however, most present systems produce unreliable implicit and explicit measurements as the rendered images are wrong and the amount of uncertainty is unknown. Note that, due to hidden errors, even the displayed topology of the surfaces can be invalid.
There are several approaches to visualize data uncertainty. Zuk and Carpendale (2006) surveys several approaches in specific domains like vector fields, molecule visualization, archeological reconstructions, surfaces, particles, and some others. Although their surfaces are close to the medical models discussed in this paper, archeological reconstructions do not consider acquired digital models. To visualize uncertainty in the boundaries of real and simulated tumor formations in medicine, Grigoryan and Rheingans (2010) propose a method based on rendering the surface as a collection of points while displacing each point from its original location along the surface normal by an amount proportional to the point uncertainty. The algorithm from Goesele et al. (2010) visualizes uncertainty in depth by distributing unknown geometry along a bounded segment of the viewing ray. A survey and taxonomy of several methods to visualize epistemic uncertainty has been prepared by Potter et al. (2012). Uncertainty can also be directly displayed by its corresponding α-Ellipsoid, α-Interval, or any other encoding at selected points or at a set of sample points on the object surfaces. But it can also be visualized by duplicating model surfaces and rendering them as thick uncertainty bands between two limiting surfaces that limit the space interval where the real surface is known to be. In this case, however, the front band surface should usually be semitransparent to maximize the band comprehension. Anyway, visualization of data uncertainty should always be an option for the user. Better data comprehension will usually be obtained by sequential interactive switching between standard scene rendering and visualization of data plus uncertainty.
Present immersive interaction tools do not support data uncertainty. In general, VR interfaces assume that objects have a unique (geometric and visual) representation. In cases where several levels of detail are considered, only one of them is used at any time instant [with the exception of cross-fading in short transient time intervals between LODs (Luebke et al., 2002)]. But using data uncertainly requires that users may be able to choose and decide when and how this uncertainly information is presented or hidden. Moreover, it could be useful to have automatic deactivation of this additional uncertainty information as soon as new interaction tasks have been activated to avoid interferences and disturbing visual information.
Research on 3DUIs has in general emphasized on input (mapping between user actions and application features) more than on output. For example, interaction techniques for discovery tasks in volume models and highly occluded virtual scenes are often neglected. This is a short list of challenges and interaction requirements for data comprehension:
• Present paradigms for selection and manipulation (Argelaguet and Andujar, 2013) focus on opaque geometry and cannot be extended to semitransparent uncertainty visualization, for instance. On the other hand, usual manipulation schemes assume exact geometry or fixed tolerances. New selection tools should, however, include uncertainty-aware selection methods that allow feature selection inside uncertainty bands and could also include regions of interest, see for instance Monclus et al. (2009), to restrict the search to regions with appropriate uncertainty measures.
• Selection paradigms should be extended by also offering 3D point selection. Point selection is not usual in VR systems but it is fundamental for metric measurements. The result of any 3D point selection should be the point position plus its corresponding uncertainty measure.
• Discovery tasks are essential in volume data inspection and in the analysis of highly occluded 3D scenes (engines, ship models, molecular design, etc.). Discovery tasks require specific tools to easily find elements of interest in the scene. Discovery tasks have a double relationship with uncertainty. First, discovery interaction tools must give local uncertainty information to the users without increasing neither the cognitive load nor the visual complexity of the rendered scene. Second, some typical techniques that facilitate discovery tasks [transparencies (Elmqvist and Tsigas, 2007), magic lanterns (Monclus et al., 2009)] can also be useful to visually represent local uncertainties while keeping a reasonable level of visual complexity.
• Navigation through the scene is a key action for implicit scene measurement and comprehension. Navigation in virtual environments includes exploration (scene inspection with no explicit goal), search (move to a target of known or unknown location) and Maneuvering (precise movement to examine something from different angles). Navigation should always support interactive switch on–off of the local uncertainty visualization to make users aware of regions having high and low quality model information. Search tools should also include mechanisms for search acceleration, like visualizing regions having their uncertainty below a certain threshold. A number of techniques have been proposed to compute automatically best views of surface and volume models (see Monclús (2014), Chapter 3 for a recent review) but again data uncertainty is not considered.
• Interactive model measures can only be performed after 3D point selections. Computations should be based on Interval Arithmetic, using the uncertainty measures of the end-points to compute error bounds for the results. The result of any explicit model measurement should be its value plus its confidence interval.
• The same arguments should be considered in the case of retrieving multi-dimensional attributes. Interaction tools should support potential visualization of uncertainties of any attribute in a local way during inspection and measurement sessions.
Novel immersive interaction tools for data comprehension should be able to adapt to quite different VR setups, from personal head-mounted displays and smart glasses, to fully immersive VR systems and distributed cooperative environments. We think that CAVE-like systems with low-cost multi-projector setups and gesture-based, cable-less interaction [see for instance Andujar et al. (under review)] can be an attractive solution for immersive and cooperative data comprehension.
5. Comprehension-Related Requirements in Sample Applications
Uncertainty information, when stored along with the data itself in a local way, can be used to control and inform data inspection. Measurable uncertainty representations (with respect to data sources used in the reconstruction process) must be preserved, processed, and stored as part of the digital models, thus fostering meaningful data exchange and reusability.
Tools for visualizing the fidelity and uncertainty of 3D models and methodologies for measuring them and facilitating data comprehension are application oriented. In what follows, we will focus on four specific applications with the aim to show that novel, uncertainty-oriented immersive interaction tools can offer new features that can better meet present user requirements. We will focus on four typical applications in the generic areas of cultural heritage, medicine, civil engineering, and urban planning (see Figure 2).
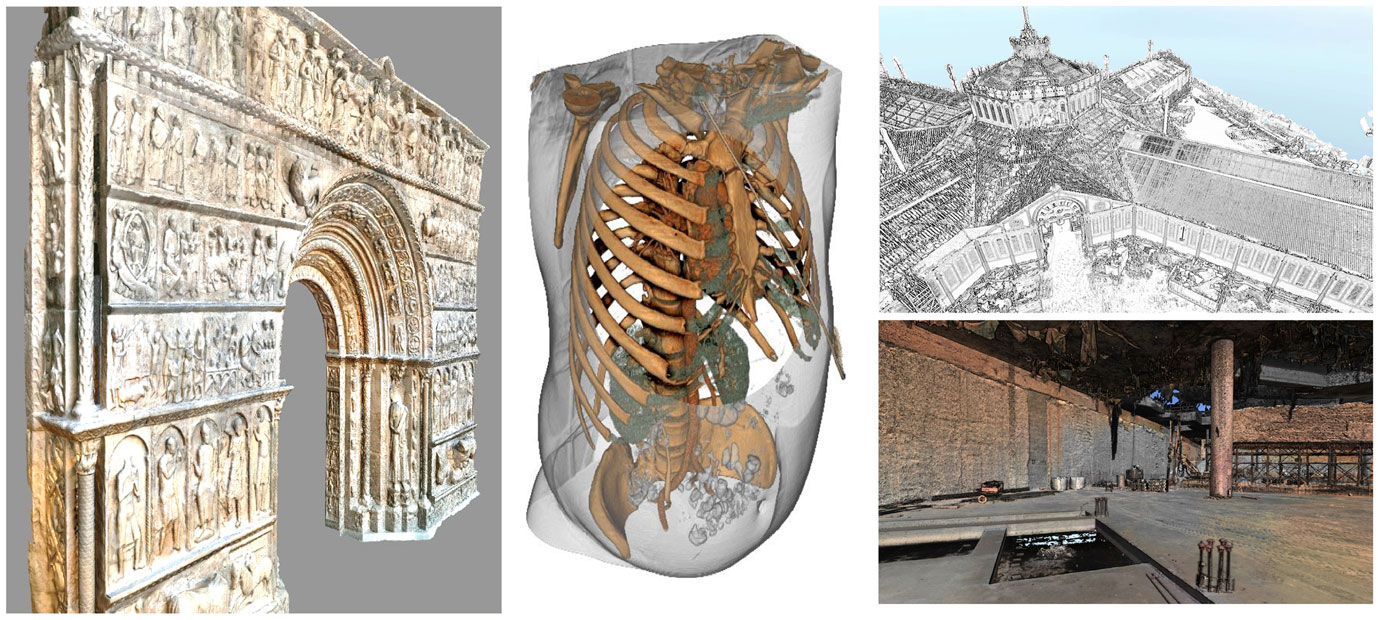
Figure 2. Sample applications in cultural heritage, medicine, urban planning, and civil engineering where model uncertainties play a key role.
5.1. Cultural Heritage
In the Cultural Heritage field, one of the main interests is to have specific planning and annotation tools for restoration and art experts (Arbace et al., 2013). A basic requirement is to have interactive navigation facilities for implicit measurements together with iterative model refinement to improve model quality in selected regions. Local layers with improved precision can be required after iterative model refinement.
Planning and annotation tools have specific requirements including point selection tools in models with uncertainty information and the possibility of making distance measurements with error bounds on the digital models. Interactive drawing on the model surface is also a common need.
5.2. Medicine
Among other possible applications, let us focus on digital model inspection for diagnose and surgical planning. Medical doctors may be interested in two different kinds of inspection, namely direct volume rendering and visualization of segmented volumes. Uncertainty visualization is more important in the second case, as noise and artifacts in direct volume rendering can be compensated by interactive modifications of the transfer function (Monclús, 2014). The main expert requirements consist on having explicit navigation tools for implicit measurements and on incorporating novel segmentation algorithms that preserve uncertainty information.
During interactive navigation, requirements include the possibility of rendering uncertainty bands on demand and specific tools for real-time adjustment of the uncertainty bands transparency. In this way, experts will have the opportunity of interactively representing/hiding uncertainty information in the segmented volumes.
5.3. Civil Engineering
Civil Engineering experts are increasingly interested on time-evolving models for public works tracking along construction time. Requirements include navigation tools for implicit measurements, the use of 4D models, and temporal registration. Usual 4D models are created from a discrete set of acquisitions along time that generate a number of layers (3D models at specific acquisition times). 4D models can afterward be generated by temporal interpolation among layers. A very specific requirement in this kind of applications is the need for uncertainty-aware registration algorithms among temporal layers.
Experts in this area require explicit measurements within layers and between layers, which should use uncertainty information. Inspection applications should include interaction mechanisms to focus on specific regions at precise times.
5.4. Urban Planning
The main requirement in urban planning applications is to have navigation tools for implicit measurements and data comprehension. These applications are somewhat singular because of a mix of acquired data (terrain, existing buildings) and designed (modeled) models. In this case, uncertainty information is required in all reconstructed data.
Urban planning experts usually require explicit measurements between acquired and modeled data and manipulation of modeled data with constraints from acquired data. They should, therefore, have tools to use uncertainty information in reconstructed models.
Table 1 compares requirements and potential new tools for each one of the four presented applications. A variety of requirements can be observed, and interaction tools must be application oriented. However, and in all cases, all of them require an appropriate visual representation of uncertainty information in existing VR systems.
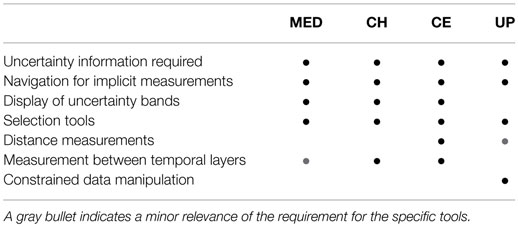
Table 1. Requirements and potential new tools in medicine (MED), Cultural Heritage (CH), Civil Engineering (CE), and Urban Planning (UP) applications.
6. Conclusions
Quality control and quality representation are a key requirement if Virtual Environments are going to be used by experts for analyzing data, understanding the relations between different parts and take measurements on digital models.
A number of problems are still open and require further research. We need stable and open solutions beyond existing applications. New solutions should generate Measurable 3D models, that is, 3D digital reconstructions that encode uncertainty and give information on the status of the objects at the acquisition time at a certain precision. MDMs must include geometric data plus attributes plus local fidelity information. By encoding this uncertainty information in a local way, MDMs support a measurable concept of the model fidelity at any surface point.
Inspection and interactive analysis tools for the experts should be developed based on their needs. Present immersive interaction tools are powerful, but still unusable in the context of measurable 3D models. Data comprehension in VR setups is achieved through implicit or explicit measurements. In both cases, present selection, manipulation, and navigation tools are not well adapted to the goal of understanding models and obtaining interactive model measurements. The design and development of novel, MDM-based immersive interaction tools is a promising avenue for further research.
Finally, the development of interactive applications for the inspection of digital models in mobile devices should be obviously considered.
Conflict of Interest Statement
The authors declare that the research was conducted in the absence of any commercial or financial relationships that could be construed as a potential conflict of interest.
Acknowledgments
This work has been partially funded by the Spanish Ministry of Economy and Competitiveness and FEDER under grant TIN2014-52211-C2-1-R.
References
Amenta, N., and Kil, Y. (2004). Defining point-set surfaces. ACM Trans. Graph. 23, 264–270. doi: 10.1145/1186562.1015713
Andujar, C., Brunet, P., Chica, A., and Navazo, I. (2010). Visualization of large-scale urban models through multi-level relief impostors. Comput. Graph. Forum 29, 2456–2468. doi:10.1111/j.1467-8659.2010.01757.x
Arbace, L., Elisabetta, S., Callieri, M., Dellepiane, M., Fabbri, M., Antonio, I. I., et al. (2013). Innovative uses of 3D digital technologies to assist the restoration of a fragmented terracotta statue. J. Cult. Herit. 14, 332–345. doi:10.1016/j.culher.2012.06.008
Argelaguet, F., and Andujar, C. (2013). A survey of 3D object selection techniques for virtual environments. Comput. Graph. 37, 121–136. doi:10.1016/j.cag.2012.12.003
De Boer, A., Voorbij, H., and Breure, L. (2009). “Towards a 3D visualization interface for cultural landscapes and heritage information,” in Proceedings of Computer Applications to Archaeology (Williamsburg, VA: CAA), 1–10.
Callieri, M., Chica, A., Dellepiane, M., Besora, I., Corsini, M., Moyes, J., et al. (2011). Multiscale acquisition and presentation of very large artifacts: the case of Portalada. ACM. J. Comput. Cult. Herit. 3, 14:1–14:20. doi:10.1145/1957825.1957827
Callieri, M., Ponchio, F., Cignoni, P., and Scopigno, R. (2008). Virtual inspector: a flexible visualizer for dense 3D scanned models. IEEE Comput. Graph. Appl. 28, 44–54. doi:10.1109/MCG.2008.20
Cignoni, P., Ganovelli, F., Gobbetti, E., Marton, F., Ponchio, F., and Scopigno, R. (2004). Adaptive tetrapuzzles: efficient out-of-core construction and visualization of gigantic multiresolution polygonal models. ACM Trans. Graph. 23, 796–803. doi:10.1145/1015706.1015802
Cignoni, P., Ganovelli, F., Gobetti, E., Marton, F., Ponchio, F., and Scopigno, R. (2005). “Batched multi triangulation,” in Proceedings of IEEE Visualization (Minneapolis, MN), 207–214.
Elmqvist, N., and Tsigas, P. (2007). “A taxonomy of 3D occlusion management techniques,” in Proceedings of the IEEE Conference on Virtual Reality (Charlotte, NC), 51–58.
Garland, M., and Heckbert, P. S. (1997). “Surface simplification using quadric error metrics,” in Proceedings of the 24th Annual Conference on Computer Graphics and interactive techniques (SIGGRAPH ’97) (Los Angeles, CA), 209–216. doi:10.1145/258734.258849
Gobbetti, E., Kasik, D., and Yoon, S. (2008). “Technical strategies for massive model visualization,” in Proceedings of the 2008 ACM symposium on Solid and physical modeling (SPM ’08) (Stony Brook, NY), 405–415. doi:10.1145/1364901.1364960
Gobbetti, E., and Marton, F. (2004). Layered point clouds. Comput. Graph. 28, 815–826. doi:10.1016/j.cag.2004.08.010
Goesele, M., Ackermann, J., Fuhrmann, S., Haubold, C., Klowsky, R., Steedly, D., et al. (2010). Ambient point clouds for view interpolation. ACM Trans. Graph. 29, 95:1–95:6. doi:10.1145/1778765.1778832
Grigoryan, G., and Rheingans, P. (2010). Point-based probabilistic surfaces to show surface uncertainty. IEEE Trans. Vis. Comput. Graph. 10, 564–573. doi:10.1109/TVCG.2004.30
Gruen, A., and Hanusch, T. (2008). “Image- and model-based reconstruction of the small Buddha of Bamiyan, Afghanistan,” in Proceedings of XXIst ISPRS Congress, nternational Society for Photogrammetry and Remote Sensing, The International Archives of the Photogrammetry, Remote Sensing and Spatial Information Sciences. Vol. XXXIV, Part 5/W12, 173–175. Available at: http://www.isprs.org/proceedings/XXXIV/5-W12/proceedings/39.pdf
Guidi, G. (2013). “Metrological characterization of 3D imaging devices,” in Proceedings of the XII SPIE Optical Metrology Videometrics, Range Imaging, and Applications Conference (Munich), 87–91. doi:10.1117/12.2021037
JCGM. (2008). Evaluation of measurement data. guide to the expression of uncertainty in measurement. Working Group 1 of the Joint Committee for Guides in Metrology (JCGM/WG 1). JCGM 100:2008. 1st ed. Available at: http://www.iso.org/sites/JCGM/GUM/JCGM100/C045315e-html/C045315e_FILES/MAIN_C045315e/Start_e.html
Kazhdan, M., Bolitho, M., and Hoppe, H. (2006). “Poisson surface reconstruction,” in SGP’06: Proceedings of the Fourth Eurographics Symposium on Geometry Processing (Cagliari), 61–70. Available at: http://dl.acm.org/citation.cfm?id=1281965
Kensek, K. M., Swartz, L., and Cipolla, N. (2004). Fantastic reconstructions or reconstructions of the fantastic? tracking and presenting ambiguity, alternatives, and documentation in virtual worlds. Autom. Constr. 13, 175–186. doi:10.1016/j.autcon.2003.09.010
Kolev, K., Pock, T., and Cremers, D. (2010). “Anisotropic minimal surfaces integrating photoconsistency and normal information for multiview stereo,” in Proceedings of the European Conference on Computer Vision (ECCV) (Hersonissos), 538–551. Available at: http://dl.acm.org/citation.cfm?id=1927048
Luebke, D., Watson, B., Cohen, J. D., Reddy, M., and Varshney, A. (2002). Level of Detail for 3D Graphics. New York, NY: Elsevier Science Inc.
Monclús, E. (2014). Advanced Interaction Techniques for Medical Models. PhD. thesis, Universitat Politècnica de Catalunya, Barcelona.
Monclús, E., Díaz, J., Navazo, I., and Vázquez, P.-P. (2009). “The virtual magic lantern: an interaction metaphor for enhanced medical data inspection,” in VRST ’09 Proceedings of the 16th ACM Symposium on Virtual Reality Software and Technology (Kyoto), 119–122. doi:10.1145/1643928.1643955
Pang, A., Wittenbrink, C., and Lodh, S. (1997). Approaches to uncertainty visualization. Visual Comput. 13, 370–390. Available at: http://www.ipet.gr/~akoutsou/docs/VWLT.pdf
Pauly, M., Mitra, N. J., and Guibas, L. J. (2004). “Uncertainty and variability in point cloud surface data,” in Proceedings of the First Eurographics Conference on Point-Based Graphics, SPBG’04. eds M. Alexa, M. Gross, H. Pfister, and S. Rusinkiewicz (Aire-la-Ville: Eurographics Association), 77–84.
Pavlidis, G., Arnaoutoglou, F., Koutsoudis, A., and Chamzas, C. (2009). “Virtual walkthrough in a lost town the virtual Argostoli,” in Proceedings of the IASTED International Conference on Software Engineering, GGIM (Innsbruck), 1–5. Available at: http://www.ilsp.gr/en/research/publications?view=publication&task=show&id=1236
Potter, K., Rosen, P., and Johnson, C. (2012). “From quantification to visualization: a taxonomy of uncertainty visualization approaches,” in Uncertainty Quantification in Scientific Computing, Vol. 377, IFIP Advances in Information and Communication Technology (Springer Verlag), 226–249. doi:10.1007/978-3-642-32677-6_15
Recker, S., Hess-Flores, M., Duchaineau, M. A., and Joy, K. I. (2012). “Visualization of scene structure uncertainty in a multi-view reconstruction pipeline,” in Vision, Modeling and Visualization, eds M. Goesele, T. Grosch, H. Theisel, K. Toennies, and B. Preim (Magdeburg: The Eurographics Association), 183–190.
Slater, M., and Steed, A. (2000). A virtual presence counter. Presence 9, 413–434. doi:10.1162/105474600566925
Slater, M., Usoh, M., and Steed, A. (1995). Taking steps: the influence of a walking technique on presence in virtual reality. ACM Trans. Comput.-Hum. Interact. (TOCHI) 2, 201–219. doi:10.1145/210079.210084
Theron, R., Gonzalez, A. I., Garcia, F. J., and Santos, P. (2007). “The use of information visualization to support software configuration management,” in Human-Computer Interaction – INTERACT 2007 (Ammersee), 317–331. doi:10.1007/978-3-540-74800-7_26
Yoon, S. E., Gobbetti, E., Kasik, D. J., and Manocha, D. (2008). “Real-time massive model rendering,” in Synthesis Lectures on Computer Graphics and Animation (Morgan & Claypool Publishers). doi:10.2200/S00131ED1V01Y200807CGR007
Zuk, T., and Carpendale, S. (2006). “Theoretical analysis of uncertainty visualizations,” in Proceedings of SPIE 6060, Visualization and Data Analysis 2006, 606–612. doi:10.1117/12.643631
Zuk, T., Carpendale, S., and Glanzman, W. D. (2005). “Visualizing temporal uncertainty in 3D virtual reconstructions,” in PProceedings of the 6th International conference on Virtual Reality, Archaeology and Intelligent Cultural Heritage (VAST’05). eds M. Mudge, N. Ryan, and R. Scopigno (Aire-la-Ville: Eurographics Association), 99–106. doi:10.2312/VAST/VAST05/099-106
Keywords: virtual reality, immersive data inspection, big data, measurable 3D models, acquired digital models, data comprehension
Citation: Brunet P and Andújar C (2015) Immersive data comprehension: visualizing uncertainty in measurable models. Front. Robot. AI 2:22. doi: 10.3389/frobt.2015.00022
Received: 29 May 2015; Accepted: 08 September 2015;
Published: 29 September 2015
Edited by:
Daniel Thalmann, Nanyang Technological University, SingaporeReviewed by:
Bruno Herbelin, École Polytechnique Fédérale de Lausanne, SwitzerlandEnrico Gobbetti, Center for Advanced Studies, Research, and Development in Sardinia, Italy
Copyright: © 2015 Brunet and Andújar. This is an open-access article distributed under the terms of the Creative Commons Attribution License (CC BY). The use, distribution or reproduction in other forums is permitted, provided the original author(s) or licensor are credited and that the original publication in this journal is cited, in accordance with accepted academic practice. No use, distribution or reproduction is permitted which does not comply with these terms.
*Correspondence: Pere Brunet, Moving Research Group, Research Center for Visualization, Virtual Reality and Graphics Interaction (ViRVIG), Computer Science Department, Universitat Politècnica de Catalunya, Campus Nord, Omega 239, Jordi Girona 1-3, Barcelona 08034, Spain, pere@cs.upc.edu