Encoded and crossmodal thermal stimulation through a fingertip-sized haptic display
 Simon Gallo1*†
 Giulio Rognini1,2,3*†
 Laura Santos-Carreras1
 Tristan Vouga1
 Olaf Blanke2,3,4
Hannes Bleuler1
Olaf Blanke2,3,4
Hannes Bleuler1
- 1Laboratory of Robotic Systems, School of Engineering, Ecole Polytechnique Fédérale de Lausanne, Lausanne, Switzerland
- 2Center for Neuroprosthetics, Ecole Polytechnique Fédérale de Lausanne, Geneva, Switzerland
- 3Laboratory of Cognitive Neuroscience, Brain Mind Institute, Ecole Polytechnique Fédérale de Lausanne, Geneva, Switzerland
- 4Department of Neurology, University Hospital of Geneva, Geneva, Switzerland
Haptic displays aim at artificially creating tactile sensations by applying tactile features to the user’s skin. Although thermal perception is a haptic modality, it has received scant attention possibly because humans process thermal properties of objects slower than other tactile properties. Yet, thermal feedback is important for material discrimination and has been used to convey thermally encoded information in environments in which vibrotactile feedback might be masked by noise and/or movements. Moreover, the well-reported influence of temperature over tactile processing makes thermal displays good candidates for the development of crossmodal haptic interfaces, in which temperature is used to manipulate other sensations. Here, we present a thermal display able to render four individually controlled temperatures at the user’s fingertip along with its technical characterization and psychophysical evaluation. Device performance was assessed in terms of accuracy and repeatability. In the psychophysical evaluation, we first show that the device can render perceivable temperature gradients at the level of the fingertip, thereby extending the concept of thermally encoded information to fingertip-sized thermal displays. Second, we show that increasing temperature improves stiffness precision. Results show that neglected features of thermal feedback, i.e., encoded and crossmodal thermal stimulation, can be provided by fingertip-sized thermal displays to improve haptic manipulations.
Introduction
Haptic technology aims at artificially creating tactile sensations by applying different features of touch (e.g., vibration, texture, tapping) to the user’s skin. Recent advances in the field have led to the development of tactile displays able to render features such as shapes (Ottermo et al., 2008), lumps with different stiffness, and sizes (Gwilliam et al., 2012) or force feedback due to contact with an object (McMahan et al., 2011). Thermal perception is also often included within these haptic modalities. In fact, as with the sense of touch, temperature is felt through receptors in the skin and the heat exchange between the skin and the environment is bidirectional: when our skin touches an object, the heat exchanged alters the temperature of the skin as well as the object temperature.
To date, many research groups have investigated the role of temperature or thermal flow sensation in the tactile identification of materials or tissues. For this reason, the grand majority of the current temperature displays have been exclusively used to simulate different thermal properties of materials in order to improve object identification in virtual and tele-operated environments (Ino et al., 1993; Yamamoto et al., 2004; Guiatni et al., 2008). This focus on virtual rendering of material properties has limited the design of thermal displays and bounded the research on thermal perception. For example, current thermal displays cannot provide multiple thermal stimuli simultaneously, and, respectively, we do not know whether humans can differentiate multiple temperatures applied on a small skin surface, like the fingertip. Yet, this matter is of particular interest for novel applications of thermal interfaces such as using the display to present scalar, non-thermal information to the user under the form of encoded thermal stimuli (Zerkus et al., 1994; MacLean and Roderick, 1999). For example, Wilson et al. (2013) successfully used encoded thermal feedback to convey scalar information in environments in which audio or vibrotactile feedback might be masked by noise or movements.
Most of today’s tactile displays are able to render only one tactile feature (e.g., vibration, friction, tapping, or temperature) at a time. However, to perceive our surrounding environment, we rely on several sensory modalities that we integrate into a coherent percept (Ernst and Bülthoff, 2004). Thus, to increase realism it might be beneficial to display several features of tactile stimuli as well as feedback from other sensory modalities (e.g., vision and audition). Going in this direction, in the last decade, several tactile multi-feature devices, including miniaturized thermal displays, have been developed (Kammermeier et al., 2004; Yang et al., 2007; Kim et al., 2010). However, while successfully rendering different haptic features (e.g., temperature, pressure or force), these devices neglect crucial interactions among different sensory modalities or different haptic features. This is especially surprising for the case of thermal feedback as a large number of studies have reported an influence of skin temperature on tactile perception (Russ et al., 1987; Markand et al., 1990; Phillips and Matthews, 1993). This characteristic influence of temperature upon different features of tactile processing makes thermal feedback a good candidate for the development of crossmodal haptic displays in which one modality is used to influence another.
In summary, current thermal displays are not able to provide more than one temperature or a temperature gradient at the level of the fingertip and they are often designed to only simulate different thermal properties of materials in virtual environments.
In a previous study, we have presented a proof-of-concept thermal display capable of rendering multiple distinct temperatures at the level of the fingertip (Gallo et al., 2012). However, the presentation of the device lacked of both an in-depth technical and psychophysical evaluation (and the related applications). Here, we present an upgraded version of the fingertip-sized thermal display and perform its technical characterization. Then, in the psychophysical evaluation, we show the possibility to use it in two important but often neglected applications of thermal feedback: conveying thermally encoded information (experiment 1) and using thermal feedback to manipulate tactile processing (experiment 2: crossmodal stimulation).
The design of the thermal display is presented first. It has several innovative features such as a high spatial resolution due to four adjacent small and powerful thermal units fitting under the fingertip. The characterization of the device is performed in terms of thermal accuracy and repeatability. In the psychophysical evaluation, we first assess the capability of the user to identify multiple thermal stimuli presented simultaneously under the fingertip. This is done to validate the use of a high resolution thermal display under the fingertip to render combinations of thermal stimuli in order to convey encoded information (experiment 1: thermally encoded information). Finally, the thermal display is integrated into a commercial haptic interface to test the possibility to manipulate stiffness perception through thermal feedback (experiment 2: crossmodal stimulation). Given the well-reported influence of tactile cues on stiffness discrimination (Srinivasan and LaMotte, 1995; Bergmann Tiest and Kappers, 2009), and of temperature on mechanoreceptor’s sensitivity (Stevens and Green, 1978; Green et al., 1979; Stevens, 1982, 1989; Stevens and Hooper, 1982; Srinivasan and LaMotte, 1995; Lowrey et al., 2013), we hypothesized that temperature affects stiffness perception. More specifically, as the sensitivity of mechanoreceptors to mechanical stimulation was found to increase/decrease with increasing/decreasing skin temperature, we expected the precision of stiffness perception to improve with increasing skin temperature.
The Thermal Display
To date, most thermal displays are composed of a Peltier element (PE), a heatsink, and a temperature sensor (Ino et al., 1993; Yamamoto et al., 2004; Guiatni et al., 2008). The temperature of the top side of the PE is controlled using the sensor input in a feedback loop while the heatsink, placed against the bottom side of the PE, is used to evacuate excess heat from the system. These devices are not meant to be integrated in multimodal haptic stations or worn; they are voluminous with large Peltier elements (PEs) and large heatsinks to evacuate the heat on the hot side. Furthermore, current thermal displays typically provide a single thermal channel, stimulating the fingertip in its entirety.
The thermal display employed in this study is fingertip-sized and can provide individually controlled thermal stimulations at four distinct locations under the fingertip.
Design
This compact display, presented in Figure 1, measures 28.5 mm × 21.6 mm × 10 mm. It features four thermal units each consisting of a PE (3.8 mm × 4.8 mm × 1 mm, KSAH018, Komatsu Electronics KELK Ltd., Japan), a K-Type Nickelchromium/Nickel-aluminum thermocouple (LABFACILITY, UK), and a copper plate. A thermocouple is glued over each PE with a thermal adhesive paste (Arctic Silver™) and surmounted by a copper plate used as a heat diffuser and as the interface with the finger. The four thermal units are aligned and glued along a water-cooled copper heat sink. Each thermal unit measures 14 mm × 4.2 mm × 1.9 mm. The 0.4-mm gap between adjacent units is filled with a hot-melt adhesive to obtain a smooth continuous contact surface without undesired tactile cues, while thermally insulating the copper plates from one another.
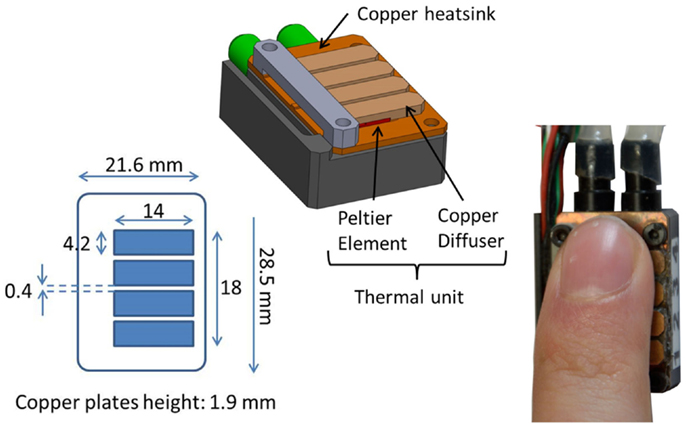
Figure 1. Thermal display. The display consists of four thermal units (Peltier element, thermocouple, and copper diffuser), placed in line on top of a custom water-cooled copper heatsink.
Cooling System
Peltier elements transfer heat from one surface to the other. However, the PE efficiency decreases with the increase of the temperature difference between its two surfaces (ΔTpelt). Furthermore, when one surface is being cooled, the other can easily overheat due to the Joule effect adding up to the heat transferred by the Peltier effect as described in Eq. 1. The generated heat (H) is:
where Qmax is the maximum heat transferred, R is the electrical resistance of the PE, and Imax is the maximum current applied.
To successfully control one surface of the PE and boost the performance, the heat generated on the unused surface must be removed. Natural convection does not require any actuation. However, to dissipate the 26 W of heat generated by four PEs (from Eq. 1, with Qmax = 2.8 W, R = 0.7 Ω, Imax = 2.3 A) a large heatsink is required. Thus, forced convection was favored to increase the heat exchange and reduce the size of the heatsink. The Nusselt Number (Nu) represents the ratio between convective heat transfer and conductive heat transfer. Therefore, the higher the Nu the stronger the convective heat transfer. With the custom heatsink and pump of the presented thermal display, Nu of 20.1 (heat transfer coefficient h of 1895 W/m2K) is obtained. This water cooling system is able to maintain the temperature of the heatsink (thus of the non-exposed side of the PE) at a constant temperature for any input current applied on the four PEs simultaneously [see Gallo et al. (2012) for details].
Control
The previous version of the display was driven using a Proportional-Integral-Derivative (PID) voltage control, a common control strategy for thermal displays (Ho and Jones, 2007; Guiatni et al., 2008). While voltage control using pulse width modulation (PWM) of the DC input voltage is simple to implement, it has some drawbacks compared to direct current control. In fact, while the average current (determining the cooling power of the PE) is the same in both cases, the peak current used with PWM control generates larger Joule heating that, in turn, decreases the overall PE efficiency. For this reason and because PEs are non-ohmic devices, which resistance varies with temperature, current control is preferable (Yamamoto et al., 2004). We upgraded from voltage to direct current control of the PEs by using MAX1978 (Maxim Integrated™) single-chip temperature controllers. Built-in thermal control-loop circuitry and ripple cancelation circuitry avoid current surges and non-linearities usually encountered with voltage control. Overall, this control provides an excellent temperature stability and dynamic response (see Figure 2).
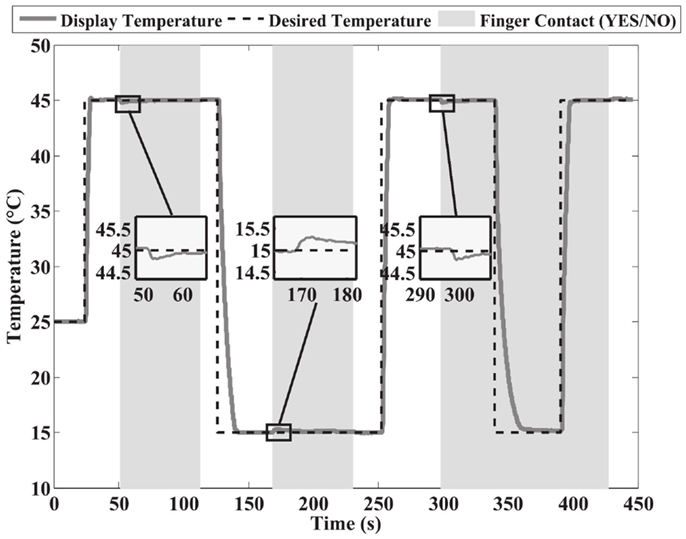
Figure 2. Single Peltier behavior. The behavior of a single Peltier unit with and without finger contact for temperature steps from 15 to 45°C (and vice versa) is illustrated. Temperature stability is within ±0.15°C of the desired temperature and response to the external perturbation is within ±0.5°C.
Technical Characterization
A considerable number of tactile displays have been developed in the last decade (Yamamoto et al., 2004; Yang et al., 2007; Guiatni et al., 2008). However, metrics to assess the thermal performance of such displays are still lacking. Commonly, the maximum temperature change rate (i.e., how fast the temperature on the device can change during both cooling and heating) that can be achieved by the display is used as a measurement of performance. This measure is dependent on many factors, such as room temperature, heat evacuation on the other side of the PE, and is especially affected by the contact with a thermal load such as the user’s finger. Furthermore, depending on the application, the importance of specific characteristics of the device can change. In the following characterization, we will first discuss the heat dissipation capability of the cooling system, which is essential to achieve an optimal PE control in any thermal application. Then, the temperature stability (i.e., the capability of the device to maintain the temperature close to the desired temperature) and rejection of thermal perturbations (i.e., maintain stability despite an external perturbation) due to the user’s finger are discussed. These characteristics are especially important when providing encoded thermal information. Indeed, strong perturbations could result in the user perceiving undesired cooling or heating cues. When touching an object, the initial temperature change rate induces most of our thermal sensation (Yamamoto et al., 2004; Tiest and Kappers, 2009). Thus, we further characterize the dynamic response (i.e., the time-varying behavior of the system) of the system in terms of fall and rise times (i.e., the time taken by the display to decrease, fall, or increase, rise, from a specified temperature to another specified temperature) and measure its repeatability (i.e., how variable these times are for multiple repetitions of the same temperature step). These dynamic characteristics of the system are important both for providing thermal encoded information through rapid temperature variations and for simulating the thermal interaction during contact with a virtual object (although the latter application was not investigated in this study). Finally, to show that this device can simulate most of the objects found in our environment, we compare the cooling rate induced on the finger by a copper slab with the one induced by the device.
Commercial water heatsinks are efficient but too bulky for portable applications. Thus, in order to miniaturize thermal displays, custom heatsinks must be produced and their performance assessed. The custom heatsink mounted on the proposed device was found to maintain a constant temperature for any input current of the PE, as shown earlier (Gallo et al., 2012), and can thus evacuate the heat generated by the PE.
Figure 2 illustrates the behavior of a single PE with and without finger for command steps from 15 to 45°C [not in the thermal pain range (Jones and Ho, 2008)] and vice versa. Temperature stability within ±0.15°C of the desired temperature and within ±0.5°C with the finger contact was obtained. From the same figure one can also notice the influence of the finger on the step response.
In order to quantitatively determine the influence of the thermal load as well as the temperature step magnitude on the temperature change rate, the rise and fall time (from 10 to 90% of the desired value and 90–10%, respectively) were measured for six different step heights with and without finger contact. Figure 3 presents the mean fall and rise times and final temperature for each step in each condition (with and without finger). Before each step, the finger–PE contact temperature was stabilized at a 32°C initial temperature. During the experiment, room temperature varied between 24 and 27°C. The finger thermal load has little influence on the performance of the device for most steps, especially between room temperature and finger temperature (typical range for object discrimination). Fall/rise times increase with cooling/heating step size. This is expected as the PE cooling power decreases with increasing ΔTpelt. Small SDs despite variations in room temperature suggest a strong robustness of the device design.
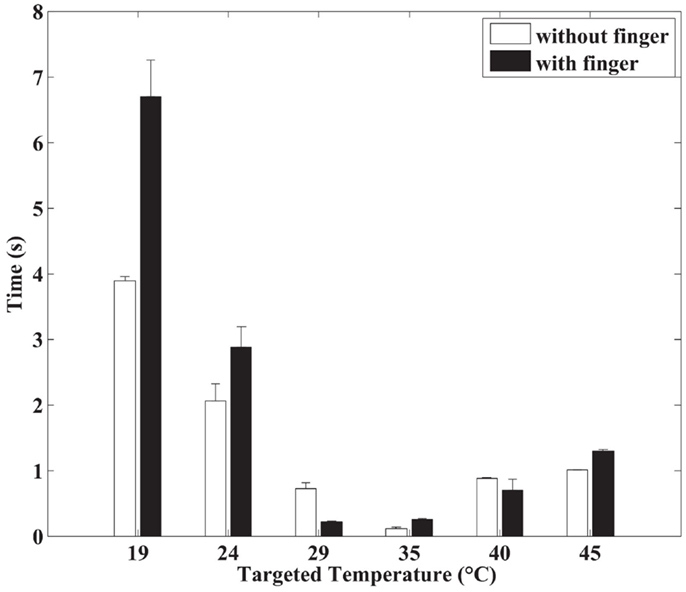
Figure 3. Effect of thermal load and temperature step magnitude on the temperature change rate. Rise and fall time (from 10 to 90% of the desired value and 90 to 10%, respectively) were measured (six different steps, all starting from 32°C) with and without finger contact. Smaller time indicates faster response of the device (higher bandwidth). Error bars represent the SD of the mean.
When a finger comes in contact with an object at room temperature, at first the skin temperature drops rapidly, then the temperature change rate decreases as the finger and object temperatures tend toward equilibrium. This first phase, called early time sensation in (Yamamoto et al., 2004), is responsible for most of the thermal sensation. Therefore, during object manipulation, the perceived thermal sensation strongly depends on the initial temperature change rate determined by the thermal diffusivity of the object (Tiest and Kappers, 2009). The rise and fall times do not assess whether these parameters are precisely reproduced from one step to another. To evaluate their repeatability, a different metric is required. To do so, we tested the device by performing temperature steps from 32 to 24°C with and without index finger contact. Each condition was repeated 10 times for a total of 20 measurements per subject and 60 measurements in total (three male subjects, age range 26–29 years). The selected temperature step covers the transient temperature drop for most materials. The mean temperature profile and its SD were then derived for both conditions (with and without finger). Thus a mean and a SD were obtained for each discrete sample. In order to estimate the repeatability of the cooling profile, we considered the maximum SD (out of all the discrete points SDs) for both conditions, i.e., the largest spread point along the temperature profile. The maximum SDs (over the entire temperature profile), 0.42°C with finger and 0.47°C without finger, were below 6% of the step value. Considering that changes of 10% in the skin thermal properties (variance between subjects) can result in changes up to 8% in the skin temperature drop (Ho and Jones, 2008), the repeatability of this device is clearly satisfactory.
Finally, to compare the presented device with the state of the art devices, mainly used in object discrimination tasks, we determined whether each individual thermal unit had sufficient cooling power to simulate the temperature drop occurring when the finger contacts objects at room temperature. Due to its high thermal conductivity and density, copper is one of the materials in our environment with the highest thermal diffusivity thus generating the fastest skin temperature drops. Hence, if the thermal unit is able to cool the skin faster than a copper slab, it should have sufficient cooling power to simulate most materials in our environment. Hence, the temperature profile of a finger contacting a copper slab at room temperature (21°C) was measured. As the geometry of the copper slab will influence the initial heat transfer (Tiest and Kappers, 2008), the finger was pressed against the smaller surface of a 17 mm × 17 mm × 145 mm slab granting a sufficiently low Fourier number (~0.005) and ensuring the validity of the semi-infinite model used in many discrimination studies (Yamamoto et al., 2004; Ho and Jones, 2008). The finger was placed on one of the four PE and its temperature stabilized to the average initial finger temperature recorded just before contacting the copper slab in the previous experiment. The surface/finger was then cooled at the PE maximum rate down to the arbitrary temperature of 23°C. Figure 4 shows the average and SD of the finger temperature drop when touching copper out of 15 measures as well as the average PE-induced temperature drop for a typical subject. The finger cooling rate is clearly higher with the PE than with the real copper slab. Therefore, it is safe to assume that each of the four thermal units (PE with water cooling) can be used to realistically simulate the interaction of our skin with most objects found in our environment.
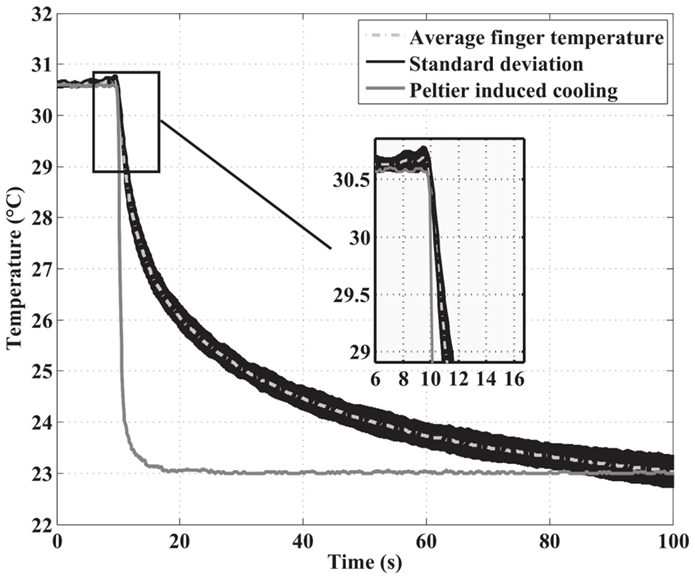
Figure 4. Comparison between copper-induced and display-induced cooling of the finger. Average and SD of the finger temperature drop when touching copper as well as maximum cooling rate profile of the thermal display are shown. Note that the display can guarantee a cooling rate higher than the one necessary to render the common material with highest cooling rate, i.e., copper.
Psychophysical Evaluation: Encoded and Crossmodal Thermal Stimulation
Experiment 1: Gradient Sensitivity and Spatial Modulation (Thermally Encoded Information)
No thermal display is currently able to provide several thermal stimuli simultaneously. Although this might be related to previous research showing that two distinct materials cannot be discriminated under one single fingertip based on thermal cues alone (Yang et al., 2009), no study has yet investigated whether several distinct and constant temperatures can be differentiated under the fingertip. This may be of great importance for novel applications of thermal interfaces such as using the display to present scalar, non-thermal information to the user under the form of encoded thermal stimuli (Zerkus et al., 1994; MacLean and Roderick, 1999). For example, Wilson et al. (2013) successfully used encoded thermal feedback to convey information in environments in which audio or vibrotactile feedback might be masked by noise or movements. In their studies, thermal feedback was used instead of vibration to provide warnings about incoming cellphone messages. By varying thermal parameters such as subjective intensity (moderate warm, intensive cold, etc.) or direction of the temperature change, it was possible to inform the user on the urgency of the message (very warm for urgent, mild warm for not urgent) or the identity of the sender (warm for family, cold for work, for example). The limited number of thermal parameters used to convey information simplifies the design and control of the thermal display. In comparison, thermal discrimination of virtual objects requires an accurate modeling of the heat transferred between the skin and the object (Bergamasco and Alessi, 1997; Yamamoto et al., 2004; Ho and Jones, 2008). This complicates the control scheme as thermal properties of the object and the skin, such as their thermal diffusivities (Tiest and Kappers, 2009) need to be taken into account. A display providing multiple thermal stimuli on small skin surfaces has the potential to provide a larger amount of information to the user, e.g., compared to a vibrator, while still being compact, discrete, and wearable.
Participants
A total of eight healthy right-handed participants took part in experiment 1 (two females; age range 23–30 years). All participants had neither history of neurological disorders nor any known tactile or thermal systems abnormalities. All participants gave written informed consent, and were compensated for their participation. The study protocol was approved by the local ethics research committee – La Commission d’Ethique de la Recherche Clinique de la Faculté de Biologie et de Médecine – at the University of Lausanne, Switzerland, and was performed in accordance with the ethical standards laid down in the Declaration of Helsinki.
Material, Methods, and Procedure
The aim of experiment 1 was to investigate the possibility to render encoded thermal information (perceive at least two different temperatures) using compact displays at the level of the fingertip. The minimum distance required to differentiate two distinct thermal stimuli will determinate the minimum size of the display. Although differentiating more than two simultaneous stimuli under the fingertip would increase the amount of encoded information, spatial summation (Kenshalo et al., 1967) and low spatial resolution (Yang et al., 2009) of the skin suggests that the differentiation of more than two neighboring stimuli on the fingertip will be difficult. Thus, we studied the minimal perceivable temperature difference between two stimuli (just noticeable difference, JND) at two distinct locations. We tested four different spatial configurations, 1–4, 2–4, 1–3, and 2–3 as shown in Figure 5. These configurations correspond to three distances between the centers of the two copper plates providing the thermal stimuli: 4.6, 9.2 (administrated twice at two different locations of the fingertip: 2–4 and 1–3), and 13.8 mm. The contact area on the four plates was estimated from images of the finger taken after it was colored with ink and pressed on a paper footprint of the device. The index finger was positioned on the device in order to obtain four similar contact surfaces of ~57 mm2 for the central plates, and 54 mm2 for the outer plates.
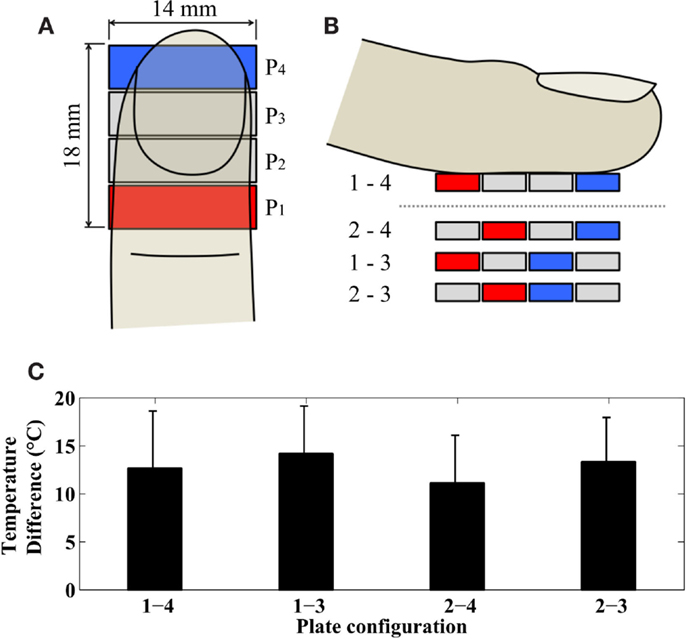
Figure 5. Representation of the four plates of the display, the blue plate is cold, the red is hot, and the gray plates are set to body temperature. (A) Top view of configuration 1–4. (B) Side view with the four temperature configurations. (C) Just noticeable temperature difference between two simultaneous thermal stimuli. There was no significant effect of plate configuration.
To calculate the JND, we used a yes/no choice paradigm with a two-down one-up staircase method (Wetherill and Levitt, 1965; Levitt, 1971), which estimates the JND with a 70.7% correctness. Thus, in this experiment, the JND is calculated as the minimum interval for which two different stimuli are recognized as such 70.7% of the times (Grassi and Soranzo, 2009). During the threshold tracking, two different step sizes were used for the online adjustment of the stimuli levels; one large (6°C) for the first four reversals and one small (2°C) for the next eight. The procedure stopped after 12 reversals (varying number of trials between subjects) and the final JND was calculated as an average over the last eight reversals (Grassi and Soranzo, 2009). These are based on typical practice in psychophysics and are due to an empirical trade-off between accuracy (the larger number of reversal the better) and experimental time (Wetherill and Levitt, 1965; Ernst and Banks, 2002; Hillis et al., 2002). The participants were asked to place their finger on an additional PE for 5 s in between each trial to reset the initial finger temperature to the neutral temperature measured before the tests.
Results
Globally, the estimated JND ranged from a minimum of 5.1°C to a maximum (poorest sensitivity) of 19.4°C across all subjects and all tested distances. Single subject data shows that the large variability is due to inter-individual rather than between condition differences. Importantly, all the reported thresholds were therefore within the range of investigation (i.e., a difference of 20°C centered at the body temperature of each participant). Repeated measures one-way ANOVA (four spatial conditions) did not show any significant difference between the four configurations (P > 0.25). More specifically, the JNDs (mean °C ± SD) were 12.6 ± 6°C for condition 1–4, 14.1 ± 5°C for condition 1–3, 13.3 ± 4.6°C for condition 2–3, and 12.1 ± 5°C for condition 2–4 (see Figure 5). Overall, when pooling all data together the average JND was 13.0 ± 4.2°C. These results provide no evidence for an effect of spatial configuration (contact distances along the finger) on the JND.
Experiment 2: Manipulating Stiffness Perception through Thermal Feedback (Crossmodal Thermal Stimulation)
Currently, haptic devices capable of rendering multiple haptic features exist (e.g., temperature, pressure, or force), but neglect crucial interactions among these features. This paucity is especially surprising for the case of skin temperature and tactile perception. Indeed, several studies highlighted the effect of skin temperature on the sensitivity of most mechanoreceptors, as reflected by changes in their activation threshold (Bolanowski and Verrillo, 1982; Verrillo and Bolanowski, 1986; Kunesch et al., 1987; Harazin and Harazin-Lechowska, 2007; Lowrey et al., 2013). This effect of temperature on mechanoreceptors has been shown to have a direct influence on tactile acuity (Stevens, 1982), the perception of roughness (Green et al., 1979), or two-point discrimination thresholds (Stevens, 1989). Interestingly, combined coding of mechanical and thermal stimulations could account for reported effects of skin temperature on object recognition by touch (Stevens and Hooper, 1982). In particular, the silver Thaler illusion, first described by Weber in 1846 [see Stevens and Green (1978)] involving cold objects to feel heavier than warm objects of equal weight and dimensions, appears to derive from the effects of thermal gradients on slow adaptive mechanoreceptors of both type I or II (SAI and/or SAII) (Cahusac and Noyce, 2007). Furthermore, for the perception of complex features resulting from a multimodal haptic integration, the influence of skin temperature is more intricate. For example, a strong implication of temperature in the perception of wetness was observed with effects different to the ones observed for vibrotactile perception (Filingeri et al., 2014). In fact, warm and wet stimuli have been found to suppress the perception of skin wetness (Filingeri et al., 2015) while on the contrary cool but dry objects were observed to evoke the perception of wetness (Filingeri et al., 2013). Given both the influence of tactile cues on stiffness discrimination (Srinivasan and LaMotte, 1995; Bergmann Tiest and Kappers, 2009) and of temperature on mechanoreceptor’s sensitivity, our hypothesis was that temperature affects stiffness perception. More specifically, we expected the precision of stiffness perception to improve with increasing skin temperature.
Participants
A total of five healthy right-handed participants took part in experiment 2 (one female; mean age 25.8 years). All participants were free from neurological disorders and had no known history of somatic or thermoesthesia abnormalities. All participants gave written informed consent and were compensated for their participation. The study protocol was approved by the local ethics research committee – La Commission d’Ethique de la Recherche Clinique de la Faculté de Biologie et de Médecine – at the University of Lausanne, Switzerland, and was performed in accordance with the ethical standards laid down in the Declaration of Helsinki.
Material and Methods
In this experiment, the temperature of the entire fingertip had to be controlled. To provide a homogenous temperature, we covered the four PEs with one large copper plate (instead of the four separate plates), and placed a thermocouple on top of this copper plate, as close as possible to the finger contact surface. In order to display several controlled levels of stiffness, we then mounted the thermal display on an Omega 3 (Force Dimension, Switzerland) force feedback device. The three arms of this device, acting in parallel, are connected to a vertical end-plate on which different types of end-effectors can be mounted (Figure 6A). We manufactured a custom end-effector with two superposed horizontal plates, the bottom one supporting a force sensor and the top one housing the thermal display (Figure 6A and inset). The force sensor (CentoNewton; range: 0–10 N; Size: 16 mm square; Span: ±3%; Response time <10 ms) is taped to the top side of the bottom plate. The thermal display slides horizontally into a slot on the superior face of the upper plate and is secured with a screw. The finger force exerted on the thermal display is transmitted to the force sensor through a steal sphere, thus creating a one point contact removing undesired torques. This design, in combination with the blade in the upper plate, was implemented to measure only vertical forces and ensures a standardized range of forces exertion for stiffness judgments across participants. Indeed, previous studies (Yamamoto et al., 2004; Ho and Jones, 2008) have emphasized the role of the contact force on the quality of the heat exchange, but also on physiological factors such as the reduction of the blood flow in the fingertip. For forces above 2 N, the contact surface and the corresponding thermal resistance increase very slowly and can be considered constant (Ho and Jones, 2008). The mechanical interface can be schematized as two parallel springs as illustrated by Figure 6 inset. This system is described by the following equation:
where Ffinger is the force applied by the user, Ktors and Ktrans are the stiffnesses of the two springs representing the stiffness of the blade and of the force sensor, respectively, and δ1 and δ2 are the displacements of the springs. If Ktrans is much larger than Ktors, the second spring can be neglected, which implies that the force measured by the force sensor is equal to the vertical component of the force applied by the user.
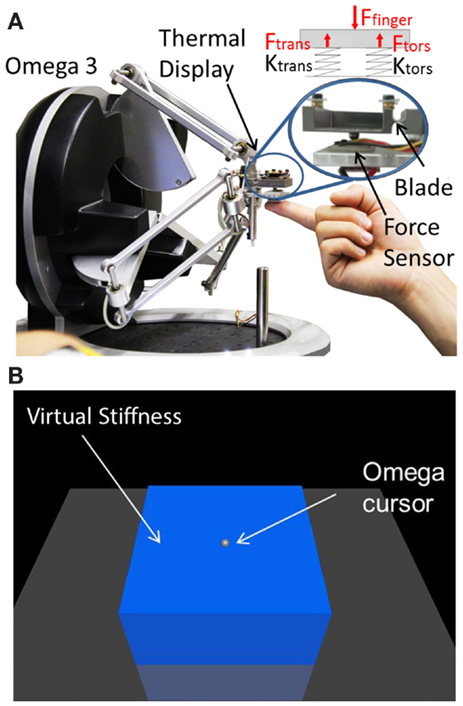
Figure 6. Photo of the experimental setup. Experimental setup. (A) The thermal display is mounted on the Omega 3 force feedback device to provide a multimodal stimulation. For stiffness palpation the subject placed the finger on the thermal display. Between trials, the subject placed the finger under the end effector on a PE kept at the finger base temperature (as illustrated here). (B) A virtual environment was used to instruct the participants during the two-alternative forced-choice task.
Procedure
To test our hypothesis that changing the temperature of mechanoreceptors at the fingertip would influence sensibility to stiffness, participants judged the relative stiffness of two virtual surfaces (the standard and the test) for three contact temperatures (T1: 15°C, T2: 25°C or T3: 40°C) in a two-alternative forced-choice task. The stiffness of the reference was 150 N/m. It was compared with any of seven equally spaced test stiffnesses in the interval 30–270 N/m (i.e., 30, 70, 110, 150, 190, 230, and 270 N/m) using the method of constant stimuli. The sensation of hardness can be perceived starting from 10,000 N/m (Lawrence and Chapel, 1994); the rendered objects are thus soft. These values were determined from stiffness specifications of the Omega 3 device and preliminary tests conducted on two subjects. The set of test stiffnesses is bounded by values corresponding to each end of the psychometric curve where discrimination could be achieved with nearly 100% accuracy.
In a typical trial, participants were asked to place the tip of their right index finger on the thermal display mounted on the Omega device and to push down until the contact with the surface of a virtual cube was perceived haptically (Figure 6B). An open-source platform (CHAI 3D)1 was used for modeling and simulating the haptics (1 kHz refresh rate) and for visualization. The virtual scenario, displayed on a desktop screen, was only used to guide the subjects though the experimental procedure by signaling the beginning or end of a trial (break). The displayed cube was there to ensure that the subjects would push at the same approximate location (the center of the top face of the cube), but no visual cues related to the applied force, such as deformation or displacement of the cube, were provided. A “go” signal appeared on the screen if the finger force exerted on the surface was between 2 and 6 N and the contact lasted longer than 5 s. This was done to instruct participants about the amount of force they would need to apply during the task. Small movements of the index finger during stiffness perception were allowed (the role of kinesthetic cues in this experiment and in stiffness perception in general is discussed in the Section “Discussion and Conclusion”). The two stiffness stimuli, reference and test, were always presented with the same contact temperature in each trial. Subjects were given 5 s to palpate each stimulus. The stimuli were separated by an interval of 5 s. The entire trial duration was 20 s (2 s× 5 s force adjustment + 2 s× 5 s palpation). The time interval between trials, which varied from 5 to 30 s, depended on the temperature difference between consecutive trials (the larger the difference, the longer the time for the device to display the desired temperature). During this time interval, participants were asked to place the index finger on a PE kept at their base skin temperature measured at the beginning of the experiment. At the beginning of this time interval participants had 6 s to respond, via a button press, whether the second stiffness was greater than the first.
The standard stiffness was randomly assigned to the first or second presentation, but measured responses were always comparing the test with the standard. Trials in which the participants fail to give an answer or answered after 6 s were discarded (this accounted for only 2.0% of all trials). Each comparison was repeated 16 times for each contact temperature. This yielded a total of 336 trials per participant, recorded in four 2-h sessions performed on different days. Before the experiment, participants underwent a short training to familiarize themselves with the task.
Statistical Analysis
For each stiffness test at each selected temperature, individual responses were pooled across all participants to obtain a probabilistic measure of the response and yield a sufficient sample to fit a psychometric function and perform the statistical analysis (Wichmann and Hill, 2001a,b). This consisted in calculating the proportion of “stiffer” responses for every stiffness test for each given temperature. Then, a cumulative Gaussian function of this type was used to fit the data:
where, y is the fraction of trials perceived as stiffer, x represents the stiffness levels, μ is its mean and σ its SD. Psychophysically, μ represents the level of stiffness that subjects perceived 50% of trials as stiffer than the reference stiffness (i.e., the point of subjective equality, PSE), whereas σ corresponds to the 0.84 level of the curve and represents the precision of the stiffness judgment. Smaller σ corresponds to greater precision. Thus, the fitting procedure allows the extraction of measures of mean and SD for each temperature condition (i.e., three μ: μT1, μT2, μT3; and three SDs: σT1, σT2, σT3). A bootstrap bias-corrected accelerated (BCa) analysis (9999 resamples) provided a 68.2% confidence interval for each measure [i.e., μ and σ; (Wichmann and Hill, 2001a,b; Hesterberg et al., 2005)]. This was chosen as it corresponds to ±1 SD when measures are normally distributed.
Permutation tests were used for the statistical analyses on the extracted parameters [μ and σ (Hesterberg et al., 2005)]. This approach was preferred to parametric testing as it uses a direct computation of the cumulative distribution of a test rather than an asymptotic approximation.
The permutation test re-samples N times the total number of observations, in a population sample, to build an empirical estimate of the null distribution from which the test statistic has been drawn (Belmonte and Yurgelun-Todd, 2001). In the case of this study, for each test (e.g., μT1 vs. μT2, σT1 vs. σT2) the null distribution was built by resampling without replacement 1000 times (N) from the two experiment matrices [80 (16 trials × 5 subjects) × 7 (stiffness test levels)] of the tested temperatures. For each repetition, a permuted experimental matrix was first created in which each row was randomly picked from one of the two original experimental matrices. Then, a cumulative Gaussian distribution was fit and the statistical parameters (μ, σ) of each permuted experimental matrix were computed.
P values were finally calculated by counting the times (M), the statistic value obtained in the original data set was smaller than the norm (two-tailed comparison) of or the statistic value itself (one-tailed comparison) obtained from the permuted data sets (null distribution), and dividing that value by the number of random permutations, i.e., M/1000. All the fits were performed using the open source library for MATLAB “psignifit”2 (Wichmann and Hill, 2001a,b). Due to the initial hypothesis assuming that SD decreases with increasing temperature, a one-tailed permutation test was used when investigating the difference among SDs at different temperatures. Because of the absence of any prediction for possible temperature-related changes in the PSE, a two-tailed comparison was used in these cases. Significant effects were reported for P < 0.05.
Results
The hypothesis that warming the mechanoreceptors at the fingertip would increase stiffness precision entails that σ should decrease (increased precision) with increasing temperature (15, 25 or 40°C). As predicted, the data shows a progressive decrease of σ with increasing temperature:
Crucially, σT3 was significantly smaller than σT1 [(one tailed permutation test; P < 0.02; (difference = 14.3 N/m, 22.3% change)]. However, neither the difference between σT1 and σT2 or σT2 and σT3 reached significance (P > 0.05, see Figure 7).
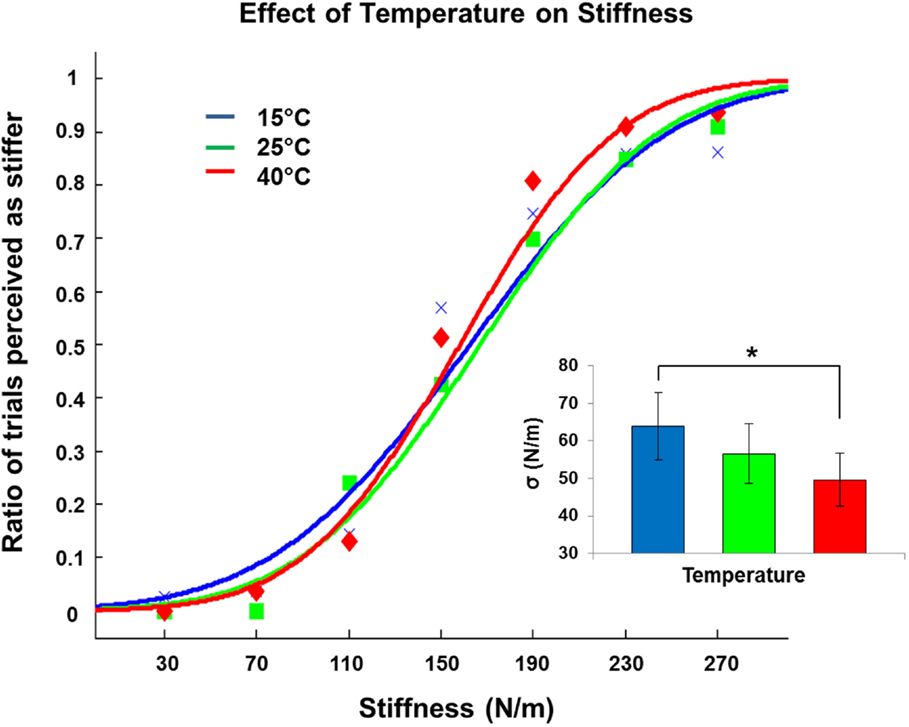
Figure 7. Effect of temperature on stiffness perception. The psychometric curve for each of the three temperatures is shown. To obtain these curves, participants judged the relative stiffness of two successive virtual surfaces (the standard of 150 N/m and the test) at each given temperature (15, 25, or 40°C) in a two-alternative forced-choice task. The curves are obtained by plotting the percentage of trials perceived as stiffer than the reference stiffness against the seven stiffness combinations, for each given temperature. The inset shows the σ for each curve. Note that the σ during warmest temperature was significantly smaller (higher precision, steeper psychometric curve) than the condition with coldest temperature stimulation. Error bars indicate 68.2% non-parametric confidence intervals.
The PSE (mean of the different fit cumulative Gaussian) was not affected by temperature (P > 0.05): μT1 = 162.2 N/m (CI [N/m]: 157.4, 170.2), μT2 = 165.9 N/m (CI [N/m]: 162.2, 169.8), μT3 = 157.8 N/m (CI [N/m]: 153.7, 161.1). As mentioned in the method section for experiment 2, we decided to pool together all the trials from different subjects to have a better fit of the psychometric function (Wichmann and Hill, 2001a). However, fittings for individual participants showed a very similar pattern of results, with all subjects having a larger σ for T1 than T3. The decrease of the σ from T1 to T3 was of 14.6 N/m (25%) for subject 1, 0.7 N/m (1%) for subject 2, 36.4 N/m (38%) for subject 3, 10.0 N/m (17%) for subject 4, and 9.7 N/m (18%) for subject 5.
Discussion and Conclusion
The present study introduces a new high-spatial resolution finger-sized thermal display. The performance of the thermal device was assessed by means of new metrics accounting for both accuracy and repeatability. In the psychophysical evaluation, we first show that our device can render a perceivable temperature gradient (two different temperatures) at the level of the fingertip (experiment 1: thermally encoded information), thus extending the concept of temperature feedback as vector of information to fingertip-sized thermal displays. Second, we show that our display can be used to manipulate stiffness judgments through thermal feedback (experiment 2: crossmodal stimulation).
Device Performance
The finger-sized thermal display presented here can produce four independent in-line thermal stimuli under the fingertip within 18 mm of length. Thanks to its small size, the thermal display can be integrated on a commercial force feedback device, thus providing multimodal feedback. The PEs are current controlled, which grants a better dynamic response, stability, and repeatability compared to voltage-controlled PEs (as in our previous study; Gallo et al., 2012). The system response error is below 0.5°C with finger contact (<0.15°C without finger). The fall and rise times (which give an estimate of the dynamic performance of the device) calculated for several steps are unaffected by finger contact and the low SD shows a good repeatability. These time constants are measured between 10 and 90% of the desired step; however, the initial transient response accounts for most of the thermal sensation (Yamamoto et al., 2004) needed to discriminate materials. To assess whether the transient response is repeatable, we calculated the mean and SD of the system cooling response to a step going from 32 to 24°C derived from multiple measures. The maximum SDs, 0.42°C with finger and 0.47°C without finger, are within 6% of the step value, which confirms the repeatability of the system. Finally, the display was shown to drop the finger temperature faster than any material in our environment, which confirms its usability also for thermal discrimination tasks.
Thermal Feedback to Convey Encoded Information at the Fingertip
In experiment 1, the possibility to convey encoded information using thermal feedback was tested. This feature of thermal feedback has been recently introduced (Wilson et al., 2013) and could allow the usage of thermal cues as detectable/alert signals in environment in which audio or vibrotactile cues might be masked by noise or movements. If each PE can provide n distinguishable temperature levels, then the thermal display featuring four PEs can potentially provide n4 levels of information. However, the poor spatial resolution of the skin (Jones and Ho, 2008) is known to be a limiting factor in the perception of several thermal stimuli on a small skin surface. For this reason, the just noticeable difference was only investigated between two thermal stimuli applied on the fingertip, but for four different spatial configurations.
Results showed that a constant thermal gradient can be perceived under the fingertip for a minimal temperature difference of 13.0°C. Although our data provide no evidence for a dependency of the thermal gradient on the four tested configurations, all subjects were able to perceive a thermal gradient (two distinct temperatures) at the level of the fingertip. This finding is novel as previous research reported no capability to discriminate two different, adjacent, materials through thermal stimulation only (Yang et al., 2009). The divergence between the results might be due to the difference of the thermal stimulations. Indeed, Yang and colleagues simulated real objects, thus the two areas of the finger are cooled down at different rates. Conversely, in this study one area of the fingertip is warmed while the other is cooled down to predefined temperatures, thus the two temperatures change in opposite directions. In addition, the thermal stimuli in this study are presented along the finger while Yang and colleagues presented them transversally. In any case, our results are not conclusive and thereby further research is needed to understand the spatial modulation of thermal gradient perception. The capability to detect temperature differences between two adjacent stimulation sites suggests that compact displays (down to 10 mm × 10 mm stimulation area, i.e., the smallest tested distance in this experiment) could be used to convey up to three levels of thermally encoded information (warm, cool or different) under the fingertip. The proposed design can be easily adapted to provide two thermal stimulations with a very small heatsink facilitating integration and wearability. This design however, suffers from drawbacks including high-power consumption of the PEs requiring a water-cooling system involving additional components such as a pump, a tank and a larger battery, thus decreasing wearability. On the other hand, providing thermally encoded information requires considerably less PE cooling power than simulating the contact with objects. Hence, for this application, low power PEs can be used and their excessive heat can be controlled using a compact air-cooling system, thus enabling the use of highly portable, multi-channel thermal displays to present encoded information on the user’s skin.
Crossmodal Aspects of Thermal Feedback: Effect of Temperature on Stiffness Judgments
In experiment 2, we showed that increasing temperature increased the precision of stiffness judgments. Indeed, perceptual precision was 22.3% greater for the highest (40°C) than lowest (15°C) temperature tested.
For soft objects, tactile cues were found to be both necessary and sufficient to discriminate between different compliances, while for hard surfaces both tactile and kinesthetic cues were found to be necessary (Srinivasan and LaMotte, 1995). Tactile surface deformation cues were estimated to account for 90% of the information used to perceive compliance while force/displacement cues accounted for the remaining 10% (Bergmann Tiest and Kappers, 2009). These findings highlight the predominance of tactile cues (over kinesthetic cues), more specifically surface deformation cues, for both the perception of hard and soft surfaces. Since the reported effect was found by using a hard surface while applying the thermal stimulation at the fingertip (thus affecting only the perception of tactile cues), we assume that the same or stronger effect will be present for soft surface objects in which compliance can be identified using tactile cues alone.
Possible Physiological Mechanisms
Several electrophysiological studies speak against a role of SAII and FAII in the coding of pressure distribution on the fingertip (Bolanowski and Verrillo, 1982; Kunesch et al., 1987; Harazin and Harazin-Lechowska, 2007), which – as mentioned above – has been argued to be the crucial component accounting for stiffness detection. Thus, the involvement of both receptors in this study is unlikely.
On the contrary, rate of change of pressure distribution and force are likely coded by SAIs and/or FAIs on the finger pad (Bergmann Tiest and Kappers, 2009); and both receptors have been shown to be influenced by temperature changes. Psychophysical studies based on vibration perception thresholds (VPT) have reported that the SAIs response to mechanical indentation is reduced in response to cooling (Kunesch et al., 1987). SAIs were also found to respond to cold gradients (Hensel and Zotterman, 1951; Duclaux and Kenshalo, 1972; Cahusac and Noyce, 2007) and warm gradients (Cahusac and Noyce, 2007) without a mechanical stimulation. This response appears as an increase of spontaneous firing for both cold and warm gradients. These spontaneous responses could suggest that SAI are not responsible for the studied effect. However, warm gradients generate significantly larger spontaneous responses than cold gradients, with firing rates similar to the response evoked by mechanical stimuli (Cahusac and Noyce, 2007). In addition, the evoked response of SAI is reduced by cooling (Lowrey et al., 2013) and increased by heating of the skin (Cahusac and Noyce, 2007). Recent neurophysiological studies in humans have reported a reduction of the mechanically evoked response of FAI receptors resulting from the cooling of the subjects’ skin (Lowrey et al., 2013). Altogether, these findings suggest that the hereby reported increase in stiffness precision due to warming of the skin is likely to be caused by the increase in sensitivity to static pressure and skin curvature during indentation of the SAIs and/or FAIs.
Finally, we note that, although our data show the possibility to use our device to provide thermal feedback to influence stiffness perception, more studies are needed to assess the robustness of our findings (e.g., using larger sample size) and to further investigate the perceptual mechanisms that connect temperature and stiffness perception.
Applications
Our results show that two crucial but often neglected features of thermal feedback – conveying encoded information and influencing tactile processing – can be provided by a fingertip-sized thermal display.
With wearable technology quickly expanding, the usage of a finger-worn thermal display has potential, especially as an alternative to vibrotactile feedback. In fact, thermal feedback can provide a greater amount of information per actuator compared to vibrotactile feedback. Moreover, while providing useful information, vibrotactile feedback also has a negative impact as it can generate undesired proprioceptive cues (illusion of skin being stretched) and can induce non-volitional movements (Lee et al., 2012) going against its original assistive purpose. In this case, a thermal feedback could be a better solution as it provides a sensible feedback without the undesired side effects of vibrotactile stimulation.
The reported effect of temperature on stiffness judgments opens up new scenarios in which thermal feedback could be used to influence stiffness perception precision (crossmodal feedback). We propose that crossmodal effects should be taken into account, or even exploited, when designing multimodal haptic displays.
Conflict of Interest Statement
The authors declare that the research was conducted in the absence of any commercial or financial relationships that could be construed as a potential conflict of interest.
Acknowledgments
The authors wish to thank Bernard Martin and Roger Gassert for their proofreading and advice. This work was supported by a grant from the Swiss National Science Foundation (NCCR Robotics, Grant: 51AU40_125773).
Footnotes
References
Belmonte, M., and Yurgelun-Todd, D. (2001). Permutation testing made practical for functional magnetic resonance image analysis. IEEE Trans. Med. Imaging 20, 243–248. doi:10.1109/42.918475
Bergamasco, M., and Alessi, A. (1997). Thermal feedback in virtual environments. Presence 6, 617–629.
Bergmann Tiest, W. M., and Kappers, A. M. L. (2009). Cues for haptic perception of compliance. IEEE Trans. Haptics 2, 189–199. doi:10.1109/TOH.2009.16
Bolanowski, S., and Verrillo, R. (1982). Temperature and criterion effects in a somatosensory subsystem: a neurophysiological and psychophysical study. J. Neurophysiol. 48, 836–855.
Cahusac, P. M. B., and Noyce, R. (2007). A pharmacological study of slowly adapting mechanoreceptors responsive to cold thermal stimulation. Neuroscience 148, 489–500. doi:10.1016/j.neuroscience.2007.06.018
Duclaux, R., and Kenshalo, D. R. (1972). The temperature sensitivity of the type I slowly adapting mechanoreceptors in cats and monkeys. J. Physiol. 224, 647–664. doi:10.1113/jphysiol.1972.sp009917
Ernst, M. O., and Banks, M. S. (2002). Humans integrate visual and haptic information in a statistically optimal fashion. Nature 415, 429–433. doi:10.1038/415429a
Ernst, M. O., and Bülthoff, H. H. (2004). Merging the senses into a robust percept. Trends Cogn. Sci. 8, 162–169. doi:10.1016/j.tics.2004.02.002
Filingeri, D., Fournet, D., Hodder, S., and Havenith, G. (2014). Why wet feels wet? A neurophysiological model of human cutaneous wetness sensitivity. J. Neurophysiol. 112, 1457–1469. doi:10.1152/jn.00120.2014
Filingeri, D., Redortier, B., Hodder, S., and Havenith, G. (2013). The role of decreasing contact temperatures and skin cooling in the perception of skin wetness. Neurosci. Lett. 551, 65–69. doi:10.1016/j.neulet.2013.07.015
Filingeri, D., Redortier, B., Hodder, S., and Havenith, G. (2015). Warm temperature stimulus suppresses the perception of skin wetness during initial contact with a wet surface. Skin Res. Technol. 21, 9–14. doi:10.1111/srt.12148
Gallo, S., Santos-Carreras, L., Rognini, G., Hara, M., Yamamoto, A., and Higuchi, T. (2012). “Towards multimodal haptics for teleoperation: design of a tactile thermal display,” in Proc. 12th IEEE International Workshop on Advanced Motion Control (AMC) (Sarajevo: IEEE), 1–5.
Grassi, M., and Soranzo, A. (2009). MLP: A MATLAB toolbox for rapid and reliable auditory threshold estimation. Behav. Res. Methods 41, 20–28. doi:10.3758/BRM.41.1.20
Green, B. G., Lederman, S. J., and Stevens, J. C. (1979). The effect of skin temperature on the perception of roughness. Sens. Processes 3, 327–333.
Guiatni, M., Benallegue, A., and Kheddar, A. (2008). “Learning-based thermal rendering in telepresence,” in Haptics: Perception, Devices and Scenarios ed Ferre, M. (Madrid: Springer), 820–825.
Gwilliam, J. C., Degirmenci, A., Bianchi, M., and Okamura, A. M. (2012). “Design and control of an air-jet lump display,” in Proc. IEEE Haptics Symposium (IEEE) (Vancouver: IEEE), 45–49.
Harazin, B., and Harazin-Lechowska, A. (2007). Effect of changes in finger skin temperature on vibrotactile perception threshold. Int. J. Occup. Med. Environ. Health 20, 223–227. doi:10.2478/v10001-007-0027-z
Hensel, H., and Zotterman, Y. (1951). The response of mechanoreceptors to thermal stimulation. J. Physiol. 115, 16–24. doi:10.1113/jphysiol.1951.sp004649
Hesterberg, T., Moore, D. S., Monaghan, S., Clipson, A., and Epstein, R. (2005). Bootstrap methods and permutation tests, 2nd Edn, New York: W. H. Freeman and Company.
Hillis, J. M., Ernst, M. O., Banks, M. S., and Landy, M. S. (2002). Combining sensory information: mandatory fusion within, but not between, senses. Science 298, 1627–1630. doi:10.1126/science.1075396
Ho, H.-N., and Jones, L. A. (2007). Development and evaluation of a thermal display for material identification and discrimination. ACM Trans. Appl. Percept. 4, 13. doi:10.1145/1265957.1265962
Ho, H.-N., and Jones, L. A. (2008). Modeling the thermal responses of the skin surface during hand-object interactions. J. Biomech. Eng. 130, 021005. doi:10.1115/1.2899574
Ino, S., Shimizu, S., Odagawa, T., Sato, M., Takahashi, M., Izumi, T., et al. (1993). “A tactile display for presenting quality of materials by changing the temperature of skin surface,” in Proc. 2nd IEEE International Workshop on Robot and Human Communication (IEEE) (Tokyo: IEEE), 220–224.
Jones, L. A., and Ho, H.-N. (2008). Warm or cool, large or small? The challenge of thermal displays. IEEE Trans. Haptics 1, 53–70. doi:10.1109/TOH.2008.2
Kammermeier, P., Kron, A., Hoogen, J., and Schmidt, G. (2004). Display of holistic haptic sensations by combined tactile and kinesthetic feedback. Presence 13, 1–15. doi:10.1162/105474604774048199
Kenshalo, D. R., Decker, T., and Hamilton, A. (1967). Spatial summation on the forehead, forearm, and back produced by radiant and conducted heat. J. Comp. Physiol. Psychol. 63, 510. doi:10.1037/h0024610
Kim, K., Colgate, J. E., Santos-Munné, J. J., Makhlin, A., and Peshkin, M. A. (2010). On the design of miniature haptic devices for upper extremity prosthetics. IEEE/ASME Trans. Mechatron. 15, 27–39. doi:10.1109/TMECH.2009.2013944
Kunesch, E., Schmidt, R., Nordin, M., Wallin, U., and Hagbarth, K. (1987). Peripheral neural correlates of cutaneous anaesthesia induced by skin cooling in man. Acta Physiol. Scand. 129, 247–257. doi:10.1111/j.1748-1716.1987.tb08065.x
Lawrence, D., and Chapel, J. D. (1994). “Performance trade-offs for hand controller design,” in Proc. IEEE International Conference on Robotics and Automation (IEEE) (San Diego: IEEE), 3211–3216.
Lee, B.-C., Martin, B. J., and Sienko, K. H. (2012). Directional postural responses induced by vibrotactile stimulations applied to the torso. Exp. Brain Res. 222, 471–482. doi:10.1007/s00221-012-3233-2
Levitt, H. (1971). Transformed up-down methods in psychoacoustics. J. Acoust. Soc. Am. 49, 467–477. doi:10.1121/1.1912375
Lowrey, C. R., Strzalkowski, N. D., and Bent, L. R. (2013). Cooling reduces the cutaneous afferent firing response to vibratory stimuli in glabrous skin of the human foot sole. J. Neurophysiol. 109, 839–850. doi:10.1152/jn.00381.2012
MacLean, K. E., and Roderick, J. B. (1999). “Smart tangible displays in the everyday world: a haptic door knob,” in Proc. IEEE/ASME International Conference on Advanced Intelligent Mechatronics (IEEE) (Atlanta: IEEE), 203–208.
Markand, O. N., Warren, C., Mallik, G. S., King, R. D., Brown, J. W., and Mahomed, Y. (1990). Effects of hypothermia on short latency somatosensory evoked potentials in humans. Electroencephalogr. Clin. Neurophysiol. 77, 416–424. doi:10.1016/0168-5597(90)90002-U
McMahan, W., Gewirtz, J., Standish, D., Martin, P., Kunkel, J. A., Lilavois, M., et al. (2011). Tool contact acceleration feedback for telerobotic surgery. IEEE Trans. Haptics 4, 210–220. doi:10.1109/TOH.2011.31
Ottermo, M. V., Stavdahl, Ø, and Johansen, T. A. (2008). Design and performance of a prototype tactile shape display for minimally invasive surgery. Haptics-e, 4.
Phillips, J. R., and Matthews, P. B. (1993). Texture perception and afferent coding distorted by cooling the human ulnar nerve. J. Neurosci. 13, 2332–2341.
Russ, W., Sticher, J., Scheld, H., and Hempelmann, G. (1987). Effects of hypothermia on somatosensory evoked responses in man. Br. J. Anaesth. 59, 1484–1491. doi:10.1093/bja/59.12.1484
Srinivasan, M., and LaMotte, R. (1995). Tactual discrimination of softness. J. Neurophysiol. 73, 88–101.
Stevens, J. C. (1982). Temperature can sharpen tactile acuity. Percept. Psychophys. 31, 577–580. doi:10.3758/BF03204192
Stevens, J. C. (1989). Temperature and the two-point threshold. Somatosens. Mot. Res. 6, 275–284. doi:10.3109/08990228909144677
Stevens, J. C., and Green, B. G. (1978). Temperature–touch interaction: Weber’s phenomenon revisited. Sens. Processes 2, 206–209.
Stevens, J. C., and Hooper, J. E. (1982). How skin and object temperature influence touch sensation. Percept. Psychophys. 32, 282–285. doi:10.3758/BF03206232
Tiest, W. M. B., and Kappers, A. M. (2008). Thermosensory reversal effect quantified. Acta Psychol. 127, 46–50. doi:10.1016/j.actpsy.2006.12.006
Tiest, W. M. B., and Kappers, A. M. (2009). Tactile perception of thermal diffusivity. Atten. Percept. Psychophys. 71, 481–489. doi:10.3758/APP.71.3.481
Verrillo, R. T., and Bolanowski, S. J. Jr. (1986). The effects of skin temperature on the psychophysical responses to vibration on glabrous and hairy skin. J. Acoust. Soc. Am. 80, 528. doi:10.1121/1.394047
Wetherill, G. B., and Levitt, H. (1965). Sequential estimation of points on a psychometric function. Br. J. Math. Stat. Psychol. 18, 1–10. doi:10.1111/j.2044-8317.1965.tb00689.x
Wichmann, F. A., and Hill, N. J. (2001a). The psychometric function: I. Fitting, sampling, and goodness of fit. Percept. Psychophys. 63, 1293–1313. doi:10.3758/BF03194544
Wichmann, F. A., and Hill, N. J. (2001b). The psychometric function: II. Bootstrap-based confidence intervals and sampling. Percept. Psychophys. 63, 1314–1329. doi:10.3758/BF03194545
Wilson, G., Brewster, S., Halvey, M., and Hughes, S. (2013). “Thermal feedback identification in a mobile environment,” in Proc. 8th International Workshop on Haptic and Audio Interaction Design (HAID) (Daejeon: Springer Berlin Heidelberg), Vol. 7989, 10–19.
Yamamoto, A., Cros, B., Hashimoto, H., and Higuchi, T. (2004). “Control of thermal tactile display based on prediction of contact temperature,” in Proc. IEEE International Conference on Robotics and Automation (IEEE) (New Orleans: IEEE), 1536–1541.
Yang, G.-H., Kwon, D.-S., and Jones, L. A. (2009). Spatial acuity and summation on the hand: The role of thermal cues in material discrimination. Percept. Psychophys. 71, 156–163. doi:10.3758/APP.71.1.156
Yang, G.-H., Yang, T.-H., Kim, S.-C., Kwon, D.-S., and Kang, S.-C. (2007). “Compact tactile display for fingertips with multiple vibrotactile actuator and thermoelectric module,” in Proc. IEEE International Conference on Robotics and Automation (IEEE) (Roma: IEEE), 491–496.
Keywords: multimodal haptics, stiffness perception, thermal feedback, tele-manipulation, human–machine interaction
Citation: Gallo S, Rognini G, Santos-Carreras L, Vouga T, Blanke O and Bleuler H (2015) Encoded and crossmodal thermal stimulation through a fingertip-sized haptic display. Front. Robot. AI 2:25. doi: 10.3389/frobt.2015.00025
Received: 27 July 2015; Accepted: 12 October 2015;
Published: 27 October 2015
Edited by:
Rob Lindeman, Worcester Polytechnic Institute, USAReviewed by:
Ryan Patrick McMahan, University of Texas at Dallas, USAGustavo A. Patow, Universitat de Girona, Spain
Copyright: © 2015 Gallo, Rognini, Santos-Carreras, Vouga, Blanke and Bleuler. This is an open-access article distributed under the terms of the Creative Commons Attribution License (CC BY). The use, distribution or reproduction in other forums is permitted, provided the original author(s) or licensor are credited and that the original publication in this journal is cited, in accordance with accepted academic practice. No use, distribution or reproduction is permitted which does not comply with these terms.
*Correspondence: Simon Gallo, simon.gallo@epfl.ch;
Giulio Rognini, giulio.rognini@epfl.ch
†Simon Gallo and Giulio Rognini have contributed equally to this work.